Article

Solar Fecal Coliform Disinfection in a Wastewater Treatment Plant by Oxidation Processes: Kinetic Analysis as a Function of Solar Radiation

by
Cynthia M. Núñez-Núñez
1,
Guillermo I. Osorio-Revilla
2,
Ignacio Villanueva-Fierro
1,
Christian Antileo
3 and
José B. Proal-Nájera
1,*
1
Instituto Politécnico Nacional, CIIDIR-Unidad Durango. Calle Sigma 119. Fracc. 20 de Noviembre II, Durango, Dgo., C.P. 34220, Mexico
2
Instituto Politécnico Nacional, ENCB. Av. Wilfrido Massieu S/N, Unidad Profesional Adolfo López Mateos, Zacatenco, Ciudad de Mexico C.P. 07738, Mexico
3
Universidad de La Frontera, Departamento de Ingeniería Química. Av. Francisco Salazar 01145, Temuco, Chile
*
Author to whom correspondence should be addressed.
Water 2020, 12(3), 639; https://doi.org/10.3390/w12030639
Submission received: 30 December 2019 / Revised: 18 February 2020 / Accepted: 25 February 2020 / Published: 27 February 2020
(This article belongs to the Section Wastewater Treatment and Reuse)

Abstract

:
The final step in the treatment of municipal wastewater is disinfection, which is required to inactivate microorganisms that have survived after treatment. Chlorine and chloramines are widely used disinfectants in wastewater treatment plants (WWTP); however, the use of chlorine as a disinfectant presents several problems. In the present research, solar disinfection and photocatalytic disinfection processes have been applied to inactivate the fecal coliform microorganisms that are present in municipal wastewater treated by activated sludge in a WWTP. A 2 × 3 × 2 factorial design was applied. The first factor was the process: solar disinfection or photocatalysis; the second was initial pH: 5, 7.5 and 9; the third was the presence or absence of a H2O2 dose of 1 mMol added at the beginning of the process. The data from experimentation were compared to predictions from different inactivation kinetic models (linear, linear + shoulder, linear + tail, Weibull and biphasic). The results show that H2O2 addition plays an important role in the process and that disinfection does not always follow a linear reaction model. When related to radiation, it becomes clear that the accumulated radiation dose, rather than the time, should be considered the most important factor in the solar disinfection process.

1. Introduction

In a wastewater treatment plant (WWTP), through the different processes that are part of the treatment of municipal wastewater (MWW), microorganisms are removed; in addition, pathogens die in significant amounts. The final step in the treatment of MWW is disinfection, which is required to kill bacteria and enteropathogenic viruses that have survived after treatment [1,2]. Chlorine and chloramines are widely used disinfectants in WWTP and drinking water distribution systems due to their effectiveness, price and residual activity for prolonged time periods [3,4]. However, the use of chlorine as a disinfectant presents several problems, such as its high toxicity in aquatic organisms; it is also highly corrosive and toxic and, in the presence of organic matter remaining in the effluent, it generates dangerous organochlorine compounds—trihalomethanes (THMs), for example, have been associated with bladder, colon, stomach and rectum cancer risks [5]. In addition, chlorination is a high-cost process and the residual chlorine present in the effluent is unstable in the presence of high concentrations of materials with chlorine demand [6,7,8,9,10]. According to Hrudey [11], around 600 chemical compounds resulting from chlorination (chlorination byproducts), can be found in drinking water. The formation of disinfection byproducts in drinking water, like THMs, has evidenced the need for different treatment technologies [8]. Solar water disinfection (SODIS) and photocatalysis play a part in such technologies.
Normally, SODIS consists of filling PET bottles with microbiologically contaminated water and exposing it to solar radiation for a few hours [12,13]. In solar disinfection processes, radiation reaching the water’s surface accounts for the germicidal action. UV-B, for example, could lead to mutations or cell death [14]; in the past, Bensasson et al. [15] studied the effect of UV-B radiation on different cell components. In SODIS treatment, UV-A is the main type of radiation responsible for bacterial inactivation [14] and damage caused by UV-A radiation to tissues has been reported in the past [16,17]. Among the downsides of SODIS is the lack of proper containers, which prevents the method’s extended use, as such containers should not filter the UV radiation to the sample [13]; additionally, the use of PET containers is controversial due to the possibility of photoproduct generation [12]. Solar disinfection processes are especially attractive in regions with a high solar radiation level [18].
Photocatalytic processes have been studied in the past for disinfection, proving to be a feasible substitution for chlorination [19]; however, it is necessary to carefully investigate and establish operative parameters for the treatment, or the costs might become too elevated. Parameters such as H2O2 addition, which is important for the formation of oxidant agents, sample pH and the amount and wavelength of the radiation employed, require specific research depending on the type of wastewater that is to be treated and its uses after treatment [20,21]. In photocatalysis, UV radiation causes the excitation of electrons in the last layer of the photocatalyst and the generation of positive gaps in the valence band of the photocatalyst, this electron/hole promotes the transfer of the charge to the surface of the semiconductor and a negative electron in the conduction band, which leads to hydroxyl radical formation [22,23,24].
There are a large number of mathematical models that try to predict the disinfection rate that can be achieved by different methods. Geeraerd et al. [25], proposed the use of GinaFit. GinaFit is an extension for Microsoft Excel that allows you to graph the data obtained from experimentation and compare it with different mathematical models proposed to explain microbial disinfection [26]. The best model for experimental data is chosen based on two adjustment parameters, R2 and the root of the mean square error (RMSE) [27,28]
In the present research, as solar disinfection took place in an open flatbed reactor instead of a container, the process has not been referred to as SODIS; by avoiding the use of containers, the risk of poor UV radiation transmittance by the material was dismissed. The objective of this work was to determine the parameters of solar disinfection and solar photocatalytic disinfection applied to MWW with a high fecal coliform content, treated previously by activated sludge in a local WWTP, using an open-to-the-atmosphere flatbed reactor. This is followed by the comparison between the experimental data and different kinetic disinfection models, relating them to the doses of UV radiation reached by the solar reactor.

2. Materials and Methods

2.1. Samples

The municipal wastewater samples used in the inactivation experiments were collected from a WWTP in Durango City, Mexico (23°58’31” N and 104°38’13” W). In this WWTP, after a series of treatments, water is chlorinated as a disinfection process, before it is poured into an irrigation ditch.
To carry out the experiments, in clean containers with a capacity of 10 L, water samples were taken after their biological treatment (activated sludge), but before chlorination. The water was taken to the laboratory and its transmittance was measured in a Perkin Elmer Lambda 25 UV/Vis Spectrometer. The sample was treated the same day it was taken; however, when the experiment was not possible, it was kept at 4 ± 1 °C.

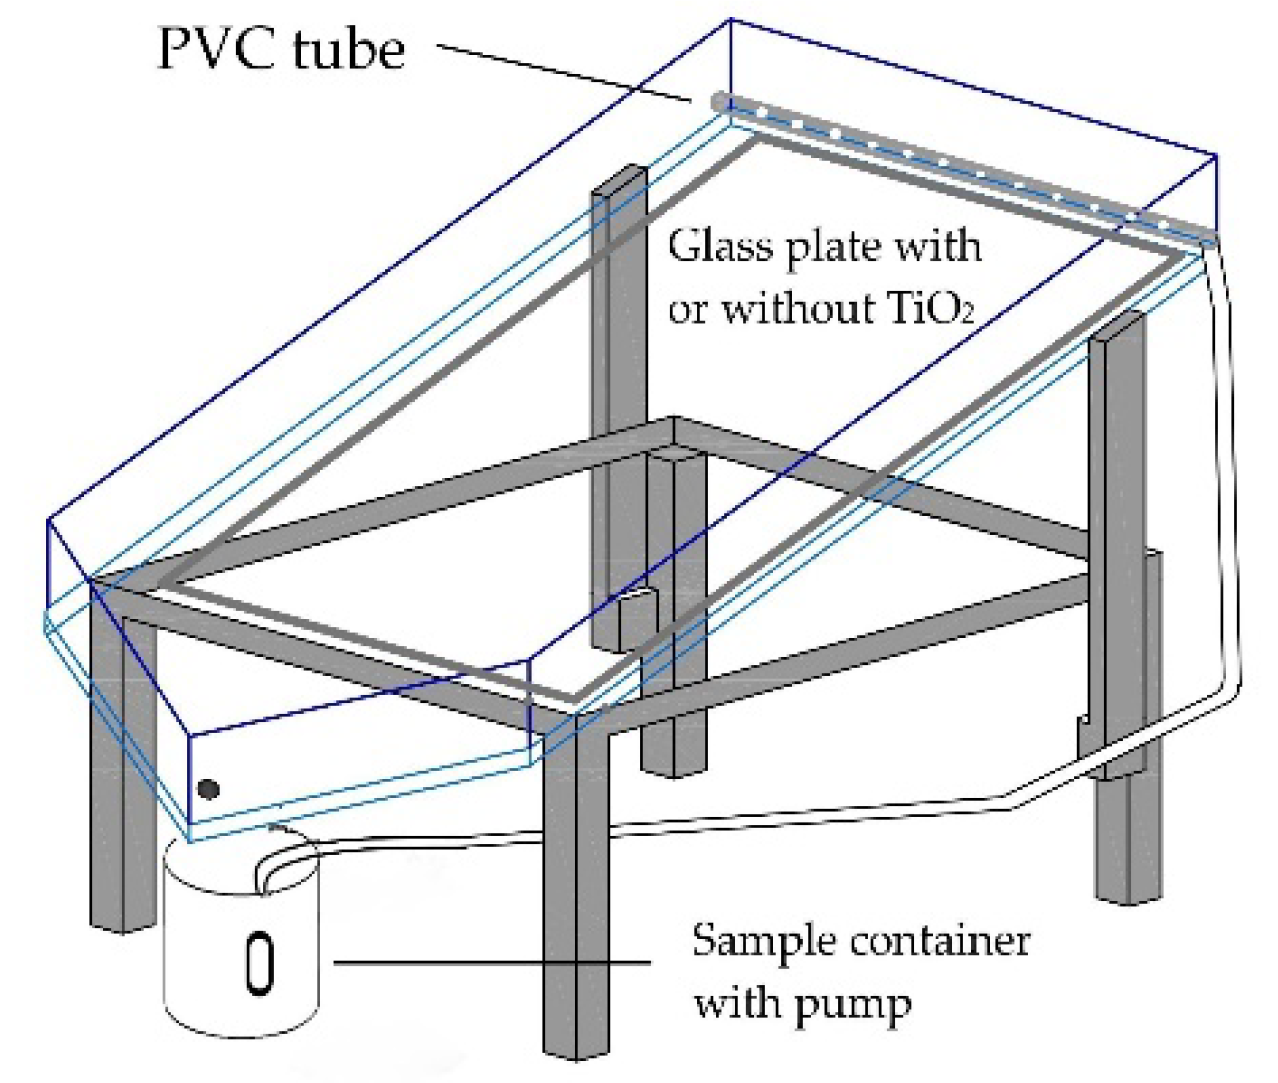
2.2. Reactor and Experiment Description

Solar disinfection experiments were carried out in a flatbed reactor, open to the atmosphere, and formed by a metal structure that supports an acrylic container; in addition, it was equipped with a PVC pipe with holes every 0.5 cm (at the top of the container) where the water flowed (Figure 1). After passing through the reactor surface, the water was recovered in a container, from where it was recirculated with the aid of a simple pump (Model H-331 BioPro, China). Inside the reactor, a frosted commercial glass plate with a surface area of 0.1 m2 (0.30 m × 0.33 m) was used as a support for the TiO2 photocatalyst (clean in the case of the UV-Vis and UV-Vis/H2O2 disinfection experiments). The reactor was placed at an inclination of 20° and an azimuthal angle of 180° (facing south).
The start times of the experiments were selected by analyzing radiation data from the year prior to conducting this research, to determine the period of the day where the greatest radiation levels are reached in the city of Durango. Sunlight was always used as an energy source. Solar radiation between the wavelengths 400 and 1100 nm was measured by the weather station of the Ministry of Natural Resources and Environment of the state of Durango (SRNyMA), using a pyranometer (Global Water, model WE300 Solar Radiation Sensor, USA).
The experimental days were selected considering good weather conditions; therefore, cloudy days were discarded (where the incidence of UV light is low), as well as windy days, since we were using an open system that was particularly susceptible to contamination.
Prior to treatment, pH, BOD5 and most probable number (MPN) of fecal coliform organisms present in the samples were measured. A volume of 2 L was treated per experiment and the volumetric flow in the reactor was 165 L/h, a parameter optimized in a previous research [29].
Three initial pH magnitudes were tested: 5, 7.5 and 9; sample pH adjustment at the beginning of the experiment was achieved with the addition of NaOH and HNO3 solutions (Sigma-Aldrich). Once the pH was adjusted to the sample, it began to recirculate in the reactor and, immediately, the necessary dose of H2O2 was added to measure the effect of this parameter (the dose of H2O2) on the disinfection results; two doses were tested: 1 and 0 mMol H2O2/L sample (with and without H2O2 addition).
UV-Vis and UV-Vis/H2O2 disinfection experiments (solar disinfection experiments) were carried out using a clean glass plate (over which the sample flowed). For the UV-Vis/TiO2 and UV-Vis/H2O2/TiO2 disinfection experiments (photocatalysis experiments), the TiO2 used as a disinfection catalyst was of the Degussa P-25 brand, composed of 80% in its anatase form and 20% in its rutile form, with a specific surface area of 50 m2/g [30,31]. The catalyst was fixed to the glass plate by preparing a solution dissolving 200 mg of TiO2 in 50 mL of water; the solution was distributed on the plate by spraying, and the plate was used after the complete evaporation of the water from the solution [32,33].
Once the recirculation of the sample in the reactor had begun and the necessary dose of H2O2 had been added for the experiment (time: 0), time was counted and aliquots were taken at 5, 10, 15, 20, 30, 45, 60 and 90 min of the reaction. The aliquots were kept refrigerated at 4°C until the end of the experiment, when they were analyzed to measure the amount of fecal coliform microorganisms using the MPN method in A-1 media [34]. Each experiment was performed in duplicate.

2.3. Experimental Design and Statistical Analysis

An experimental design of the 2 x 3 x 2 factorial type followed. The factors to consider were the type of treatment (solar disinfection and solar photocatalysis), the pH with three levels (5, 7.5 and 9) and the third factor, the added dose of H2O2, for which doses 0 and 1 mMol of H2O2/L were tested.
The data from the first 20 min of the experiment were analyzed by means of an ANOVA test, using the statistical package SAS 9.0 (SAS Institute Inc, Cary, North Carolina, USA). Response surface graphs were obtained in the Statistica 7 program (StatSoft, 1984–2004) to observe the behavior of the disinfection process regarding the pH and the dose of H2O2 values.

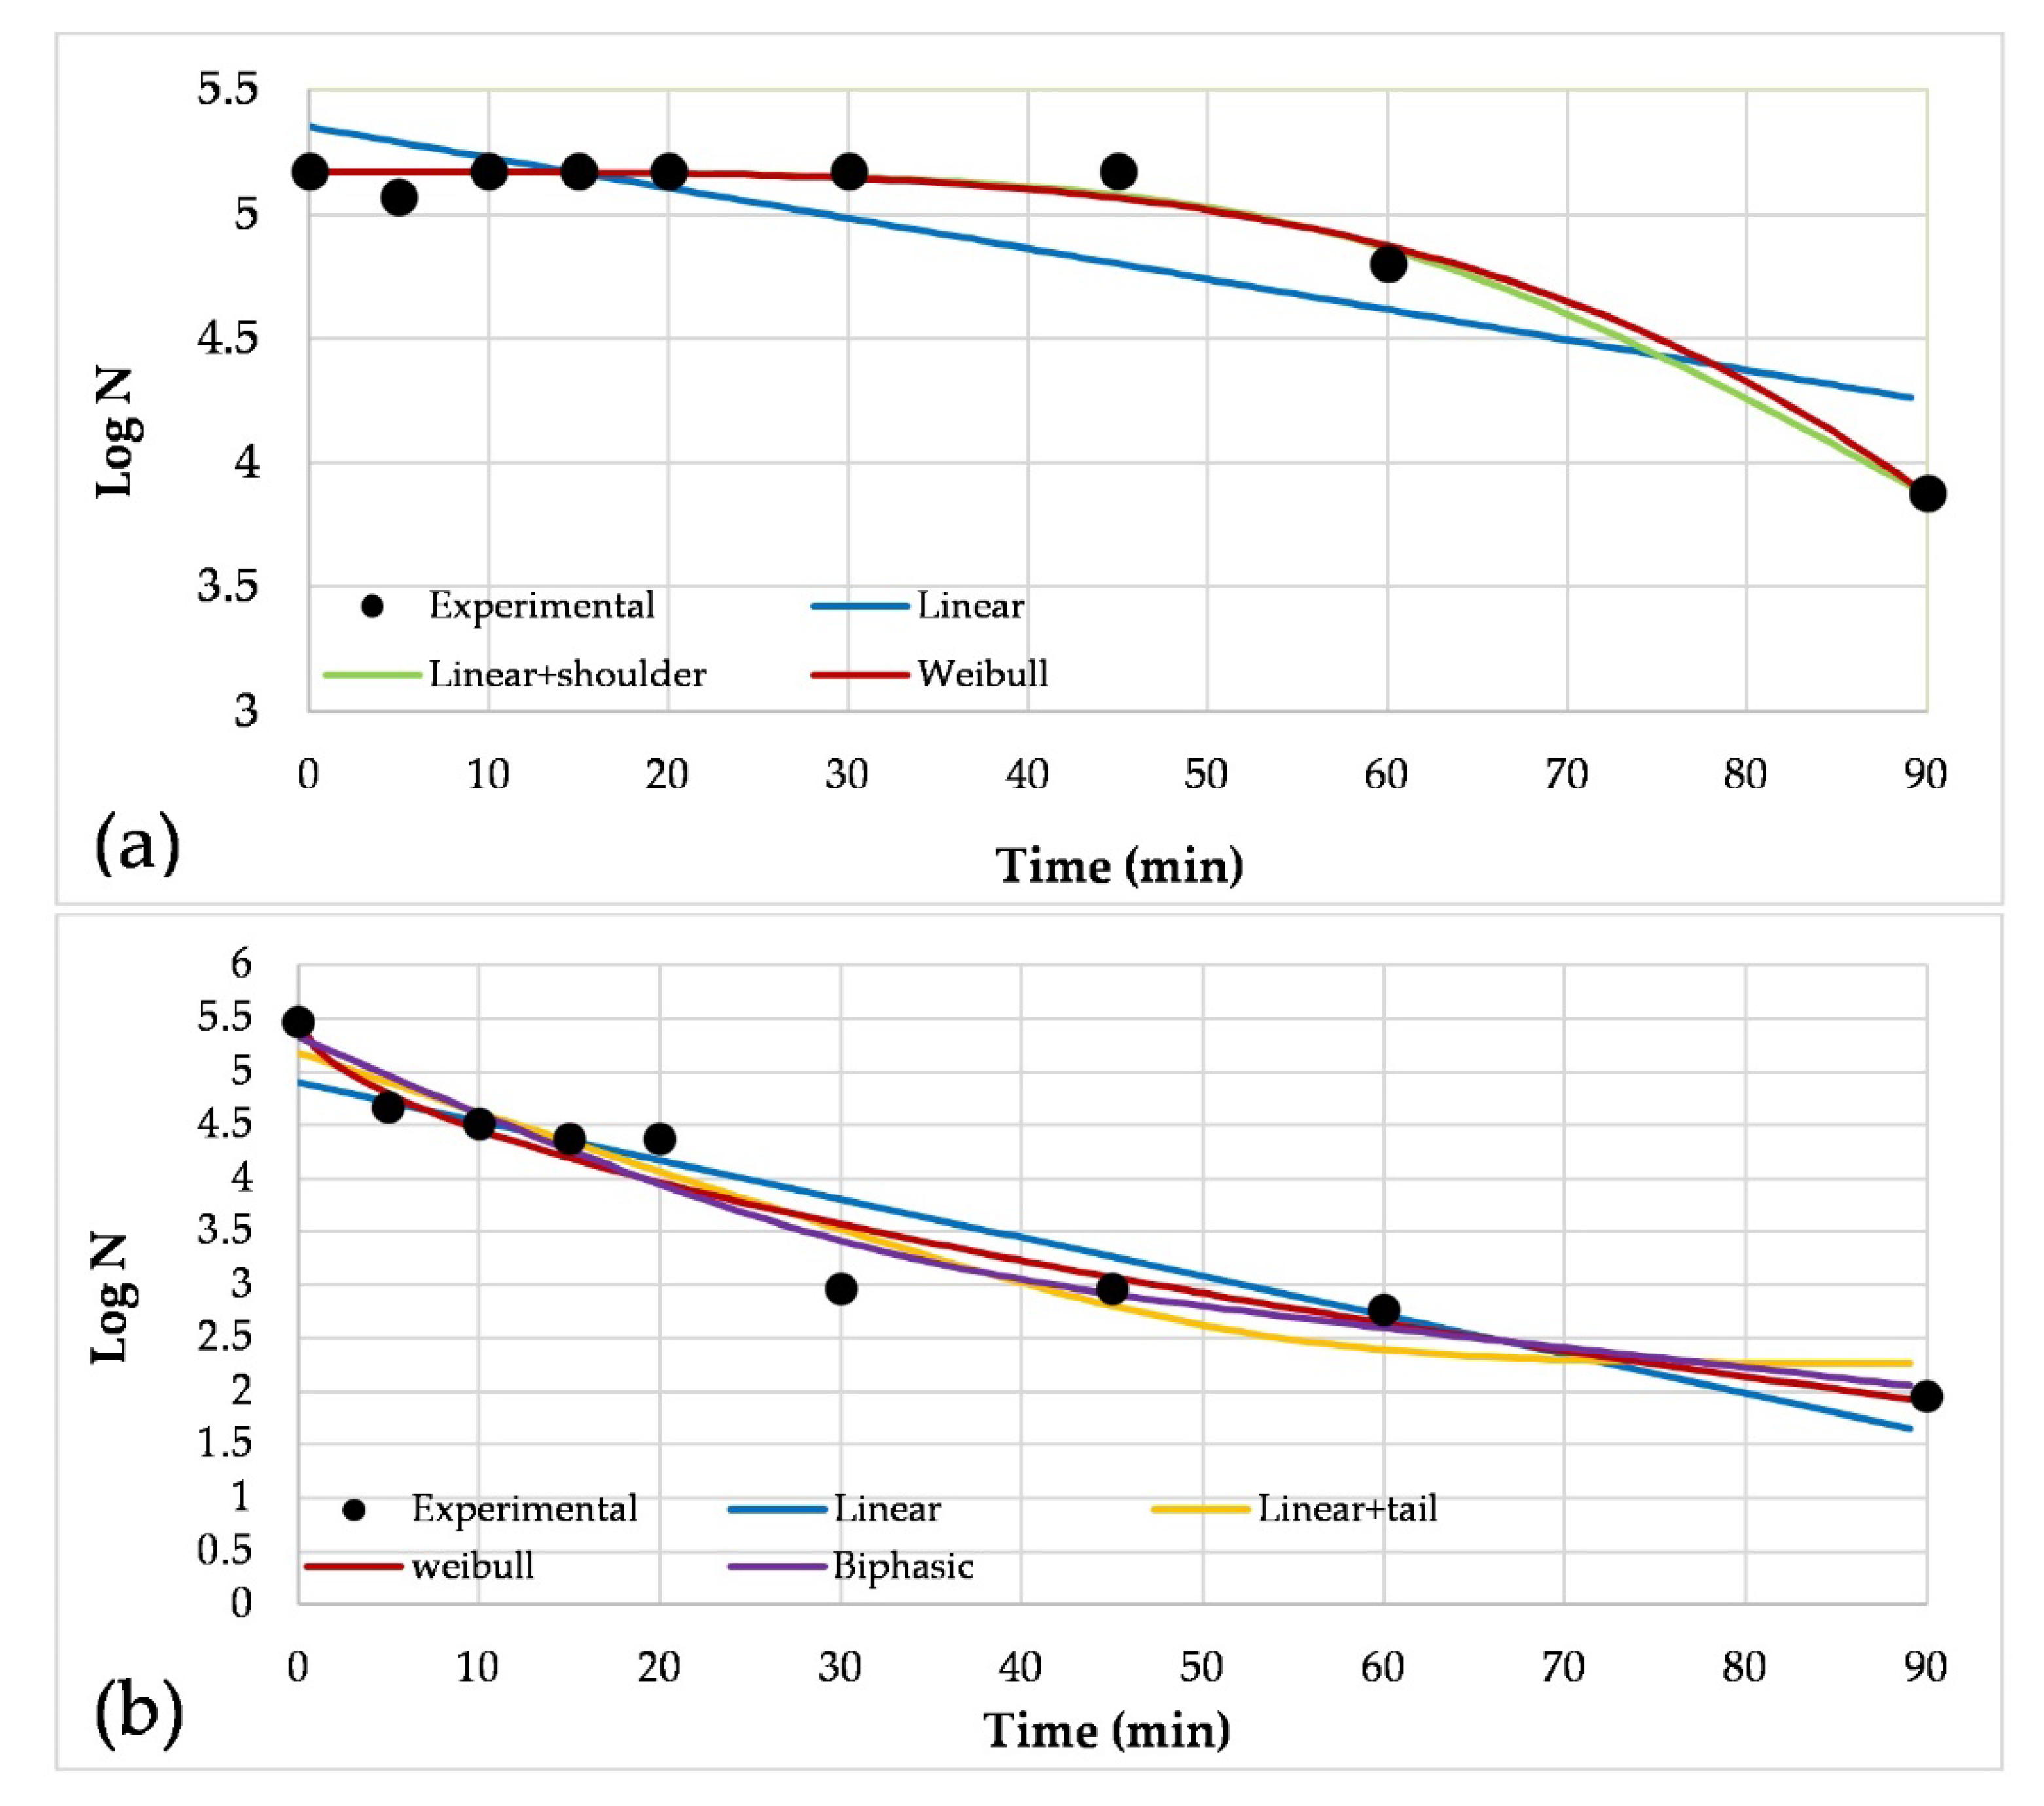
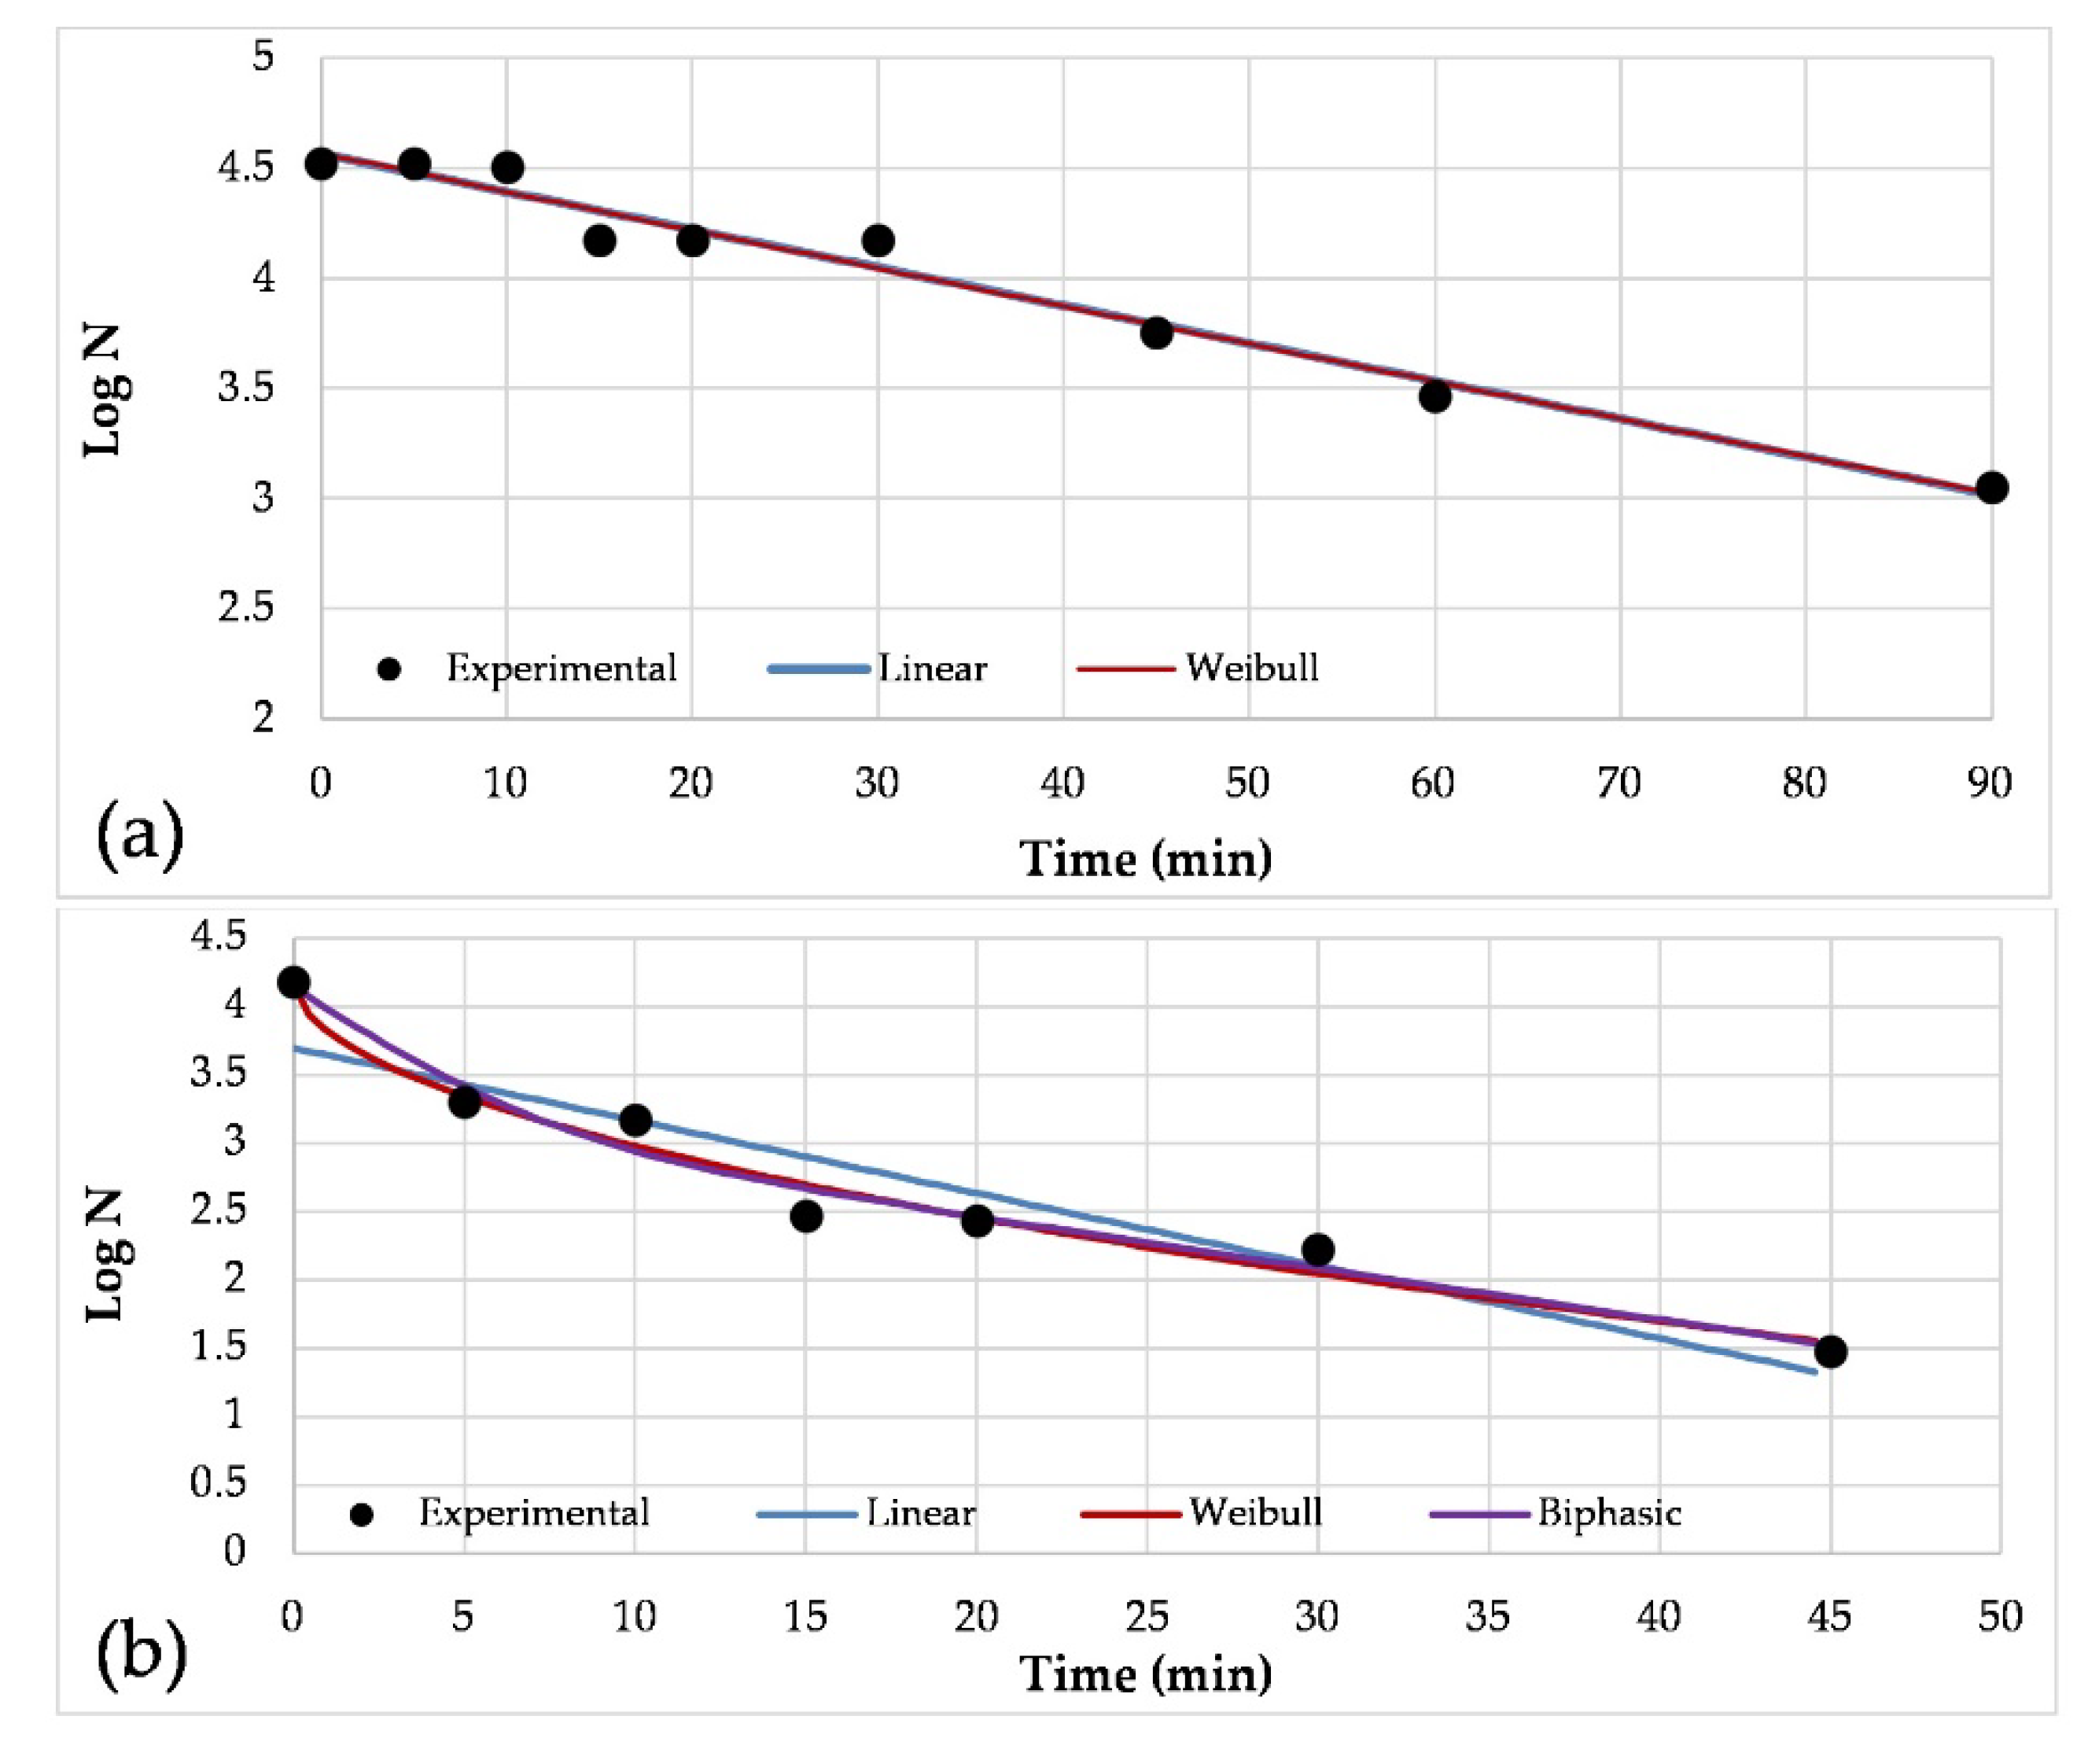
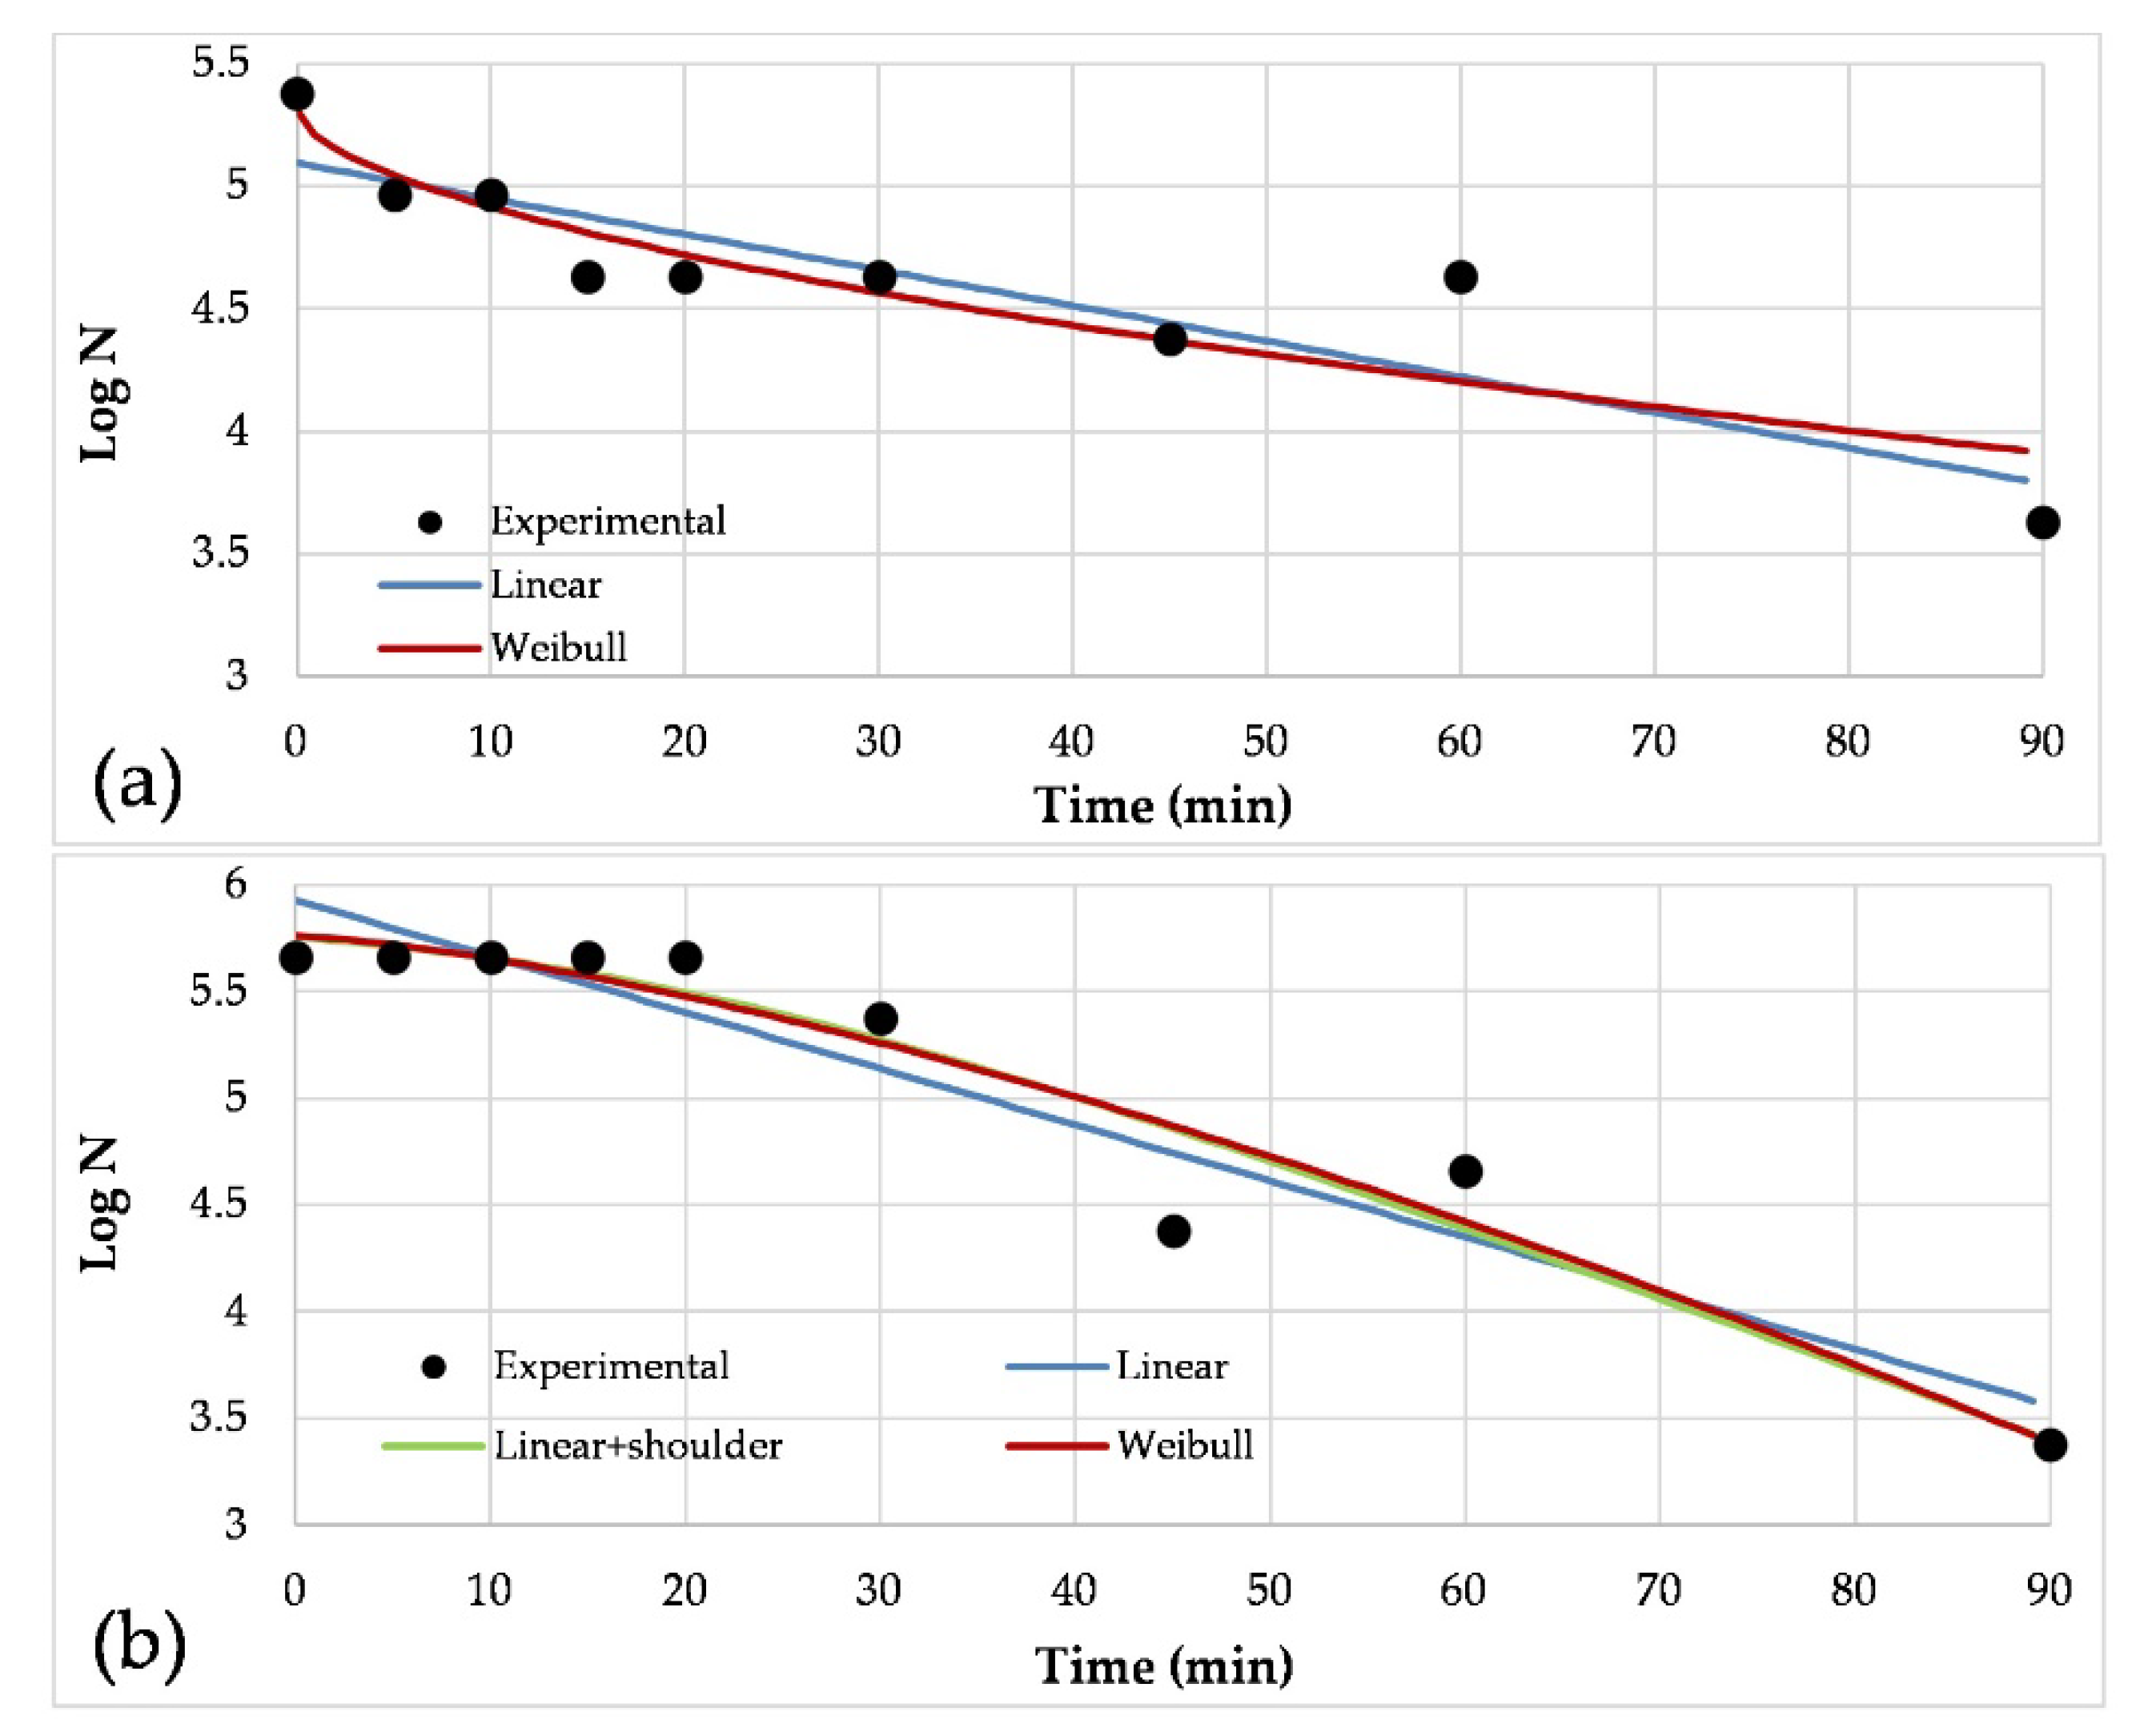
2.4. Kinetic Analysis

The determinations of the kinetic constants of inactivation in the processes were performed through the tool for Microsoft Excel model adjustment, as proposed by Geeraerd et al. [25]. The models tested were: the log–linear regression model obeying a first-order reaction (linear), the log–linear model with shoulder (linear + shoulder), log–linear with tail (linear + tail), Weibull and biphasic. The results of each experiment and its duplicate were averaged. The best model was selected based on the values of R2 and the RMSE when the values between two models were very close, the simplest model was chosen.

2.4.1. Linear Model

The linear model assumes that all microorganisms present in a sample have the same sensitivity to the disinfectant. It proposes a disinfection that follows first-order kinetics with a log–linear relationship, as represented by Equation (1) [25,26]:
N=N0 × e(−k × t)
where N0 and N represent the amount of viable microorganisms at the beginning of the process and after some time, t is the disinfection time and k represents the inactivation constant in a first order reaction.

2.4.2. Linear + Shoulder and Linear + Tail Models

The linear + shoulder model is composed of two parts, the first corresponds to the linear model of first-order kinetics and the second describes a "shoulder" effect based on the hypothesis of the existence of protective components around the cells, the length of the shoulder (Sl) represents the time required to overcome these components [25,35]. The model is represented by Equation (2):
N= N0 × e(−k × t) × [e(kmax × Sl)/(1+(e(kmax × Sl) − 1) × e(−kmax × t))]
The linear + tail model assumes that inactivation begins following first-order linear kinetics, but there is a resistant residual population (Nres) that does not undergo considerable changes in a certain time [25]. Equation (3) represents the model:
N= (N0 − Nres) × e(−k × t) + Nres

2.4.3. Weibull Model

Weibull model assumes that the resistance of the bacteria is heterogeneous and, therefore, that each cell requires a different contact time with the disinfectant to be inactivated [28]. This model represents the cumulative form of Weibull probability density for the resistance to disinfection of individual microbial cells; it introduces the term δ to represent the treatment time needed to reach the first decimal reduction in the bacterial population and p, a curve-shaped parameter [25,35]. It is represented by Equation (4):
N/N0= 10^ (−(t/δ)^p)

2.4.4. Biphasic Model

It assumes the existence of two microbial sub populations, both with a different resistance to the disinfection process. The biphasic model is represented by Equation (5):
log10(N)= log10(N0)+log10(f × e(−k1 × t)+(1−f) × e(−k2 × t))
where f represents a fraction of the population with an inactivation constant k1, the other subpopulation, of fraction 1−f, is more resistant to the process and, therefore, has a different inactivation constant, represented by k2 in the model equation [25,28].

2.5. UV Radiation Dose Analysis

UV radiation was calculated using SMARTS software version 2.9.5 [36], taking as data for entry to the system the ambient temperature at the time of the experiment, the average temperature on the day of the experiment and relative humidity and pressure, measured by the SRNyMA weather station. In addition to these data, the analysis was carried out considering the altitude and geographical coordinates of the city of Durango (1885 masl, 24° and −104°), the season in which the experiment was carried out (spring, summer, autumn or winter), a light pollution in the experimentation zone, 400 ppmv of CO2 on average and a solar constant of 1367 W/m2. The aerosol model in the atmosphere used was the one proposed by Shettle and Fenn [37]. The albedo of the area where the experimentation was carried out, which is important for the calculation of the radiation dispersed by the surface, was considered as a non-Lambertian surface with bare soil. UV radiation was considered a constant throughout the experiment, as temperature and humidity did not remarkably change in the 90 min length of the experiments: the average temperature increase of 3 °C during experimentation increased radiation by around 5 W/m2, from 400 to 1100 nm, meaning the change in UV radiation was even lower, so it was disregarded.
The UV-A and UV-B radiation was determined for each experiment, then the radiation doses reached by the reactor at different periods of time were calculated this was then related to the appearance of shoulders or the radiation necessary to achieve good levels of inactivation of microorganisms.
Not all the samples treated in the experiments were permanently illuminated, because much of the water was in the collection vessel or the pipe, therefore the proportion of the sample that was illuminated, I, was calculated at any time during the experiment as follows Equation (6):
I=Ai/Vt
where Ai represents the area that receives radiation and Vt the total water volume in the experiment [33].
The dose of UV radiation accumulated on the water surface was then calculated as follows Equation (7):
QUV,n=QUV,n-1+UVn∙(tn−tn-1)∙I
where QUV,n represents the cumulative UV radiation dose, UVn is the irradiance of UV radiation calculated by SMARTS for the time interval in W/m2, tn is the period of exposure to radiation and I is the proportion of illuminated sample, as defined in the previous Equation (6).

3. Results and Discussion

3.1. Statistical Analysis of Disinfection Processes

According to the ANOVA performed, only the parameters of H2O2 addition and its interaction with the type of the process have a significant value (p < 0.05) in the disinfection at times 5, 10, and 15 min of the experiments. The rest of the parameters do not statistically significantly affect the disinfection in the sampling times analyzed.
The response graphs give an idea of the optimal levels for the proper functioning of the processes and its overall behavior. The resulting equations from such graphs Equations (8) and (9), tell an interesting story: both parameters have a lower effect on the response variable when solar disinfection processes (those in the absence of photocatalyst) are applied Equation (8), compared to the effect they have on photocatalysis experiments Equation (9).
% disinfection at 45 min = 63.3597+2.1563 × pH+19.5464 × H2O2
% disinfection at 45 min = 42.8954+2.9659 × pH+33.0469 × H2O2
Such increases in the pH effect can easily be explained by considering the charge of photocatalysts and microorganisms. Escherichia coli (E. coli) is the main microorganism present in the fecal coliform group [38], in the E. coli wall, negative groups predominate and confer a negative charge to the microorganism [39,40]. In the presence of TiO2, the point of zero charge of the photocatalyst and its superficial charge both play important roles in electrostatic interactions, resulting in the greater effect of the pH parameter when the semiconductor is part of the process.
As will be seen in the next section, the ANOVA results match those observed in the kinetic analysis, as the shoulder presence is more common in the absence of H2O2 addition.

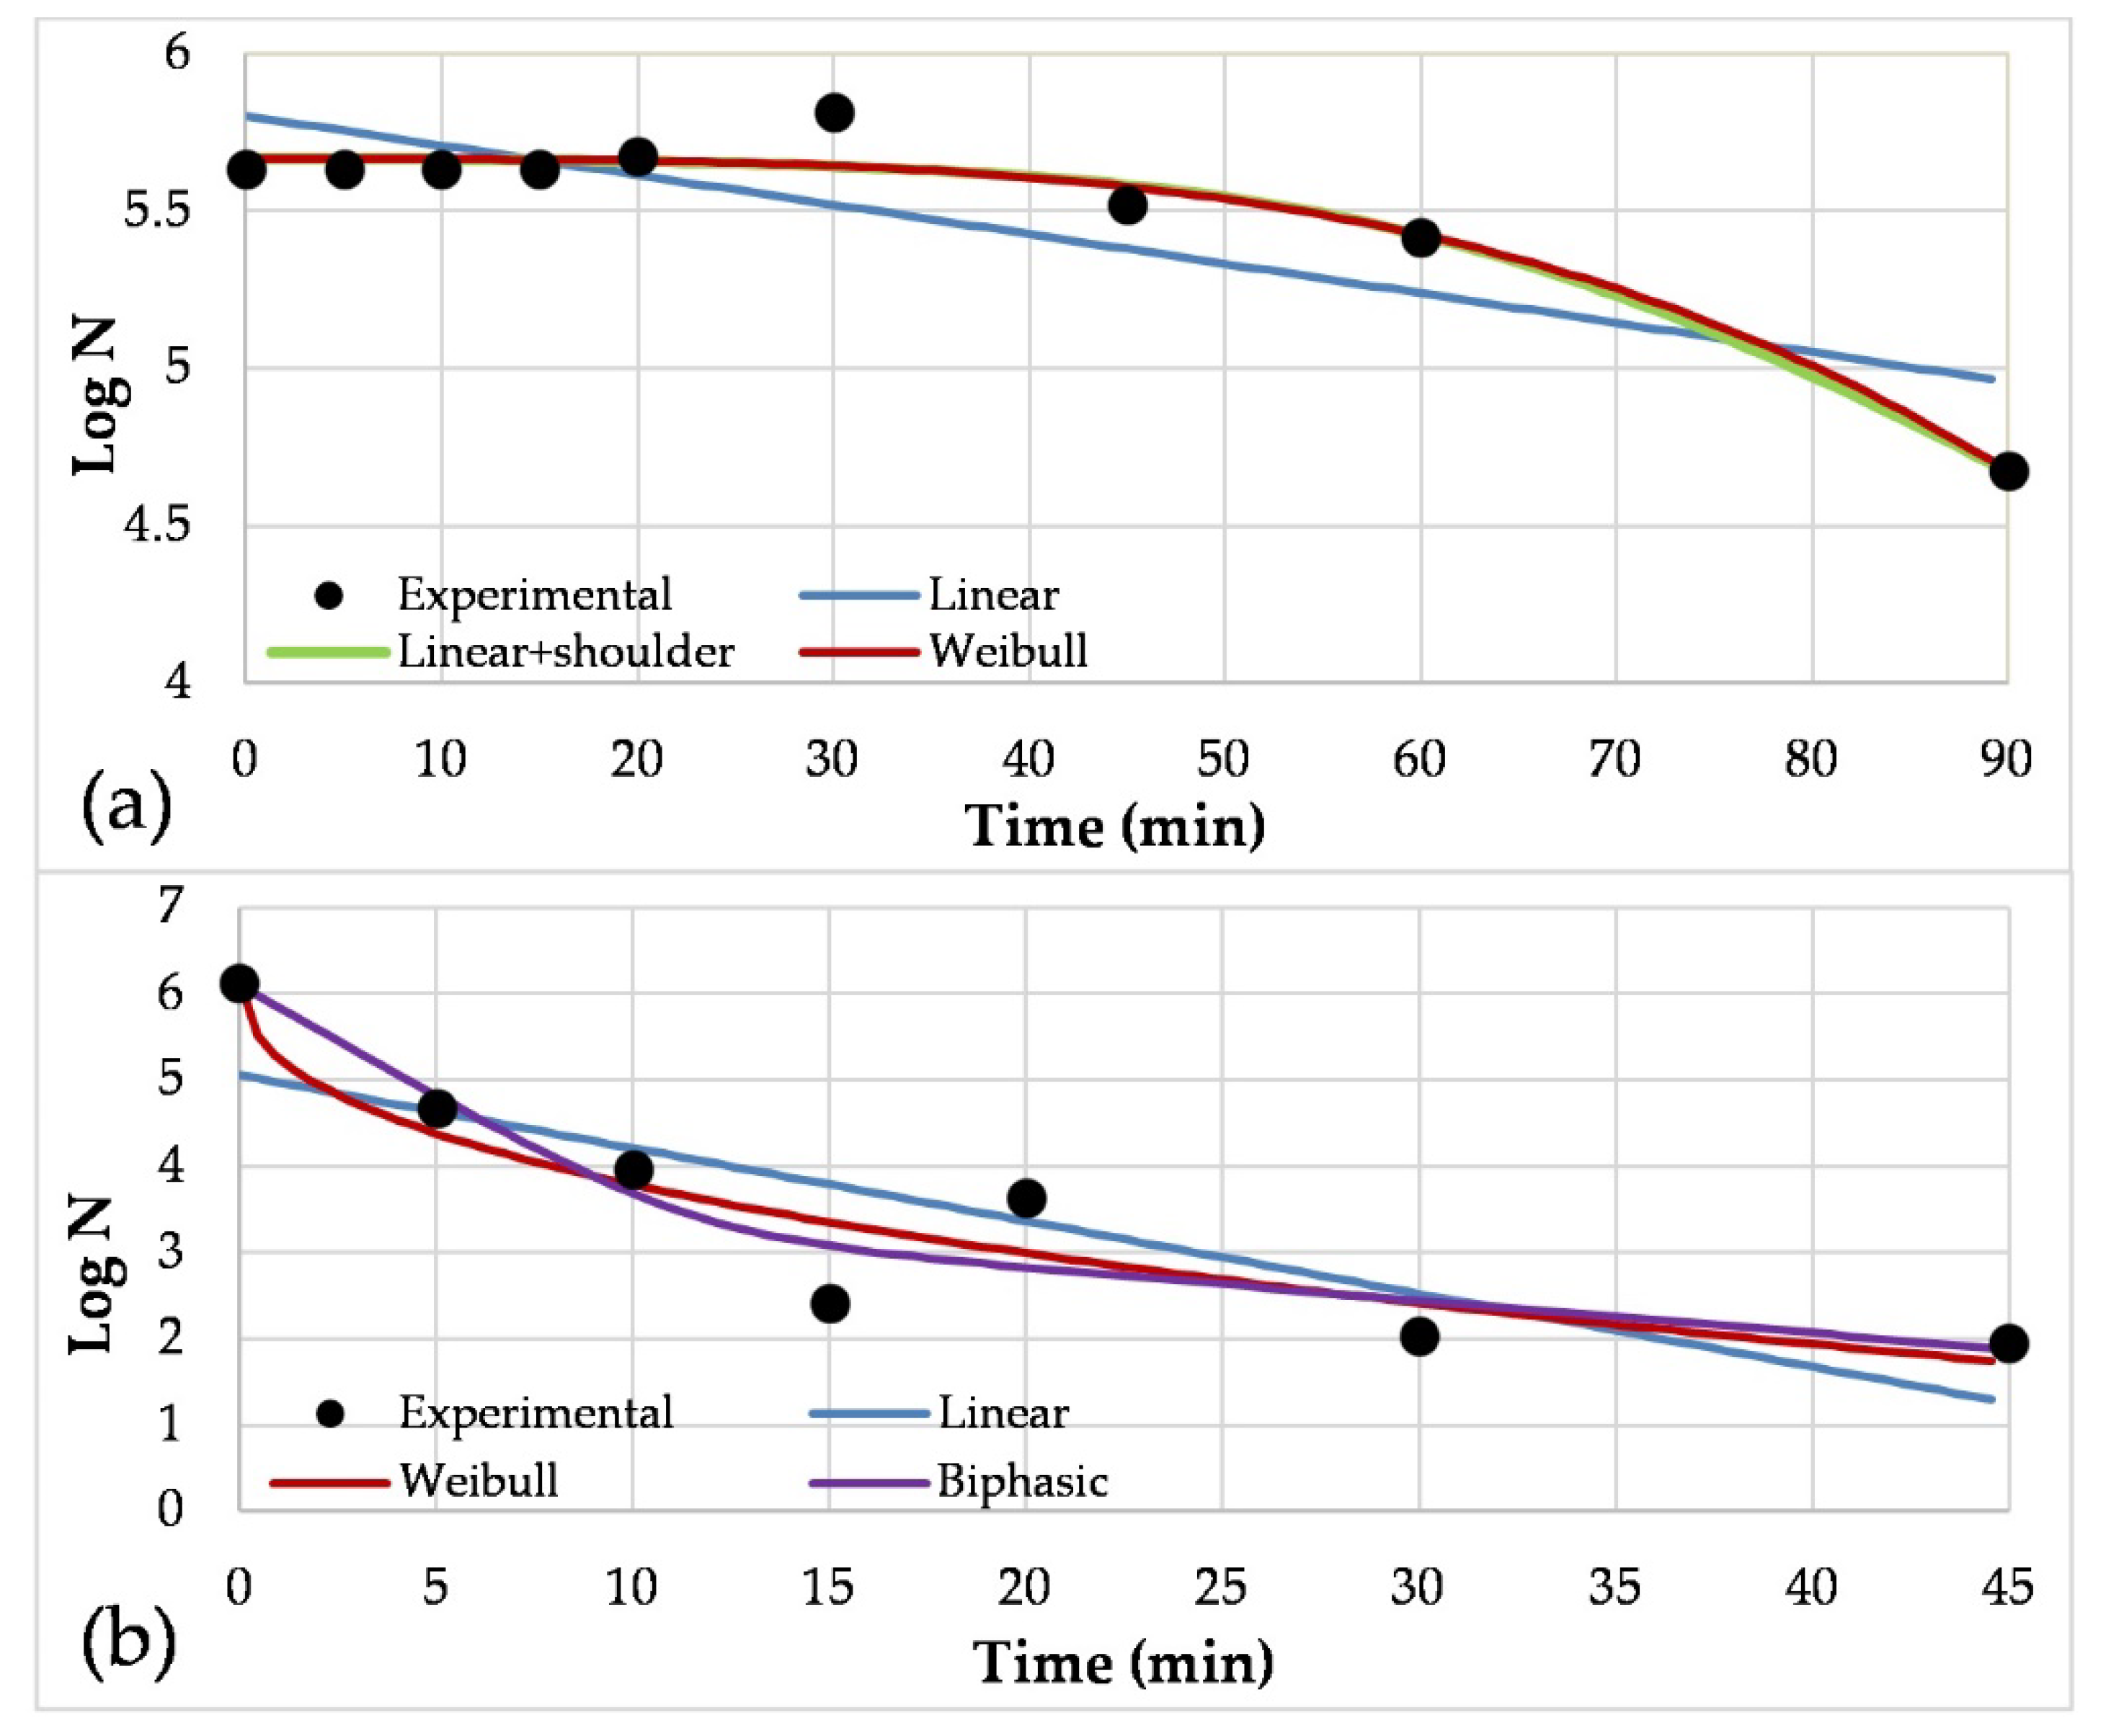
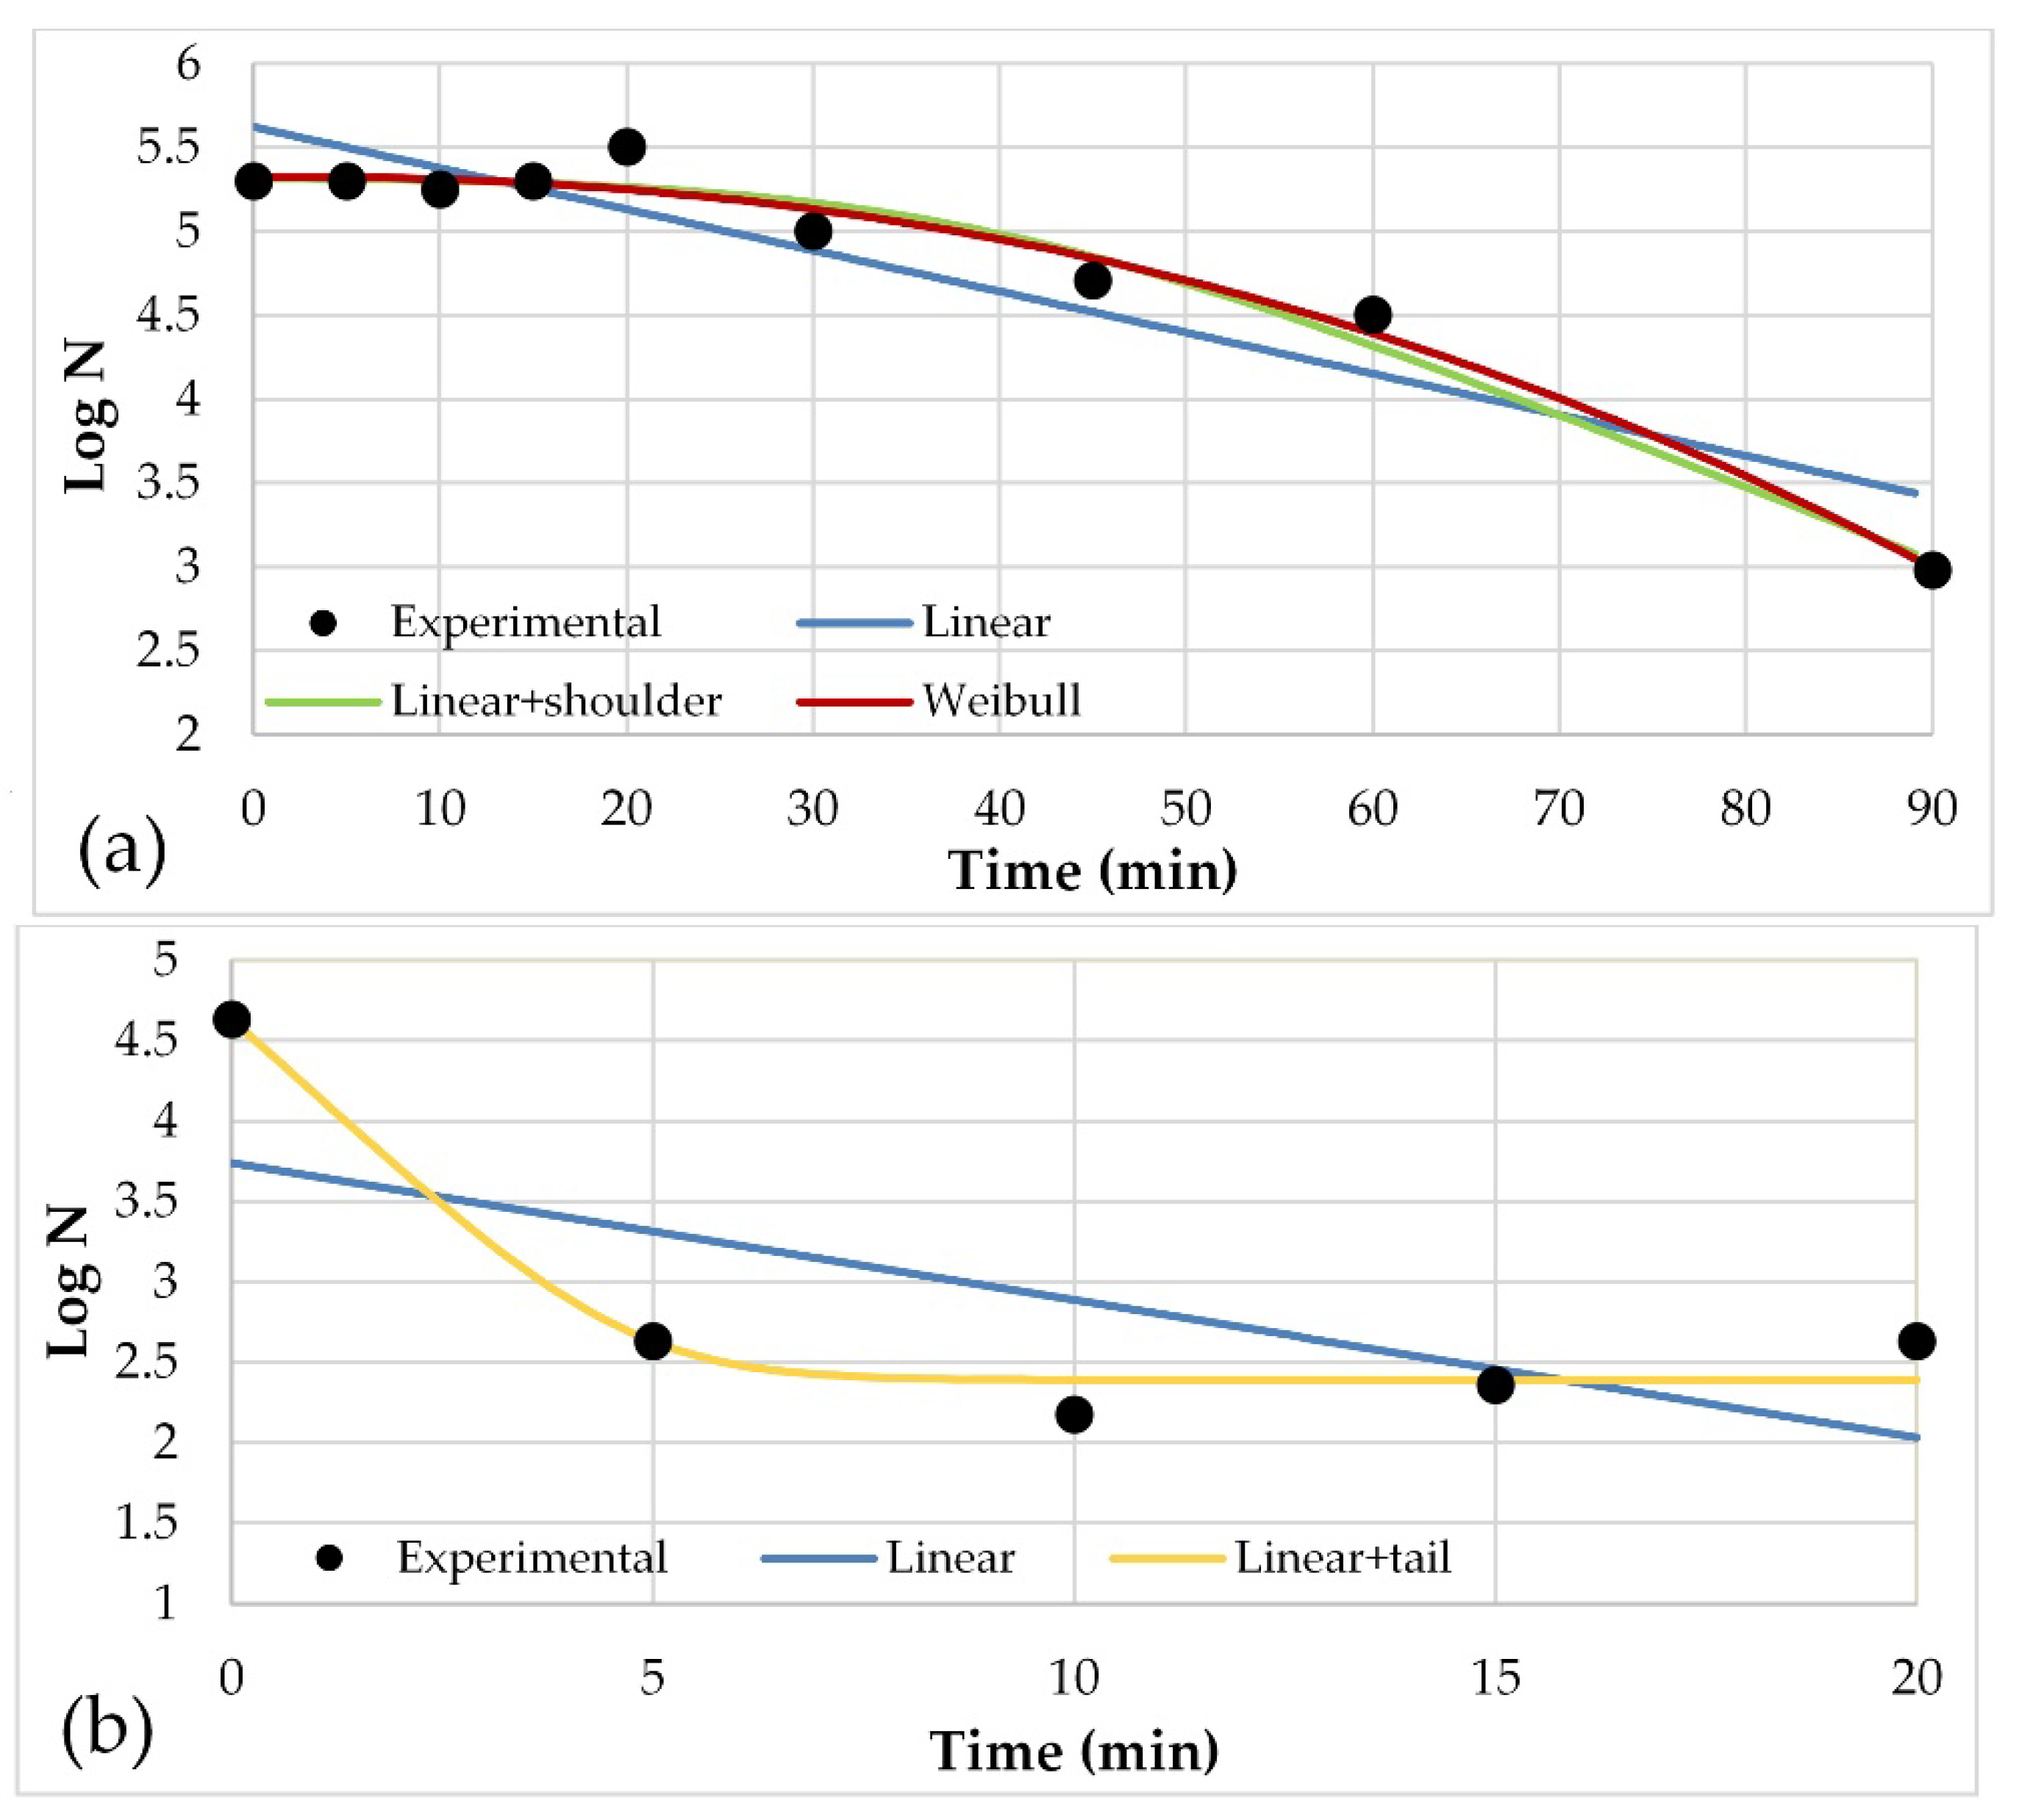
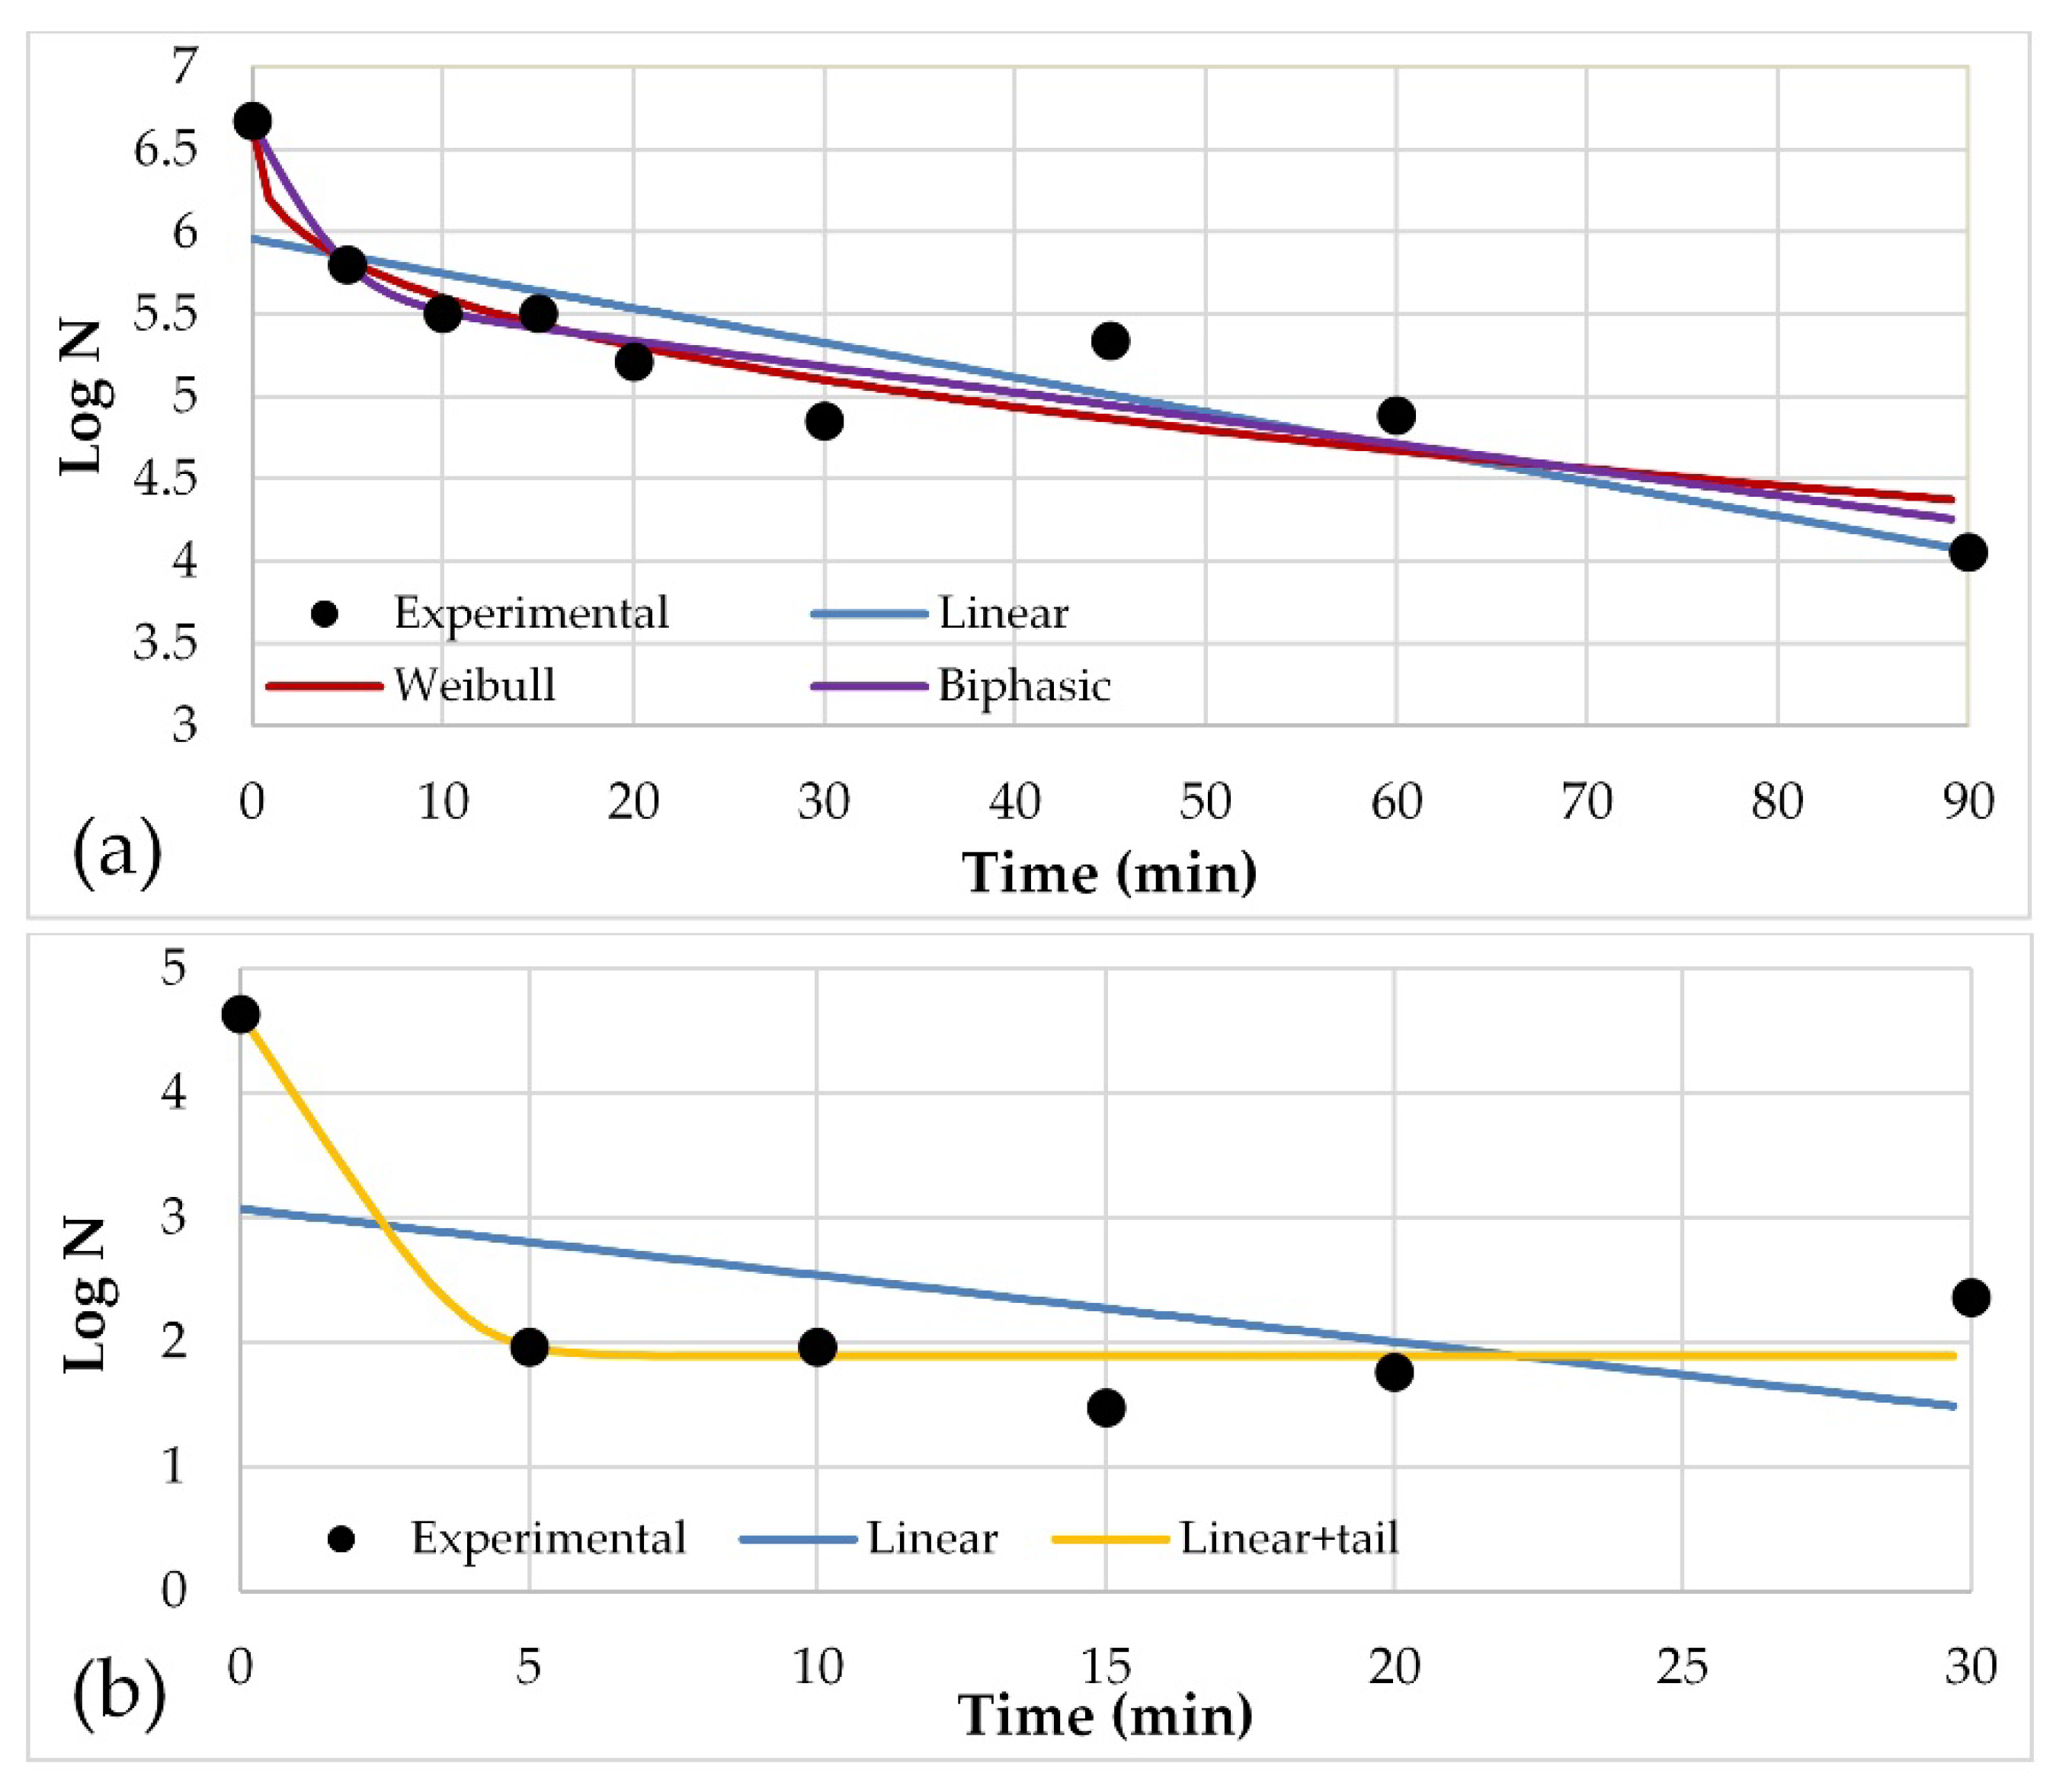
3.2. Kinetic Analysis

The Excel tool designed by Geeraerd et al. [25] was used to evaluate the selected mathematical models of inactivation and decide the one that suited us best. The graphs that represent these adjustments in UV-Vis and H2O2/UV-Vis under the three pH tested are shown below (Figure 2, Figure 3 and Figure 4), including the linear model in all cases as a reference. In some cases, the model that yielded the best fit was the linear one, which implies that, under certain conditions of initial pH and H2O2 dose, inactivation follows first-order kinetics and nothing seems to demonstrate the existence of the resistant subpopulations or protective factors in the bacterial population that cause the appearance of a shoulder in the inactivation process. According to other authors [19,41], in short inactivation times, the kinetics follow a log–linear model, however, in the present study, when inactivation was followed until times beyond 30 min, it was found that other models demonstrate a better fit to the experimental data obtained, which are reflected in R2 values higher than those of the linear model (Table 1).
As can be seen in the processes carried out without H2O2 addition, there is a delay in the beginning of inactivation (shoulder), except in the experiment conducted under an initial pH 9, where it seems that the addition of H2O2 hinders the inactivation process until 20 min, where the number of microorganisms then decreases visibly. According to Moreno-Rios et al. [42], in some photocatalytic processes, protection mechanisms and cell self-repair are enough to counteract cellular damage; even if the process depicted in Figure 4b does not correspond to photocatalysis, such an explanation could be valid. Moreover, as real wastewater samples were used in the present research, other parameters, such as bacterial population grow stage, organic matter and dissolved solids in the sample are difficult to control, but important to the disinfection results.
Rodíguez-Chueca et al. [28], performed experiments on the inactivation of E. coli with artificial radiation in a range of 320 to 800 nm with an initial pH 7.5 and the addition of 0.04 mMol H2O2; in their study, they found higher inactivation values in the process in the absence of H2O2, because in 30 min they achieved an inactivation of 0.53 log, but reached 0.79 log when the treatment was given without the addition of the chemical. In this investigation, the experimentation time was extended for a period of 90 min, in which inactivations of 3.5 and 1.29, 2.65 and 1.46 and 2.28 and 1.74 log were achieved with and without the addition of H2O2, for the initial pH quantities 5, 7.5 and 9 respectively. That is, inactivation reached in 90 min was higher when hydrogen peroxide was added to the beginning of the reaction.
H2O2 disinfectant properties, with the additional production of hidroxyl radicals, are accepted [43]. Villar-Navarro et al. [44] reported the inactivation of Vibrio in a SODIS process using a photoreactor with compound parabolic collector; in their research, as in ours, the H2O2 addition enhanced the inactivation.
In experiments performed by Rodríguez-Chueca et al. [45], it was found that the best models for UV-Vis disinfection processes for bacteria inactivation in synthetic effluents with a pH of around 8 are those based on the idea that the bacteria population is divided into sub populations with different resistance to treatment, like Weibull and biphasic.
The GinaFit tool was used also to graph data resulting from UV-Vis/TiO2 and UV-Vis/H2O2/TiO2 experiments (photocatalysis experiments). Graphs were obtained that allow the comparison of the experimental data with those predicted by the mathematical models. The graphs representing these adjustments, including the linear model in all cases as a reference, are shown below (Figure 5, Figure 6 and Figure 7). The results of the kinetic parameters given by each model are shown in Table 2.
As in processes carried out in the absence of TiO2, the addition of H2O2 seems to have a positive effect on the inactivation process since, in the experiments where it is not added, the formation of a shoulder is noticeable; that is, the organisms show initial resistance that extends up to approximately 30 min after the experiment begins, with the exception of pH 9, where the formation of said shoulder is not apparent and, in fact, as will be seen later, the models that best fit the experimental data indicate the existence of two subpopulations, but not the formation of a shoulder in the disinfection.
According to the existing literature, the recombination of the electron/hole on the TiO2 surface is one of the main disadvantages in the photocatalytic process, but such a disadvantage can be overcome with the addition of a chemical oxidant to the process to react with electrons in the conduction band and avoid said recombination [40,46]. This explains the better results obtained when adding H2O2 to the photocatalytic disinfection processes in the three pH values tested and H2O2’s statistical importance, as shown by the ANOVA results.
Table 1 shows the statistical parameters that were taken into account to choose the mathematical model that best describes the inactivation, according to the conditions of the experiment. Although the same models were tested for all conditions (linear, linear + shoulder, linear + tail, Weibull and biphasic), the table shows only the models that obtained an R2 greater than 0.8 and the linear model, which was used as a reference.
When two models yielded close R2 and RMSE values, the simplest model was chosen because it was easier to interpret. The kinetic parameters given by the model that best fits the experimental data, are shown below (Table 2):
According to the literature [44], the SODIS process requires a longer exposure time to high radiation, thus the material for the wastewater container plays an important role in the process and must be appropriate. Fisher et al. [47], reported that a material with a higher UV-B transmittance presented better E. coli inactivation results than materials which blocked such radiation. In this research, as the process took place in an open reactor, UV transmittance from the container did not represent a problem. In addition, the water layer was kept as thin as possible (water flow in the reactor was previously optimized [29]), and the sample transmittance was ranked from 79.2% at 320 nm to 90.3% at 400 nm.
As the point of zero charge of the photocatalyst is pH 7 [39], better kinetic results were expected from experiments in a pH of 5, given that the TiO2 surface presents a positive charge and an electrostatic attraction between the photocatalyst and E. coli was expected; however, such a favoring effect was not detected, as the kinetic results of the reaction with pH 5 were lower than the ones for pH 7.5 and 9, in both presence and absence of H2O2. The same effect was reported by Gumy et al. [39] when working with TiO2 Degussa P25, but was also observed when working with different TiO2 photocatalysts.
In 2015, Rodríguez-Chueca et al. [45] reported kinetic values obtained by UV-Vis solar and artificial UV-Vis radiation in synthetic water with pH around 8.2; authors reported k1 values of 0.08 min−1 in a biphasic model when working with artificial radiation and 0.005 min−1 when working with solar radiation. The Weibull model gave δ values of 24 and 238 min for the same radiation sources. In the present research, when working with solar radiation, and without H2O2 addition, the best model changed with the function of pH; under pH 5, a better R2 model resulted in a k value of 0.1 min−1 and a shoulder at 60 min; in pH 7.5, data adjusted to the linear model with a k value of 0.04 min−1 and, in pH 9, the closest value to reported by Rodríguez-Chueca et al. [45], the data adjusted to Weibull model with a δ of 50 min. Matching the results from the cited research, the results here presented show that H2O2 addition increases k values.
The appearance of a tail in photocatalytic disinfection processes was previously reported by Schwegmann et al. [48]; according to them, tailing occurs due to competition for the radicals between liberated intracellular components and intact cells. In processes where rapid cell inactivation occurs in the first minutes, such liberated cell components are expected to be present and cause the slowing down of the inactivation process.

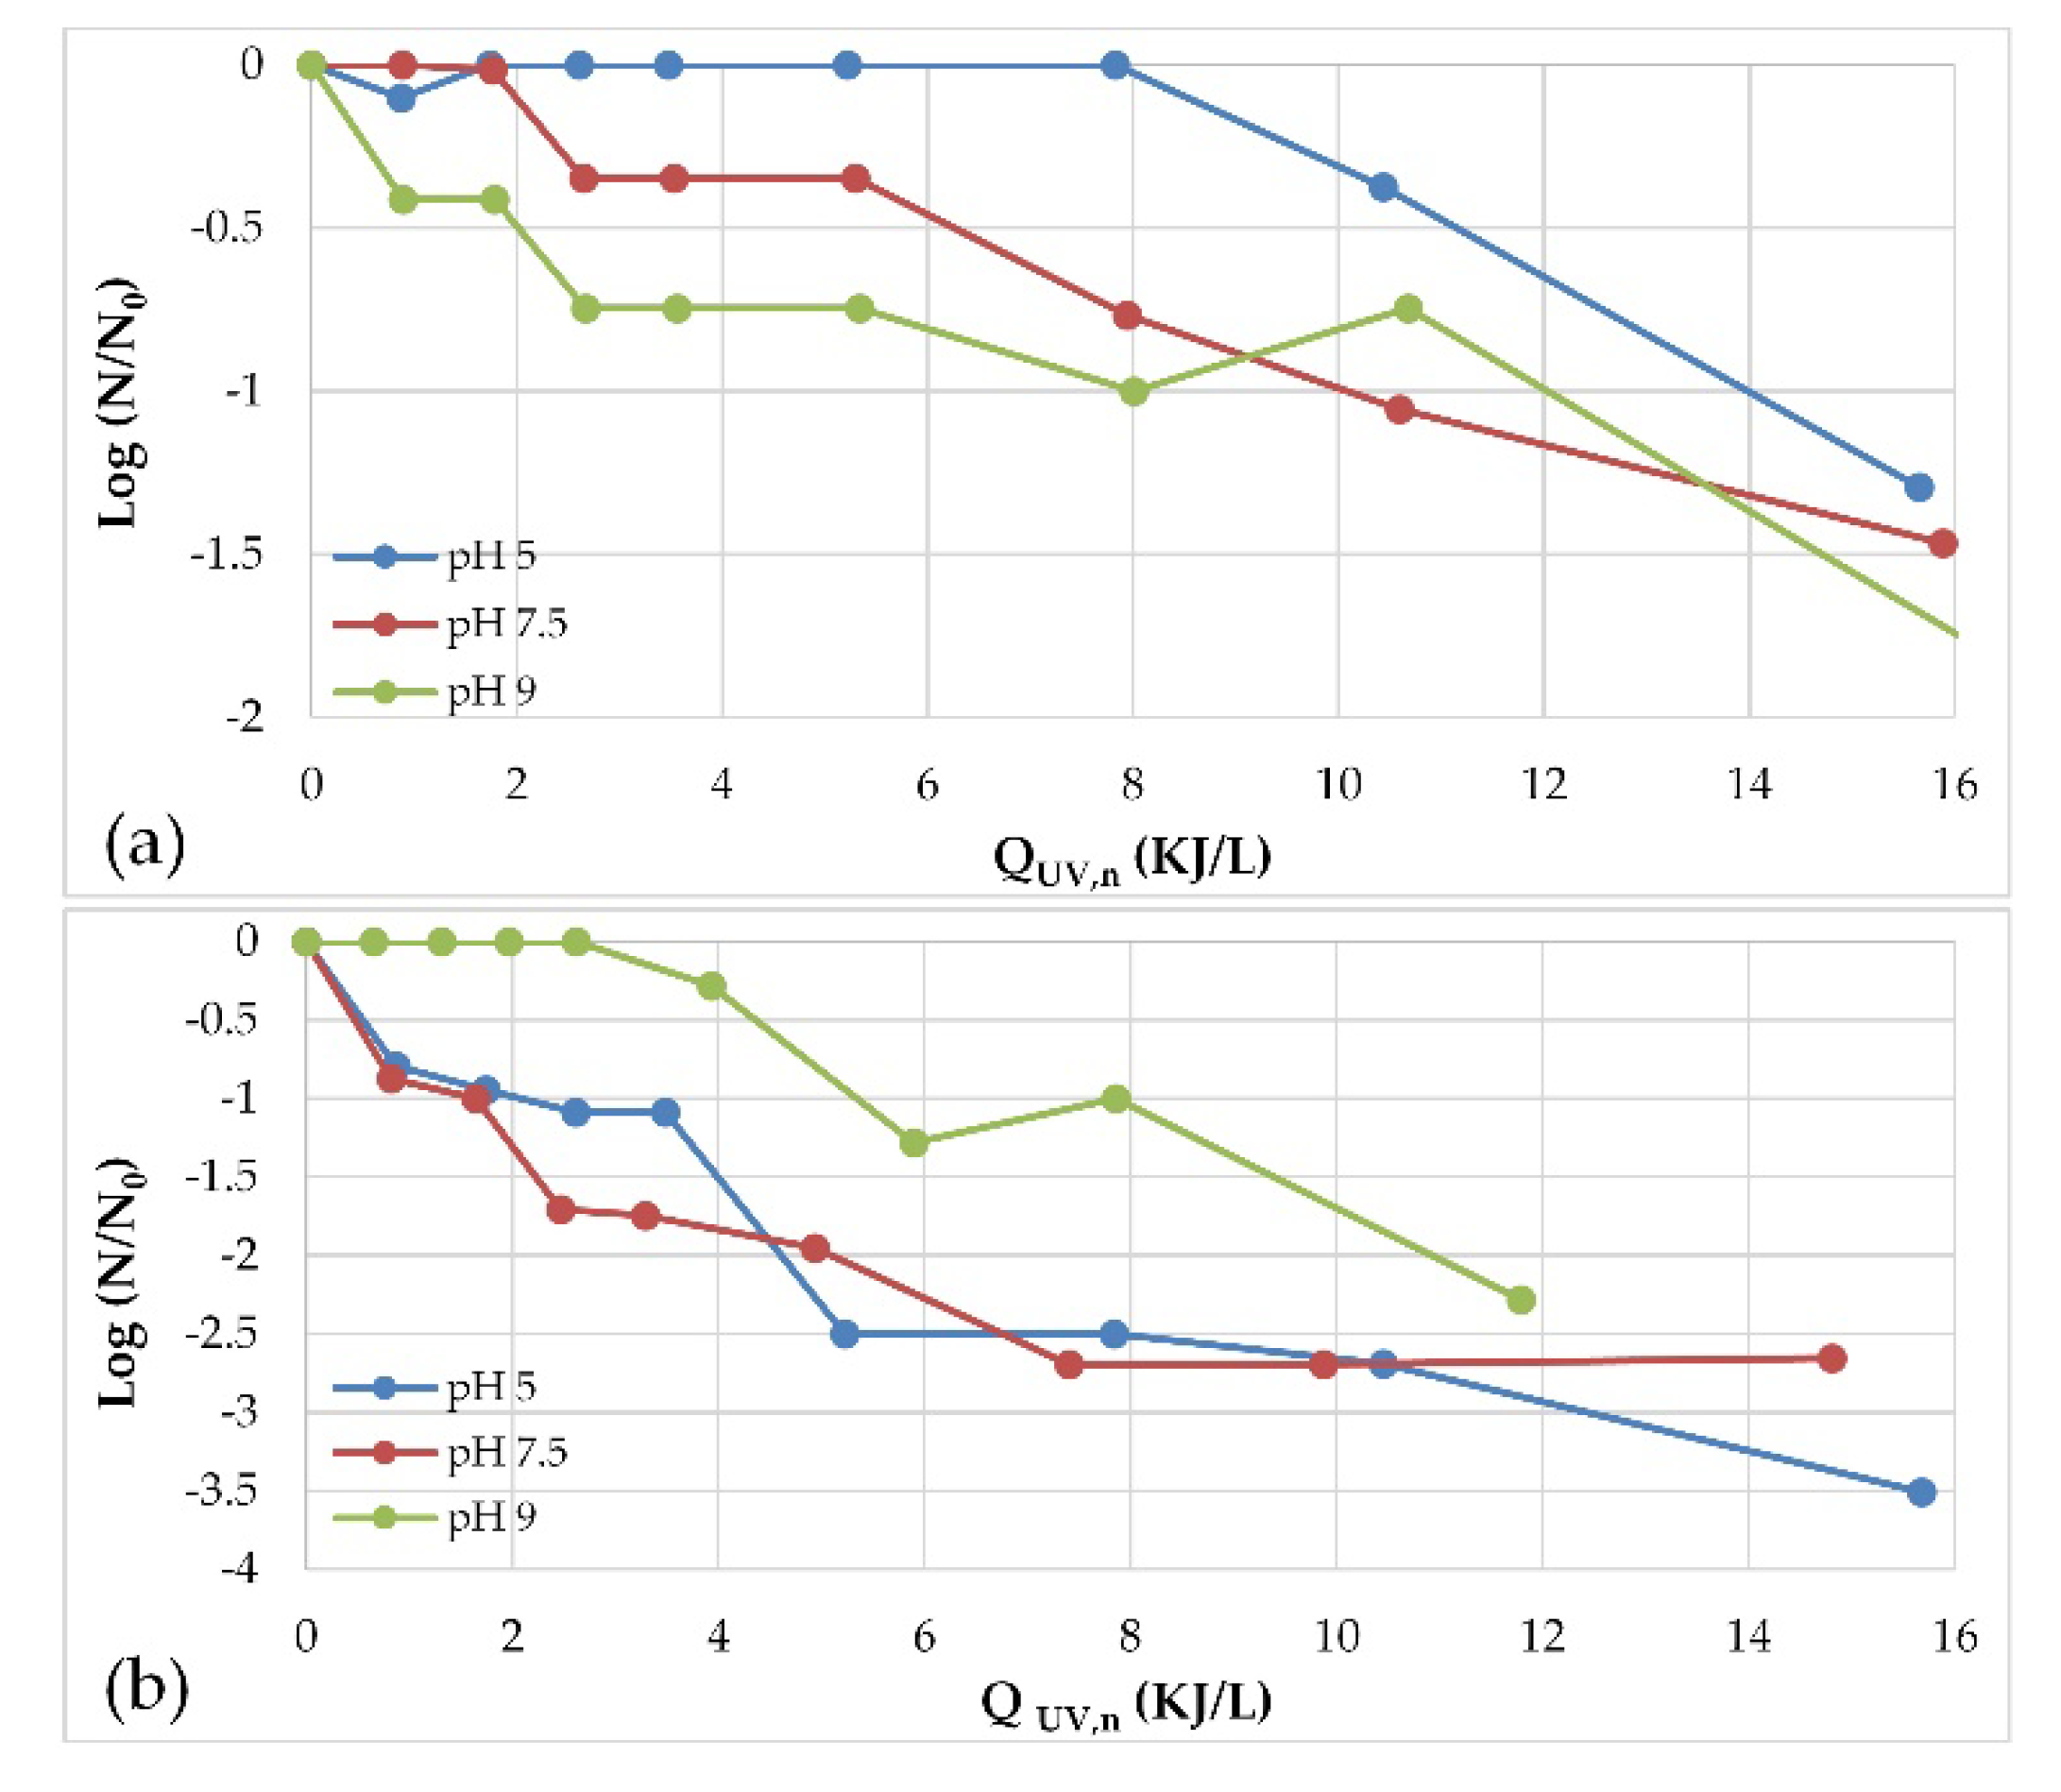
3.3. Radiation Doses in Inactivation Processes

When microorganism inactivation data is plotted against the received UV radiation, the effect of the addition of H2O2 is highlighted. In the case of processes carried out in the absence of a photocatalyst (UV-Vis) at pH 5, the formation of a shoulder can be seen in a period where there is no inactivation of microorganisms, which extends until the sample reaches a cumulative dose of 8 kJ/L (Figure 8a). If the date of the experiments is taken into account, it is important to note that the experiments with an initial pH 5, without the addition of hydrogen peroxide, were carried out during the month of September, when the global radiation measured by the SRNyMA station was approximately 100 W/m2 less than that of other months. If the same experiment had been performed in a month with higher radiation, the UV dose needed to overcome the resistance of coliform microorganisms in the sample would have been reached in a shorter time.
A similar observation can be made in the case of the experiment with the addition of hydrogen peroxide at an initial pH 9 (Figure 8b). The experiment was carried out during the month of November, when the radiation levels were lower. A shoulder was formed that required an accumulated radiation dose of approximately 2.6 kJ/L, which was reached in 20 min, as shown by the mathematical model that was best adjusted to overcome the resistance of microorganisms. In experiments performed on other dates, the cumulative dose of 2.6 kJ/L was reached in 15 min, so it is inferred that the cumulative dose of radiation incident on the sample should be the most important parameter to consider in the approach of this type of disinfection experiment, rather than the experimentation time.
Figure 9 shows the inactivation results plotted against the cumulative dose of UV radiation (QUV,n). In the process with initial pH 5 without the addition of peroxide, a shoulder is formed, 9.78 kJ/L is required to overcome it, and it extends over a period of 63.3 min (Table 2). These experiments were carried out during autumn, which explains why such a large period of time was required to reach the accumulated radiation dose necessary to overcome the shoulder.
Once the accumulated radiation parameter—and not the treatment time—is taken into account as the most important parameter to consider in the application of solar radiation treatments, it is easy to see that the treatments can be carried out at a time in the day when radiation has had a chance to accumulate in the city of Durango. For example, if the experiment portrayed in Figure 9a is performed at 9 am instead of 12:30 pm, a longer treatment time would be required to achieve the QUV,n necessary to overcome the shoulder and begin inactivation, but it would certainly be possible.

4. Conclusions

The addition of H2O2 to solar disinfection and solar photocatalytic disinfection applied to MWW with a fecal coliform content over the maximum permissible level established by Mexican regulations remarkably enhances the processes, yielding better results that those found in the absence of the chemical oxidant.
During the months before the rainy season in the city of Durango, Mexico (April and May), the radiation is low during the early hours, compared to the rainy months (July and August), so better results can be obtained in processes of inactivation using UV-Vis during the afternoon in these months. In contrast, during the rainy months, in the afternoon, the implementation of these treatments is less appropriate, because the presence of cloudiness decreases the amount of radiation incident on the land surface in the city, so longer inactivation times will be required to reach the UV dose needed for bacteria inactivation. Even though the radiation–temperature synergetic effect is important in SODIS, in this research it was not considered, as experiments were carried out in an open-to-the-atmosphere reactor, they lasted for 90 min and the ambient temperature at the beginning of the experiment was always below 30 °C.
When UV-Vis type treatments are implemented for the disinfection of municipal wastewater, it is the cumulative dose of UV radiation, and not the treatment time, that should be considered as most important for its implementation. In this way, it is possible to implement solar processes in all months of the year and much of the day, although the treatment time will increase because less solar radiation implies that it will take longer to reach the dose of radiation necessary to achieve inactivation.

Author Contributions

Conceptualization, C.M.N.-N. and J.B.P.-N.; Formal analysis, C.M.N.-N.; Funding acquisition, J.B.P.-N.; Investigation, C.M.N.-N.; Methodology, C.M.N.-N., G.I.O.-R., I.V.-F. and J.B.P.-N.; Project administration, J.B.P.-N.; Resources, G.I.O.-R.; Supervision, J.B.P.-N.; Validation, I.V.-F. and C.A.; Visualization, C.M.N.-N. and J.B.P.-N.; Writing—original draft, C.M.N.-N.; Writing—review & editing, C.M.N.-N. and J.B.P.-N. All authors have read and agreed to the published version of the manuscript.

Funding

This research was funded by Consejo Nacional de Ciencia y Tecnología (CONACyT) and Instituto Politécnico Nacional. The content does not necessarily reflect the views and policies of the funding organizations.

Acknowledgments

The authors would like to acknowledge Planta de Tratamiento de Aguas Residuales Oriente and Planta de Tratamiento de Aguas Residuales Sur for their support to conduct the research.

Conflicts of Interest

The authors declare no conflict of interest. The funders had no role in the design of the study; in the collection, analyses, or interpretation of data; in the writing of the manuscript, or in the decision to publish the results.

References

  1. Fair, G.; Geyer, J.; Okun, D. Purificación de aguas y tratamiento y remoción de aguas residuales; Editorial Limusa: Mexico, Mexico, 1999. [Google Scholar]
  2. Atlas, R. Bartha, R. Ecología microbiana y microbiología ambiental, 4th ed.; Pearson Education: Madrid, Spain, 2002. [Google Scholar]
  3. Rodríguez, M.; Sérodes, J. Spatial and temporal evolution of trihalomethanes in three water distribution systems. Water Res. 2001, 35, 1572–1586. [Google Scholar] [CrossRef]
  4. Lee, W.; Westerhoff, P. Formation of organic chloramines during water disinfection—chlorination versus chloramination. Water Res. 2009, 43, 2233–2239. [Google Scholar] [CrossRef] [PubMed]
  5. Wang, Y.; Zhu, G.; Engel, B. Health risk assessment of trihalomethanes in water treatment plants in Jiangsu Province, China. Ecotox. Environ. Safe 2019, 170, 346–354. [Google Scholar] [CrossRef] [PubMed]
  6. EPA. Folleto Informativo de Tecnología de Aguas Residuales, Desinfección Con Cloro; United States Environmental Protection Agency: Washington, DC, USA, 1999.
  7. Kim, J.; Chung, Y.; Shin, D.; Kim, M.; Lee, Y.; Lim, Y.; Lee, D. Chlorination by-products in surface water treatment process. Desalination 2003, 151, 1–9. [Google Scholar] [CrossRef]
  8. Gopal, K.; Sushree, S.; Bersillon, G.; Shashi, P. Chlorination byproducts, their toxicodynamics and removal from drinking water. J. Hazard. Mater. 2007, 140, 1–6. [Google Scholar] [CrossRef] [PubMed]
  9. Dalrymple, O.; Stefanakos, E.; Trotz, M.; Goswami, D. A review of the mechanisms and modeling of photocatalytic disinfection. Appl. Catal. B-Environ. 2010, 98, 27–38. [Google Scholar] [CrossRef]
  10. Doederer, K.; Gernjak, W.; Weinberg, H.S.; Farre, M.J. Factors affecting the formation of disinfection by-products during chlorination and chloramination of secondary effluent for the production of high quality recycled water. Water Res. 2014, 48, 218–228. [Google Scholar] [CrossRef]
  11. Hrudey, S. Chlorination disinfection by-products, public health risk tradeoffs and me. Water Res. 2009, 43, 2057–2092. [Google Scholar] [CrossRef]
  12. Gutiérrez-Alfaro, S.; Acevedo, A.; Figueredo, M.; Saladin, M.; Manzano, M.A. Accelerating the process of solar disinfection (SODIS) by using polymer bags. J. Chem. Technol. Biotechnol. 2016, 92, 298–304. [Google Scholar] [CrossRef]
  13. Figueredo-Fernández, M.; Gutiérrez-Alfaro, S.; Acevedo-Merino, A.; Manzano, M. Estimating lethal dose of solar radiation for enterococcus inactivation through radiation reaching the water layer. Application to Solar Water Disinfection (SODIS). Sol. Energy 2017, 158, 303–310. [Google Scholar] [CrossRef]
  14. Giannakis, S.; Polo López, M.I.; Spuhler, D.; Sánchez Pérez, J.A.; Fernández Ibáñez, P.; Pulgarin, C. Solar disinfection is an augmentable, in situ-generated photo-Fenton reaction—Part 1: A review of the mechanisms and the fundamental aspects of the process. Appl. Catal. B-Environ. 2016, 199, 199–223. [Google Scholar] [CrossRef]
  15. Bensasson, R.; Land, E.; Truscott, T. Excited States and Free Radicals in Biology and Medicine: Contributions from Flash Photolysis and Pulse Radiolysis; Oxford University Press: Tokyo, Japan, 1993. [Google Scholar]
  16. Matsumura, Y.; Ananthaswamy, H. Toxic effects of ultraviolet radiation on the skin. Toxicol. Appl. Pharm. 2004, 195, 298–308. [Google Scholar] [CrossRef] [PubMed]
  17. Heck, D.E.; Gerecke, D.R.; Vetrano, A.M.; Laskin, J.D. Solar ultraviolet radiation as a trigger of cell signal transduction. Toxicol. Appl. Pharm. 2004, 195, 288–297. [Google Scholar] [CrossRef] [PubMed]
  18. Keogh, M.B.; Castro-Alferez, M.; Polo-Lopez, M.I.; Fernandez Calderero, I.; Al-Eryani, Y.A.; Joseph-Titus, C.; Sawant, B.; Dhodapkar, R.; Mathur, C.; McGuigan, K.G.; et al. Capability of 19-L polycarbonate plastic water cooler containers for efficient solar water disinfection (SODIS): Field case studies in India, Bahrain and Spain. Sol. Energy 2015, 116, 1–11. [Google Scholar] [CrossRef]
  19. Núñez-Núñez, C.M.; Chairez-Hernández, I.; García-Roig, M.; García-Prieto, J.C.; Melgoza-Alemán, R.M.; Proal-Nájera, J.B. UV-C/H2O2 heterogeneous photocatalytic inactivation of coliforms in municipal wastewater in a TiO2/SiO2 fixed bed reactor: A kinetic and statistical approach. Reac. Kinet. Mech. Catal. 2018, 125, 1159–1177. [Google Scholar] [CrossRef]
  20. Chu, W.; Choy, W.K.; So, T.Y. The effect of solution pH and peroxide in the TiO2-induced photocatalysis of chlorinated aniline. J. Hazard. Mater. 2007, 141, 86–91. [Google Scholar] [CrossRef] [PubMed]
  21. Bustos, Y.; Vaca, M.; López, R.; Bandala, E.; Torres, L.; Rojas-Valencia, N. Disinfection of Primary Municipal Wastewater Effluents Using Continuous UV and Ozone Treatment. J. Water Resour. Prot. 2014, 6, 16–21. [Google Scholar] [CrossRef] [Green Version]
  22. Subramanian, M.; Kannan, A. Effect of dissolved oxygen concentration and light intensity on photocatalytic degradation of phenol. Korean J. Chem. Eng. 2008, 25, 1300–1308. [Google Scholar] [CrossRef]
  23. Pang, X; Chen, C.; Ji, H.; Che, Y.; Ma, W.; Zhao, J. Unraveling the photocatalytic mechanisms on TiO2 surfaces using the oxygen-18 isotopic label technique. Molecules 2014, 19, 16291–16311. [CrossRef] [Green Version]
  24. Egerton, T.A. UV-absorption—the primary process in photocatalysis and some practical consequences. Molecules 2014, 19, 18192–18214. [Google Scholar] [CrossRef] [Green Version]
  25. Geeraerd, A.; Valdramidis, V.; Van Impe, J. GInaFiT, a freeware tool to assess non-log-linear microbial survivor curves. Int. J. Food Microbiol. 2005, 102, 95–105. [Google Scholar] [CrossRef] [PubMed]
  26. Seidu, R.; Sjølander, I.; Abubakari, A.; Amoah, D.; Larbi, J.A.; Stenström, T.A. Modeling the die-off of E. coli and Ascaris in wastewater-irrigated vegetables: implications for microbial health risk reduction associated with irrigation cessation. Water Sci. Technol. 2013, 68, 1013–1021. [Google Scholar] [CrossRef] [PubMed]
  27. Berney, M.; Weilenmann, H.; Simonetti, A.; Egli, T. Efficacy of solar disinfection of Escherichia coli, Shigella flexneri, Salmonella Typhimurium and Vibrio cholerae. J. App. Microbiol. 2006, 101, 828–836. [Google Scholar] [CrossRef] [PubMed]
  28. Rodríguez-Chueca, J.; Ormad, M.; Mosteo, R.; Canalis, S.; Ovelleiro, J. Escherichia Coli Inactivation in Fresh Water through Photocatalysis with TiO2-Effect of H2O2 on Disinfection Kinetics. CLEAN Soil Air Water 2016, 44, 515–524. [Google Scholar] [CrossRef]
  29. Pantoja, J. Estudio de la degradación de materia orgánica presente en aguas residuales municipales mediante el uso de dióxido de titanio (TiO2) como fotocatalizador. Ph.D. Thesis, CIIDIR Durango, Durango, Mexico, 2015. [Google Scholar]
  30. Rincón, A.; Pulgarin, C. Bactericidal Action of Illuminated TiO2 on Pure Escherichia Coli and Natural Bacterial Consortia: Post-Irradiation Events in the Dark and Assessment of the Effective Disinfection Time. Appl. Catal. B-Environ. 2004, 49, 99–112. [Google Scholar] [CrossRef]
  31. Yurdakal, S.; Loddo, V.; Bayarri, Ferrer, V.; Palmisano, G.; Augugliaro, V.; Giménez, J.; Palmisano, L. Optical Properties of TiO2 Suspensions: Influence of pH and Powder Concentration on Mean Particle Size. Ind. Eng. Chem. Res. 2007, 46, 7620–7626. [Google Scholar] [CrossRef]
  32. Stintzing, A. Solar photocatalytic treatment of textile wastewater at a pilot plant in Menzel Temime/Tunisia. Ph.D. Thesis, Technische Universität Clausthal, Clausthal, Germany, 2003. [Google Scholar]
  33. Gutiérrez-Alfaro, S.; Acevedo, A.; Rodríguez, J.; Carpio, E.; Manzano, M. Solar photocatalytic water disinfection of Escherichia coli, Enterococcus spp. and Clostridium Perfringens using different low-cost devices. J. Chem. Technol. Biotechnol. 2015, 91, 2026–2037. [Google Scholar] [CrossRef]
  34. APHA. 9221 E. In Fecal Coliform Procedure. En Standard Methods for the Examination of Water and Wastewater; Eaton, A.D., Clesceri, L.S., Greenberg, A.E., Eds.; American Public Health Association: Washington, DC, USA, 1995. [Google Scholar]
  35. Giannakis, S.; Darakas, E.; Escalas-Cañellas, A.; Pulgarin, C. Solar disinfection modeling and post-irradiation response of Escherichia coli in wastewater. Chem. Eng. J. 2015, 281, 588–598. [Google Scholar] [CrossRef]
  36. Gueymard, C. Interdisciplinary applications of a versatile spectral solar irradiance model: A review. Energy 2005, 30, 1551–1576. [Google Scholar] [CrossRef]
  37. Shettle, E.; Fenn, R. Models for the Aerosols of the Lower Atmosphere and the Effects of Humidity Variations on Their Optical Properties; AFGL-TR-79-0214; Air Force Geophysics Lab.: Hanscom, MA, USA, 1979. [Google Scholar]
  38. BAM 4: Enumeration of Escherichia coli and the Coliform Bacteria. Available online: https://www.fda.gov/food/laboratory-methods-food/bam-4-enumeration-escherichia-coli-and-coliform-bacteria (accessed on 28 December 2019).
  39. Gumy, D.; Morais, C.; Bowen, P.; Pulgarin, C.; Giraldo, S.; Hajdu, R.; Kiwi, J. Catalytic activity of commercial of TiO2 powders for the abatement of the bacteria (E. coli) under solar simulated light: influence of the isoelectric point. Appl. Catal. B-Environ. 2006, 63, 76–84. [Google Scholar] [CrossRef]
  40. Malato, S.; Fernández-Ibáñez, P.; Maldonado, M.I.; Blanco, J.; Gernjak, W. Decontamination and disinfection of water by solar photocatalysis: Recent overview and trends. Catal. Today 2009, 147, 1–59. [Google Scholar] [CrossRef]
  41. Pantoja-Espinoza, J.; Proal Nájera, J.; García-Roig, M.; Cháirez-Hernández, I.; Osorio-Revilla, G. Eficiencias comparativas de inactivación de bacterias coliformes en efluentes municipales por fotólisis (UV) y por fotocatálisis (UV/TiO2/SiO2). Caso depuradora de aguas de Salamanca, España. Rev. Mex. Ing. Quim. 2015, 14, 119–135. [Google Scholar]
  42. Moreno-Ríos, A.L.; Ballesteros, L.M.; Castro-López, C.A. Influence of process variables on the kinetic parameters of a Langmuir-Hinshelwood expression for E.coli inactivation during the photocatalytic disinfection of water. Sep. Sci. Technol. 2019, 1–14. [Google Scholar] [CrossRef]
  43. Yasar, A.; Nasir, A.; Hummaira, L.; Aamir, A.A.K. Pathogen regrowth in UASB effluent disinfected by UV, O3, H2O2 and advanced oxidation processes. Ozone Sci. Eng. 2007, 29, 485–492. [Google Scholar] [CrossRef]
  44. Villar-Navarro, E.; Levchuk, I.; Rueda-Márquez, J.J.; Manzano, M. Combination of solar disinfection (SODIS) with H2O2 for enhanced disinfection of marine aquaculture effluents. Sol. Energy 2019, 177, 144–154. [Google Scholar] [CrossRef]
  45. Rodríguez-Chueca, J.; Ormad, M.; Mosteo, R.; Ovelleiro, J. Kinetic modeling of Escherichia coli and Enterococcus sp. inactivation in wastewater treatment by photo-Fenton and H2O2/UV–vis processes. Chem. Eng. Sci. 2015, 138, 730–740. [Google Scholar] [CrossRef]
  46. Friedmann, D.; Mendive, C.; Bahnemann, D. TiO2 for water treatment: parameters affecting the kinetics and mechanisms of photocatalysis. Appl. Catal. B-Environ. 2010, 99, 398–406. [Google Scholar] [CrossRef]
  47. Fisher, M.B.; Iriarte, M.; Nelson, K.L. Solar water disinfection (SODIS) of Escherichia coli, Enterococcus spp., and MS2 coliphage: Effects of additives and alternative container materials. Water Res. 2012, 46, 1745–1754. [Google Scholar] [CrossRef]
  48. Schwegmann, H.; Ruppert, J.; Frimmel, F.H. Influence of the pH-value on the photocatalytic disinfection of bacteria with TiO2 – Explanation by DLVO and XDLVO theory. Water Res. 2013, 47, 1503–1511. [Google Scholar] [CrossRef]
Figure 1. Reactor used in experiments.
Water 12 00639 g001
Figure 2. Adjustment of mathematical models to the results obtained by experiments under an initial pH 5: (a) UV-Vis, and (b) H2O2/UV-Vis.
Water 12 00639 g002
Figure 3. Adjustment of mathematical models to the results obtained by experiments under an initial pH 7.5: (a) UV-Vis, and (b) H2O2/UV-Vis.
Water 12 00639 g003
Figure 4. Adjustment of mathematical models to the results obtained by experiments under an initial pH 9: (a) UV-Vis, and (b) H2O2/UV-Vis.
Water 12 00639 g004
Figure 5. Adjustment of mathematical models to the results obtained by photocatalysis experiments, under an initial pH 5: (a) without H2O2 addition, and (b) adding 1 mMol of H2O2.
Water 12 00639 g005
Figure 6. Adjustment of mathematical models to the results obtained by photocatalysis experiments, under an initial pH 7.5: (a) without H2O2 addition, and (b) adding 1 mMol of H2O2.
Water 12 00639 g006
Figure 7. Adjustment of mathematical models to the results obtained by photocatalysis experiments, under an initial pH 9: (a) without H2O2 addition, and (b) adding 1 mMol of H2O2.
Water 12 00639 g007
Figure 8. Inactivation of microorganisms by processes with UV-Vis radiation at different pH: (a) 0 mMol H2O2, (b) 1 mMol H2O2.
Water 12 00639 g008
Figure 9. Inactivation of microorganisms by photocatalysis processes in different pH: (a) 0 mMol H2O2, (b) 1 mMol H2O2.
Water 12 00639 g009
Table 1. Disinfection kinetic models applied to the experimental data with R2 > 0.8.
pHH2O2
mMol/L
ModelRMSER2
(a) Solar disinfection processes (UV-Vis and UV-Vis/H2O2)
50Linear
Linear + shoulder
Weibull
0.249
0.0628
0.0678
0.71
0.9840
0.9813
7.50Linear
Weibull
0.0921
0.0994
0.9719
0.9720
90Linear
Weibull
0.2298
0.2311
0.7995
0.8261
51Linear
Linear + tail
Weibull
Biphasic
0.4271
0.3695
0.3213
0.3325
0.8791
0.9224
0.9413
0.9476
7.51Linear
Weibull
Biphasic
0.3218
0.1780
0.2081
0.8871
0.9724
0.9717
91Linear
Linear + shoulder
Weibull
0.2657
0.2452
0.2476
0.9071
0.9322
0.9309
(b) Photocatalysis (UV-Vis/TiO2 and UV-Vis/H2O2/TiO2)
50Linear
Linear + shoulder
Weibull
0.1975
0.0796
0.0782
0.6924
0.9572
0.9586
7.50Linear
Linear + shoulder
Weibull
0.3084
0.1566
0.1395
0.8627
0.9697
0.9759
90Linear
Weibull
Biphasic
0.3909
0.2759
0.2654
0.7427
0.8901
0.9153
51Linear
Weibull
Biphasic
0.8805
0.6273
0.6688
0.7264
0.8889
0.9053
7.51Linear
Linear + tail
0.8436
0.2307
0.4608
0.9731
91Linear
Linear + tail
1.1136
0.3721
0.2509
0.9373
Table 2. Kinetic parameters of the processes.
pHH2O2Modelδ (min)k1 (min−1)k2 (min−1)Sl (min)
(a) UV-Vis and UV-Vis/H2O2
5
7.5
9
0 mMolLinear + shoulder
Linear
Weibull
-0.1
0.04
-
-
-
-
59.5
--
50.15-
51 mMolBiphasic -0.170.04-
7.5Biphasic -0.410.09-
9Linear + shoulder -0.08-19.5
(b) Photocatalysis (UV-Vis/TiO2 and UV-Vis/H2O2/TiO2)
50 mMolLinear + shoulder0.08-63.3
7.5 Linear + shoulder0.1-38.3
9 Biphasic0.560.04-
51 mMolBiphasic0.590.09-
7.5 Linear + tail1.09--
9 Linear + tail1.6--
Treatment time needed to reach the first decimal reduction in the bacterial population (δ). Shoulder duration (Sl).

