Spatiotemporal Urea Distribution, Sources, and Indication of DON Bioavailability in Zhanjiang Bay, China
by
Peng Zhang
1, 
Cong-Hui Peng
1,
Ji-Biao Zhang
1,2,*,
Zhan-Bin Zou
1,
Yu-Zhen Shi
1,
Li-Rong Zhao
1 and
Hui Zhao
1,2 1
Faculty of Chemistry and Environmental Science, Guangdong Ocean University, Zhan Jiang 524088, China
2
Southern Laboratory of Ocean Science and Engineering, Zhan Jiang 524088, China
*
Author to whom correspondence should be addressed.
Water 2020, 12(3), 633; https://doi.org/10.3390/w12030633
Submission received: 7 January 2020
/
Revised: 19 February 2020
/
Accepted: 21 February 2020
/
Published: 26 February 2020
(This article belongs to the Special Issue Anthropogenic and Climatic Disturbances in Freshwater and Coastal Ecosystems: Interactive Impacts and Expected Threats)
Abstract
:In marine environments, urea is an important component of the biogeochemical cycle of nitrogen. The autochthonous and allochthonous sources (rivers, aquaculture, waste water input, etc.) of urea play a key role in urea cycles in adjacent coastal waters. Because urea is a specific marker to trace the sewage fluxes in coastal waters, we investigated urea associated with terrestrial source input and coastal water in Zhanjiang Bay (ZJB) during the time from November 2018 to July 2019, and the spatiotemporal urea distribution and the bioavailability of dissolved organic nitrogen (DON) based on urea concentration in the ZJB were explored. The results showed that the urea enrichment in coastal water was mainly due to discharge from urban sewage systems, rivers, and coastal aquaculture. The concentration of urea ranged from 1.14 to 5.53 μmol·L−1, and its mean value was 3.13 ± 1.02 μmol·L−1 in the ZJB. The urea concentration showed a significantly different seasonal variation in the ZJB (p < 0.05), and the highest and lowest concentrations were found in November 2018 and April 2019, respectively. Its high value appeared in the north and northeast of the ZJB, which were polluted by coastal aquaculture and agriculture fertilizer utilization. The range of urea concentration of terrestrial source inputs in the ZJB was 1.31–10.29 μmol·L−1, and the average urea concentration reached 3.22 ± 0.82 μmol·L−1. Moreover, the total urea flux surrounding the ZJB was 2905 tons·year−1. The seasonal terrestrial source of urea flux contributions had significant seasonal variation in wet, normal, and dry seasons (p < 0.05). The ZJB was subjected to a large flux of urea by estuaries and sewage outlet discharges. The seasonal urea concentration in all stations (>1 μmol·L−1) indicated that urea in the ZJB may have a bioavailable DON source. As a bioavailable nitrogen source, the ability of terrestrial source-derived urea to increase eutrophication should not be ignored in ZJB.
1. Introduction
In coastal marine environments, the nitrogen cycle is a part of the much larger and interconnected hydrosphere–lithosphere–atmosphere–biosphere nitrogen cycle of the Earth [1]. Various forms of nitrogen can be directly transported across cell membranes and assimilated into new cellular material as required for biosynthesis and growth. As an important part of the nitrogen cycle, dissolved organic nitrogen (DON) is a critical component of proteins, chlorophyll, and nucleic acids [2,3]. Not only can DON be converted into inorganic nitrogen, it is also a potential source of bioavailable nutrients [4,5,6,7]. Urea, as an unstable and intermediate DON compound, has increasingly caught attention in the recent past decades [8,9,10,11,12]. It participates in various metabolic pathways involved in the transportation, production, and decomposition of different microorganisms in the ocean, forming an essential part of the marine nitrogen cycle [10,13]. Urea is increasingly found to be important in the nitrogen nutrition of some Harmful Algal Bloom (HAB) species [14,15]. Many researches have shown that urea is used as a nitrogen substrate by many coastal phytoplankton species and has an obvious promotion effect on the growth of some microalgae in seawater [14,15,16,17,18,19,20].
In general, urea in surface seawater can originate from two types of the major sources: an autochthonous source, which produces urea within the system, and allochthonous, which supplies urea from outside the system [3,4,5]. The autochthonous sources include marine biological processes, such as phytoplankton metabolism, bacterial and viral metabolism, cell death and decomposition, and zooplankton excretion [5,6,7,21]. Allochthonous sources include the deposition of atmosphere and terrestrial inputs. Recent studies showed that urea in atmospheric sedimentation can promote the growth of marine phytoplankton and is one of the important factors affecting biological communities [16]. Urea is also transferred from the land to the atmosphere because of wind-blown particulates and the evaporation of soil moisture [22,23,24]. However, terrestrial runoff could be the most important source in semi-enclosed bays, which are influenced by industrial factors and sewage outlets set up along the coastline in recent years. Coastal area runoff from land, such as industrial waste water, domestic sewage, agricultural fertilizer, etc., is potentially the main source of urea in coastal water. In particular, the inputs from agriculture fields with urea fertilizer will also increase the enrichment of DON in coastal areas. Urea is a widespread compound in terrestrial ecosystems because the human demand for grain has rapidly increased the application of urea as a fertilizer. Statistical data showed that worldwide use of urea fertilizer increased more than 100-fold, accounting for more than 50% of the global nitrogen fertilizer usage during the past few decades [25,26,27]. Urban and agriculture sewage systems are two of the most significant sources of urea. The extent to which urea reaches the marine environment relies on the efficiency of the steps of mineralization, nitrification, and the removal of nitrogen in waste water treatment plants [27,28]. Previous studies found that urea is the most readily used organic nitrogen source and has been showed to be available to all algal species studied so far [16,17,18,19,20,29]. With the increasing urea contributions to natural waters and waste water discharges, it is obviously important to learn about the DON bioavailability based on the urea concentration at a spatiotemporal scale [3,11,16,30]. Fertilizer-derived urea can be a significant, bioavailable, and anthropogenic form of dissolved ‘organic’ nitrogen export that warrants further attention in many field- and catchment-scale research applications [15,27]. The absolute urea concentration in seawater and the proportion of urea in DON can be used to indicate the bioavailability of DON [31,32]. These studies suggested that the biogeochemical role of urea should be better investigated in coastal zones subjected to highly variable ambient conditions and to huge fluxes of urea [33]. Therefore, it is important to explain the significant contribution of terrestrial source urea input to marine ecosystems.
Zhanjiang Bay (ZJB), which is located in the northeast of Zhanjiang city, plays a key role in the development of Zhanjiang city. Since the 1980s, with the rapid socioeconomic development of Zhanjiang, the impact of human activities, such as coastal terrestrial pollutant discharge, marine aquaculture, harbor, and terminal shipping, etc., has increasingly expanded. Caused by the large amount of terrestrial source inputs through estuaries and sewage outlets into the ZJB costal area, seawater quality has deteriorated, while HAB occurs frequently [34]. According to the Bulletin of Guangdong Marine Environmental Status 2017, the coastal area of Zhanjiang city has become one of the important areas with the most severe HAB except for the Pearl River Delta [35]. Under the high intensity of anthropogenic activities, the eutrophication caused by urea in seawater is still unknown. As such, we focused on the urea in coastal water and terrestrial sources, including the most relevant river and sewage inputs in the JZB.
The aim of this study is to analyze the concentration and sources of urea in coastal water, estuaries, and sewage outlets in ZJB, subjected to increasing anthropogenic pressure in recent years. Three different aspects were considered: (1) to determine the spatial and temporal distribution characteristics of urea in the surface water of ZJB during four seasons, (2) to calculate the fluxes of terrestrial inputs of ZJB estuaries and sewage outlets in different water flow seasons and to identify the variations and sources of pollution in the terrestrial inputs of the ZJB; (3) to assess the DON bioavailability based on the urea concentration in the ZJB coastal water. The results can provide meaningful field monitoring data for obtaining an overall picture of urea in terms of bioavailable DON in the the ZJB marine system.
2. Materials and Methods
2.1. Study Area and Data Sources
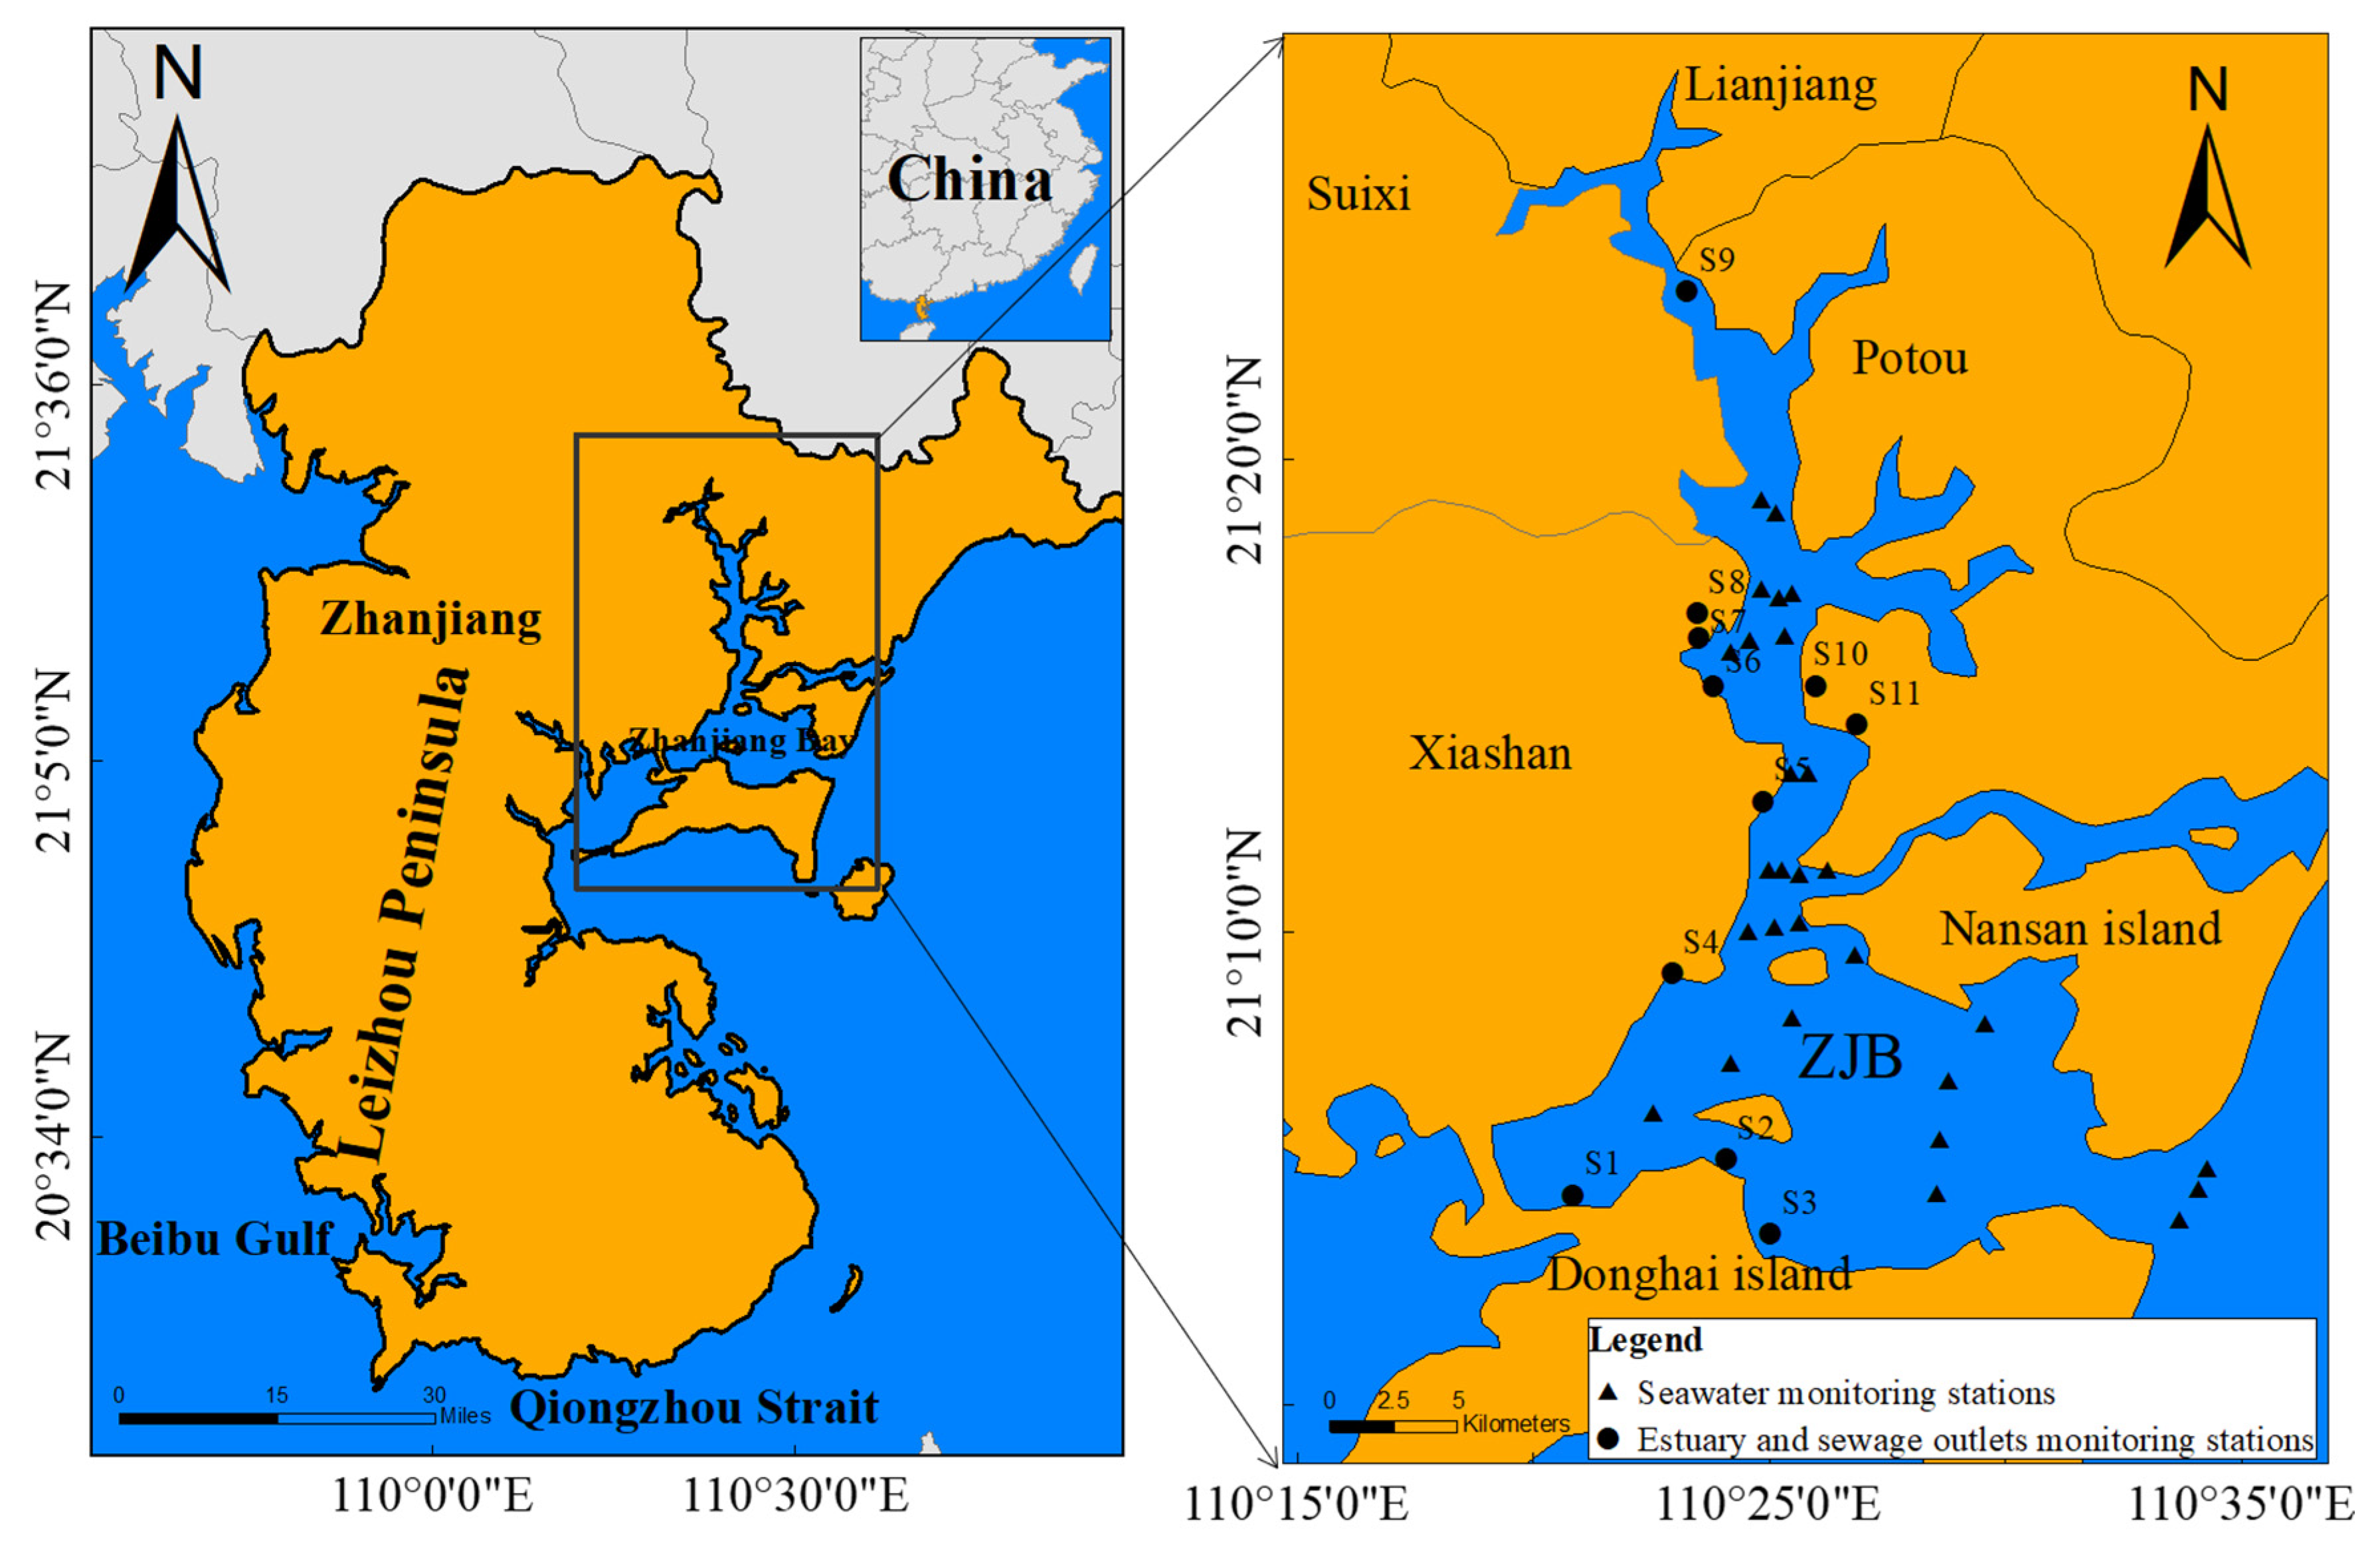
The ZJB is located in the northeast of Zhanjiang city. Based on geographical features, the ZJB is a semi-closed bay with poor hydrodynamic conditions. The adjacent administrative area includes Potou District, Xiashan District, Suixi District, Lianjiang District, and Donghai Island. Therefore, the ZJB plays an important role in Zhanjiang’s economic and social development. The total length of ZJB is 15 km from south to north, with a width of 24 km, covering an area of 193 km2. It is rich in marine resources [35,36]. During 2018, the average annual temperature of Zhanjiang city was 25.1 °C, and the average annual rainfall was 1663 mm. The Zhanjiang’s regional gross domestic product (GDP) was 282.403 billion yuan, with a permanent population of 7.305 million people in 2017 [37]. There are rivers flowing through urban areas along the coastline. Ports, piers, anchorages, and marine aquaculture functional areas were built in the bay by the government. In recent years, many sewage outlets from municipal sewage treatment plants along the coastal ZJB area have been built. Sewage outlets discharge waste water into the bay, which causes serious marine environmental pollutant problems [34]. In this study, water sampling was chosen with respect to the physical–chemical–biological status of the hydrological and terrestrial input spatial distribution characteristics in the ZJB (Figure 1); this study designed the monitoring stations of seawater (Figure 1) and the survey stations of the estuaries and sewage outlets of terrestrial input (Table 1). Considering representativeness of the samples, sampling of terrestrial sources and seawater was conducted in the same seasonal period. To determine the amount of terrestrial urea discharge into the sea, a total of 11 terrestrial source input stations (Table 1), including six river estuaries discharging into the bay (numbers 3, 4, 5, 6, 9, and 11) and inshore outflows of five sewage outlets (numbers 1, 2, 7, 8, and 10) were investigated. The 28 seawater monitoring stations of seawater in ZJB were selected according to the Specification for Marine Monitoring Part 4: Seawater Analysis [38]. First, the water quality control points corresponded to the terrestrial inputs such as estuaries and sewage outlets and were established at seawater stations throughout the waste water-seawater mixed zone. Second, some seawater stations were used to evaluate the water quality impact of terrestrial inputs in the ZJB. Other seawater stations were established in the different marine functional zones and marine transect of the ZJB. Overall, the sampling site selection described above allowed comprehensive evaluation of the effects of terrestrial urea inputs on seawater and the distribution characteristics of surface seawater in the ZJB [38,39,40,41]. The spatial distribution of seawater and terrestrial source input stations is shown in Figure 1. Because of the limitation of natural factors such as weather and the water level at the time of sample collection, samples from all stations in seawater could not be collected.
2.2. Sample Collection and Analysis
The samples of this comprehensive investigation were collected in the ZJB costal seawater; November 2018 and April 2019 represented the normal season, January 2019 represented the dry season, and June and July 2019 represented the wet season. The seawater samples were collected by using 5 L plexiglass water collectors (DSC5000) (Xiamen Dengxun Instrument Equipment Limited Company, Xiamen, China) to obtain 2.5 L surface (0–10 m) water of ZJB. The samples of terrestrial estuaries and sewage outlets were collected simultaneously during low tide within 6 h to avoid seawater influence [40]. The method of collection, preservation, and measurement of river water and sewage water samples was performed in accordance with the “Technical Specification Requirements for Monitoring of Surface Water and Waste Water” (HJ/T91-2002) [40]. According to the “Code for liquid flow measurement in open channels” (GB50179-93) [41], water samples were collected using a portable sampler, and a rotor flow meter was used to monitor the flow of each river into the sea simultaneously. After transportation to the laboratory, all samples were first filtered with glass fiber filter (GF/F) membranes, and then the water samples were stored in glass bottles which were cleaned with ultrapure water. The samples were frozen in a refrigerator before analysis (−18 °C).
2.3. Method of Urea Measurement for Sample Analysis
After the water sample was collected, the concentration of urea was determined in accordance with the optimized diacetyl monoxime method in urea measurement [42]. At present, the main determination method of urea in seawater is diacetyl monoxime spectrophotometry [43]. However, there are many differences between analysis methods, such as the reagent types and ratios. Aiming at the shortcomings in the existing methods, an orthogonal experiment was used to optimize the reagent ratio by optimizing the kinetic conditions of the urea color reaction in seawater samples [44]. This procedure was based on the diacetyl monoxime spectrophotometry method [45,46]. However, there may be interactions between the environmental variables. This optimized method effectively overcomes the previous method problems of poor reproducibility and a narrow linear range. The conditions of this optimized measurement we used were as follows: 710.00 mg·L−1 diacetyl monoxime, 15.75 mg·L−1 thiosemicarbazide, 17.32 (V/V) sulfuric acid, and 0.3 mg·L−1 Fe3+. The reaction temperature condition was in water bath at 80 °C for 50 min. The optimized method detection limit (MSD) was 0.26 μmol·L−1, the relative standard deviation (RSD) was 6.6% (n = 9), and the recovery rate was between 98% and 107%. During this method, the samples were measured twice in parallel, and the relative deviation of the measured parameters did not exceed 5% [42].
2.4. Riverine and Sewage Outlets Flows and Fluxes of Urea Calculation
In this investigation, the urea fluxes of terrestrial discharge were calculated using the following formula: Urea export was estimated from the ZJB terrestrial sources, representing the urea fluxes from the most downstream main-channel station with water discharge data. Thus, river estuaries and sewage outlets monitoring stations were used to quantify the fluxes of urea transported from the river estuaries and sewage outlets to the coastal water. The annual riverine and sewage outlets fluxes of urea used here were classically estimated using the equation:
where Furea is the flux of the urea in the estuaries and sewage outlets; Curea is the average concentration of urea in estuaries and sewage outlets during that period (unit: μmol·L−1), Qurea is the cumulative discharge of river estuaries and sewage outlets; its unit is m3·d−1.
Furea = Curea × Qurea,
2.5. Statistical Analyses
The geographic information system ArcGIS (10.2) (Esri corporation, New York, NY, USA) was used to map the monitoring stations of the ZJB coastal water and terrestrial sources. The map of the urea spatial distribution in surface water was drawn by Ocean Data View (4.0) [47], using weighted average gridding, and the seasonal variations were assessed by one-way analysis of variance (one-way ANOVA) in SPSS 22 software (IBM Corporation, Chicago, IL, USA) [48]. The hypothesized population mean for the urea data used the 95% confidence interval about the mean concentration. The significance level α was set as 0.05. When the p value is lower than 0.05, it means the average concentration of urea was significantly different among the seasons. The urea flux map of terrestrial source and assessment of DON bioavailability was drawn by Origin (9.0) software (Origin Lab Corporation, Northampton, MA, USA). The investigation data were processed using Microsoft Excel 2016 software (Microsoft Corporation), Washington, DC, USA). The average data in this paper are expressed as the arithmetic mean ± standard deviation (mean ± SD).
3. Results
3.1. Spatiotemporal Distribution of Urea Concentration in the ZJB Adjacent Surface Coastal Water
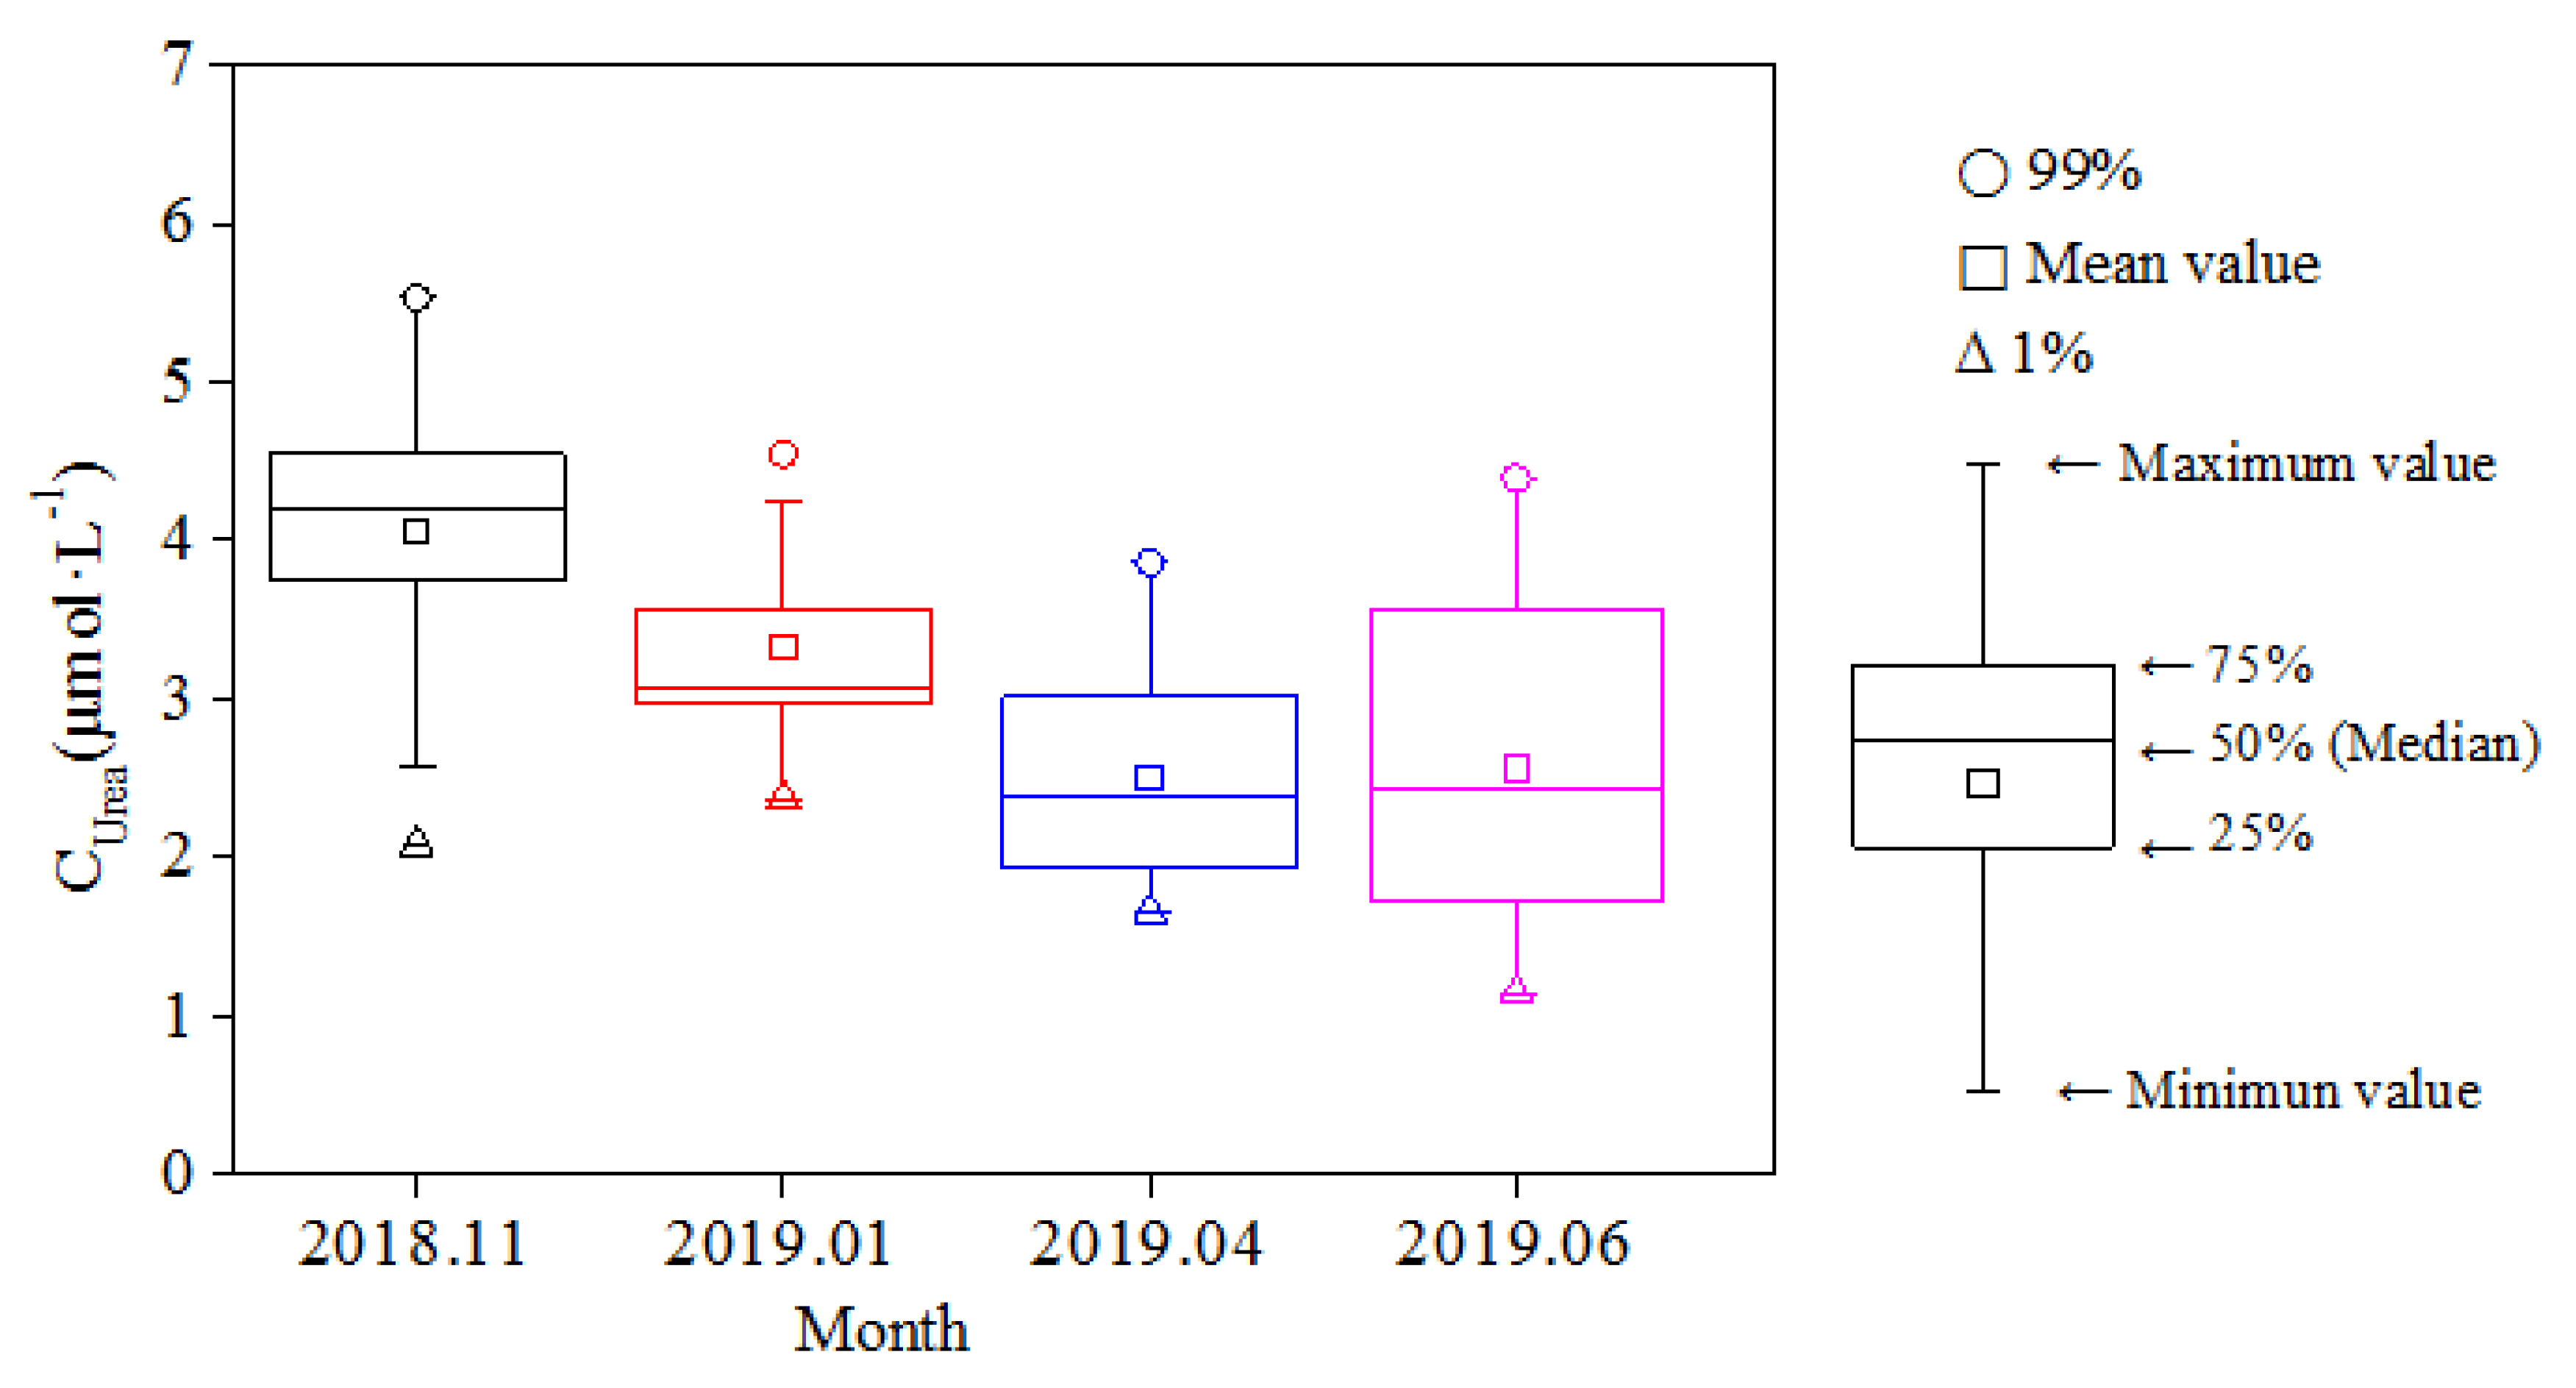
Urea concentrations in surface seawater revealed seasonal and spatial differences by one-way ANOVA in SPSS 22 software (p < 0.05) (Figure 2). During the investigation period from 2018 to 2019, the concentration of urea in the ZJB surface water fluctuated from 1.14–5.53 μmol·L−1, with an average concentration of 3.13 ± 1.02 μmol·L−1 (Figure 3). The urea concentration in the ZJB decreased from autumn to winter, then decreased again in spring, and slightly increased in summer. The maximum and minimum values occurred in autumn and spring, respectively (Figure 3). In addition, the average urea concentration in November 2018 (autumn) was 4.05 ± 0.86 μmol·L−1, with a range from 2.08 μmol·L−1 to 5.53 μmol·L−1 (Table 2). In January 2019 (winter), the range of urea concentrations in the ZJB surface water was 2.37–4.55 μmol·L−1, and the average urea concentration was 3.32 ± 0.54 μmol·L−1 (Table 2). In addition, the urea concentration of surface water in April 2019 (spring) averaged 2.50 ± 0.66 μmol·L−1, with a range of 1.66–3.86 μmol·L−1 (Table 2). The average urea concentration in June 2019 (summer) was 2.57 ± 0.99 μmol·L−1, and the concentration ranged from 1.14 μmol·L−1 to 4.39 μmol·L−1 (Table 2).
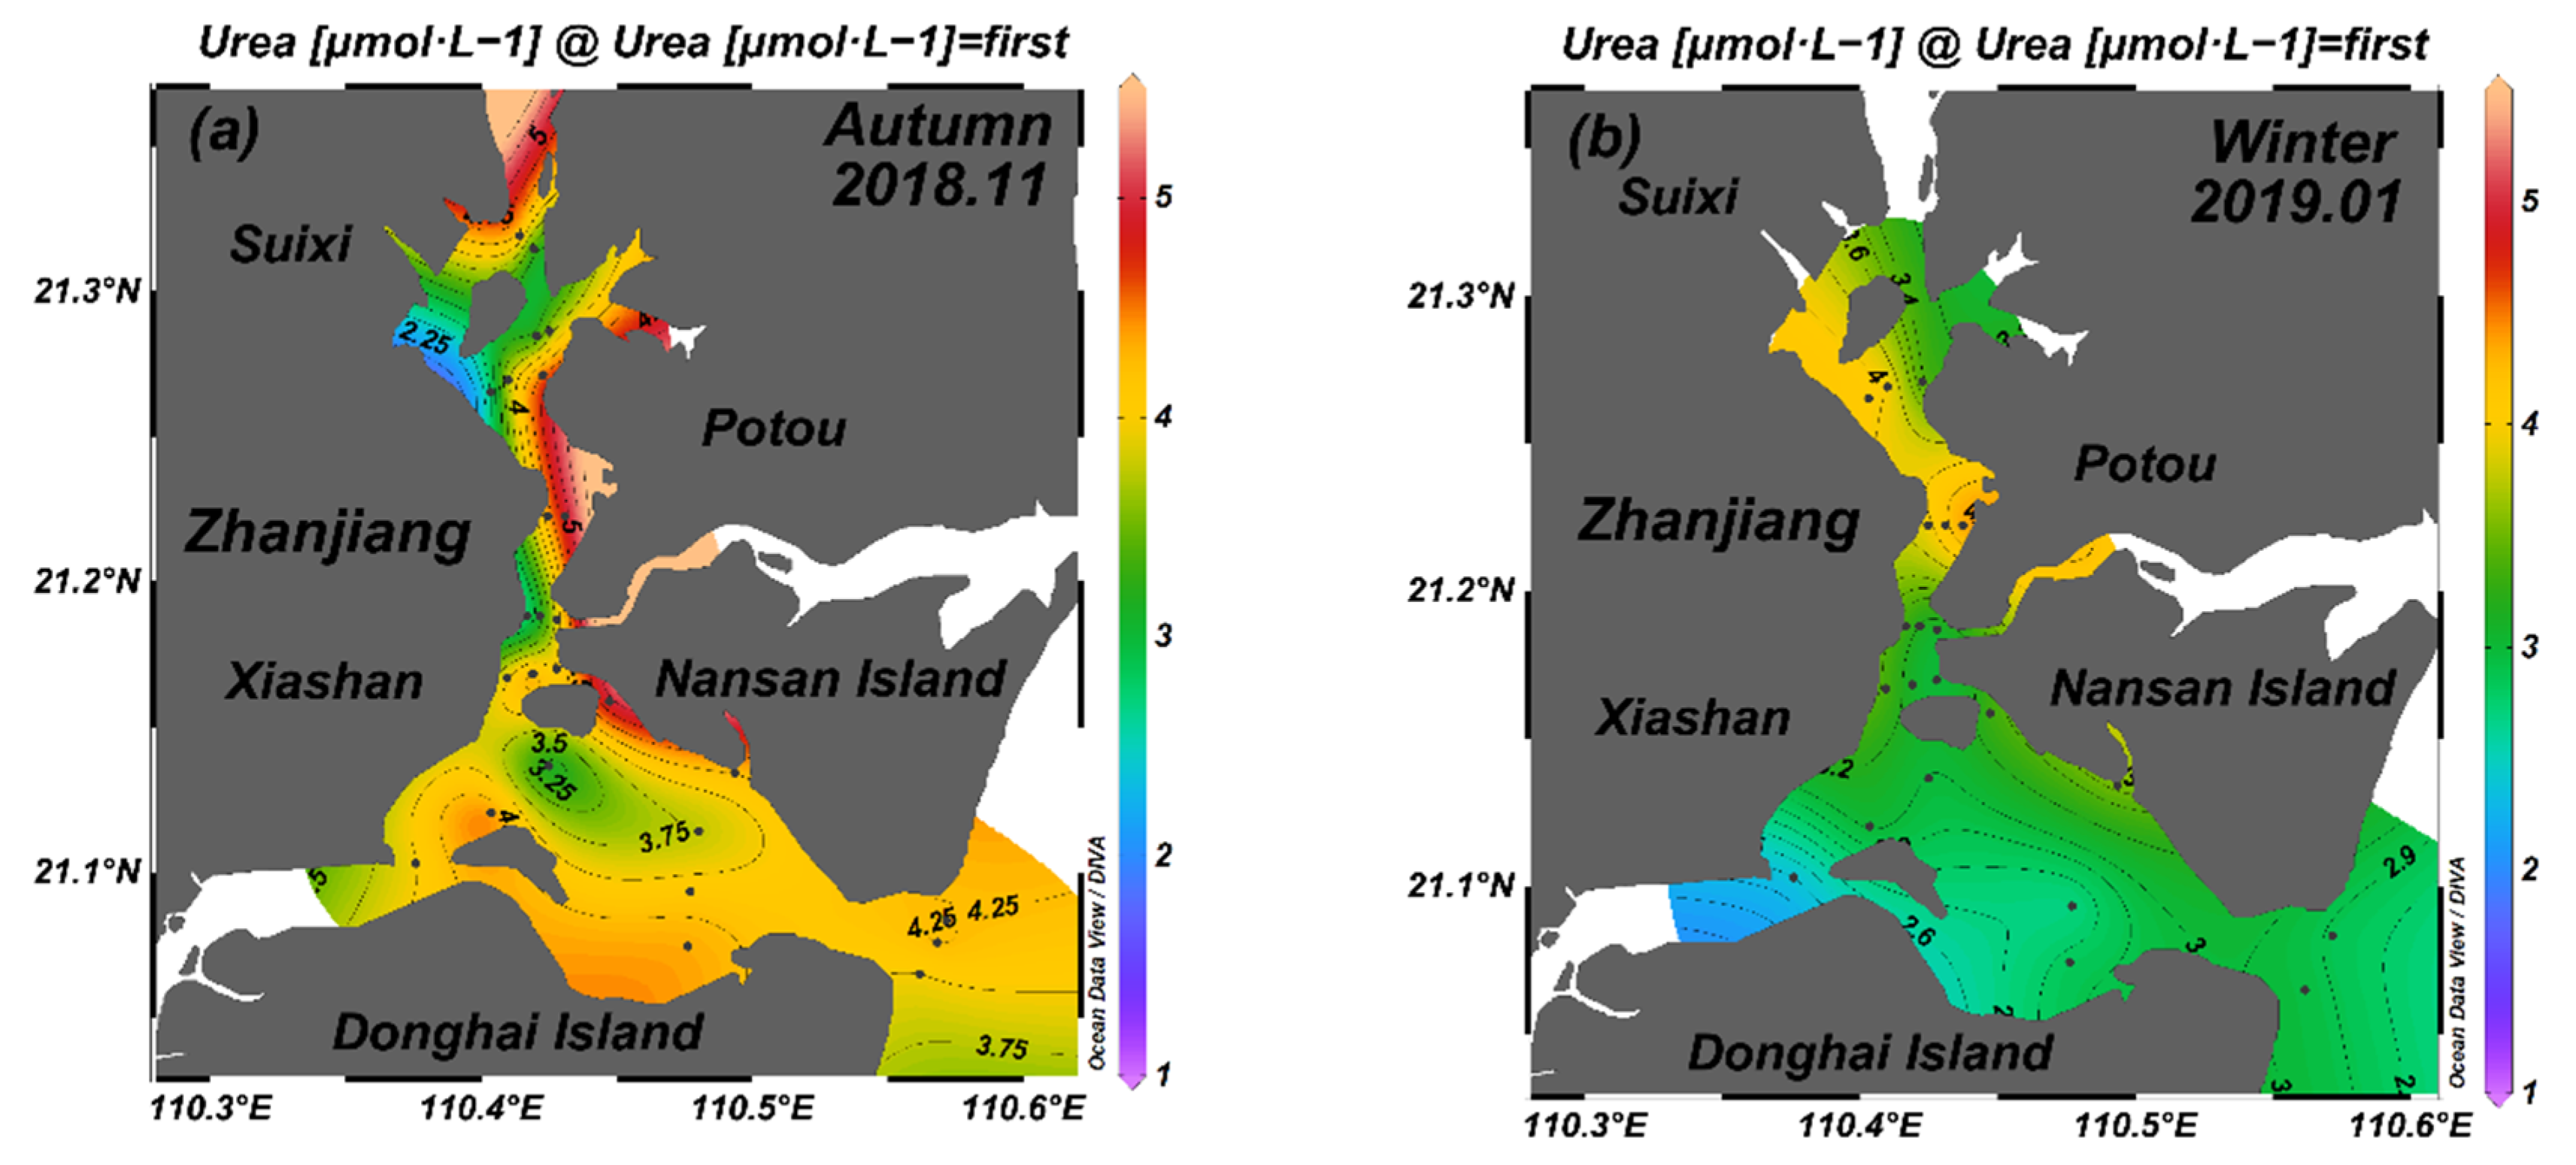
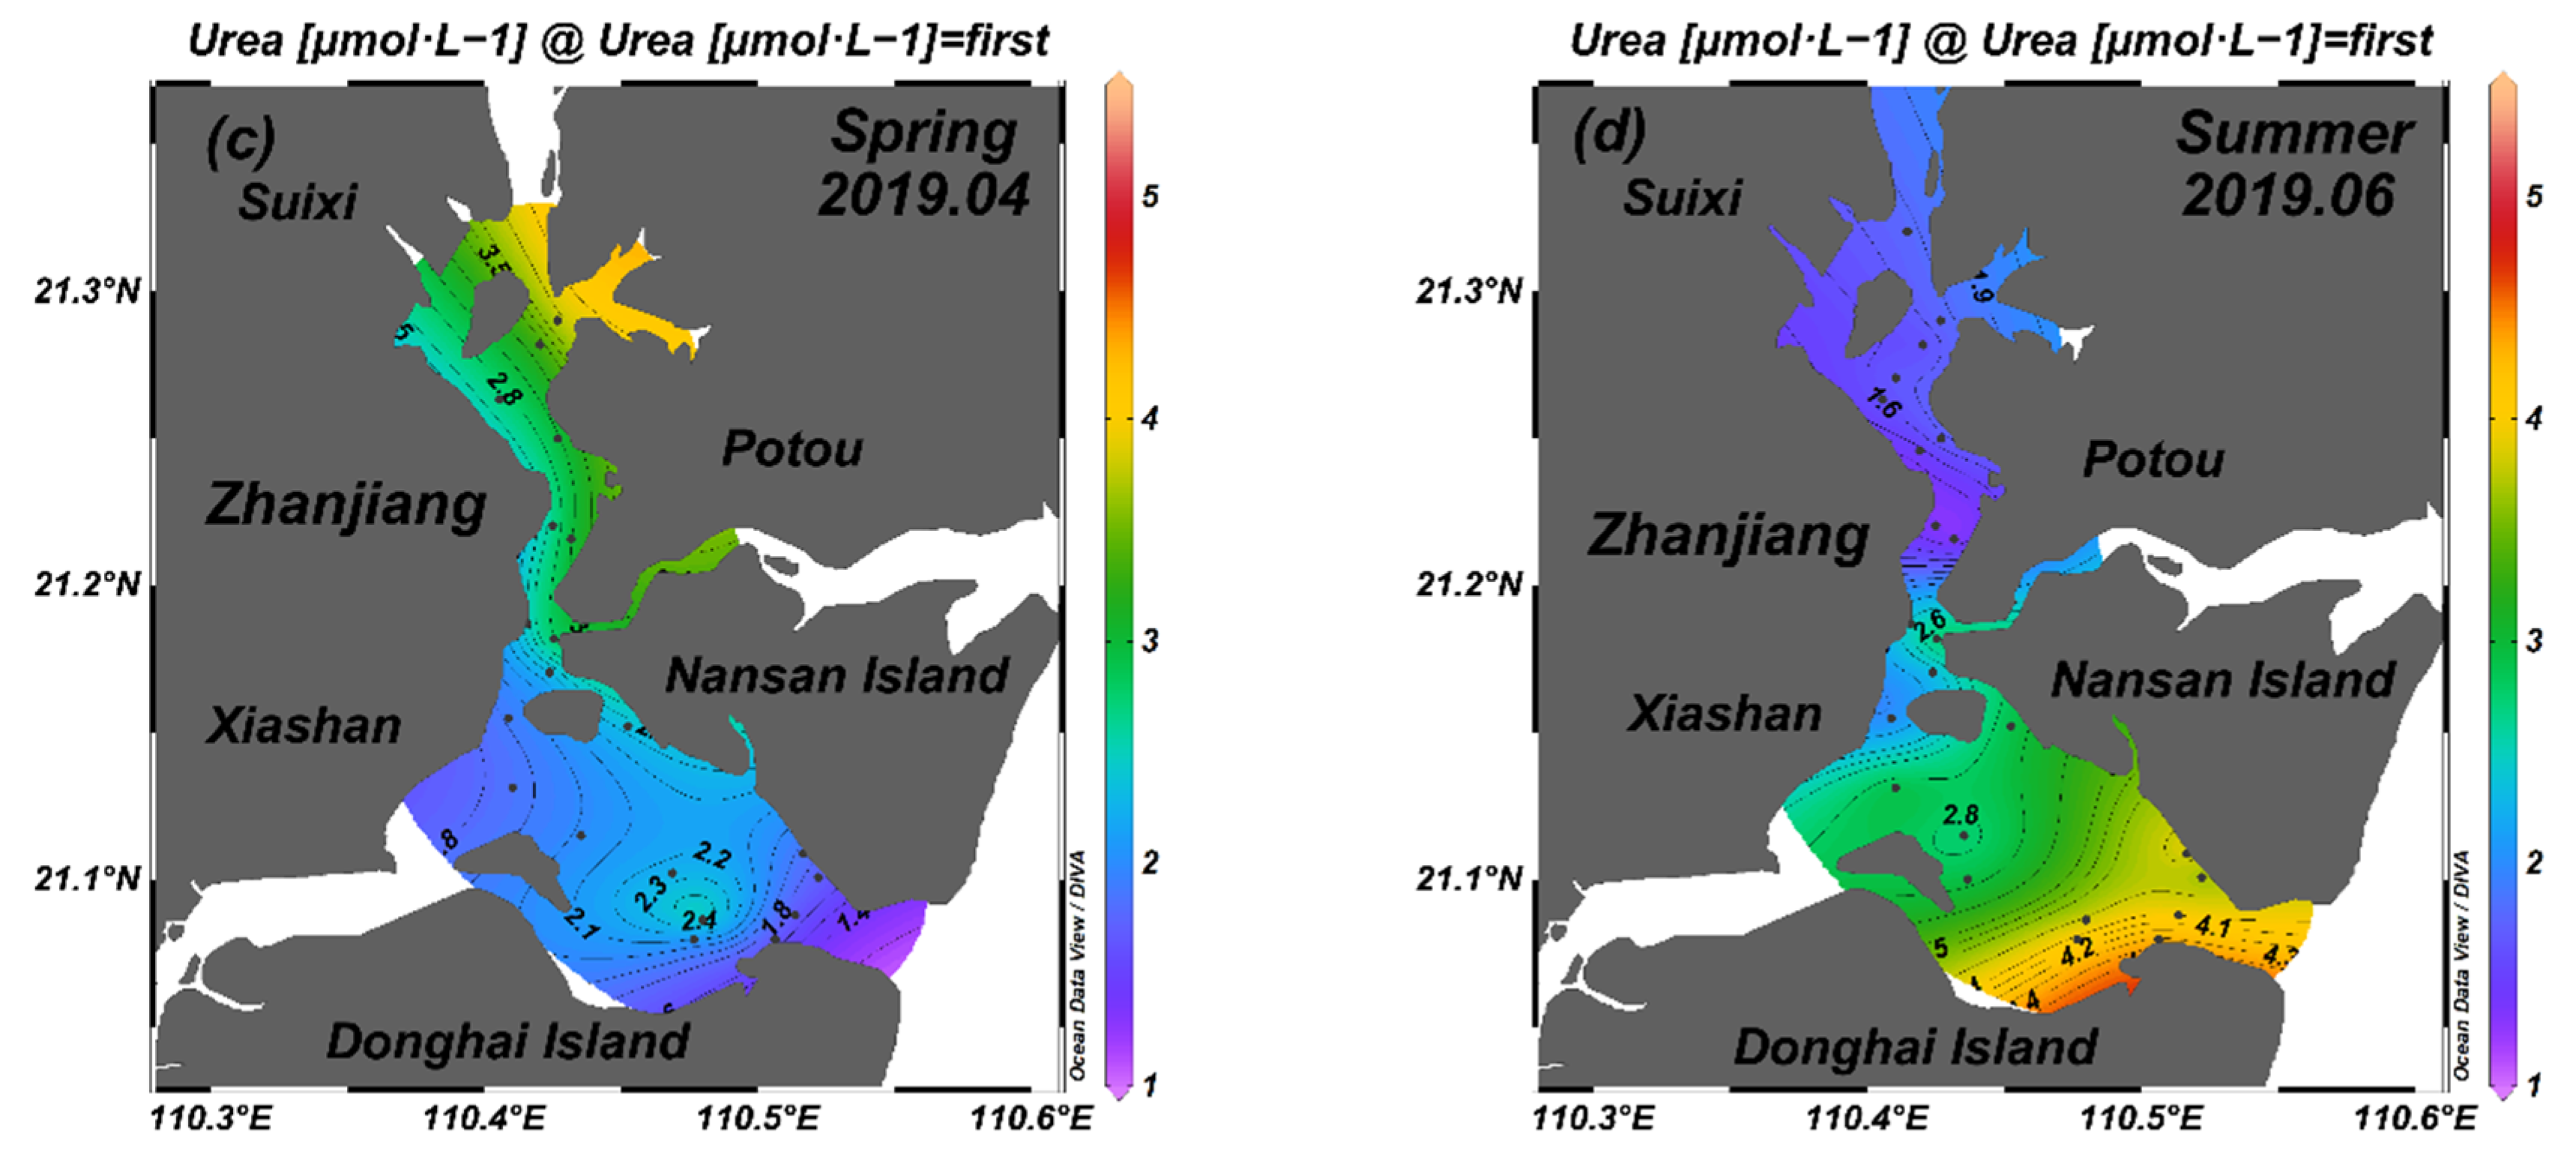
From the spatial pattern, the distribution of urea concentration in the ZJB showed significant differences. (Figure 2). In November 2018 (autumn), the distribution of urea in the ZJB showed high concentrations, in particular, in the coastal waters of Suixi estuary and Potou District (Figure 2a), whereas low urea concentrations were found in a large area at the mouth of ZJB in January (Figure 2b). In both seasons, the main feature of urea distributions in the ZJB was the occurrence of higher concentrations in areas adjacent to Potou and Xiashan districts. In April 2019 (spring), the horizontal distribution of urea had a similar trend. The lowest urea concentration was found in the mouth of the ZJB (Figure 2c). The horizonal distribution of urea concentration in June 2019 (summer) was different from that in the other three months (Figure 2d). High urea concentrations were found in the Donghai Island adjacent seawater of the ZJB.
3.2. Seasonal Variation in Urea from Terrestrial Sources in the ZJB
3.2.1. Spatiotemporal Distribution of Urea Concentration in the Estuaries and Sewage Outlets
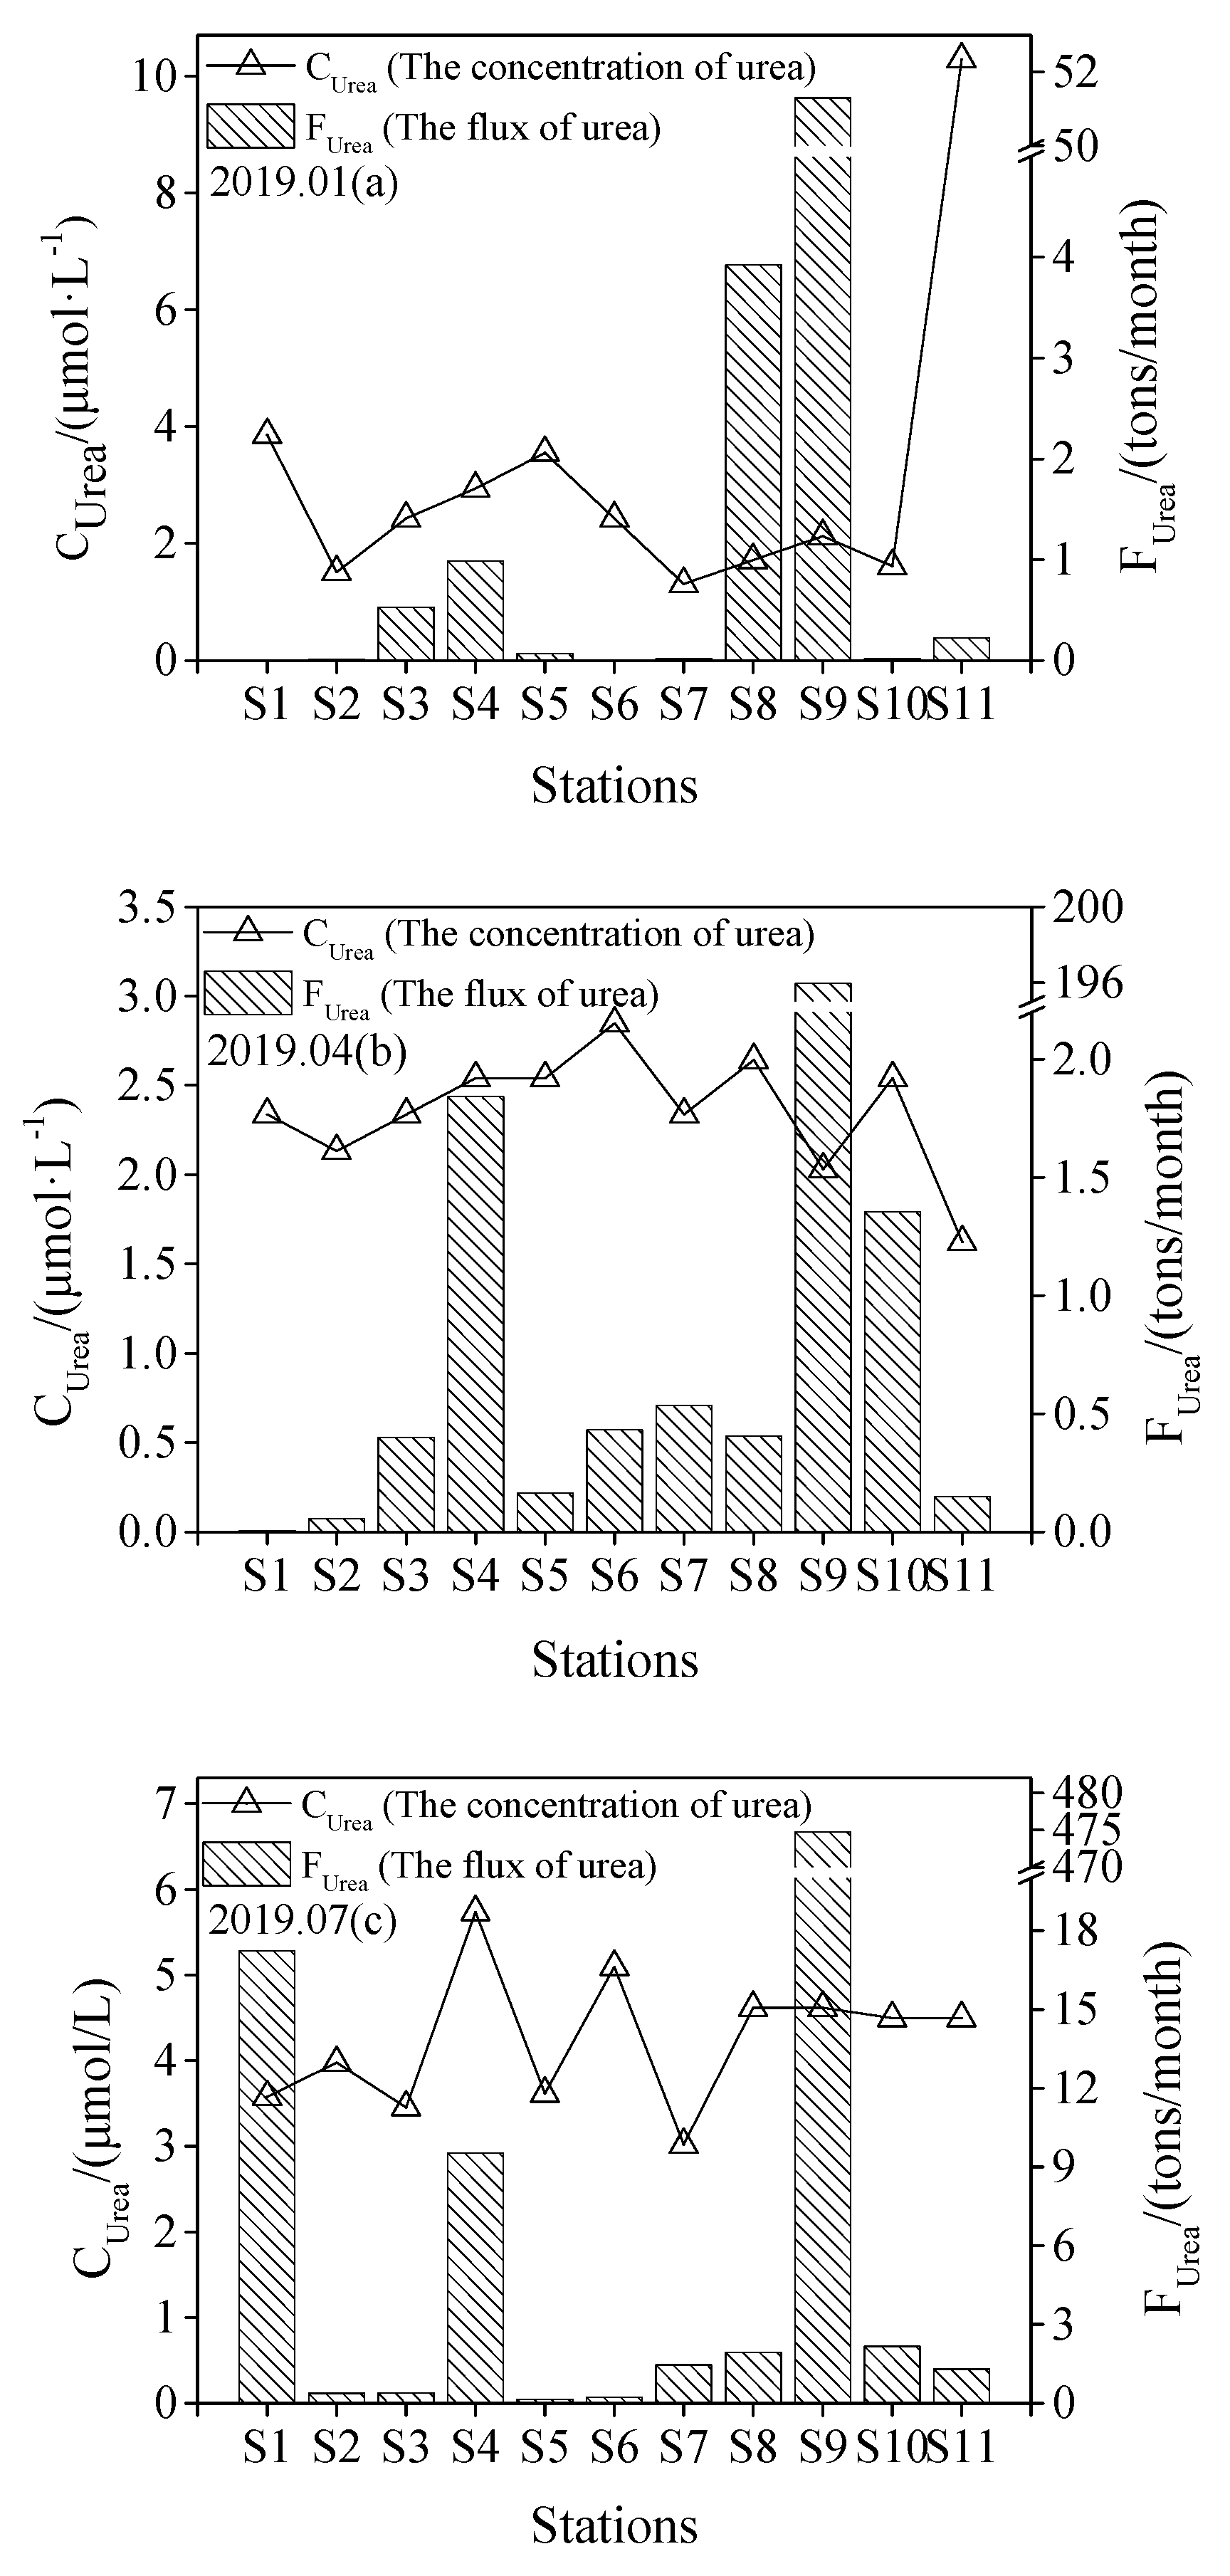
In this survey, urea concentrations of estuaries and sewage outlets surrounding the ZJB were different in different seasons (Figure 4). The concentrations of urea were significantly different among the three monitoring seasons (p < 0.05). During the three water flow seasons, the mean urea concentration was maximized in the wet season, then the dry season, and exhibited minimum concentrations in the normal season. Among the different seasons in the estuaries and sewage outlets, the minimum and maximum urea concentrations were 1.31 μmol·L−1 and 10.29 μmol·L−1, respectively. In January 2019 (dry season), the average urea concentration was 3.07 ± 2.42 μmol·L−1, and the urea concentration ranged from 1.31 to 10.29 μmol·L−1. In addition, the mean urea concentration at the sewage outlets in April 2019 (normal season) was lower than that in January. In April (normal season), the average urea concentration was 2.34 ± 0.30 μmol·L−1. The highest urea concentration reached 2.75 μmol·L−1. Furthermore, the urea concentration at the estuary and sewage outlets increased in July 2019, and the average concentration was about 4.25 ± 0.76 μmol·L−1. The maximum and minimum urea concentrations were 5.74 μmol·L−1 and 3.02 μmol·L−1, respectively. In terms of spatial variability, the urea concentrations were differently distributed in the estuaries and sewage outlets in the ZJB. The maximum and minimum urea concentrations occurred at the Potou primary school sewage outlet (S11) and Jinsha Bay sewage outlet (S7), respectively. On one hand, in estuaries, the highest urea concentration was 3.72 μmol·L−1, located at Nanliu River estuary (S4), which was significantly higher than that of the other sewage outlets. The lowest urea concentration occurred in Hongxing estuary (S3), which was 2.74 μmol·L−1. On the other hand, the urea concentrations of Potou primary school (S11) and Jinsha Bay (S7) sewage outlets were 5.47 μmol·L−1 and 2.22 μmol·L−1, respectively. They were also the respective highest and lowest values for sewage outlets.
3.2.2. Flux of Urea in Estuaries and Sewage Outlets Discharged into the ZJB
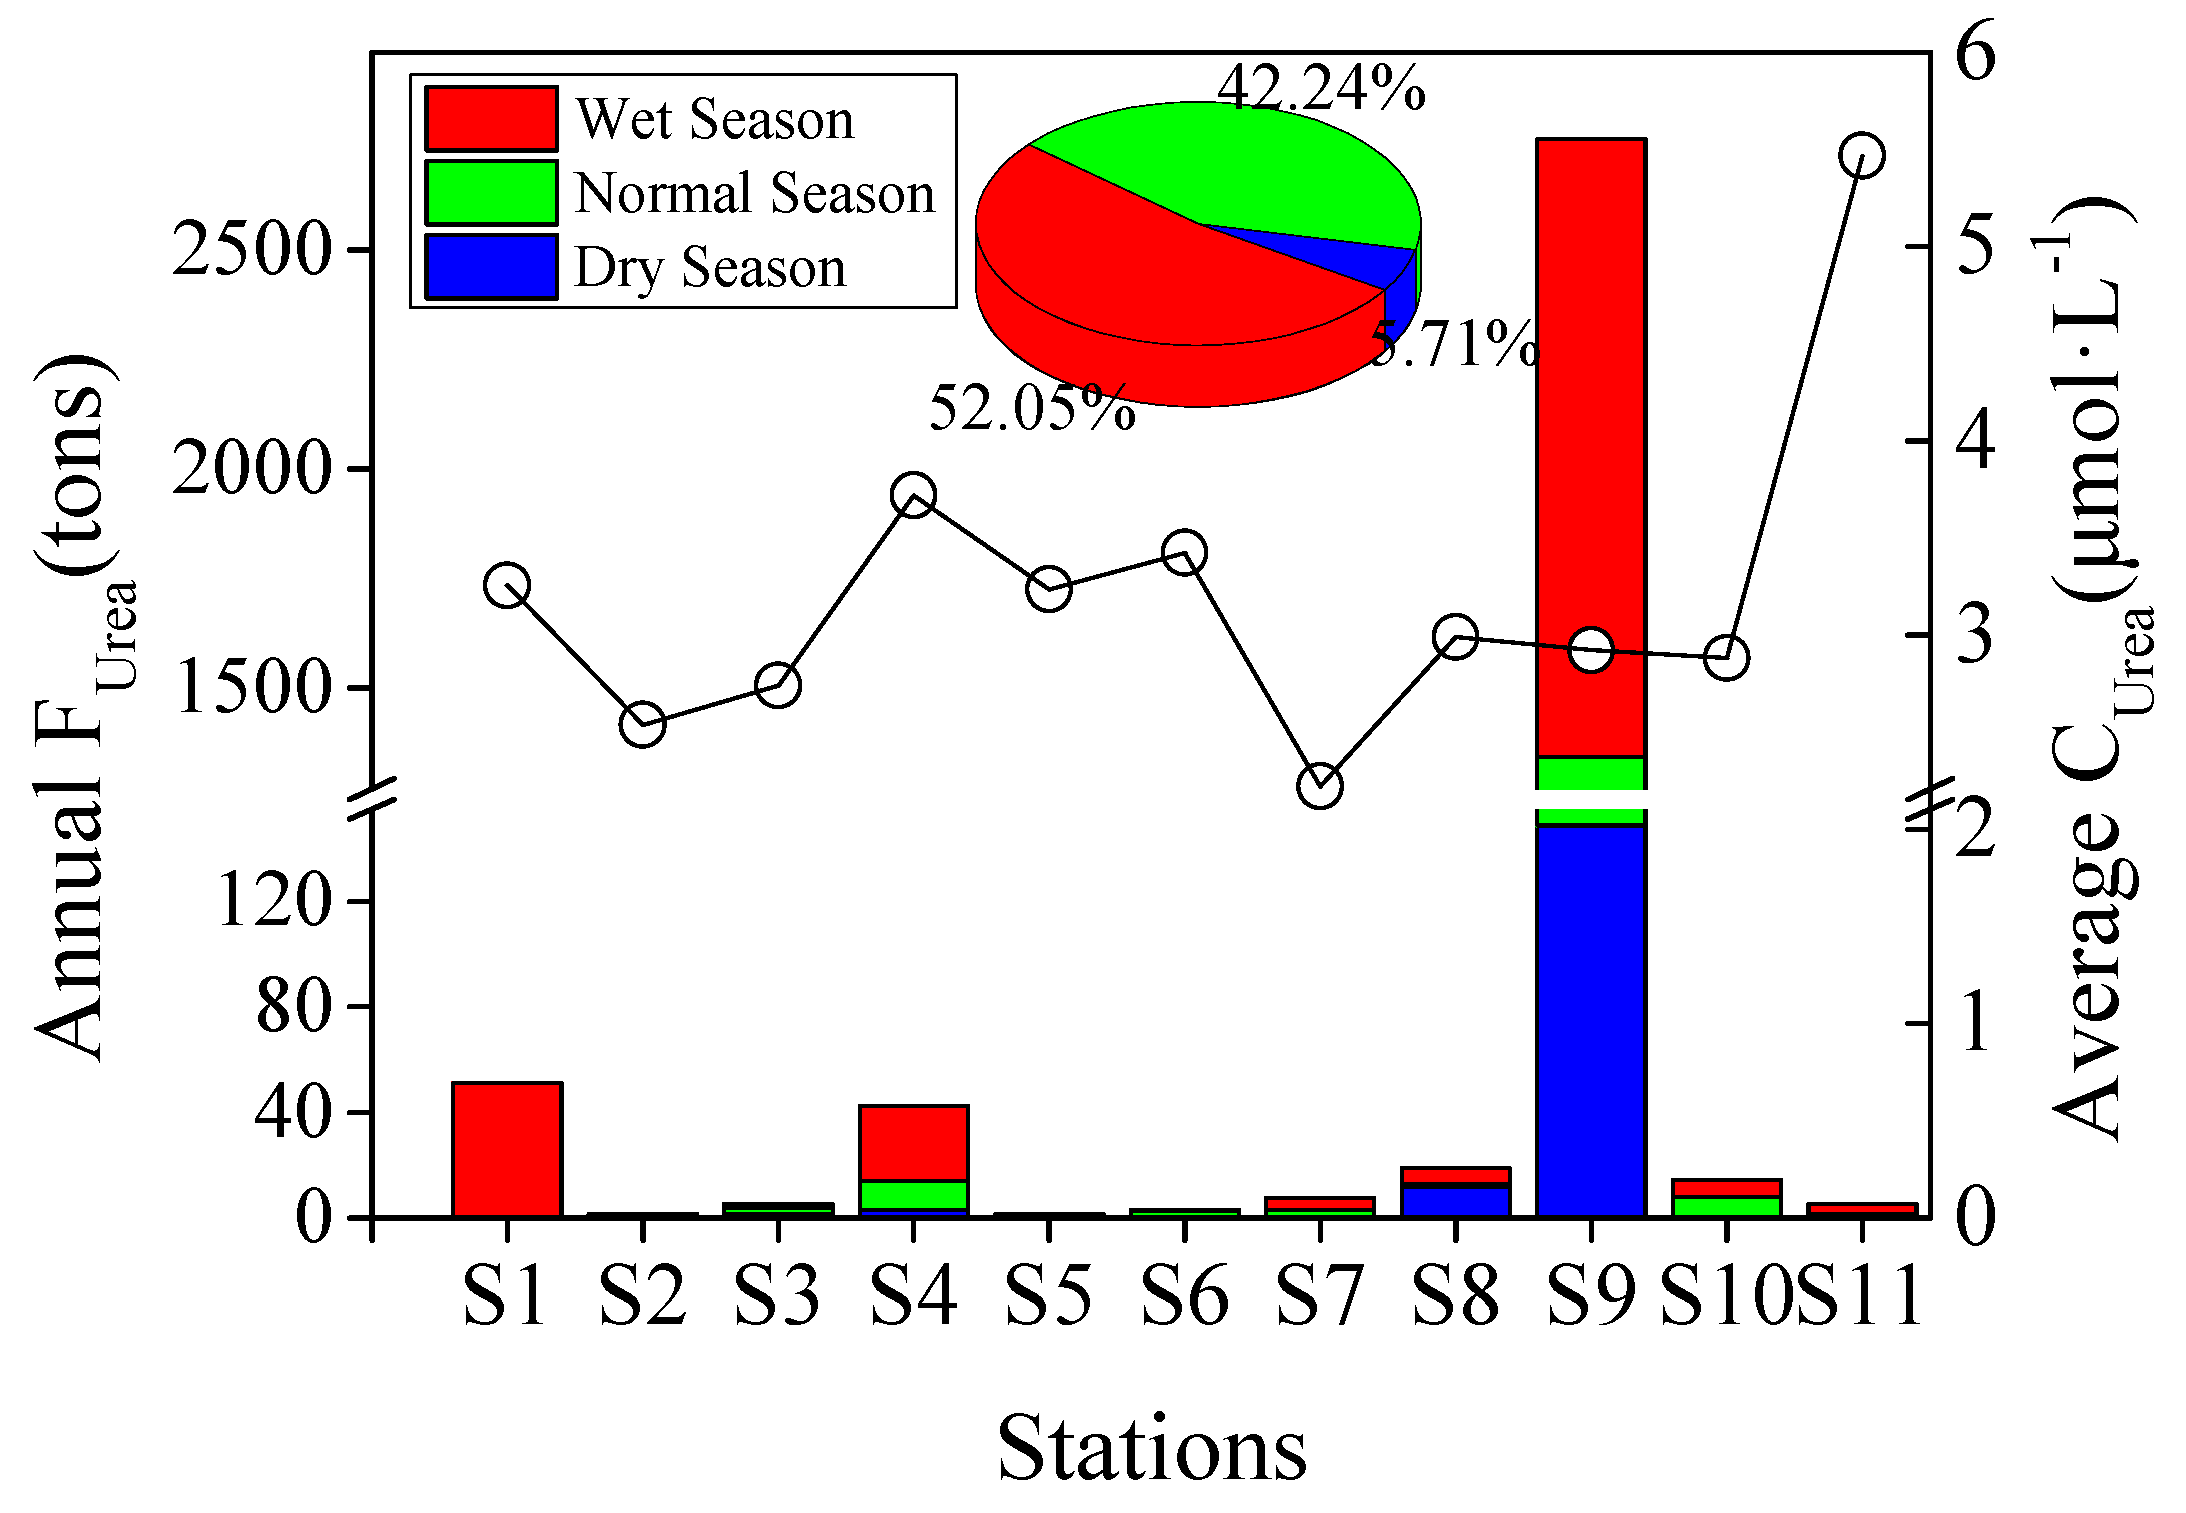
Among the 11 terrestrial source monitoring stations in the ZJB (Figure 1), the fluxes of urea entering into the coastal water were significantly different during the three periods (p < 0.05). The total flux of urea pollutants in January, April, and July was 57 tons, 201 tons, and 510 tons, respectively. The highest urea flux was found in Suixi River estuary (S9), which is located at the bottom of the bay. Suixi River estuary (S9) contributed 51 tons of urea in January and 196 tons in April, accounting for 89.47% and 97.51% of the total flux, respectively. The urea pollutant flux of Donghai Island aquaculture sewage outlet 1 (S1) was the lowest in the two periods, i.e., 0.002 tons and 0.004 tons, which accounted for 0.004% and 0.002%, respectively, of the total flux. In comparison with the dry season and normal season, the entire amount of urea pollution flowing into the sea during the wet season had an evident increase, reaching 510 tons. The urea flux of Suixi River estuary (S9) was still the highest load, with 475 tons of urea. Because it accounted for 93.14% of the total value, the Suixi River estuary (S9) made a great contribution to the urea concentration of ZJB. The lowest value appeared in Lvtang River estuary (S5), which had 0.14 tons, only accounting for 0.02%. According to the flux of urea pollutants flowing into the sea in January, April, and July 2019, fluxes during the dry, normal, and wet season period were estimated in one year, which were 166 tons, 1227 tons, and 1512 tons, respectively. Then, the annual flux of urea discharged into the JZB was 2905 tons, of which the dry season accounted for 5.71%, the normal season accounted for 42.24%, and the wet season accounted for 52.05%.
3.3. Assessment of DON Bioavailability Based on Urea Concentration in the ZJB Coastal Water
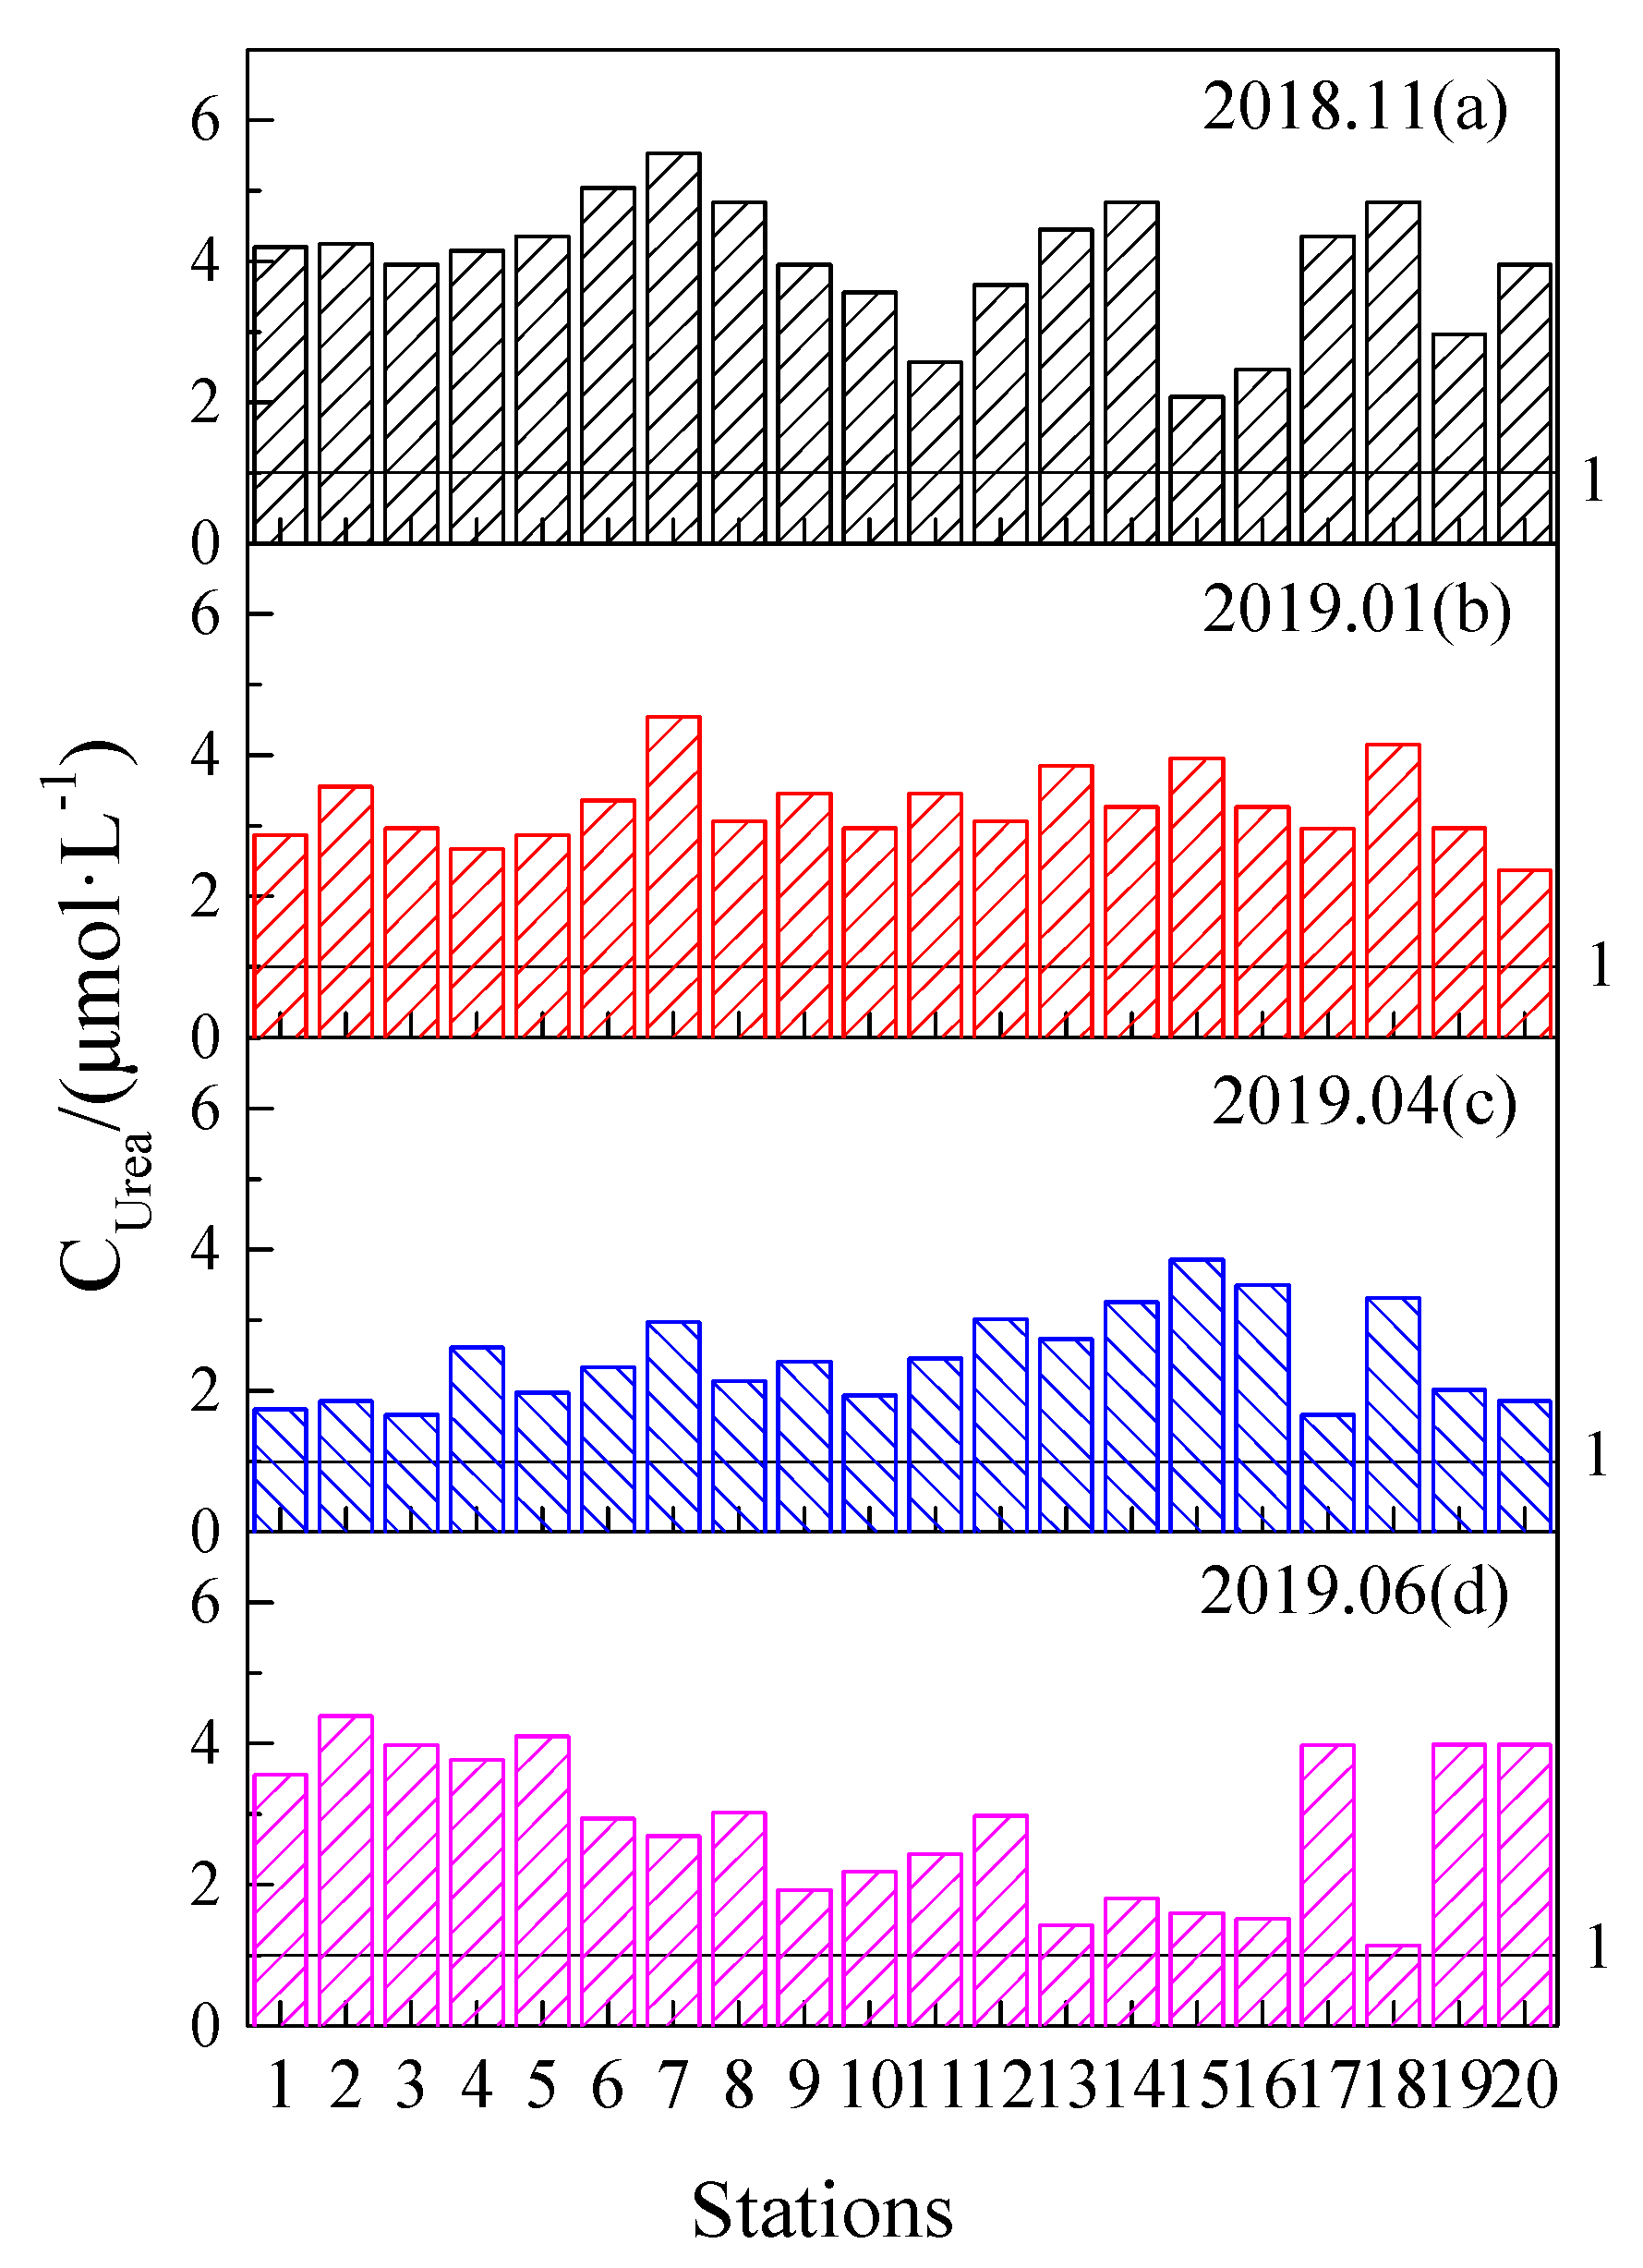
Both the relative and absolute urea concentration of seawater can be used to indicate the bioavailability of DON. In general, when the absolute urea concentration in the water exceeds 1 μmol·L−1 or the proportion of urea in DON exceeds 0.05, urea can be used as an effective nitrogen source to promote the growth of phytoplankton [31,32]. Associated increases in the urea concentration and of the frequency of HAB have been reported in several coastal zones [15]. It has been suggested that the ability to use urea could be an important driver of phytoplankton community composition [49]. This study results indicated that all urea concentrations in ZJB during different seasons were much higher than 1 μmol·L−1 (Figure 5). This meant that surface seawater in the ZJB had a high level of bioavailable DON, and urea cannot be neglected as a key species of DON. In different seasons, the mean urea concentrations were 4.05 ± 0.86 μmol·L−1, 3.32 ± 0.54 μmol·L−1, 2.50 ± 0.66 μmol·L−1, and 2.57 ± 0.99 μmol·L−1 in November, January, April, and June, respectively. This indicated that while highly variable in season, the potential contribution of urea to eutrophication cannot be ignored in the ZJB. The urea concentrations as bioavailable DON in the ZJB coastal water may be linked to seasonal marine ecological problems in the future.
4. Discussion
4.1. Comparison of Urea Concentration in the ZJB with Other Estuaries and Bays around the World
During the investigation period, the results showed that the urea concentration in the ZJB surface seawater presented a significant spatiotemporal distribution. In terms of the spatial distribution, the results showed that the hot-spot of urea concentrations in different seasons was mainly located in the north and northeast of the ZJB in November 2018 and in January and April 2019 (Figure 2). On the contrary, urea concentration in June 2019 was high in offshore water of the southern bay and low nearshore of the northern bay. Due to the local aquaculture activities, sediment emission and effects of phytoplankton, microbial growth and metabolism, or precipitation changes in Zhanjiang, the high value could appear in the Donghai Island adjacent coastal water as well [50].
The range of urea concentration and the high value in the ZJB were similar to the tropical marine coastal water of Haikou Bay [51], but its low concentration was higher than that of Chesapeake Bay in the United States [52], Florida Bay in the United States [52], Manokin Estuary in Maryland [52], Monterey Bay in Canada [53], Jiaozhou Bay [54], Daya Bay [55], and others coastal waters in China (Table 3). One of the reasons is that the ZJB, as a semi-enclosed bay, has poor hydrodynamic exchange conditions due to the impact of reclamation projects, especially in the northern and northeastern waters of the bay [56]. Pollutions has accumulated in this area for a long time and could not spread, resulting in nitrogen pollution being more serious than in other sea areas in the bay. The urea concentration of ZJB changed apparently in different seasons, which showed the same regulation with the result of discharge of terrestrial inputs in Jiaozhou Bay during the 2011–2012 period [54,57]. From the comparison of terrestrial and seawater urea concentration in 2018–2019, the range of urea concentration from terrestrial sources was much greater than that of seawater, i.e., 1.31–10.25 μmol·L−1 and 2.08–5.53 μmol·L−1, respectively. This situation showed that terrestrial source input affected the urea concentration in seawater. The urea variation in coastal water can be influenced by terrestrial sources, marine biological processes, and coastal water hydrodynamics with spatial differences. On one hand, the variation of urea from terrestrial sources in the ZJB was different, especially in the river flow and waste water discharge change (Figure 3). On the other hand, the coastal water hydrodynamics played a key role in the spatial distribution. In many months, the high water-exchange capacity can accelerate urea diffusion in the mouth of the ZJB in comparison to inner bay water areas, leading to low urea concentrations. Furthermore, the marine biological activities also change with the seasonal variation.
4.2. The Concentration Variation and Sources of Urea in ZJB
Due to the changing terrestrial fluxes in different seasons, the result indicated that the sources and the influential factors of urea of different seasons in the ZJB were different. From the annual urea fluxes of 11 terrestrial stations (Figure 6), the annual urea flux during the investigation was 2905 tons, of which the dry season accounted for 5.71%, the normal season accounted for 42.24%, and the wet season accounted for 52.05%. The flux in the wet season obviously contributed the largest amounts of urea pollutants to the ZJB in the whole year, especially the Suixi River estuary (S9), Donghai Island aquaculture sewage outlet 1 (S1), and Nanliu River estuary (S4). Based on the terrestrial sources of the ZJB, the urea pollutant sources of the Suixi River estuary (S9) may be mainly from agricultural fertilizer application. Suixi River is the largest river discharging into ZJB, and the nitrogen fertilizer entered into rivers due to the rainfall influence. One of the most significant urea pollutant sources of Nanliu River estuary (S4) is waste water discharge from industrial factories, especially petrochemical enterprises and fertilizer plants, located near Nanliu River estuary (S4). The Donghai Island aquaculture sewage outlet 1 (S1) is the center point of aquaculture, of which the urea concentration showed an increasing trend. The artificial feeding and the biological activities of marine plankton may impact the urea concentration. The period of the wet season is not only the most active times of marine organisms but also the peak of irrigation and fertilization in the ZJB. When the rainfall increased substantially in those periods, the flux of urea from surface runoff also increased. The wet season period is the key time when crops require irrigation and fertilization, causing the increase of the terrestrial urea concentration by the nitrogen fertilizer used. At the same time, plankton, microorganisms, and bacteria in seawater excrete and release urea more frequently in this suitable environment during the wet season. At the same time, there is considerable aquaculture in the bay. The growth and metabolism of marine fish would also release urea, leading to some urea discharge into the ZJB.
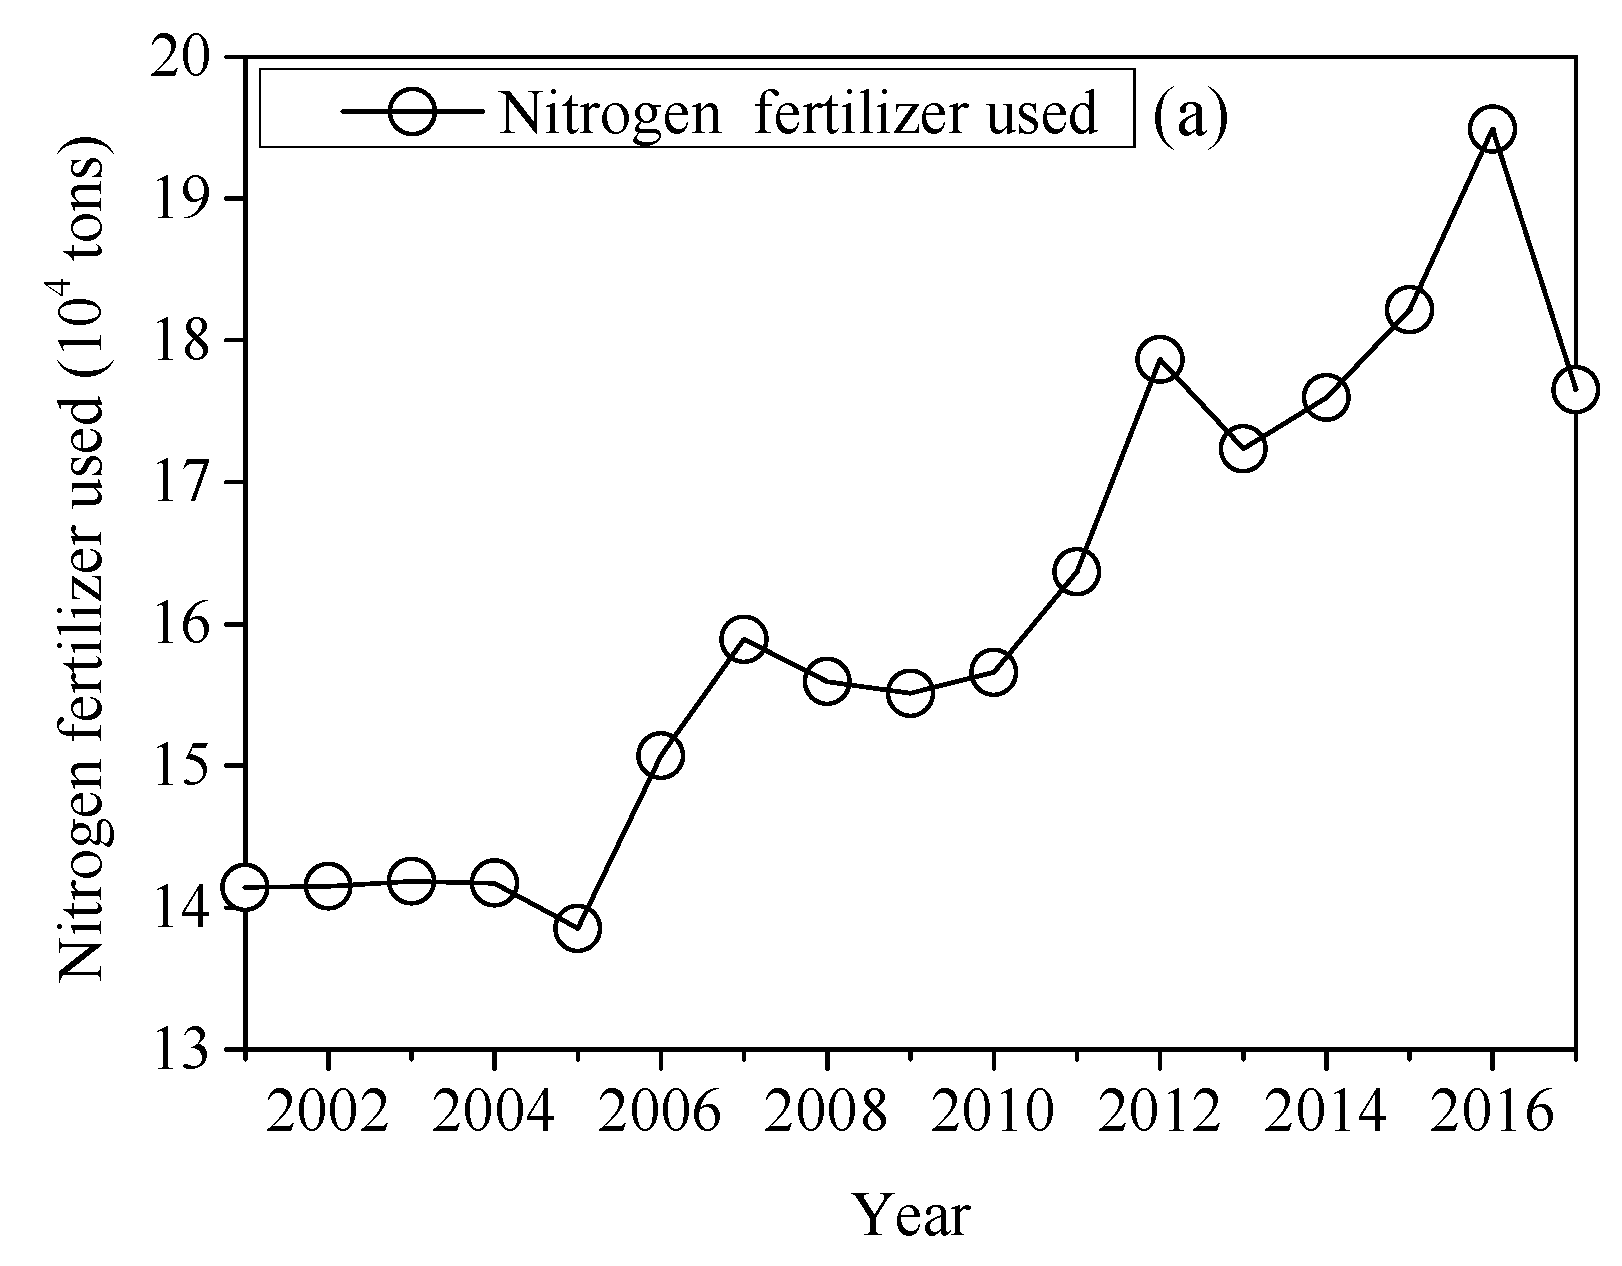
The large urea discharge of terrestrial input in the ZJB every year mainly originated from the presence of the urban estuaries and sewage outlets along the coastline. The most important is the terrestrial sources that have a high urea concentration and may increase the flux of urea input into the ZJB. In the dry season, the sewage outlet of the flood control sluice in Binhu park (S8) played an important role in producing urea pollution, while the Suixi River estuary (S9) still had the highest values, though this assumed that urea discharged from the transportation of terrestrial runoff caused by rainfall was one of the main factors determining the urea concentration in the ZJB waters. In addition, the artificially discharged sewage could not be ignored due to its significant effect. Compared with the annual urea pollution flux from other sewage outlets, the urea flux of the Suixi River estuary (S9) often showed the highest value: it accounted for 94.78% of the whole year, with 2753 tons of pollution. Terrestrial inputs, especially agricultural fertilizer runoffs, might be the major source of urea in the ZJB. This situation is due to the rapid development of the society and economy around the ZJB, which has led to the continuous increase in nitrogen pollutant emissions and water quality deterioration [64,65]. In particular, Potou District and Xiashan District, located on the eastern and western sides of the ZJB, brought about the continuous increase in waste water from sewage outlet discharge. In addition, Zhanjiang is also a large marine aquaculture city, with an increase rate of 42.27% of the marine aquaculture area compared to 2002 (Figure 7). During 2017, the amount of nitrogen fertilizer in Zhanjiang was approximately 175,000 tons. Although it was lower than 2016, it increased by 24.80% over the past few years. One of the fundamental causes of the surge in grain demand was the population growth. These ever-increasing anthropogenic pressures in the ZJB and the catchment were summarized (Figure 7). In general, most of the nitrogen pollutant emissions are caused by the terrestrial input discharge of industrial waste water and domestic sewage, especially runoff from agriculture fields. According to the statistics (Figure 7), the application of fertilizer in Zhanjiang reached 194,900 tons in the year of 2016. With the increasing population, the applications of nitrogen fertilizers in agricultural production, such as urea, have to solve the high demand for grain.
The urea concentration in the seawater was also associated with the excretion of plankton and endogenous effects of marine biology [59]. Zhanjiang has large-scale aquaculture industries, including freshwater and seawater. Similarly, marine aquaculture will accelerate the development of phytoplankton communities; the urea concentration in the water is affected and increased as a consequence [66]. Seasonal changes could be influenced by marine aquaculture in the ZJB, especially in northeastern Donghai Island and Nansan Island adjacent coastal water. For instance, the temperature in winter is low, which reduces the metabolism and food intake of fish, and the number of plankton communities in seawater decreases [60]. Therefore, the urea concentration in the dry season is higher than that in the normal season.
4.3. Assessment of DON Bioavailability Based on Urea Concentration in the ZJB Coastal Water
From 2018 to 2019 in this investigation, the urea concentration was in the range of 1.14–5.53 μmol·L−1 with a mean value of 3.13 ± 1.02 μmol·L−1. All the urea concentrations from each sampling station in different seasons were much higher than 1 μmol·L−1. This indicated that surface seawater in the ZJB has a high level of bioavailable nitrogen, and urea cannot be neglected as a key species of DON. With the development of modern agriculture, urea has been used extensively in plant-product industry processes. This change has occurred to satisfy the world’s demand for food and more agriculture. Long thought to be retained in soils, new data suggest significant overland transport of urea to sensitive coastal waters [16]. Urea concentrations in coastal and estuarine waters can be substantially elevated and represent a large fraction of the DON pool. Under the limited conditions of dissolved inorganic nitrogen in the ZJB, seawater with a high bioavailability of DON may promote a suitable growing environment for marine plankton [27]. Urea is also an important source of nitrogen for plankton communities. Bacteria contribute to urea uptake, but the largest contribution is often due to phytoplankton species, as urea can cover 20–50% of their total nitrogen demand [10,11,15]. This result indicated that the promotion effects on the growth of phytoplankton should not be ignored. Furthermore, with high bioavailability of DON, the ZJB is faced with a eutrophication problem. A study showed that the level of eutrophication in the ZJB, especially in the northern waters in 2007, has increased obviously in recent decades, resulting in the dangerous problem of HAB [68]. The most effective actions to reduce the HAB risk and impacts will be continued efforts to reduce both inorganic and organic nutrients entering coastal waters [69].
5. Conclusions
Based on the seawater sampling investigation results of the ZJB from 2018 to 2019, significant seasonal variation differences in urea concentration were observed in the surface seawater of the ZJB (p < 0.05). High average concentrations of urea occurred in November 2018, reaching 4.05 ± 0.86 μmol·L−1, while the lowest concentration was 2.50 ± 0.66 μmol·L−1 in April 2019. In terms of spatial distribution, the urea concentration distribution in the ZJB showed that the coastal waters with high urea concentrations were mainly distributed in the nearshore estuaries and the middle of the ZJB. In addition, the surface seawater in the ZJB had a high level of bioavailable nitrogen, and urea could not be neglected as a key species of DON. During 2019, the range of urea concentration of terrestrial source inputs in the ZJB was 1.31–10.29 μmol·L−1, and the average urea concentration reached 3.22 ± 0.82 μmol·L−1. The total urea flux surrounding the ZJB was 2905 tons. The JZB was subjected to a large load of urea by estuaries and sewage systems. The seasonal variation of urea from terrestrial sources in the ZJB was significant (p < 0.05). The total flux of urea pollutants in dry, wet, and normal seasons accounted for 5.71%, 52.05%, and 42.24%, respectively, of the annual load. The highest input flux of urea occurred in the wet season and the lowest was in dry season. Furthermore, the terrestrial source inputs, such as agricultural nitrogen fertilizer runoff, were the most important factor which significantly affected the urea concentration in the ZJB. As the bioavailable nitrogen source of phytoplankton, the ability of terrestrial source-derived urea to promote the growth of phytoplankton should not be ignored in the ZJB.
Author Contributions
Conceptualization, P.Z.; methodology, P.Z. and J.-B.Z.; software, C.-H.P.; validation, C.-H.P. and Z.-B.Z.; formal analysis, C.-H.P.; investigation, J.-B.Z. and P.Z.; resources, P.Z. and J.-B.Z.; data curation, C.-H.P; writing—original draft preparation, P.Z.; writing—review and editing, P.Z., C.-H.P. and H.Z.; visualization, C.-H.P.; supervision, L.-R.Z. and Y.-Z.S.; project administration, P.Z.; funding acquisition, P.Z. and J.-B.Z. All authors have read and agreed to the published version of the manuscript.
Funding
This research was funded by Guangdong Ocean University (GDOU)’s University Scientific Research Fund for a Ph.D Start-up, (No. R18021), the Science and Technology Special Project of Zhanjiang city (2019B01081), and the First-class Special Funds of Guangdong Ocean University (231419018).
Acknowledgments
The authors are grateful for the anonymous reviewers’ careful review and constructive suggestions to improve the manuscript. Thanks are given to Guangdong Ocean University (GDOU)’s University Scientific Research Fund for the Ph.D start-up, (No. R18021), the Science and Technology Special Project of Zhanjiang city (2019B01081), and the First-class Special Funds of Guangdong Ocean University (231419018).
Conflicts of Interest
The authors declare no conflict of interest.
References
- Kart, D.M.; Michaels, A.F. Nitrogen cycle. In Encyclopedia of Ocean Science, 2nd ed.; Steele, J.H., Ed.; Academic Press: Waltham, MA, USA, 2008; pp. 32–39. [Google Scholar]
- Garrison, T.; Eills, R. Life in the ocean. In Oceanography; Graphic World Inc.: Boston, MA, USA, 2014; pp. 369–391. [Google Scholar]
- Sipler, R.E.; Bronk, D.A. Dynamics of dissolved organic nitrogen. In Biogeochemistry of Marine Dissolved Organic Matter, 2nd ed.; Dennis, A.H., Craig, A.C., Eds.; Academic Press: San Diego, CA, USA, 2015; pp. 127–213. [Google Scholar]
- Berman, T.; Bronk, D.A. Dissolved organic nitrogen: A dynamic participant in aquatic ecosystems. Aquat. Microb. Ecol. 2003, 31, 279–305. [Google Scholar] [CrossRef]
- Nagao, F.; Miyazaki, T. Release of dissolved organic nitrogen from Scenedesmus quaricauda (Chlorophyta) and Microcystis novcekii (Cyanobacteria). Aquat. Microb. Ecol. 2002, 27, 275–284. [Google Scholar] [CrossRef]
- Flynn, K.J.; Berry, L.S. The loss of organic nitrogen during marine primary production may be significantly overesti-mated when using 15N substrates. Proc. R. Soc. Lond B 1999, 266, 641–647. [Google Scholar] [CrossRef] [Green Version]
- Bratbak, G.; Jacobsen, A.; Heldal, M. Viral lysis of Phaeocystis pouchetii and bacterial secondary production. Aquat. Microb. Ecol. 1998, 16, 11–16. [Google Scholar] [CrossRef]
- Alam, M.S.; Casareto, B.E.; Suzuki, Y.; Sultana, R.; Suzuki, T. Optimization of dissolved urea measurements in coastal waters with the combination of a single reagent and high temperature. J. Oceanogr. 2017, 73, 249–258. [Google Scholar] [CrossRef]
- Antia, N.J.; Harrison, P.J.; Oliveira, L. The role of dissolved organic nitrogen in phytoplankton nutrition, cell biology, and ecology. Phycologia 1991, 30, 1–89. [Google Scholar] [CrossRef]
- Solomon, C.M.; Jackie, L.C.; Gry, M.B.; Patricia, M.G. Role of urea in microbial metabolism in aquatic systems: A biochemical and molecular review. Aquat. Microb. Ecol. 2010, 59, 67–88. [Google Scholar] [CrossRef]
- Bronk, D.A. Dynamics of DON. In Biogeochemistry of Marine Dissolved Organic Matter; Hansell, D.A., Carlson, C.A., Eds.; Academic Press: London, UK, 2002; pp. 153–247. [Google Scholar]
- Cozzi, S. A new application of the diacetyl monoxime method to the automated determination of dissolved urea in seawater. Mar. Biol. 2004, 145, 843–848. [Google Scholar] [CrossRef]
- Aminot, A.; Kerouel, R. Dosage automatique de l’urée dans l’eau de mer: Une méthode très sensible à la diacétylmonoxime. Can. J. Fish. Aquat. Sci. 1982, 39, 174–183. [Google Scholar] [CrossRef] [Green Version]
- Zhang, Q.T.; Hu, G.S.; Dong, S.L. Preliminary study on the effect of urea on the growth of three marine micro algae. Mar. Sci. Bull. 2004, 34, 92–96. [Google Scholar]
- Glibert, P.M.; Harrison, J.; Heil, C.; Seitzinger, S. Escalating worldwide use of urea: A global change contributing to coastal eutrophication. Biogeochemistry 2006, 77, 441–463. [Google Scholar] [CrossRef]
- Zhao, Y.T. Sources and Distribution of Urea in Yangtze Estuary and Its Adjacent Sea and Its Function on the Dinoflagellate Blooms; Ocean University of China: Qingdao, China, 2013. [Google Scholar]
- Harrison, W.G.; Head, E.J.H.; Conover, R.J.; Longhurst, A.R.; Sameoto, D.D. The distribution and metabolism of urea in the eastern Canadian Arctic. Deep Sea Res. 1985, 32, 23–42. [Google Scholar] [CrossRef]
- Herbland, A. In situ utilization of urea in the euphotic zone of the tropical Atlantic. J. Exp. Mar. Biol. Ecol. 1976, 21, 269–277. [Google Scholar] [CrossRef]
- Lomas, M.W.; Trice, T.M.; Glibert, P.M.; Bronk, D.A.; McCarthy, J.J. Temporal and spatial dynamics of urea uptake and regeneration rates and concentrations in Chesapeake Bay. Estuaries 2002, 25, 469–482. [Google Scholar] [CrossRef]
- McCarthy, J.J. The uptake of urea by natural populations of marine phytoplankton. Limnol. Oceanogr. 1972, 17, 738–748. [Google Scholar] [CrossRef]
- Rosenstock, B.; Simon, M. Sources and sinks of dissolved free amino acids and protein in a large and deep mesotrophic lake. Limnol. Oceanogr. 2001, 46, 644–654. [Google Scholar] [CrossRef]
- Bo, S.Y.; Shi, J.H.; Gao, H.W.; Qi, J.J.; Zhang, J. Urea in aerosol and rain water over the East China Sea in winter and spring. Eviron. Sci. 2009, 30, 14–22. [Google Scholar]
- Cornell, S.E.; Jickells, T.D.; Thornton, C.A. Urea in rainwater and atmospheric aerosol. Atmos. Environ. 1998, 32, 1903–1910. [Google Scholar] [CrossRef]
- Cornell, S.; Mace, K.; Coeppicus, S.; Duce, R.; Huebert, B.; Jickells, T.; Zhuang, L.Z. Organic nitrogen in Hawaiian rain and aerosol. J. Geophys. Res. Atmos. 2001, 106, 7973–7983. [Google Scholar] [CrossRef]
- Chen, Z.H.; Chen, N.W.; Wu, Y.Q.; Mo, Q.L.; Zhou, X.P.; Lu, T.; Tian, Y. Sediment-water flux and processes of nutrients and gaseous nitrogen release in a China River. Environ. Sci. 2014, 35, 3325–3335. [Google Scholar]
- Lambert, D.F.; Sherwood, J.E.; Francis, S.P. The determination of urea in soil extracts and related samples-a review. Aust. J. Soil Res. 2004, 42, 709–717. [Google Scholar] [CrossRef]
- Davis, A.M.; Think, M.; Rohde, K.; Brodie, J.E. Urea contributions to dissolved ‘organic’ nitrogen losses from intensive, fertilized agriculture. Agr. Ecosyst. Environ. 2016, 223, 190–196. [Google Scholar] [CrossRef] [Green Version]
- Udert, K.M.; Larsen, T.A.; Gujer, W. Fate of major compounds in source-separated urine. Water Sci. Technol. 2006, 54, 413–420. [Google Scholar] [CrossRef] [PubMed]
- Fan, L.; Brett, M.T.; Li, B.; Song, M.M. The bioavailability of different dissolved organic nitrogen compounds for the freshwater algae Raphidocelis subcapitata. Sci. Total Environ. 2018, 618, 479–486. [Google Scholar] [CrossRef]
- Bronk, D.A.; See, J.H.; Bradley, P.; Killberg, L. DON as source of bioavailable nitrogen for phytoplankton. Biogeoscience 2007, 4, 283–296. [Google Scholar] [CrossRef] [Green Version]
- Glibert, P.M.; Trice, T.M.; Michael, B.; Lois, L. Urea in the tributaries of the Chesapeake and Coastal Bays of Maryland. Water Aie Soil Poll. 2005, 13, 303–311. [Google Scholar] [CrossRef]
- Paul, J.H. Uptake of organic nutrient. In Nitrogen in the Marine Environment; Edward, J., Douglas, G.C., Eds.; Academic Press: New York, NY, USA, 1983; pp. 275–308. [Google Scholar]
- Cozzi, S.; Mistaro, A.; Sparnocchia, S.; Colugnati, L.; Bajt, O.; Toniatti, L. Anthropogenic fluxes and biogeochemistry role of urea in the Gulf of Trieste. Sci. Total Environ. 2014, 493, 271–281. [Google Scholar] [CrossRef]
- Zhang, P.; Wei, L.R.; Lai, J.Y.; Dai, P.D.; Zhang, J.B. Concentration, composition and fluxes of terrestrial nitrogen and phosphorus source pollutants input into Zhanjiang Bay in summer. J. GDOU 2019, 39, 46–55. [Google Scholar]
- Administration of ocean and fisheries of Guangdong Province. Bulletin of Guangdong Marine Environmental Status 2017; Administration of Ocean and Fisheries of Guangdong Province: Guangzhou, China, 2018.
- Zhang, L.Z.; Yu, L.; Tang, M.S. Eutrophication and red tide in coastal waters of Zhanjiang port. Water Resour. Prot. 2009, 25, 50–54. [Google Scholar]
- Statistics Bureau of Guangdong Province. Statistical Communique of Zhanjiang Province on the 2017 National Economic and Social Development. Available online: http://www.zhanjiang.gov.cn/fileserver/statichtml/2018-04/b3b805fe-f696-491e-aa1f-3345ae060b0b.htm?cid= (accessed on 5 May 2019).
- State Bureau of Quality Technical Supervision. The Specification for Marine Monitoring Part 4: Seawater Analysis; GB17378.4—2007; China Standards Press: Beijing, China, 2007. [Google Scholar]
- Lu, D.L.; Yang, N.N.; Liang, S.K.; LI, K.Q.; Wang, X.L. Comparison of land-based sources with ambient estuarine concentrations of total dissolved nitrogen in Jiaozhou Bay (China). Estuar. Coast. Shelf Sci. 2016, 180, 82–90. [Google Scholar] [CrossRef]
- National Environmental Protection Agency. Technical Specifications Requirements for Monitoring of Surface Water and Waste Water: HJ/T 91—2002; China Environmental Science Press: Beijing, China, 2002. [Google Scholar]
- Ministry of Water Resources of the People’s Republic of China. Code for Liquid Flow Measurement in Open Channels: GB50179-93; China Environmental Science Press: Beijing, China, 2005.
- Zou, Z.B. Optimization of Urea Analysis Method in Seawater and Its Application in Zhanjiang Bay; Ocean University of Guangdong: Zhanjiang, China, 2019. [Google Scholar]
- Newell, B.S.; Morgan, B.; Cundy, J. The determination of urea in seawater. J. Mar. Res. 1967, 25, 201–202. [Google Scholar]
- Wang, X.S. The orthogonal experiment design. Shanxi Chem. Ind. 1989, 3, 53–58. [Google Scholar]
- Price, N.M.; Harrison, P.J. Comparison of methods for the analysis of dissolved urea in seawater. Mar. Biol. 1987, 94, 307–317. [Google Scholar] [CrossRef]
- Chen, L.; Ma, J.; Huang, Y.; Dai, M.H.; Li, X.L. Optimization of a colorimetric method to determine trace urea in seawater. Limnol. Oceanogr. Methods 2015, 13, 303–311. [Google Scholar] [CrossRef]
- Schlitzer, R. Interactive analysis and visualization of geoscience data with Ocean Data View. Comput. Geosci. 2002, 28, 1211–1218. [Google Scholar] [CrossRef] [Green Version]
- Imran, M.; Hamid, Y.; Mazher, A.; Ahmad, S.R. Geo-spatially modelling dengue epidemics in urban cities: A case study of Lahore, Pakistan. Geocarto Int. 2019, 1–15. [Google Scholar] [CrossRef]
- Paerl, H.W. Coastal eutrophication and harmful algal blooms: Importance of atmospheric deposition and groundwater as “new” nitrogen and other nutrient sources. Limnol. Oceanogr. 1997, 42, 1154–1165. [Google Scholar] [CrossRef] [Green Version]
- Zhao, L.R.; Shi, Y.Z.; Zhao, H.; Zhang, J.B.; Sun, X.L. Residues and sources of HCHs and DDTs in the sediments of land-based sewage outlet to the Zhanjiang Bay, China. Acta Oceanol. Sin. 2019, 38, 8–13. [Google Scholar] [CrossRef]
- Huang, K.X.; Zhang, Y.; Ou, L.J.; Lu, S.H.; Lu, S.G.; Qi, Y.Z. The distribution of urea concentrations and urease activities in the coastal waters of Hainan Island during the spring. Acta Ecol. Sin. 2013, 33, 4575–4582. [Google Scholar] [CrossRef] [Green Version]
- Bowers, H.A.; Trice, T.M.; Magnien, R.E.; Goshorn, D.M.; Michael, B.; Schaefer, E.F.; Rublee, P.A.; Oldach, D.W. Detection of pfiesteria spp. by PCR in surface sediments collected from Chesapeake Bay tributaries (Maryland). Harmful Algae 2006, 5, 342–351. [Google Scholar] [CrossRef]
- Kudela, R.M.; Ryan, J.P.; Blakely, M.D.; Lane, J.Q.; Peterson, T.D. Linking the physiology and ecology of Cochlodinium to better understand harmful algal bloom events: A comparative approach. Harmful Algae 2008, 7, 278–292. [Google Scholar] [CrossRef]
- Jiang, C.C.; Yang, N.N.; Wang, W.; Shi, X.Y.; Liang, S.K.; Wang, X.L. Seasonal distribution and potential sources of urea in the surface seawater of Jiaozhou Bay. Environ. Chem. 2014, 33, 2162–2168. [Google Scholar]
- Xu, N.; Wang, M.; Sui, K.F.; HU, Z.X.; Duan, S.S. Facilitation of DON on population growth of Alexandrium sp. in Daya Bay. China Environ. Sci. 2012, 32, 504–509. [Google Scholar]
- Zhang, Z.F.; Xu, Y.L.; He, J. Influences of long-term reclamation works on hydrodynamic environment in Zhanjiang Bay. Hydro Sci. Eng. 2016, 3, 96–104. [Google Scholar]
- Yang, N.N. Terrigenous Input, Distribution and Bioavailability of Dissolved Organic Nitrogen in Jiaozhou Bay from 2012 to 2013; Ocean University of China: Qingdao, China, 2014. [Google Scholar]
- Huang, S.; Shi, X.Y.; Zhang, C.S.; Zhou, S.H. Urea concentration and its distribution in the adjacent area of Hangzhou Bay in spring of 2010. Mar. Environ. Sci. 2012, 31, 58–61. [Google Scholar]
- Li, Z.L.; Shi, X.Y.; Zhang, C.S. Distribution characteristics of urea and constitution of dissolved nitrogen in the Bohai Sea and the Huanghai Sea in spring. Environ. Sci. 2015, 36, 3999–4004. [Google Scholar]
- Mulholland, M.R.; Lee, C.; Glibert, P.M. Extracellular enzyme activity and uptake of carbon and nitrogen along an estuarine salinity and nutrient gradient. Mar. Ecol. Prog. 2003, 258, 3–17. [Google Scholar] [CrossRef] [Green Version]
- Bradley, P.B.; Lomas, M.W.; Bronk, D.A. Inorganic and organic nitrogen use by phytoplankton along Chesapeake Bay, measured using a flow cytometric sorting approach. Estuar. Coast. 2010, 33, 971–984. [Google Scholar] [CrossRef]
- Veuger, B.; Middelburg, J.J.; Boschker, H.T.S.; Nieuwenhuize, J.; Rijswijk, P.; Emma, J.R.N.; Navarro, N. Microbial uptake of dissolved organic and inorganic nitrogen in Randers Fjord. Estuar. Coast. Shelf Sci. 2004, 61, 507–515. [Google Scholar] [CrossRef]
- Glibert, P.M.; Heil, C.A.; Hollander, D.J.; Revilla, M.I.; Hoare, A.; Alexander, J.A.; Murasko, S. Evidence for dissolved organic nitrogen and phosphorus uptake during a cyanobacterial bloom in Florida Bay. Mar. Ecol. Prog. Ser. 2004, 280, 73–83. [Google Scholar] [CrossRef]
- Aslam, H.; Liu, J.; Mazher, A.; Mojo, D.; Muhammad, I.; Fu, C. Willingness to pay for improved water services in mining regions of developing economies: Case study of a coal mining project in thar coalfield, pakistan. Water 2018, 10, 481. [Google Scholar] [CrossRef] [Green Version]
- Zhang, P.; Su, Y.; Liang, S.K.; Li, K.Q.; Li, Y.B.; Wang, X.L. Assessment of long-term water quality variation affected by high-intensity land-based inputs and land reclamation in Jiaozhou Bay, China. Ecol. Indic. 2017, 75, 210–219. [Google Scholar] [CrossRef] [Green Version]
- Chen, Y.H.; Yang, Y.F.; Jiao, N.Z. Effect of mariculture on the planktonic community and water environments: A Review. Mar. Sci. 2001, 25, 20–22. [Google Scholar]
- Zhanjiang Municipal Statistics Bureau. Zhanjiang Statistical yearbook-2002 to 2016. Available online: http://tjj.zhanjiang.gov.cn/_Layouts/ApplicationPages/TemplateFashion/List.aspx?pid=9335c440-52ef-44ab-97ac-d7491d4e1726&index=3 (accessed on 9 August 2019).
- Chen, H.O.; Ma, Q.M.; Yang, F. Level of eutrophication and phytoplankton diversity in Zhanjiang Bay. Trans. Oceanol. Limnlo. 2009, 3, 121–126. [Google Scholar]
- Glibert, P.M.; Burford, M.A. Globally changing nutrient fluxes and harmful algal blooms: Recent advances, new paradigms, and continuing challenges. Oceanography 2017, 30, 58–69. [Google Scholar] [CrossRef] [Green Version]
Figure 1.
Geographic location, terrestrial source pollutants, and seawater monitoring stations in ZJB.
Figure 1.
Geographic location, terrestrial source pollutants, and seawater monitoring stations in ZJB.

Figure 2.
The spatiotemporal distribution of urea in seawater of the ZJB in different seasons.


Figure 3.
Seasonal changes in urea illustrated using a box diagram for coastal water of the ZJB (data were from November 2018 to June 2019). (The lines and squares, lower and upper edges, and lines and crosses in- or outside the boxes represent median and mean values, 25th and 75th, <99th and >1th, and minimum and maximum values of all data, respectively; Symbols see Figure 3).

Figure 4.
The concentration (CUrea) and flux (FUrea) input variation of urea in January (a), April (b) and July (c) in the ZJB.
Figure 4.
The concentration (CUrea) and flux (FUrea) input variation of urea in January (a), April (b) and July (c) in the ZJB.

Figure 5.
Assessment of DON bioavailability based on urea concentration in the ZJB coastal water.

Figure 6.
Annual urea variation flux input from the estuaries and sewage outlets of the ZJB.

Figure 7.
Annual change in nitrogen fertilizer used (a), population (b), and the areas of mariculture (c) in Zhanjiang [67].
Figure 7.
Annual change in nitrogen fertilizer used (a), population (b), and the areas of mariculture (c) in Zhanjiang [67].


Table 1.
Investigation of estuaries and sewage outlets in ZJB [29].
Table 1.
Investigation of estuaries and sewage outlets in ZJB [29].
| Number | Estuaries and Sewage Outlets | Longitude/° | Latitude/° |
|---|---|---|---|
| S1 | Donghai Island aquaculture sewage outlet 1 | 110.2052 | 21.0426 |
| S2 | Donghai Island aquaculture sewage outlet 2 | 110.2406 | 21.0511 |
| S3 | Hongxing estuary | 110.2503 | 21.0337 |
| S4 | Nanliu River estuary | 110.2257 | 21.0907 |
| S5 | Lvtang River estuary | 110.2453 | 21.1246 |
| S6 | Wenbao River estuary | 110.2350 | 21.1511 |
| S7 | Jinsha Bay sewage outlet | 110.2331 | 21.1613 |
| S8 | Sewage outlet of the flood control sluice in Binhu park | 110.2329 | 21.1645 |
| S9 | Suixi River estuary | 110.2317 | 21.2334 |
| S10 | Sewage outlet of the flood control sluice in Dengta park | 110.2559 | 21.1513 |
| S11 | Potou primary school sewage outlet | 110.2653 | 21.1423 |
Table 2.
Seasonal urea concentration: mean, maximum, and minimum values in ZJB.
| Month | Mean ± SD (μmol·L−1) | Maximum (μmol·L−1) | Minimum (μmol·L−1) |
|---|---|---|---|
| 2018.11 | 4.05 ± 0.86 | 2.08 | 5.53 |
| 2019.01 | 3.32 ± 0.54 | 2.37 | 4.55 |
| 2019.04 | 2.50 ± 0.66 | 1.66 | 3.86 |
| 2019.06 | 2.57 ± 0.99 | 1.14 | 4.39 |
Table 3.
Comparison of urea concentration in the ZJB with other bays and estuaries.
| Study Area | Survey Time | The Average Concentration of Urea (μmol·L−1) | The Range of Urea Concentration (μmol·L−1) | Reference |
|---|---|---|---|---|
| The Yangtze | 2010–2011 | 0.03–6.32 | [16] | |
| Haikou Bay, Hainan | 2011 | 3.30 ± 0.43 | 2.07–3.30 | [51] |
| Middle river, Chesapeake Bay | 2000–2002 | 0.25–1.25 | [52] | |
| Manokin and King, Chesapeake Bay | 1998–2002 | 0.75–1.90 | [52] | |
| Chicamacomico, Chesapeake Bay | 1998–2002 | 1.00–2.40 | [52] | |
| Pocomoke River, Chesapeake Bay | 1998–2002 | 0.45–0.90 | [52] | |
| Monterey Bay, Canada | 2006.09 | 0.42 | [53] | |
| Jiaozhou Bay | 2012–2013 | 5.39 ± 5.21 | 0.16–26.22 | [54] |
| Daya Bay | 2008 | 0.15–9.80 | [55] | |
| Hangzhou Bay | 2010 | 1.14 ± 0.90 | 0.19–6.55 | [58] |
| Bohai Sea | 2014 | 0.84 ± 0.20 | 0.21–2.17 | [59] |
| Pocomoke River | 2000.08 | 0.36 ± 0.04 | [60] | |
| James River, Chesapeake Bay | 2008.08 | 0.10–0.99 | [61] | |
| Randers Fjord | 2001.08 | 1.20–3.90 | [62] | |
| York River | 2010.03–2010.05 | 0.37 ± 0.16 | [62] | |
| Florida Bay | 2002.11 | 0.36–1.70 | [63] | |
| Zhanjiang Bay (Seawater) | 2018–2019 | 3.13 ± 1.02 | 1.14–5.53 | This study |
| Zhanjiang Bay (Terrestrial sources) | 2019 | 3.22 ± 0.82 | 1.31–10.29 | This study |
© 2020 by the authors. Licensee MDPI, Basel, Switzerland. This article is an open access article distributed under the terms and conditions of the Creative Commons Attribution (CC BY) license (http://creativecommons.org/licenses/by/4.0/).
Share and Cite
MDPI and ACS Style
Zhang, P.; Peng, C.-H.; Zhang, J.-B.; Zou, Z.-B.; Shi, Y.-Z.; Zhao, L.-R.; Zhao, H. Spatiotemporal Urea Distribution, Sources, and Indication of DON Bioavailability in Zhanjiang Bay, China. Water 2020, 12, 633. https://doi.org/10.3390/w12030633
AMA Style
Zhang P, Peng C-H, Zhang J-B, Zou Z-B, Shi Y-Z, Zhao L-R, Zhao H. Spatiotemporal Urea Distribution, Sources, and Indication of DON Bioavailability in Zhanjiang Bay, China. Water. 2020; 12(3):633. https://doi.org/10.3390/w12030633
Chicago/Turabian StyleZhang, Peng, Cong-Hui Peng, Ji-Biao Zhang, Zhan-Bin Zou, Yu-Zhen Shi, Li-Rong Zhao, and Hui Zhao. 2020. "Spatiotemporal Urea Distribution, Sources, and Indication of DON Bioavailability in Zhanjiang Bay, China" Water 12, no. 3: 633. https://doi.org/10.3390/w12030633
Note that from the first issue of 2016, this journal uses article numbers instead of page numbers. See further details here.