Applying the Systems Approach to Decompose the SuDS Decision-Making Process for Appropriate Hydrologic Model Selection


1
Department of Civil and Environmental Engineering, Imperial College London, London SW7 2AZ, UK
2
Centre for Doctoral Training in Sustainable Civil Engineering, Imperial College London, London SW7 2AZ, UK
*
Author to whom correspondence should be addressed.
Water 2020, 12(3), 632; https://doi.org/10.3390/w12030632
Submission received: 5 January 2020
/
Revised: 20 February 2020
/
Accepted: 22 February 2020
/
Published: 26 February 2020
(This article belongs to the Special Issue Application of the Systems Approach to the Management of Complex Water Systems)
Abstract
:Sustainable Urban Drainage Systems (SuDS) have gained popularity over the last few decades as an effective and optimal solution for urban drainage systems to cope with continuous population growth and urban sprawl. A SuDS provides not only resilience to pluvial flooding but also multiple other benefits, ranging from amenity improvement to enhanced ecological and social well-being. SuDS modelling is used as a tool to understand these complex interactions and to inform decision makers. Major developments in SuDS modelling techniques have occurred in the last decade, with advancement from simple lumped or conceptual models to very complex fully distributed tools. Several software packages have been developed specifically to support planning and implementation of SuDS. These often require extensive amounts of data and calibration to reach an acceptable level of accuracy. However, in many cases, simple models may fulfil the aims of a stakeholder if its priorities are well understood. This work implements the soft system engineering and Analytic Network Process (ANP) approaches in a methodological framework to improve the understanding of the stakeholders within the SuDS system and their key priorities, which leads to selecting the appropriate modelling technique according to the end-use application.
1. Introduction
In 2018, the percentage of the world’s population living in cities reached 55% and the level of urbanisation in Europe reached 74% [1]. The urbanization process inevitably diminishes the porous green spaces of cities. For instance, London loses the equivalent of 2.5 Hyde Parks of green space annually. This urbanisation and population growth, accompanied by changes in rainfall patterns due to climate change and the insufficient capacity of current sewer systems, is leading to increased urban flooding. The increase in flooding has reached a level that triggers global concern because it not only poses direct threats to human wellbeing and property safety but also has knock-on effects on economic and social development. Therefore, to mitigate the risk of flooding in a sustainable manner, Sustainable Urban Drainage Systems (SuDS), which fall within the context of Blue Green Infrastructure (BGI) practices, have been proposed as one of the first strategies to pursue.
Traditional management of urban water systems considers all components independently in a fragmented manner [2]. However, with new factors such as rapid urban growth driving water system development as well as burgeoning needs for infrastructure rehabilitation and climate change adaptation, integrated urban water modelling is currently expanding in new directions, stimulated by improvements in computational efficiency. Integrated 1D–2D modelling of the interactions between urban drainage systems and urban landscapes during large pluvial flooding incidents has become possible in the last decade (e.g., [3,4,5]). Modelling that extends beyond the strictly technical and biophysical domain of the water system (e.g., social and economic domains) has also attracted increasing interest in recent years [6].
Integrated Urban Drainage Models (IUDM) have been one of the most well-known and recognised forms of integrated models. These typically consist of studying upgrade options for a local Wastewater Treatment Plant, assessing ways of reducing Combined Sewer Overflow emissions or showing the combined impact of different parts of the drainage system on receiving waters [7]. They recognise both combined and separate drainage systems and can simulate real-time control (RTC) strategies for optimisation of new and existing complex systems [8].
The advancements in modelling capabilities have increased the need for a universal approach to select and develop urban drainage models, which are usually iteratively refined during model development by finding a balance between the study objectives, model structure, data requirements and availability and computational power efficiency [7]. Given the array of benefits provided by SuDS, spanning several disciplines to maintain multiple ecosystem services [9], it is very important to manage the level of modelling required to identify and quantify such benefits in the planning phase. The whole process for developing a SuDS model, from building to testing, should follow a systematic approach, starting with clearly defined aims and objectives and an initial assessment of data availability before selecting the potential model features. Hence, the first and most important step is to understand the aims and objectives of the modelling exercise.
This step is linked to understanding stakeholders’ priorities; in turn, that understanding is linked to the whole decision-making process. In general, there are four main integrating approaches for decision-making: Cost-Benefit Analysis (CBA), Multi-Criteria Analysis (MCA), Triple Bottom Line (TBL) and Integrated Assessment (IA) [10].
CBA is one of the simplest forms of integrative approaches. It is usually applied as a pragmatic tool for aiding decision making rather than as a framework. It has proved to be useful because of the one single aggregated result obtained that helps to clarify and provide information about the costs and benefits of alternatives [11]. CBA has been widely adopted in water engineering applications traditionally because of its simple monetising approach [12]. Arrow et al. [13] provided a good philosophical foundation for the role of CBA in the management of natural resources such as water. CBA was used by Ossa-Moreno et al. [14] and Liu et al. [15] to capture the broader benefits of SuDS and not focus only on the system’s performance regarding flood management and water quality improvement. In those authors’ studies, they tried to compare the different technologies of SuDS within the framework of a cost benefit analysis.
MCA is a structured approach for supporting decision-making when dealing with more than a single criterion and allows relative importance to be placed upon each criterion by the user [16]. It is generally used as an analytical tool, but it can also be applied as an integrated framework by coupling with appropriate problem structuring methods (PSMs) [17]. In the water resource planning and management sector, MCA is heavily used for water policy evaluation, strategic planning and infrastructure selection [18]. MCA was used by Ellis et al. [19] to assess the best choice of SuDS with the aim of quantifying different and wider benefits of SuDS implementation. For the MCA evaluation, the benefits were separated using primary and secondary criteria and indicators.
TBL is itself not a truly integrative approach, but it is included because it can be used as a decision-making framework for guiding selection of indicators for measuring performances. It extends corporate social responsibility from the concept of sustainability, motivating organisations to address sustainability issues in a more integrated way [20]. A study by Viavattene and Ellis [21] combined the TBL and MCA approaches. The TBL was applied to account for the economic, social and environmental aspects of SuDS. MCA was used to enable the stakeholders to make a judgment among 16 different criteria that included the wider benefits of SuDS, such as amenity and aesthetic benefits. Moreover, the user had the opportunity to rank different SuDS technologies regarding the criteria that they had established.
IA is an emerging discipline that uses scenario management and stakeholder engagement while emphasising on the process to bring together a broad set of disciplines characteristic of the decision problem through [22]. Brouwer et al. [23] provided a comprehensive review of the IA concept and methods for water and wetland management. Some of the integrative approaches adopted by IA are system dynamics, Bayesian networks, agent-based models and expert systems.
Each of the above listed approaches has one or more limitation when dealing with SuDS decision-making problems. CBA generally strives to identify the gains of the winners and thereby unintentionally disregards the loss of the losers. MCA has three main problems: the first one is that it assumes independence between the criteria, the second is that there is a possibility of double counting and the third is the lack of transparency of the methods and the results. TBL suffices as a corporate reporting and communication tool; therefore, the impact of secondary stakeholders such as residents in the decision-making process is not fully accounted for. IA is an iterative adaptive approach, which makes it qualitative in nature without a robust model.
These limitations in the previous approaches can be solved by applying a framework based on systems thinking. The proposed framework is an application of the soft system methodologies to map the stakeholders and their interactions; then, analyse the stakeholders’ priorities by applying the Analytical Network Process (ANP) method. As mentioned by Saaty [24], “the ANP overcomes the limitation of linear hierarchic structures and their mathematical consequences”. Furthermore, by mapping and clustering the stakeholders, the assessment would be more robust and the procedure more transparent. By assigning weights to the stakeholders according to their role in the decision-making process, the ANP overcomes the limitations of CBA and TBL. In addition, by establishing links between criteria, ANP solves the problems of MCA. Finally, the quantitative nature of the ANP where all entries are assigned values overcomes the qualitative nature of the IA.
The ANP method has been successfully applied as a systematic selection process to guide decision-making in various industries, such as information system technologies [25], commodities [26], water and wastewater treatment [27,28], urban design [29] and renewable energy [30]. However, a review of the state-of-the-art of ANP application studies revealed that, to date, no attempts have been made to apply the ANP method in urban surface water management. Here, we seek to make an important contribution by explicitly applying the systems thinking approach to urban water management.
This study aims to introduce a methodological framework to manage SuDS modelling efforts when multiple stakeholders are involved in a project, such as retrofitting Sustainable Urban Drainage Systems (SuDS) in the UK to an existing urban environment, to deliver the maximum out of the available resources and to suppress the tendency towards seeking complex models. That is achieved by first identifying the key stakeholders and then analysing and understanding their priorities in relation to the wider benefits of SuDS and using the ANP approach to determine the desired outputs required from the modelling exercise.
2. Materials and Methods
2.1. Outline of the Proposed Framework
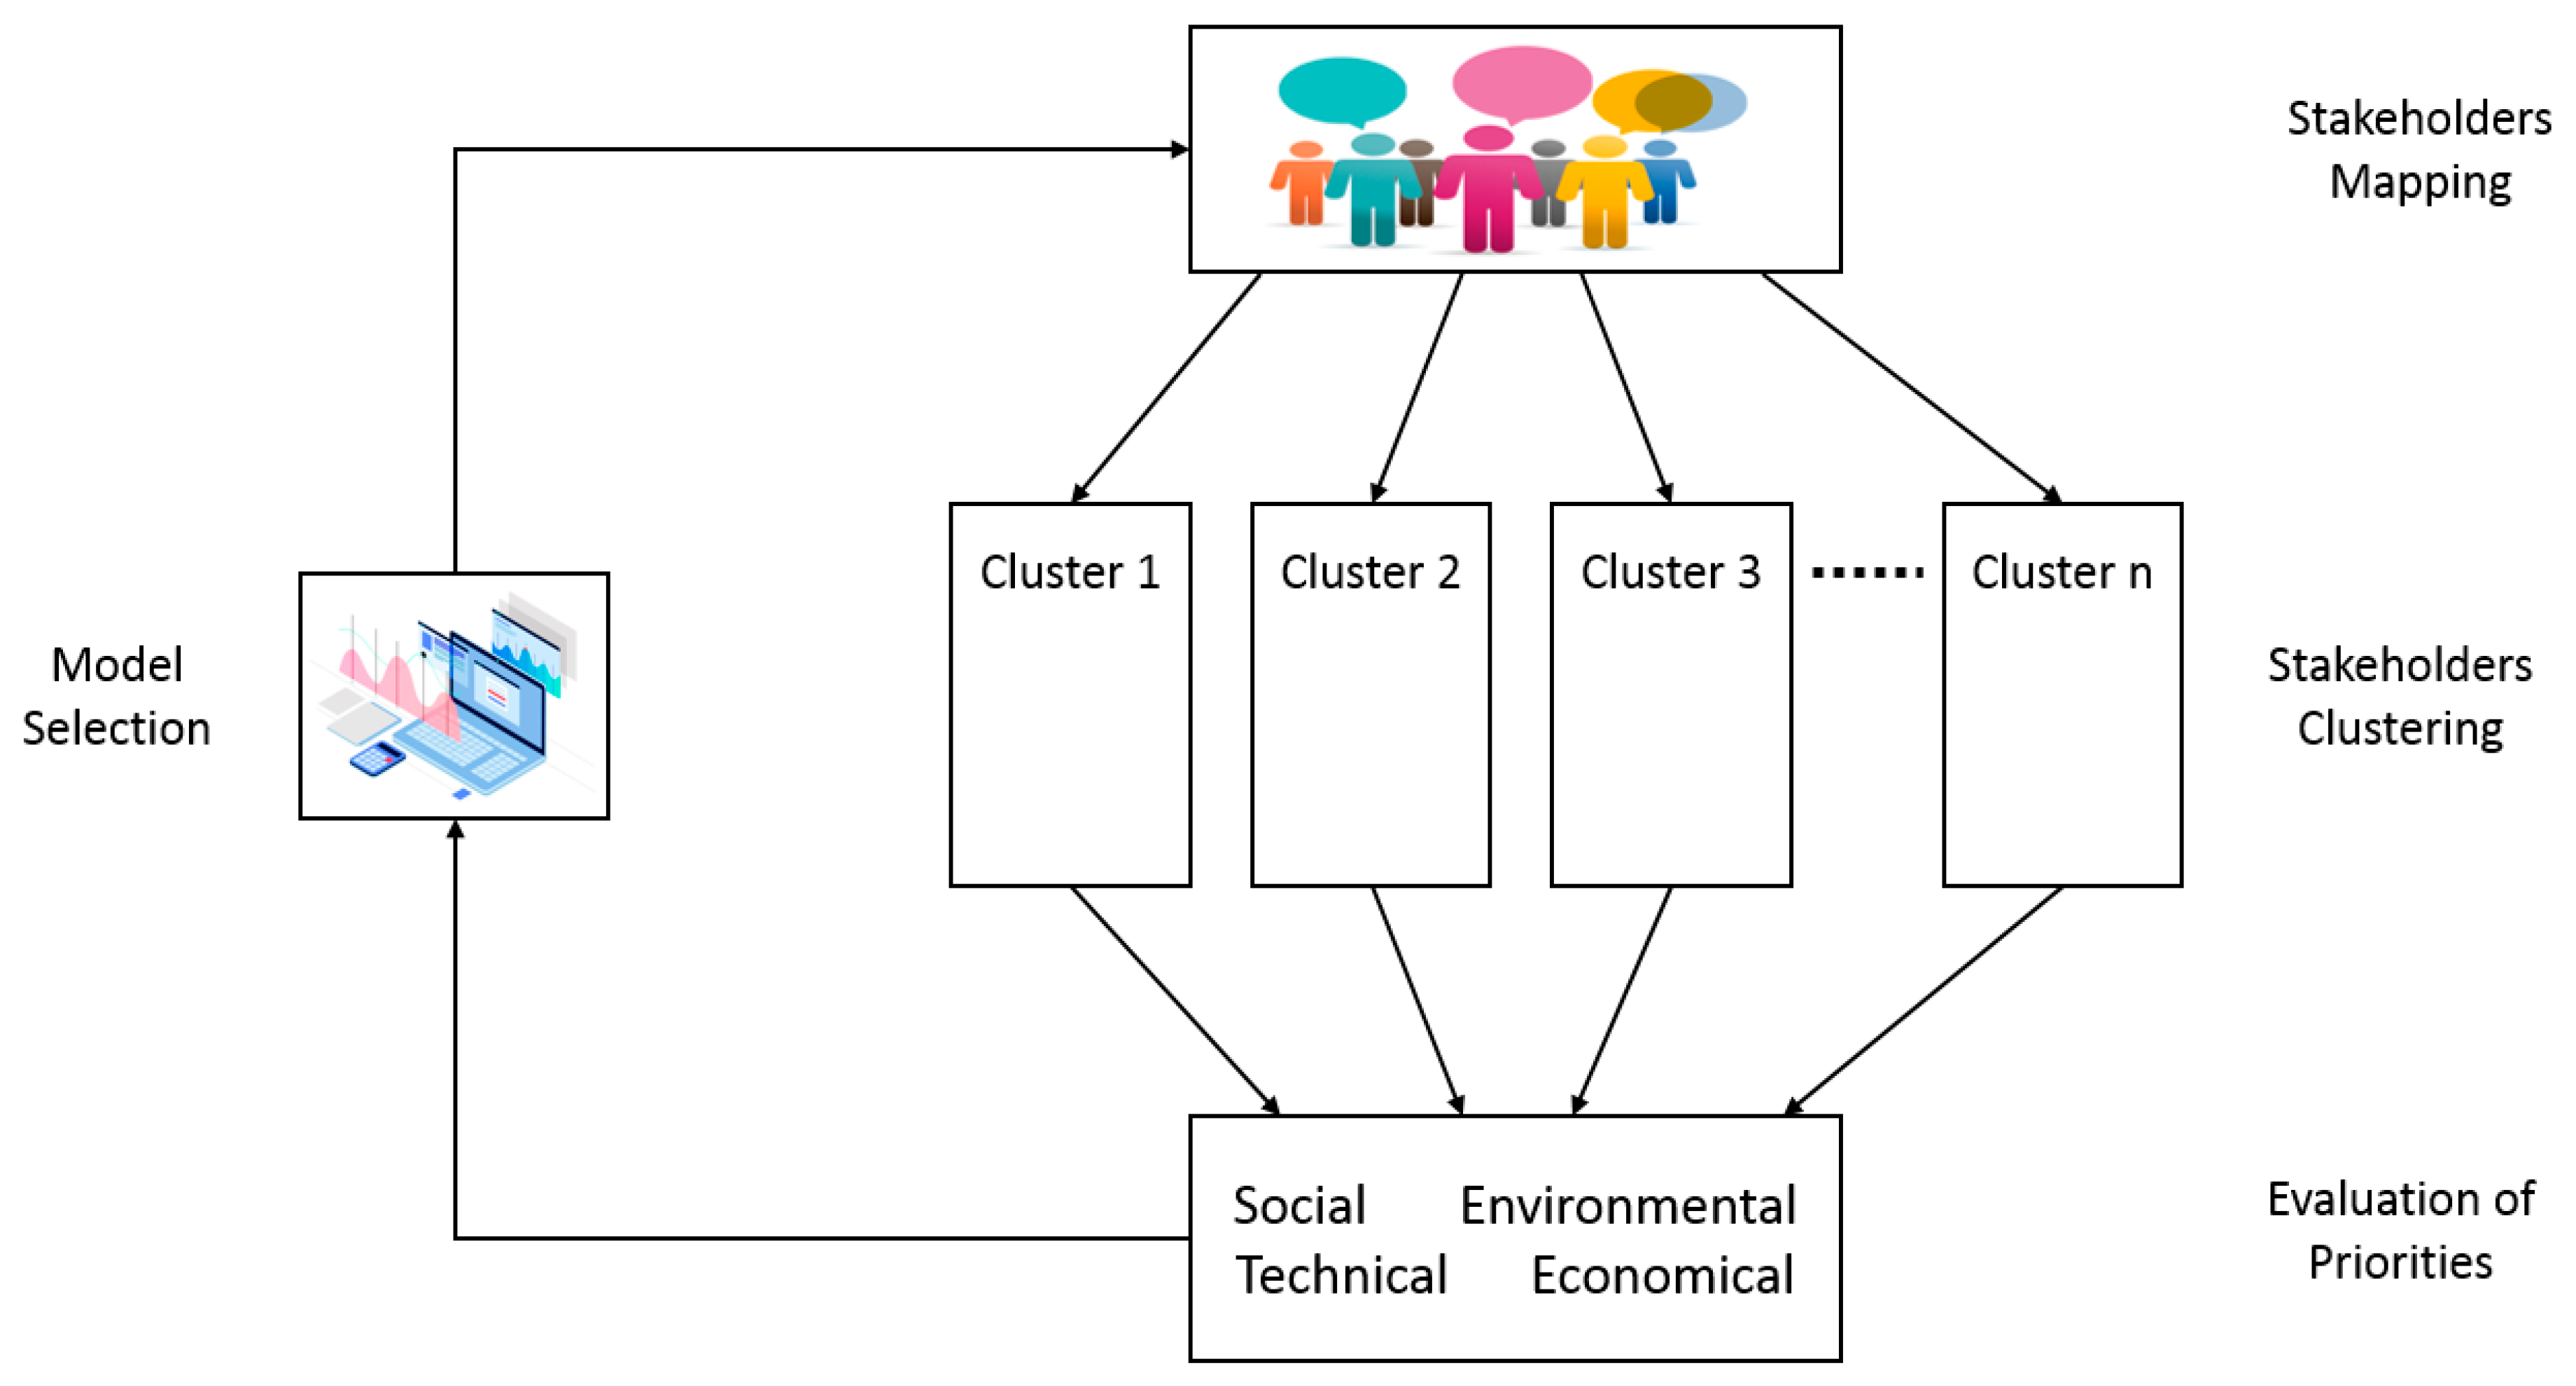
Hydrological Assessment and Management of green Infrastructure to Enhance Decision-making (HAMIED) is a framework that allows systematic management of the modelling needs of the different agents within the SuDS system of stakeholders in a series of steps, as outlined in Figure 1. The analysis formulation presented in the figure allows for defining the usage of available SuDS modelling techniques based on stakeholder needs.
In the first step of the overall selection framework, a list of potential stakeholders involved in SuDS projects is formulated. These stakeholders are then evaluated individually, and the interdependencies between them are mapped. Then, the stakeholders are clustered based on their roles within the decision-making process. In the next step, the priorities of stakeholders are evaluated with respect to different aspects of the SuDS’ functions. Lastly, the appropriate modelling complexity is assigned to each group of stakeholders according to their interest in SuDS. The detailed steps for implementing the framework presented in Figure 1 are applied here to a full-scale UK case study, as explained in the following sections.
2.2. Classification of Model Complexity
Hydrological models are often classified based on their spatial and temporal resolution. Models vary in their temporal resolution, with daily models increasingly being replaced by models running at sub-daily time steps (e.g., 1 or 5 min). Such fine resolutions are necessary to represent the fast response typical of urban catchments. Spatial resolution of models ranges from single cell (of few square meters in size) to large catchments (covering several square kilometres). The larger the spatial scale is the smaller the confidence level in the model outputs is and the lighter the computational capabilities needed. A model’s level of complexity is therefore defined based on the effort and cost required to validate a model (data requirements, model setup, calibration, simulations and uncertainty analysis) and the appropriateness of purpose and operational efficiency.
Urban hydrologic models can be grouped into five categories: (1) Conceptual (e.g., mass balance of a rainfall-runoff model); (2) Lumped (e.g., rainfall-runoff model where the catchment is described as a single entity); (3) Semi-distributed (e.g., rainfall-runoff model where the catchment is described as small individual units); (4) Hydrologic Response Unit (HRU) based, where an HRU represents an area with the same soil and land use type (e.g., rainfall-runoff model where similar hydrological behaviour in each unit is represented); and (5) Grid-based spatially distributed (e.g., rainfall-runoff model where the catchment is sub-divided into a raster system for representing the spatial variability of different attributes). Each of these can be constructed with different spatial and temporal resolutions, requiring various amounts of accurate data. A greater data requirement increases the computational resources needed, so we propose a scale of model complexity from light, for models requiring the least amount of data and effort, to very complex, for example, for fully distributed models (Table 1).
2.3. Case Study
Counters Creek (CC) is one of the lost rivers of London and is situated on the boundary of the London Borough of Hammersmith and Fulham (LBHF) and the Royal Borough of Kensington and Chelsea (RBKC). This former river and its catchment (Figure 2) are now part of the sewerage system, draining surface water from buildings and roads as well as wastewater from toilets, bathrooms and kitchens. There are over 1700 properties across parts of LBHF and RBKC reported to be at risk of sewer flooding [31]. One of the proposed solutions to address the problem is to retrofit SuDS in these hotspots. Three streets in London, each with a nearby control street, were chosen to implement SuDS retrofitting technologies. The SuDS featured in this case study included rain gardens, permeable pavement and porous asphalt [32].
Multiple stakeholders were involved in this pilot project, including the water company, the local councils, the residents, the designers and a research institute, among others. Hence, the results produced on the performance of different SuDS options differ in terms of the technical level needed for each stakeholder, whose priorities with respect to the impact of SuDS on the urban system have to be addressed.
2.4. Identification of Key Stakeholders
The multi-functionality of SuDS, spanning from hydrological [14] to environmental [33] and socio-economic [34] functions, results in a wide range of benefits for each of the relevant sectors. Due to this multifunctional nature of SuDS, the relationships between stakeholders are very complex. Eventually, most SuDS functions involve multiple stakeholders that have different backgrounds and purposes, which adds to the complexity of the problem (e.g., [35,36]).
To analyse the complex system of SuDS stakeholders in the UK, the Soft System Methodology was applied [37]. A map of all stakeholders and their interdependencies was created and then analysed using the N2 method [38] to decompose the complex stakeholder system into its independent components. The analysis of the stakeholder system with the N2 method assesses the degree of binding and coupling in a system and therefore enables holistic stakeholder management and eventually improved system efficiency. It also aids in understanding the behaviours of stakeholders by identifying interconnectivity in the system [39].
The proposed algorithm is based on graph theory techniques [40] where a diagram in the shape of a matrix is formed to record the interconnections between the system elements. It is used to assess the degree of binding and coupling in a system and thereby determine the candidate architecture based on the natural structure of the system. It is also used to identify and document the interconnectivity in a system to help understand observed behaviour and to provide guidance for improvement. First, all system elements or functions are listed along the diagonal of the N2 chart and changed to numbers for convenience of grouping. Second, all of the isolated elements, the source and destination elements and the critical element (the most influential element that has the most connections to other elements) are identified from the system. Feedback loops where two elements are tightly bound to cascade flows between elements are also recognised, as they determine the partition result. The N2 chart is then clustered step-by-step to a state where no more clusters are allowed. The resulting clusters indicate how stakeholder management should be designed and improved.
2.5. Understanding Stakeholders’ Priorities
2.5.1. Questionnaire Survey
A questionnaire survey is an effective and common way to study the perceptions, attitudes and behaviours related to a certain activity [41]. To obtain stakeholders’ feedback on different aspects of a SuDS project in the UK, an 8-question survey (can be found in the Supplementary Materials) was developed for all stakeholders involved in the project. They were asked to provide their opinions on multiple aspects related to technical, economic, environmental and social functions linked to SuDS implementation. The survey was developed using Qualtrics and distributed through email and personal communication.
The questionnaire started by providing the survey aim, an introduction to SuDS and the voluntary and acceptance terms. The survey was designed to gather directly involved stakeholders’ perceptions about SuDS and the importance of each SuDS function to them. The stakeholders where asked to answer seven questions related to the wide array of SuDS benefits which were clustered in four groups based on their aspects: (i) Economical, (ii) Technical, (iii) Social and (iv) Environmental and others. In total, seven out of fourteen stakeholders responded to the questionnaire. Although a higher response rate would have been more favourable and provided a wider spectrum of the population, the stakeholders who responded were among the most influential ones in the decision-making hierarchy, which provides the necessary robustness to the analysis conducted afterward.
2.5.2. Analytic Network Process (ANP) for Understanding Decision-Making in SuDS
The system of stakeholders mapped by the N2 method and the links between them increase the complexity of selecting a modelling tool; therefore, a processing method is needed to disentangle these interdependencies and assign the proper modelling tool for each group of stakeholders.
The Analytical Network Process (ANP), first proposed by Saaty [42], is a measurement theory based on multiple criteria that is used to derive relative priority scales of absolute numbers from a series of individual judgments that also belong to a fundamental scale of absolute numbers. These judgments represent the relative influence of each of two elements with respect to an underlying control criterion in a pairwise comparison process. The ANP synthesises the outcome of dependence and feedback within and between clusters of elements through its supermatrix, whose entries are themselves matrices of column priorities.
In the case of SuDS projects that could provide a wide range of benefits for multiple stakeholders, because of the nature of the links between the criteria and the environments analysed, the ANP is the methodology that allows the best benchmarking and that provides accurate results compared to other techniques, such as MCA [43].
For the evaluation of the ANP method, the open-source commercial program Super Decisions was used [44]. Super Decisions is a free educational decision support software program that has the necessary tools to create and manage the ANP models [26].
Each type of SuDS has different attributes and benefits, which result in different performance values for a criterion defined within the four selected aspects of SuDS functions. A scoring system in which each SuDS intervention could take a score that was scaled from zero (worst performance) to one (best performance) was used in order to define the performance for each criterion. Additionally, the performance of each SuDS was scored relative to the performance of all other selected SuDS technologies. For that reason, it was decided to keep the reference from one source, and the UK SuDS manual [27] was used for this purpose. The criteria were divided into two main categories, (i) Quantitative and (ii) Qualitative, as shown in the Supplementary Materials (Table S1). The criteria were directly linked to the questionnaire survey mentioned previously.
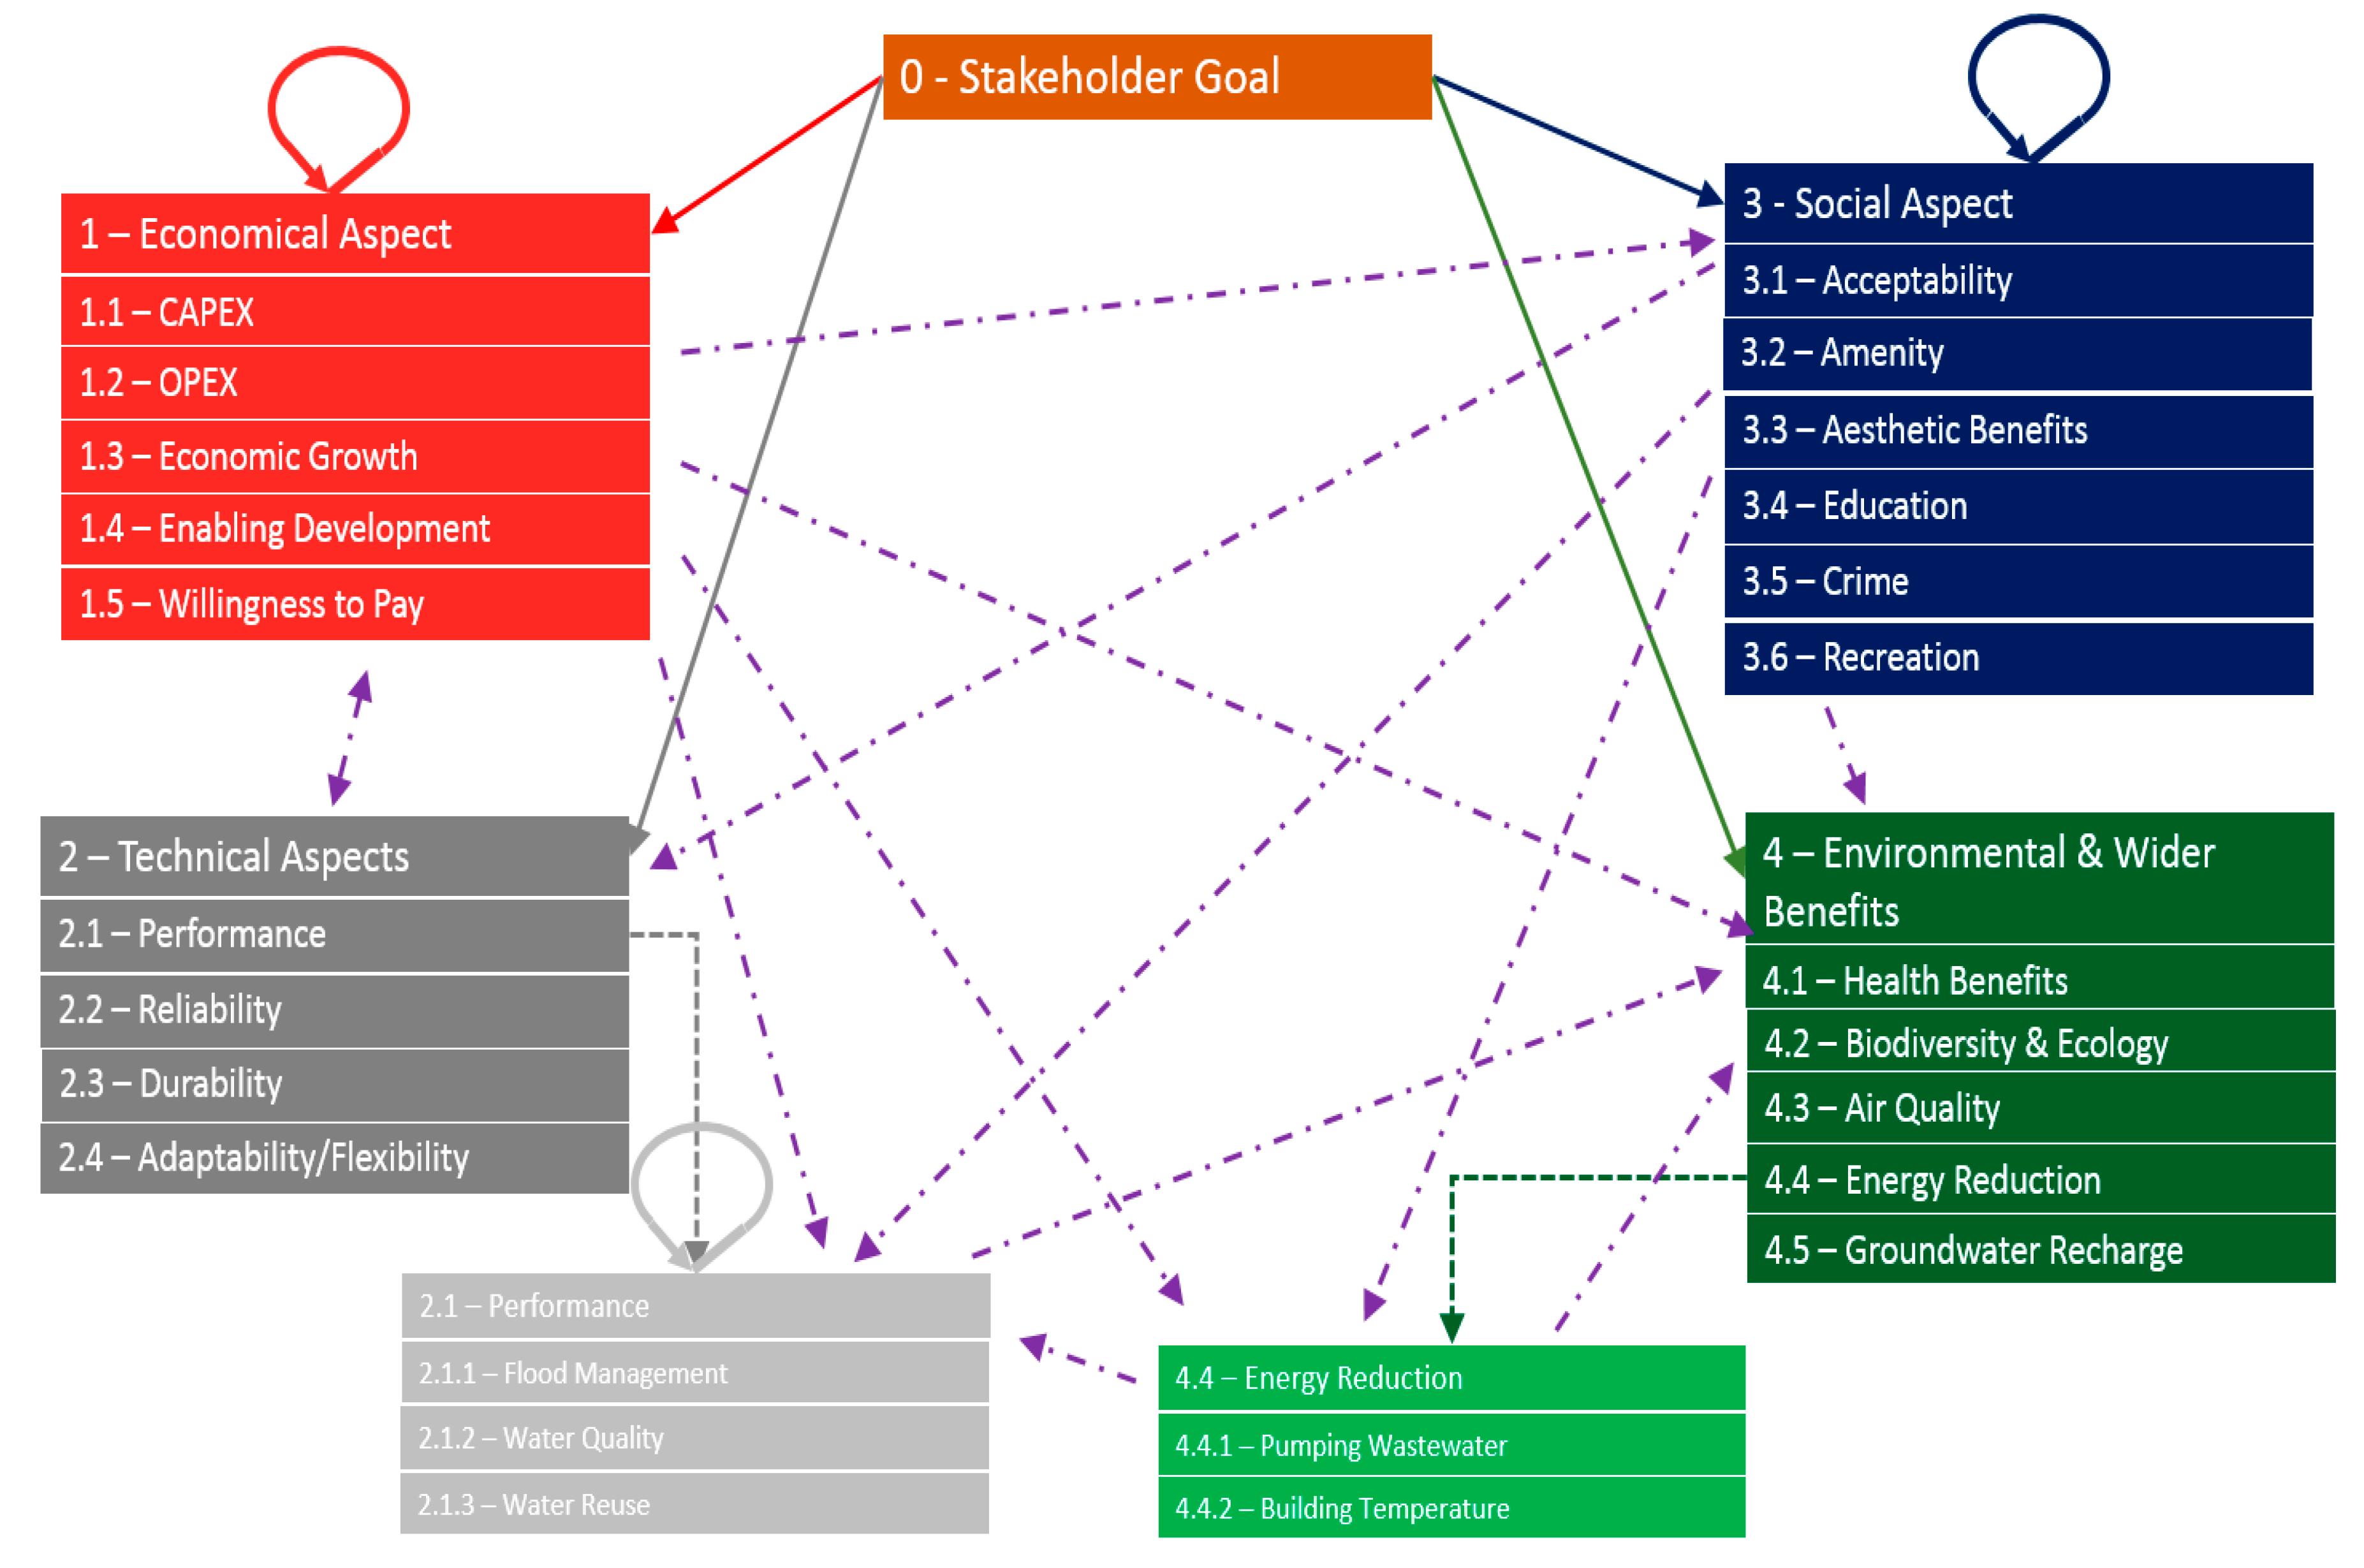
The first step in the process was to create the structure of the ANP network based on the criteria, and the connections based on the relationships between the criteria. The problem was decomposed into a rational system of network type. As shown in Figure 3 for a certain stakeholder, it consisted of seven clusters in total, each of which contained nodes that represent the selected criteria.
The next step was to determine the relative importance between the criteria. Pairs of decision-elements for each cluster were compared with respect to their importance to their control policies [45]. In the ANP, the judgment and determination of relative importance was made by answering a pairwise comparison [10].
The same network structure was created for each of the stakeholders who participated in the survey, and these were linked together according to the weight of the respective stakeholder within the decision-making system. The weights were assigned based on the results of the stakeholder screening from the N2, where the easily groupable stakeholders have the least weight and the self-acting stakeholders have the strongest weight. For instance, the local authority is a major stakeholder in the decision-making of SuDS; hence, it has a high weight compared to hospitals for example.
The next step was to make the supermatrix. It shows the intensity of the links between the criteria for each stakeholder (e.g., how much technical performance aspects are correlated with the economic aspects). This is a process similar to the creation of a Markov chain [45]. To achieve global priorities in a system with interdependent influences, vectors of local priorities are incorporated in the corresponding columns of a matrix. This supermatrix is actually a partitioned matrix in which each segment represents a relationship between two clusters in a system. The software produces the unweighted matrix, which shows the relative weights between the criteria based on the relative importance obtained from the stakeholder.
In the final step, a stochastic weighted supermatrix is created. The software produces the limit matrix, which is the long-run or limit priority of influence of each element on every other element. More specifically, the weighted matrix is raised in a high power in order for the limit matrix to be identified [42]. The values, which represent the stakeholders’ priorities, are then extracted from the limit matrix.
3. Results and Discussion
3.1. Stakeholder Mapping
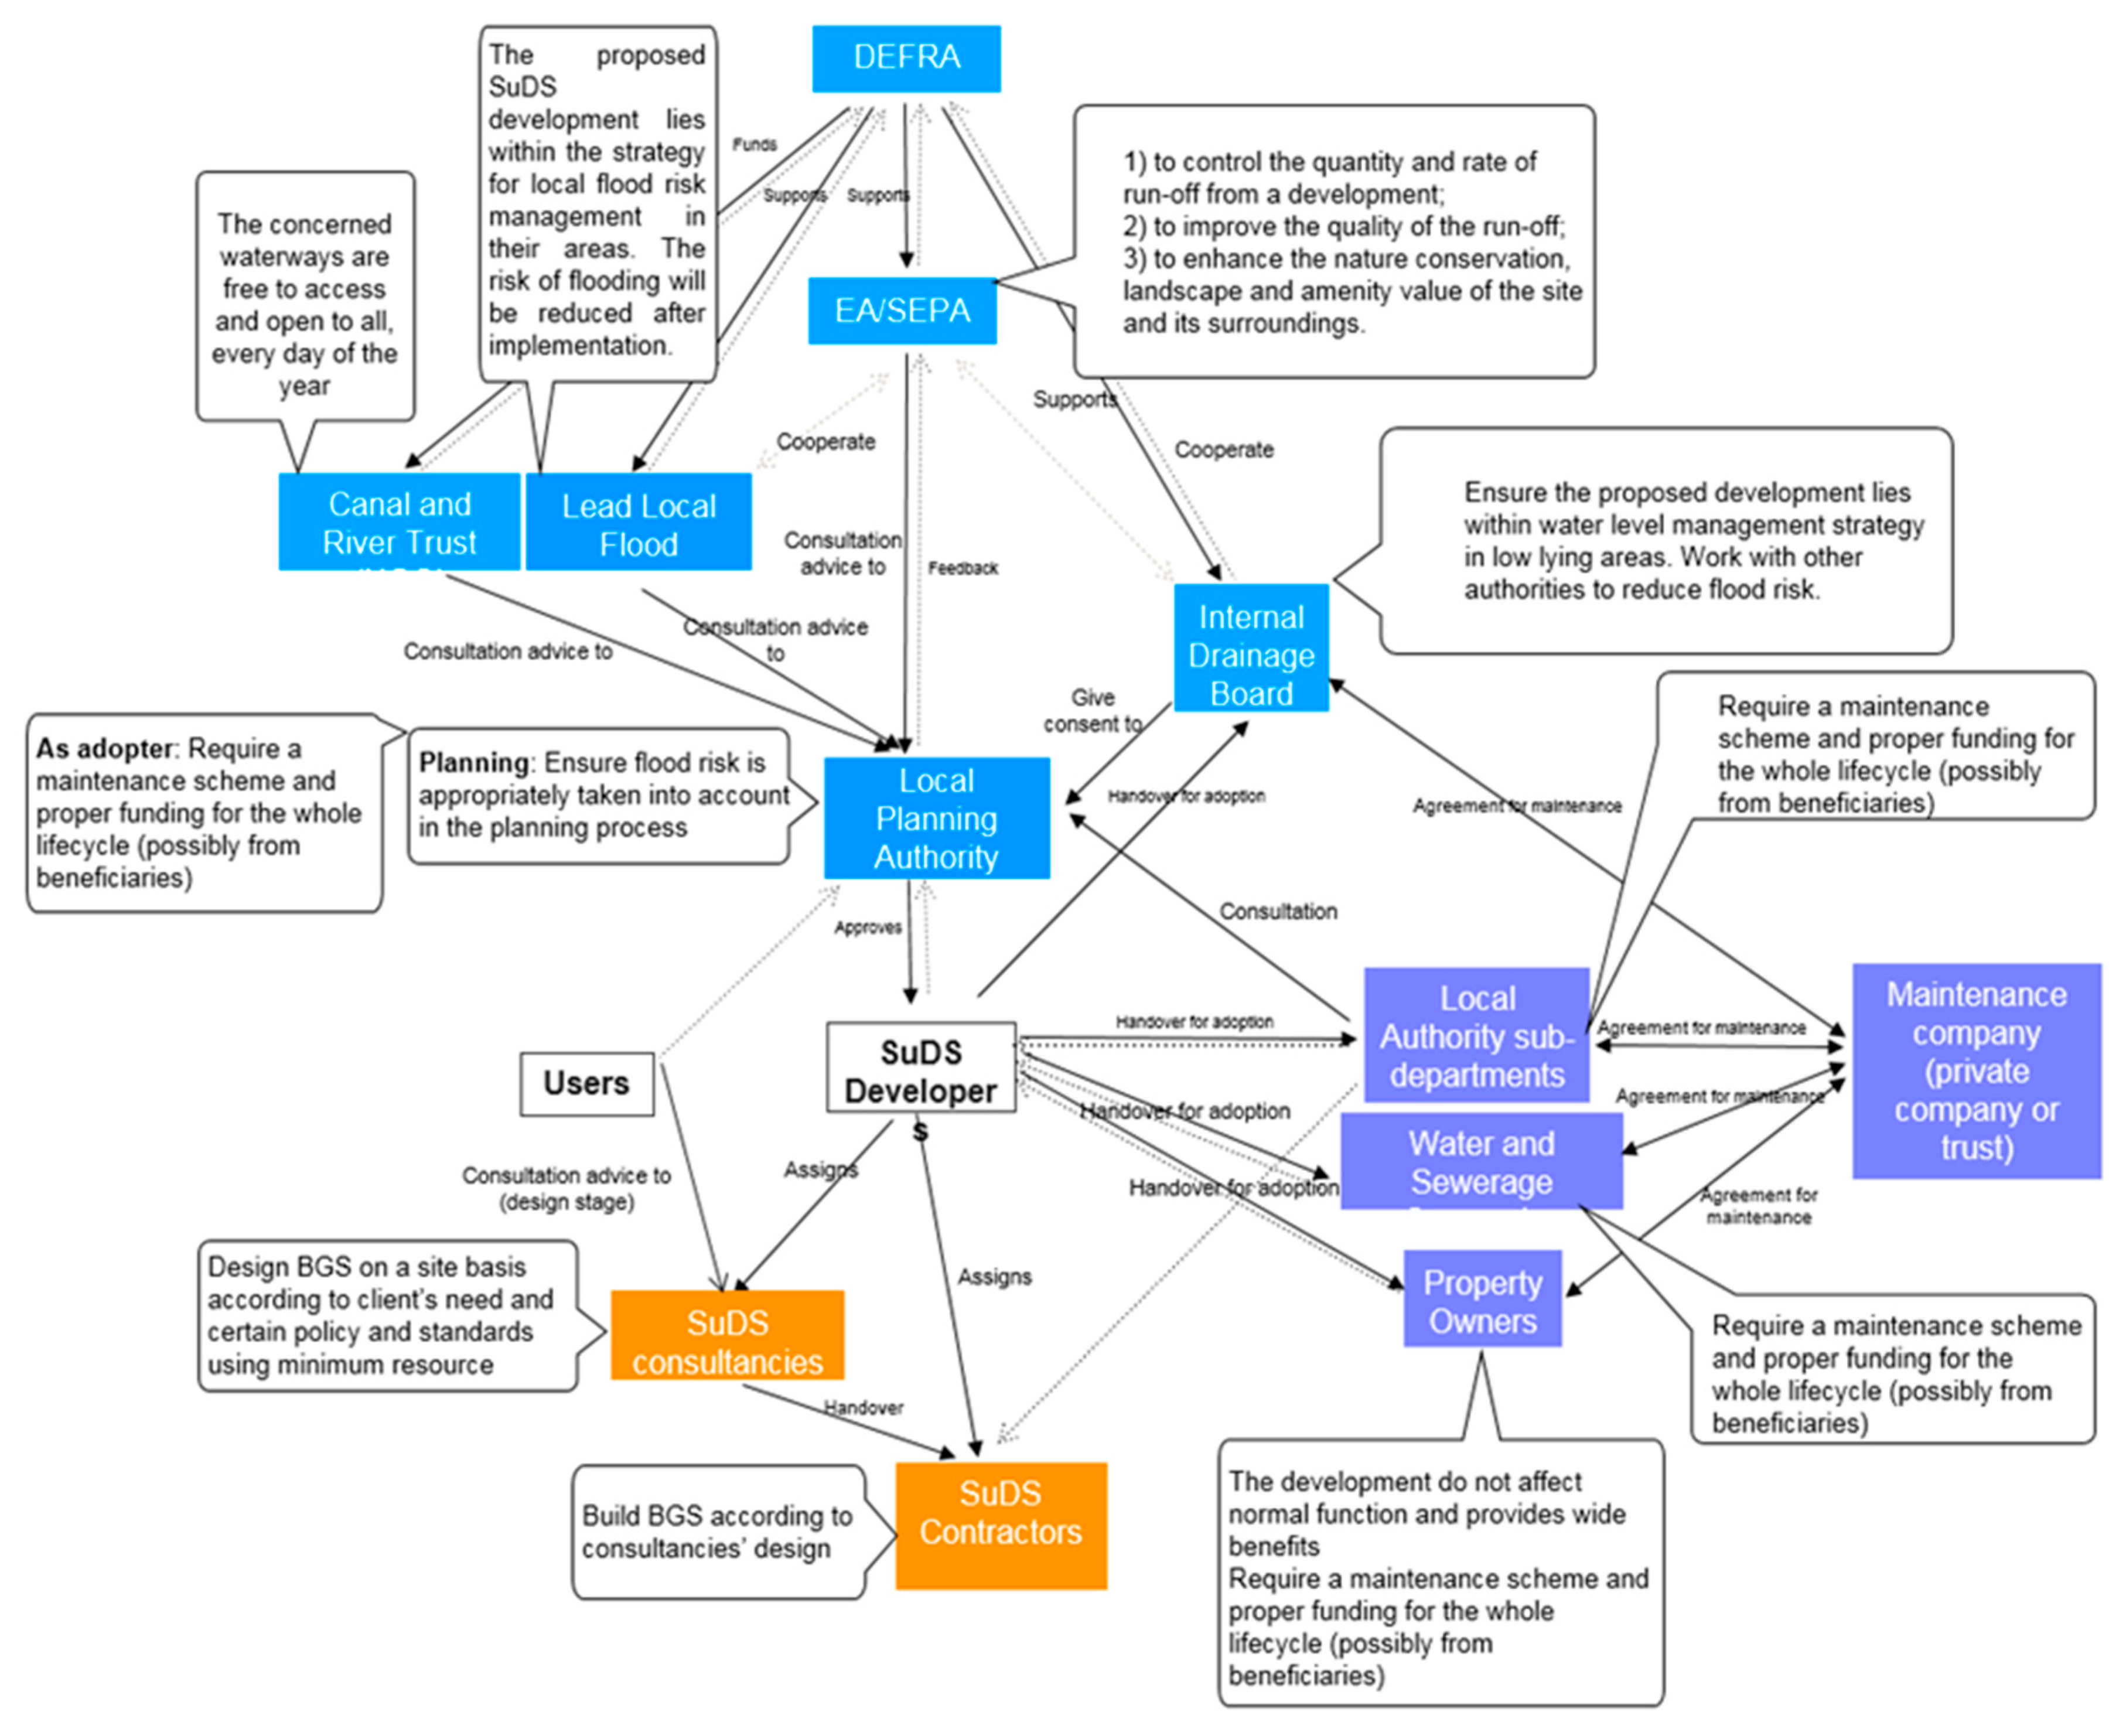
The stakeholder system map representing all UK stakeholders and their interdependencies for the SuDS system is shown in Figure 3. According to the primary role of each stakeholder, the system is divided into three main groups: Institutional, Design and Build as well as Adoption and Maintenance.
The Institutional group represents the government administration with approval power over the water system. It consists of all stakeholders within the government (marked blue in Figure 4). The Design and Build group (marked in orange) represents the consultants and contractors, which are both employed by the developers. Lastly, the Adoption and Maintenance group (marked in purple) represents an agreement system for adoption and maintenance consisting of adopters and maintenance companies.
It is worth mentioning that interrelations still exist among the three groups due to the complexity of the situation. Developers coordinate SuDS projects and have linkages to all three groups and all users. Users/citizens utilize the results of SuDS projects, and they give feedbacks to designers in the form of consultation. They can also give advice to the Institutional group as a non-statutory consultee.
The N2 method was then applied to the system to analyse the interdependencies between stakeholders. In the UK system analysed, there are 14 stakeholders and 37 interdependencies in total. As developers have connections to all other groups and have the most interactions among all stakeholders, they were identified as the critical element. The users are the source element and consultants and contractors are connecting elements. The un-clustered matrix created according to the stakeholder system map is provided in Supplementary Materials (Figure S1). Each stakeholder was then assigned a number for convenience of clustering (Supplementary Materials, Table S2).
The result of the grouping is shown in Figure 5, where all the government authorities, managing companies, developers, owners and acting parties are grouped together. In other words, the Institutional and Adoption and Maintenance groups should be managed together due to mutual interdependencies through information flows. As there are no strong feedbacks from consultancies and construction companies, they cannot be grouped, and hence they have been identified as isolated elements in the system. This is consistent with the fact that in the UK, consultancies and contractors only form a contract with developers and do not take part in the decision-making process. Users were defined as a separate component of a system as well, because their acceptance and behaviour are drivers for the whole SuDS system (more details of clustering are given in the Supplementary Materials, Table S2).
3.2. Stakeholder Priorities
The stakeholders selected for the survey were drawn from the results of the N2 method; at least one stakeholder from each group was included in the ANP network (Table 2) to account for the key elements of the SuDS.
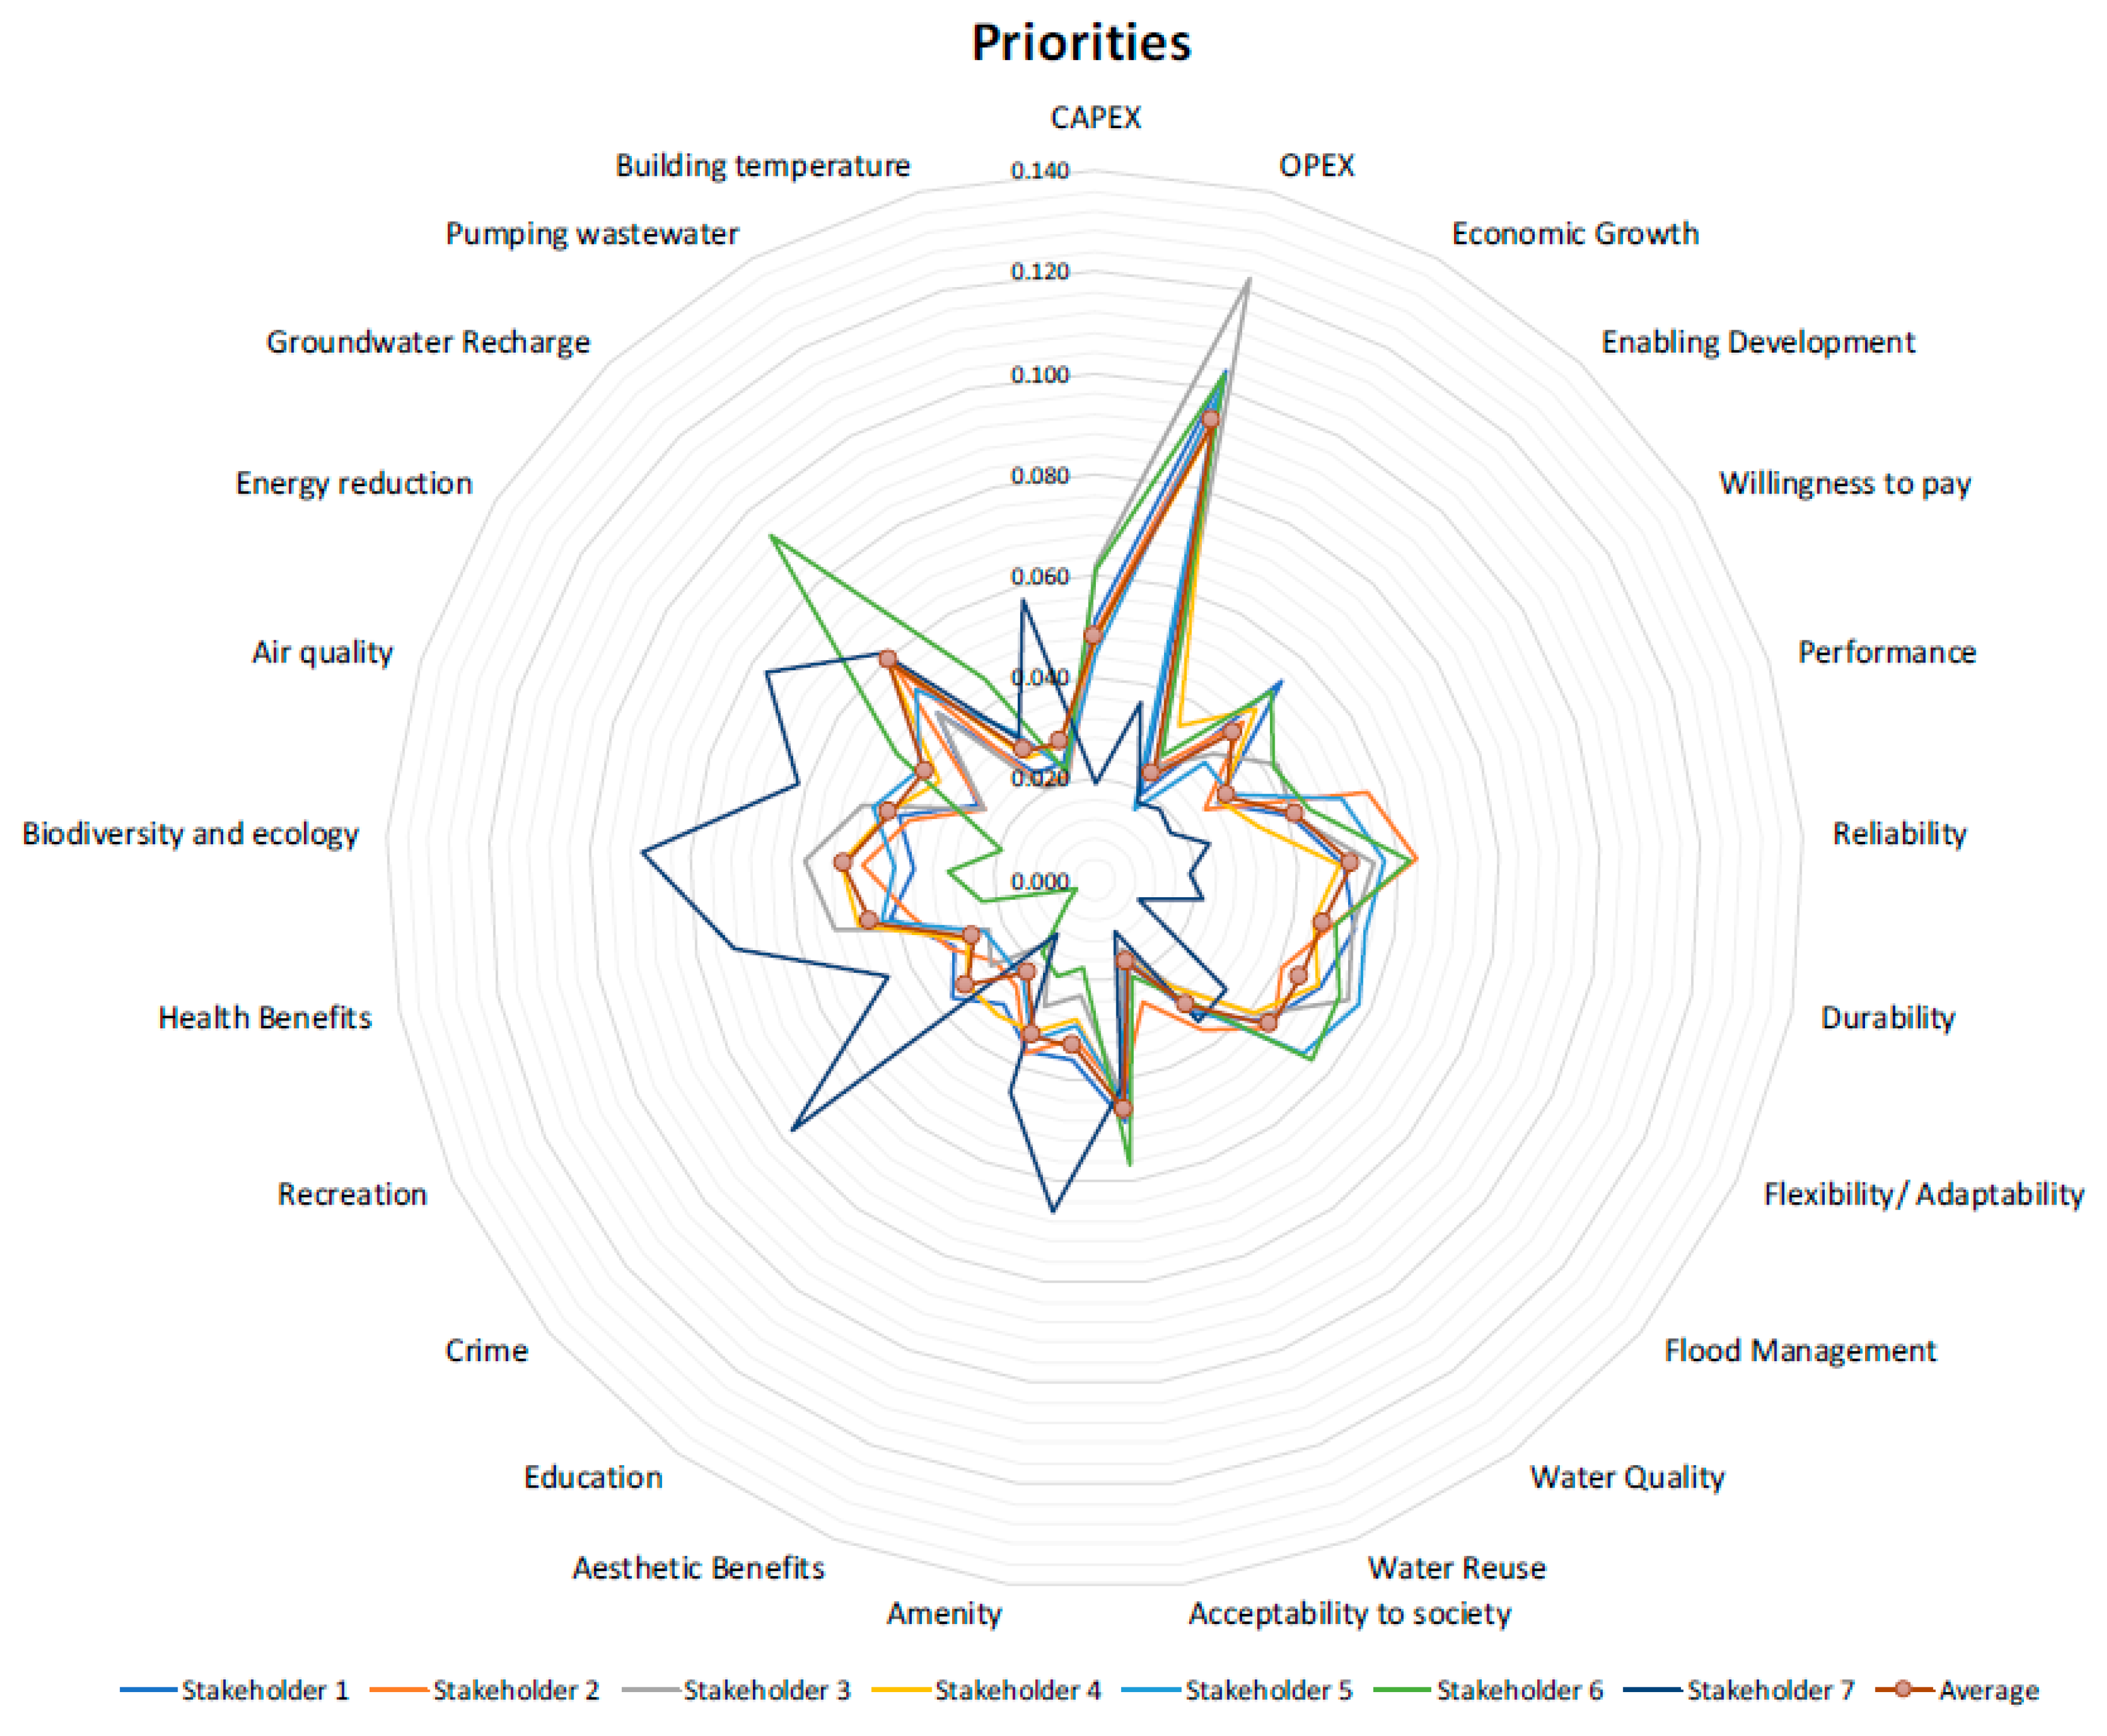
The priorities of each stakeholder were calculated using the ANP method facilitated by the Superdecision software. Figure 6 illustrates the priorities of each stakeholder as well as the average value, which can be seen as a proxy for a shared perception of SuDS. For a majority of the stakeholders, the most important criteria were economic and technical, while the other criteria such as social ones had lower priority. For all of the stakeholders apart from Stakeholder 7, the most important criterion was the Operating Expenditure (OPEX). This was reasonable considering that the criterion of Durability, which scores high as well, was related directly to the OPEX in the ANP network. The exceptions to this pattern were Stakeholders 6 and 7. More specifically, for Stakeholder 6, the water company, Groundwater Recharge was the second most important criterion since it is a major source of water for them. For Stakeholders 7 and 3, who represent the residents and the environmentalists, respectively, the most important criteria were social, environmental and wider benefits, with the most important criterion being Biodiversity and Ecology.
The results show that not a single criterion was excluded from the stakeholders’ scoring, which means that all of them are relevant but at different intensities. The mix of stakeholders surveyed secures a balance between the trend of prioritising the physical benefits of SuDS (such as OPEX) and the social and environmental benefits, especially as Stakeholder 7 is an insolvent stakeholder in the N2 method (S14) with a high weight. This strengthens the generality of the results and increases their credibility as a solid basis on which to build conclusions.
3.3. Selection of Modelling Approach
It is clear from Figure 6 that different stakeholders have different interests in SuDS; therefore, it is necessary to understand their interests before beginning any modelling exercise. Stakeholders may have different tolerances with respect to the reliability of the modelling results. For instance, 80% accurate results from a lumped model could be enough for a local council or resident to draw conclusions about SuDS performance. On the other hand, a reliability in model outputs of less than 90% may not be accepted by designers or researchers whose work is used to write guidelines or to construct SuDS where over design would result in unnecessary extra costs and under design may pose a risk of failure.
From the ANP results, it can be seen that the more SuDS benefits are of interest to a certain stakeholder, the less role they have in the actual implementation of SuDS projects and therefore the less modelling complexity they need to make their decisions. This suggests that the simplicity associated with the use of basic models such as conceptual or lumped designs can be acceptable by stakeholders such as residents, local councils and policy makers, because their role in the realisation of SuDS projects is at a high level. For instance, a simple scoring system is sufficient for citizens to learn about SuDS, whereas for environmental regulators and water companies, a more granular models giving high resolution results are needed to determine the level of SuDS performance. Lastly, the most complex physically-based models are used in the technical design of a SuDS when the individual components of the system are designed separately and then integrated to form a constructible and operational design within the existing urban landscape.
Therefore, the decision about what level of complexity should be adopted in SuDS modelling may now be attributed to stakeholders based on their priorities and according to their position in the decision-making process (Table 3). This can help tailor the modelling exercise to better manage the available resources without compromising the influence of the modelling results on stakeholder decision making.
4. Conclusions
SuDS projects provide a broad array of benefits, affecting diverse stakeholders. This paper addresses the issue of providing a methodological framework to determine the optimal SuDS hydrological modelling approach for the different stakeholders involved in SuDS projects.
The confidence levels of different modelling approaches and the extent to which they fulfil the stakeholders’ goals are not well established, and a systematic investigation towards establishing these thresholds is identified as a gap in the literature. Conducting complex and time-consuming modelling exercises are rather more utilised when addressing any stakeholder needs.
Soft System Methodology evaluates the system holistically to characterise the decision-making process and identify potential interventions to ameliorate the system in a loopback approach. The stakeholders’ interests in SuDS were determined through a survey questionnaire addressed to a population of the clustered stakeholders. The results of the survey were analysed using the Analytical Network Process to determine their priorities.
With the N2 method it was possible to cluster 14 stakeholders into 4 groups where the Institutional and Adoption and Management groups are managed together, the consultancies and contractors are identified as separate groups and the users as the source group. The ANP results showed that for the stakeholders identified as Institutional group, the key priorities are the economic, social and environmental aspects of the SuDS. Whereas for the Adoption and Maintenance group, such as water companies, the most important aspects were the technical and economic benefits of the SuDS. For the consultancies and researchers, their first worry is the technical aspects of SuDS projects, among others, depending on the nature of a project. Lastly, the residents who are the users of any SuDS intervention are mostly interested in environmental and social benefits, and the economic impact on them.
By presenting a robust systems framework, it is possible to see how analysing the system of SuDS stakeholders may enable future optimisation of implementation tools, starting with better management of efforts utilised in hydrologic modelling of SuDS. The more direct action a stakeholder has in the system the more complex the model he will need, compared to a less complex model needed for a stakeholder who has a minor impact on the decision-making system.
While this study establishes a methodological framework, it is important to apply such methods in a computational case where different models are quantitatively compared and evaluated based on the level of accuracy of the information they provide for a decision-maker in the SuDS system.
Supplementary Materials
The following are available online at https://www.mdpi.com/2073-4441/12/3/632/s1, Questionnaire Survey, Figure S1: Un-clustered initial matrix of stakeholders and the possible links between them, Table S1: SuDS benefits categorised by the selected criteria for stakeholder priorities assessment, Table S2: Stakeholders names, numbers and grouping for the N2 method.
Author Contributions
Conceptualization, M.H.E.H. and A.M.; methodology, M.H.E.H., G.T. and X.R.; software, G.T.; validation, M.H.E.H. and A.M.; formal analysis, G.T., X.R. and M.H.E.H.; investigation, G.T., X.R. and M.H.E.H.; resources, M.H.E.H. and A.M.; data curation, M.H.E.H.; writing—original draft preparation, M.H.E.H., G.T. and X.R.; writing—review and editing, A.M.; visualization, M.H.E.H., G.T. and X.R.; supervision, A.M.; project administration, A.M.; funding acquisition, A.M. All authors have read and agreed to the published version of the manuscript.
Funding
This research was funded by the Center for Doctoral Training (CDT) in Sustainable Civil Engineering at Imperial College London and Thames Water Utilities Limited through a grant from the Engineering and Physical Sciences Research Council (EPSRC), grant number EP/L016826/1.
Acknowledgments
The authors would like to thank the stakeholders who participated in the questionnaire survey and the London Borough of Hammersmith and Fulham for giving us the platform to discuss the goals of this study. Also, the authors would like to thank Zorica Todorovic, from Atkins member of the SNC-Lavalin Group for sharing her thoughts with the authors. Finally, the authors would like to thank the anonymous reviewers whose feedback and comments helped strengthen the paper and make it more robust.
Conflicts of Interest
The authors declare no conflict of interest. The funders had no role in the design of the study; in the collection, analyses or interpretation of data; in the writing of the manuscript or in the decision to publish the results.
References
- United Nations. The Speed of Urbanization around the World. Population Facts. 2018. Available online: https://www.un.org/en/development/desa/population/publications/pdf/popfacts/PopFacts_2018-1.pdf (accessed on 11 January 2019).
- Rauch, W.; Seggelke, K.; Brown, R.; Krebs, P. Integrated Approaches in Urban Storm Drainage: Where Do We Stand? Environ. Manag. 2005, 35, 396–409. [Google Scholar] [CrossRef]
- Bamford, T.B.; Balmforth, D.J.; Lai, R.H.H.; Martin, N. Understanding the Complexities of Urban Flooding through Integrated Modelling. In Proceedings of the 11th International Conference on Urban Drainage, Edinburgh, Scotland, UK, 31 August–5 September 2008. [Google Scholar]
- Chen, A.S.; Djordjević, S.; Leandro, J.; Savić, D.A. An Analysis of the Combined Consequences of Pluvial and Fluvial Flooding. Water Sci. Technol. 2010, 62, 1491–1498. [Google Scholar] [CrossRef]
- Sto. Domingo, N.D.; Refsgaard, A.; Mark, O.; Paludan, B. Flood Analysis in Mixed-Urban Areas Reflecting Interactions with the Complete Water Cycle through Coupled Hydrologic-Hydraulic Modelling. Water Sci. Technol. 2010, 62, 1386–1392. [Google Scholar] [CrossRef]
- Ward, S.; Farmani, R.; Atkinson, S.; Butler, D.; Hargreaves, A.; Cheng, V.; Denman, S.; Echenique, M. Towards an Integrated Modelling Framework for Sustainable Urban Development. In Proceedings of the 9th International Conference on Urban Drainage Modelling, Belgrade, Serbia, 4–7 September 2012. [Google Scholar]
- Bach, P.M.; Rauch, W.; Mikkelsen, P.S.; Mccarthy, D.T.; Deletic, A. Environmental Modelling & Software A Critical Review of Integrated Urban Water Modelling - Urban Drainage and Beyond. Environ. Model. Softw. 2014, 54, 88–107. [Google Scholar] [CrossRef]
- Kroll, S.; Fenu, A.; Wambecq, T.; Weemaes, M.; Van Impe, J.; Willems, P. Energy Optimization of the Urban Drainage System by Integrated Real-Time Control during Wet and Dry Weather Conditions. Urb. Water J. 2018, 15, 362–370. [Google Scholar] [CrossRef]
- Woods-Ballard, B.; Kellagher, R.; Martin, P.; Jefferies, C.; Bray, R.; Shaffer, P. The SUDS Manual; CIRIA: London, UK, 2015. [Google Scholar]
- Lai, E.; Lundie, S.; Ashbolt, N.J. Review of Multi-Criteria Decision Aid for Integrated Sustainability Assessment of Urban Water Systems. Urb. Water J. 2008, 5, 315–327. [Google Scholar] [CrossRef]
- Thampapillai, D.J. Environmental Economics; Oxford University Press: Melbourne, Australia, 1991. [Google Scholar]
- Pearce, D.; Atkinson, G.; Mourato, S. Cost Benefit Analysis and the Environment: Recent Developments; Organisation for Economic Co-operation and Development: Paris, French, 2006. [Google Scholar]
- Arrow, K.J.; Cropper, M.L.; Eads, G.C.; Hahn, R.W.; Lave, L.B.; Noll, R.G.; Stavins, R.N. Is there a role for benefit-cost analysis in environmental, health, and safety regulation? Environm. Dev. Econom. 1997, 2, 195–221. [Google Scholar] [CrossRef] [Green Version]
- Ossa-Moreno, J.; Smith, K.M.; Mijic, A. Economic Analysis of Wider Benefits to Facilitate SuDS Uptake in London, UK. Sustain. Cities Soc. 2017, 28, 411–419. [Google Scholar] [CrossRef] [Green Version]
- Liu, Y.; Bralts, V.F.; Engel, B.A. Evaluating the Effectiveness of Management Practices on Hydrology and Water Quality at Watershed Scale with a Rainfall-Runoff Model. Sci. Total Environ. 2015, 511, 298–308. [Google Scholar] [CrossRef]
- Resource Assessment Commission. Multi-Criteria Analysis as a Resource Assessment Tool; Australian Government Publishing Service: Canberra, Australia, 1992. [Google Scholar]
- Belton, V.; Stewart, T.J. Multiple Criteria Decision Analysis: An Integrated Approach; Kluwer Academic Publishers: Boston, NY, USA, 2005. [Google Scholar]
- Hajkowicz, S.; Collins, K. A review of multiple criteria analysis for water resource planning and management. Water Resour. Manag. 2007, 21, 1553–1566. [Google Scholar] [CrossRef]
- Ellis, J.B.; Deutsch, J.C.; Mouchel, J.M.; Scholes, L.; Revitt, M.D. Multicriteria Decision Approaches to Support Sustainable Drainage Options for the Treatment of Highway and Urban Runoff. Sci. Total Environ. 2004, 334–335, 251–260. [Google Scholar] [CrossRef] [PubMed]
- Elkington, J. Cannibals with Forks: The triple Bottom Line of 21st Century Business; New Society Publishers: Gabriola Island, BC, Canada, 1998. [Google Scholar]
- Viavattene, C.; Ellis, J.B. The Management of Urban Surface Water Flood Risks: SUDS Performance in Flood Reduction from Extreme Events. Water Sci. Technol. 2013, 67, 99–108. [Google Scholar] [CrossRef] [PubMed]
- Parker, P.; Letcher, R.; Jakeman, A.; Beck, M.B.; Harris, G.; Argent, R.M.; Sullivan, P. Progress in integrated assessment and modelling. Environm. Model. Softw. 2002, 17, 209–217. [Google Scholar] [CrossRef]
- Brouwer, R.; Georgiou, S.; Turner, R.K. Integrated assessment and sustainable water and wetland management. A review of concepts and methods. Integr. Assess. 2003, 4, 172–184. [Google Scholar] [CrossRef]
- Saaty, T.L. —Dependence and Feedback in Decision-Making with a Single Network. J. Syst. Sci. Syst. Eng. 2004, 13, 129–157. [Google Scholar] [CrossRef]
- Lee, J.W.; Kim, S.H. Using Analytic Network Process and Goal Programming for Interdependent Information System Project Selection. Comput. Oper. Res. 2000, 27, 367–382. [Google Scholar] [CrossRef]
- Boran, S.; Goztepe, K. Development of a Fuzzy Decision Support System for Commodity Acquisition Using Fuzzy Analytic Network Process. Expert Syst. Appl. 2010, 37, 1939–1945. [Google Scholar] [CrossRef]
- Nawaz, S.; Ali, Y. Factors Affecting the Performance of Water Treatment Plants in Pakistan. Water Conserv. Sci. Eng. 2018, 3, 191–203. [Google Scholar] [CrossRef]
- Molinos-Senante, M.; Gómez, T.; Caballero, R.; Hernández-Sancho, F.; Sala-Garrido, R. Assessment of Wastewater Treatment Alternatives for Small Communities: An Analytic Network Process Approach. Sci. Total Environ. 2015, 532, 676–687. [Google Scholar] [CrossRef]
- Wey, W.M.; Wei, W.L. Urban Street Environment Design for Quality of Urban Life. Soc. Indic. Res. 2016, 126, 161–186. [Google Scholar] [CrossRef]
- Zografidou, E.; Petridis, K.; Arabatzis, G.; Dey, P.K. Optimal Design of the Renewable Energy Map of Greece Using Weighted Goal-Programming and Data Envelopment Analysis. Comput. Oper. Res. 2016, 66, 313–326. [Google Scholar] [CrossRef] [Green Version]
- TWUL. Why We Need the Counters Creek Storm Relief Sewer. 2013. Available online: https://www.thameswater.co.uk/sitecore/content/counterscreek/counterscreek/theproblem/why-we-need-the-storm-relief-sewer (accessed on 12 March 2018).
- Hattab, M.E.; Vernon, D.; Mijic, A. Performance Evaluation of retrofitted low impact development practices in urban environments: A case study from London, UK. In Proceedings of the International Conference on Sustainable Infrastructure 2017: Technology, New York, NY, USA, 26–28 October 2017. [Google Scholar] [CrossRef]
- Ashley, R.; Woods-Ballard, B.; Shaffer, P.; Wilson, S.; Illman, S.; Walker, L.; D’Arcy, B.; Chatfield, P. UK Sustainable Drainage Systems: Past, Present and Future. Proc. Inst. Civ. Eng.-Civ. Eng. 2015, 168, 125–130. [Google Scholar] [CrossRef]
- Alves, A.; Gómez, J.P.; Vojinovic, Z.; Sánchez, A.; Weesakul, S. Combining Co-Benefits and Stakeholders Perceptions into Green Infrastructure Selection for Flood Risk Reduction. Environments 2018, 5, 29. [Google Scholar] [CrossRef] [Green Version]
- Thorne, C.R.; Lawson, E.C.; Ozawa, C.; Hamlin, S.L.; Smith, L.A. Overcoming Uncertainty and Barriers to Adoption of Blue-Green Infrastructure for Urban Flood Risk Management. J. Flood Risk Manag. 2018, 11, S960–S972. [Google Scholar] [CrossRef]
- O’Donnell, E.C.; Lamond, J.E.; Thorne, C.R. Recognising Barriers to Implementation of Blue-Green Infrastructure: A Newcastle Case Study. Urban. Water J. 2017, 14, 964–971. [Google Scholar] [CrossRef] [Green Version]
- Gasson, S. The Use of Soft Systems Methodology (SSM) as a Tool for Investigation; Warwick Business School: Coventry, UK, 1994. [Google Scholar]
- Burge, S. The Systems Engineering Tool Box. Available online: https://www.burgehugheswalsh.co.uk/Uploaded/1/Documents/Functional-Modelling-Tool-Draft.pdf (accessed on 8 June 2017).
- Bustnay, T.; Ben-Asher, J.Z. How Many Systems Are There?—Using the N2method for Systems Partitioning. Syst. Eng. 2005, 8, 109–118. [Google Scholar] [CrossRef]
- Bird, D.K. The Use of Questionnaires for Acquiring Information on Public Perception of Natural Hazards and Risk Mitigation—A Review of Current Knowledge and Practice. Nat. Hazards Earth Syst. Sci. 2009, 9, 1307–1325. [Google Scholar] [CrossRef]
- Saaty, T.L.; Takizawa, M. Dependence and Independence: From Linear Hierarchies to Nonlinear Networks. Eur. J. Oper. Res. 1986, 26, 229–237. [Google Scholar] [CrossRef]
- Grimaldi, M.; Pellecchia, V.; Fasolino, I. Urban Plan and Water Infrastructures Planning: A Methodology Based on Spatial ANP. Sustainability 2017, 9, 771. [Google Scholar] [CrossRef] [Green Version]
- Creative Decisions Foundation. Super Decision CDF. Available online: https://superdecisions.com/ (accessed on 10 July 2017).
- Meade, L.M.; Sarkis, J. Analyzing Organizational Project Alternatives for Agile Manufacturing Processes: An Analytical Network Approach. Int. J. Prod. Res. 1999, 37, 241–261. [Google Scholar] [CrossRef]
- Saaty, R.W. Decision Making in Complex Environment: The Analytic Hierarchy Process (AHP) for Decision Making and the Analytic Network Process (ANP) for Decision Making with Dependence and Feedback; Super Decisions: Pittsburgh, PA, USA, 2003. [Google Scholar]
Figure 1.
Hydrological Assessment and Management of green Infrastructure to Enhance Decision-making (HAMIED): A framework to adapt the optimal Sustainable Urban Drainage Systems (SuDS) modelling approach according to stakeholders’ priorities.
Figure 1.
Hydrological Assessment and Management of green Infrastructure to Enhance Decision-making (HAMIED): A framework to adapt the optimal Sustainable Urban Drainage Systems (SuDS) modelling approach according to stakeholders’ priorities.

Figure 2.
Counters Creek Catchment (in green) within the London Borough of Hammersmith (LBHF) and The Royal Borough of Kensington and Chelsea (RBKC), London, UK.
Figure 2.
Counters Creek Catchment (in green) within the London Borough of Hammersmith (LBHF) and The Royal Borough of Kensington and Chelsea (RBKC), London, UK.

Figure 3.
Example ANP network structure for SuDS stakeholders’ priorities assessment. The connections with the stakeholders ‘goals are represented by a continuous line; the connections of the main criteria with the sub-criteria are represented by a dashed line; and the interactions among the criteria are represented by a dashed dot line. The loops indicate inner dependence among the elements in the cluster. ANP, Analytic Network Process; CAPEX, CAPital Expenditure; OPEX, OPerating EXpense.

Figure 4.
Stakeholders system map for the UK SuDS system (blue colour for the Institutional group, orange colour for the Design and Build group, purple colour for the Adoption and Maintenance group; dotted arrows represent a feedback link). DEFRA, Department for Environment, Food and Rural Affairs; EA, Environment Agency; SEPA, Scottish Environment Protection Agency; BGS, Blue Green Solution.

Figure 5.
Results of the N2 method (orange colour for critical elements in the decision-making, i.e., Institutional group and Adoption and Maintenance group, and blue colour for source, i.e., users). S8 and S9 correspond to consultancies that do the designs and the contractors that do the construction. Stakeholder numbers (S1–14) correspond to those defined in Table S2.

Figure 6.
Priorities of each stakeholder and the average value using ANP for the UK SuDS case study. ANP, Analytic Network Process; CAPEX, CAPital Expenditure; OPEX, OPerating EXpense.
Figure 6.
Priorities of each stakeholder and the average value using ANP for the UK SuDS case study. ANP, Analytic Network Process; CAPEX, CAPital Expenditure; OPEX, OPerating EXpense.


Table 1.
Proposed scaling for assessing urban hydrologic models’ level of complexity.
| Type of Model | Spatial Scale | Time Scale | Level of Complexity |
|---|---|---|---|
| Conceptual | Site scale | Event based | Light |
| Lumped | Site scale | Event based/continuous simulation | Moderate |
| HRU | Catchment/regional | Event based/continuous simulation | Complex |
| Semi-distributed | Catchment scale | Event based/continuous simulation | Complex |
| Fully-distributed | Catchment scale | Event based/continuous simulation | Very Complex |
Note: HRU, Hydrologic Response Unit.
Table 2.
List of stakeholders who participated in the survey and their associated group according to the N2 results.
Table 2.
List of stakeholders who participated in the survey and their associated group according to the N2 results.
| Stakeholder No | Position | N2-No | N2-Group |
|---|---|---|---|
| 1 | Local Authority Engineer | S5 | Institutional |
| 2 | Economist | S4 | Institutional |
| 3 | Public Realm Manager | S2 | Institutional |
| 4 | Head of Maintenance | S13 | Adoption and Maintenance |
| 5 | Designer | S8 | Design and Build |
| 6 | Water Utility | S11 | Adoption and Maintenance |
| 7 | Resident | S14 | Source |
Table 3.
Classification of stakeholders involved in SuDS and the desired level of modelling complexity.
Table 3.
Classification of stakeholders involved in SuDS and the desired level of modelling complexity.
| Stakeholder | N2-Group | Key Priorities Base on ANP | Model Complexity |
|---|---|---|---|
| Water Utilities | Adoption and Maintenance | Technical and Economical | Complex |
| Local Councils | Institutional | Economic and Social | Moderate |
| Policy makers | Institutional | Technical, Economical, Environmental and Social | Moderate |
| Designers | Design and Build | Technical | Very Complex |
| Researchers | Design and Build | Technical | Very Complex |
| Residents | Source | Economic, Environmental and Social | Light |
| Environmental regulators | Institutional | Environmental and Technical | Complex |
Note: Analytic Network Process (ANP).
© 2020 by the authors. Licensee MDPI, Basel, Switzerland. This article is an open access article distributed under the terms and conditions of the Creative Commons Attribution (CC BY) license (http://creativecommons.org/licenses/by/4.0/).
Share and Cite
MDPI and ACS Style
El Hattab, M.H.; Theodoropoulos, G.; Rong, X.; Mijic, A. Applying the Systems Approach to Decompose the SuDS Decision-Making Process for Appropriate Hydrologic Model Selection. Water 2020, 12, 632. https://doi.org/10.3390/w12030632
AMA Style
El Hattab MH, Theodoropoulos G, Rong X, Mijic A. Applying the Systems Approach to Decompose the SuDS Decision-Making Process for Appropriate Hydrologic Model Selection. Water. 2020; 12(3):632. https://doi.org/10.3390/w12030632
Chicago/Turabian StyleEl Hattab, Mohamad H., Georgios Theodoropoulos, Xin Rong, and Ana Mijic. 2020. "Applying the Systems Approach to Decompose the SuDS Decision-Making Process for Appropriate Hydrologic Model Selection" Water 12, no. 3: 632. https://doi.org/10.3390/w12030632
Note that from the first issue of 2016, this journal uses article numbers instead of page numbers. See further details here.