Water Security Assessment of Groundwater Quality in an Anthropized Rural Area from the Atlantic Forest Biome in Brazil

 , ,
, ,  ,
,  and
and
Abstract
:1. Introduction
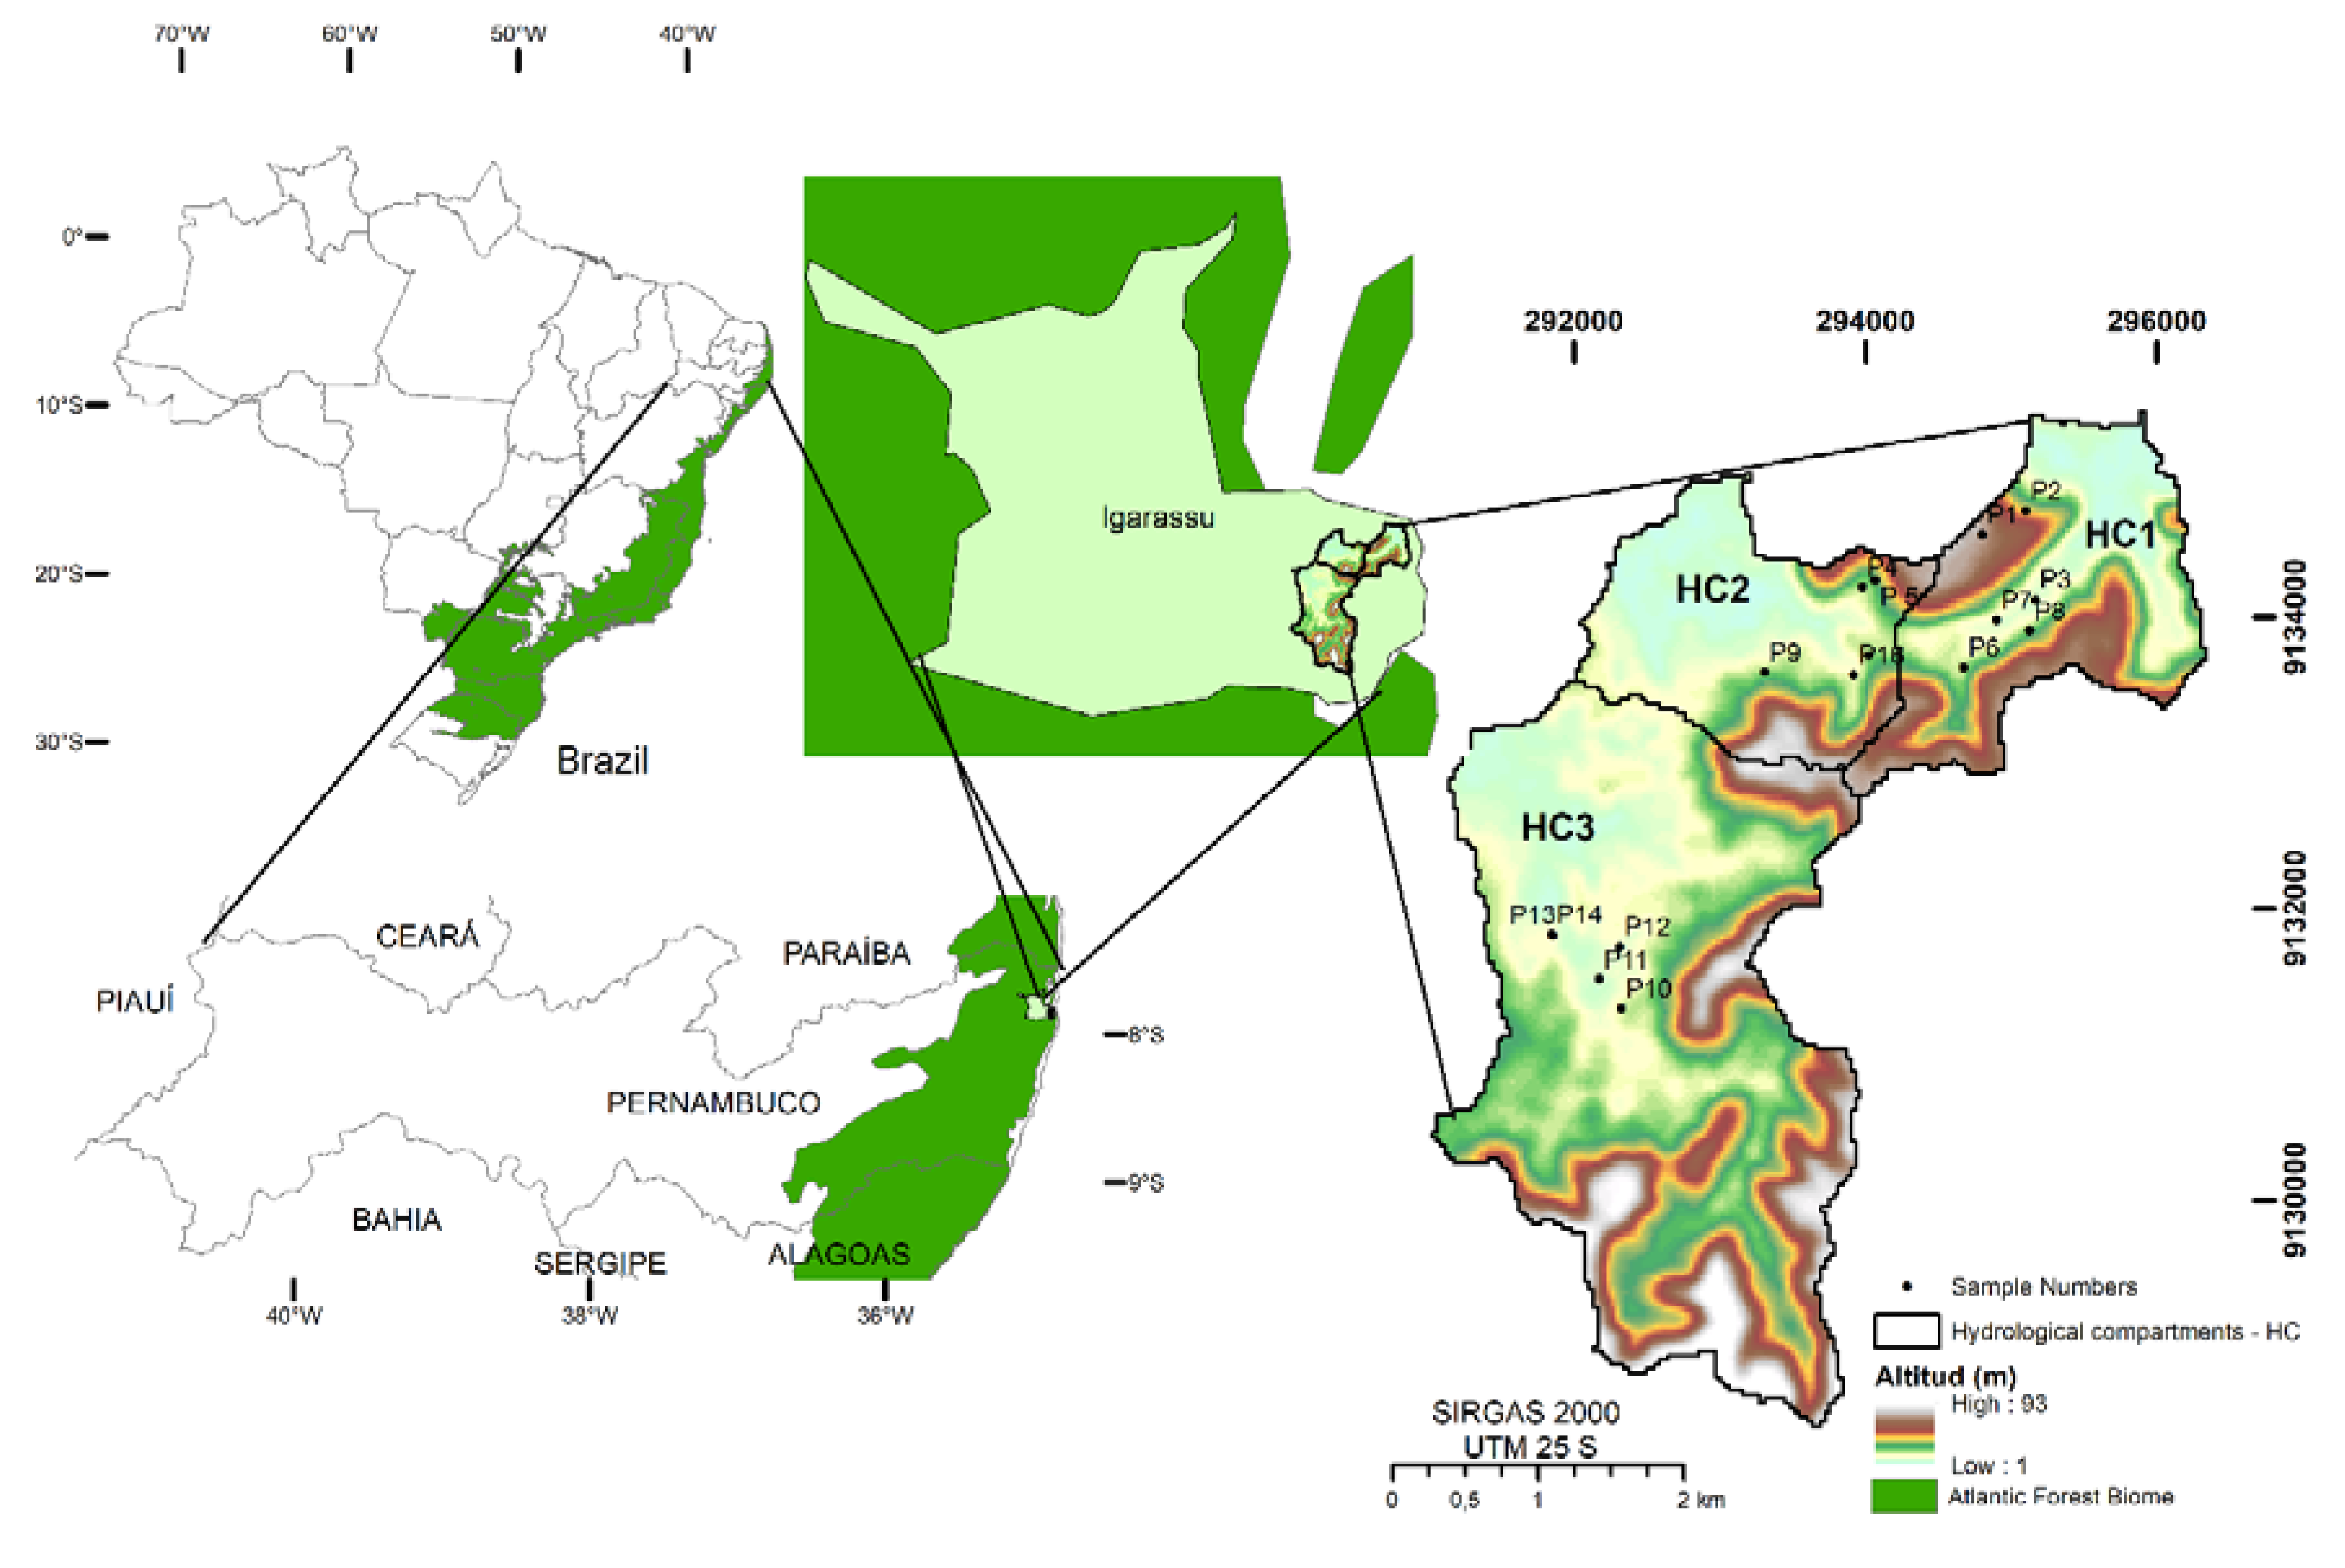
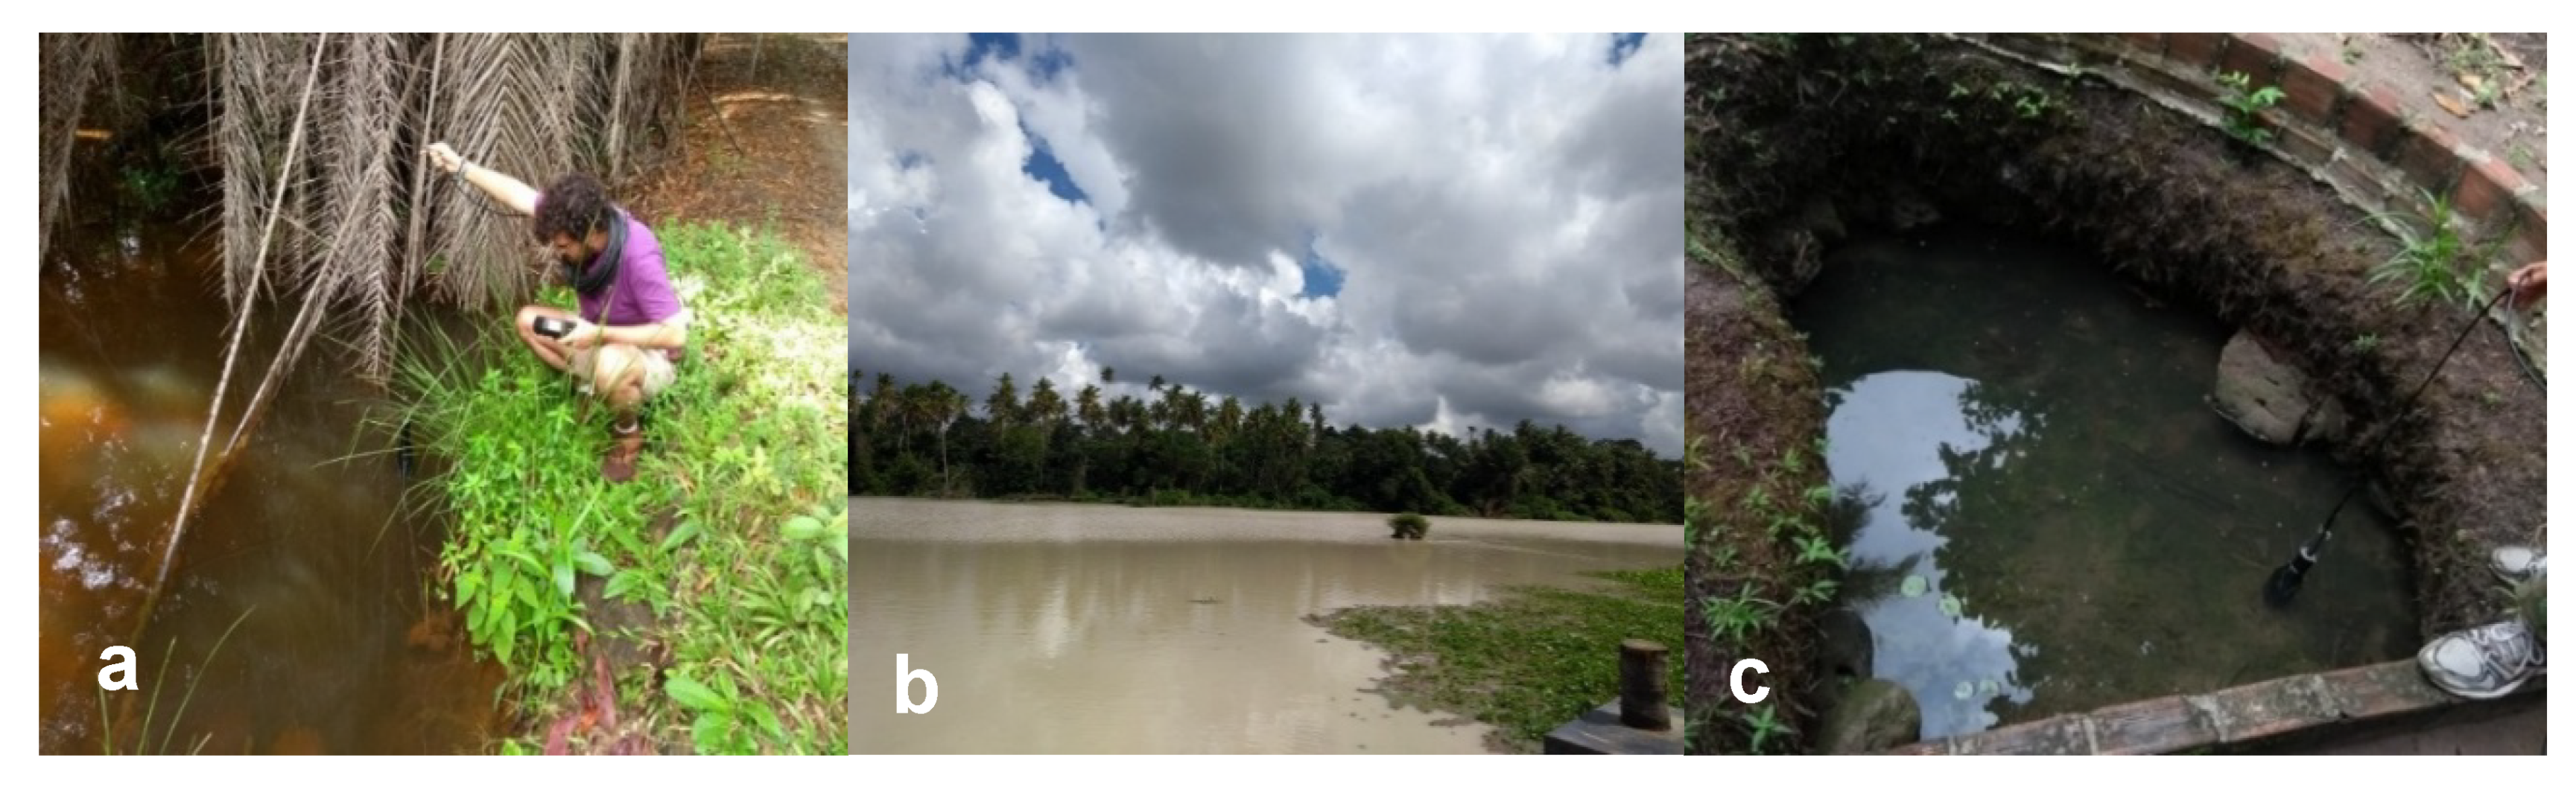
2. Materials and Methods
3. Results and Discussion
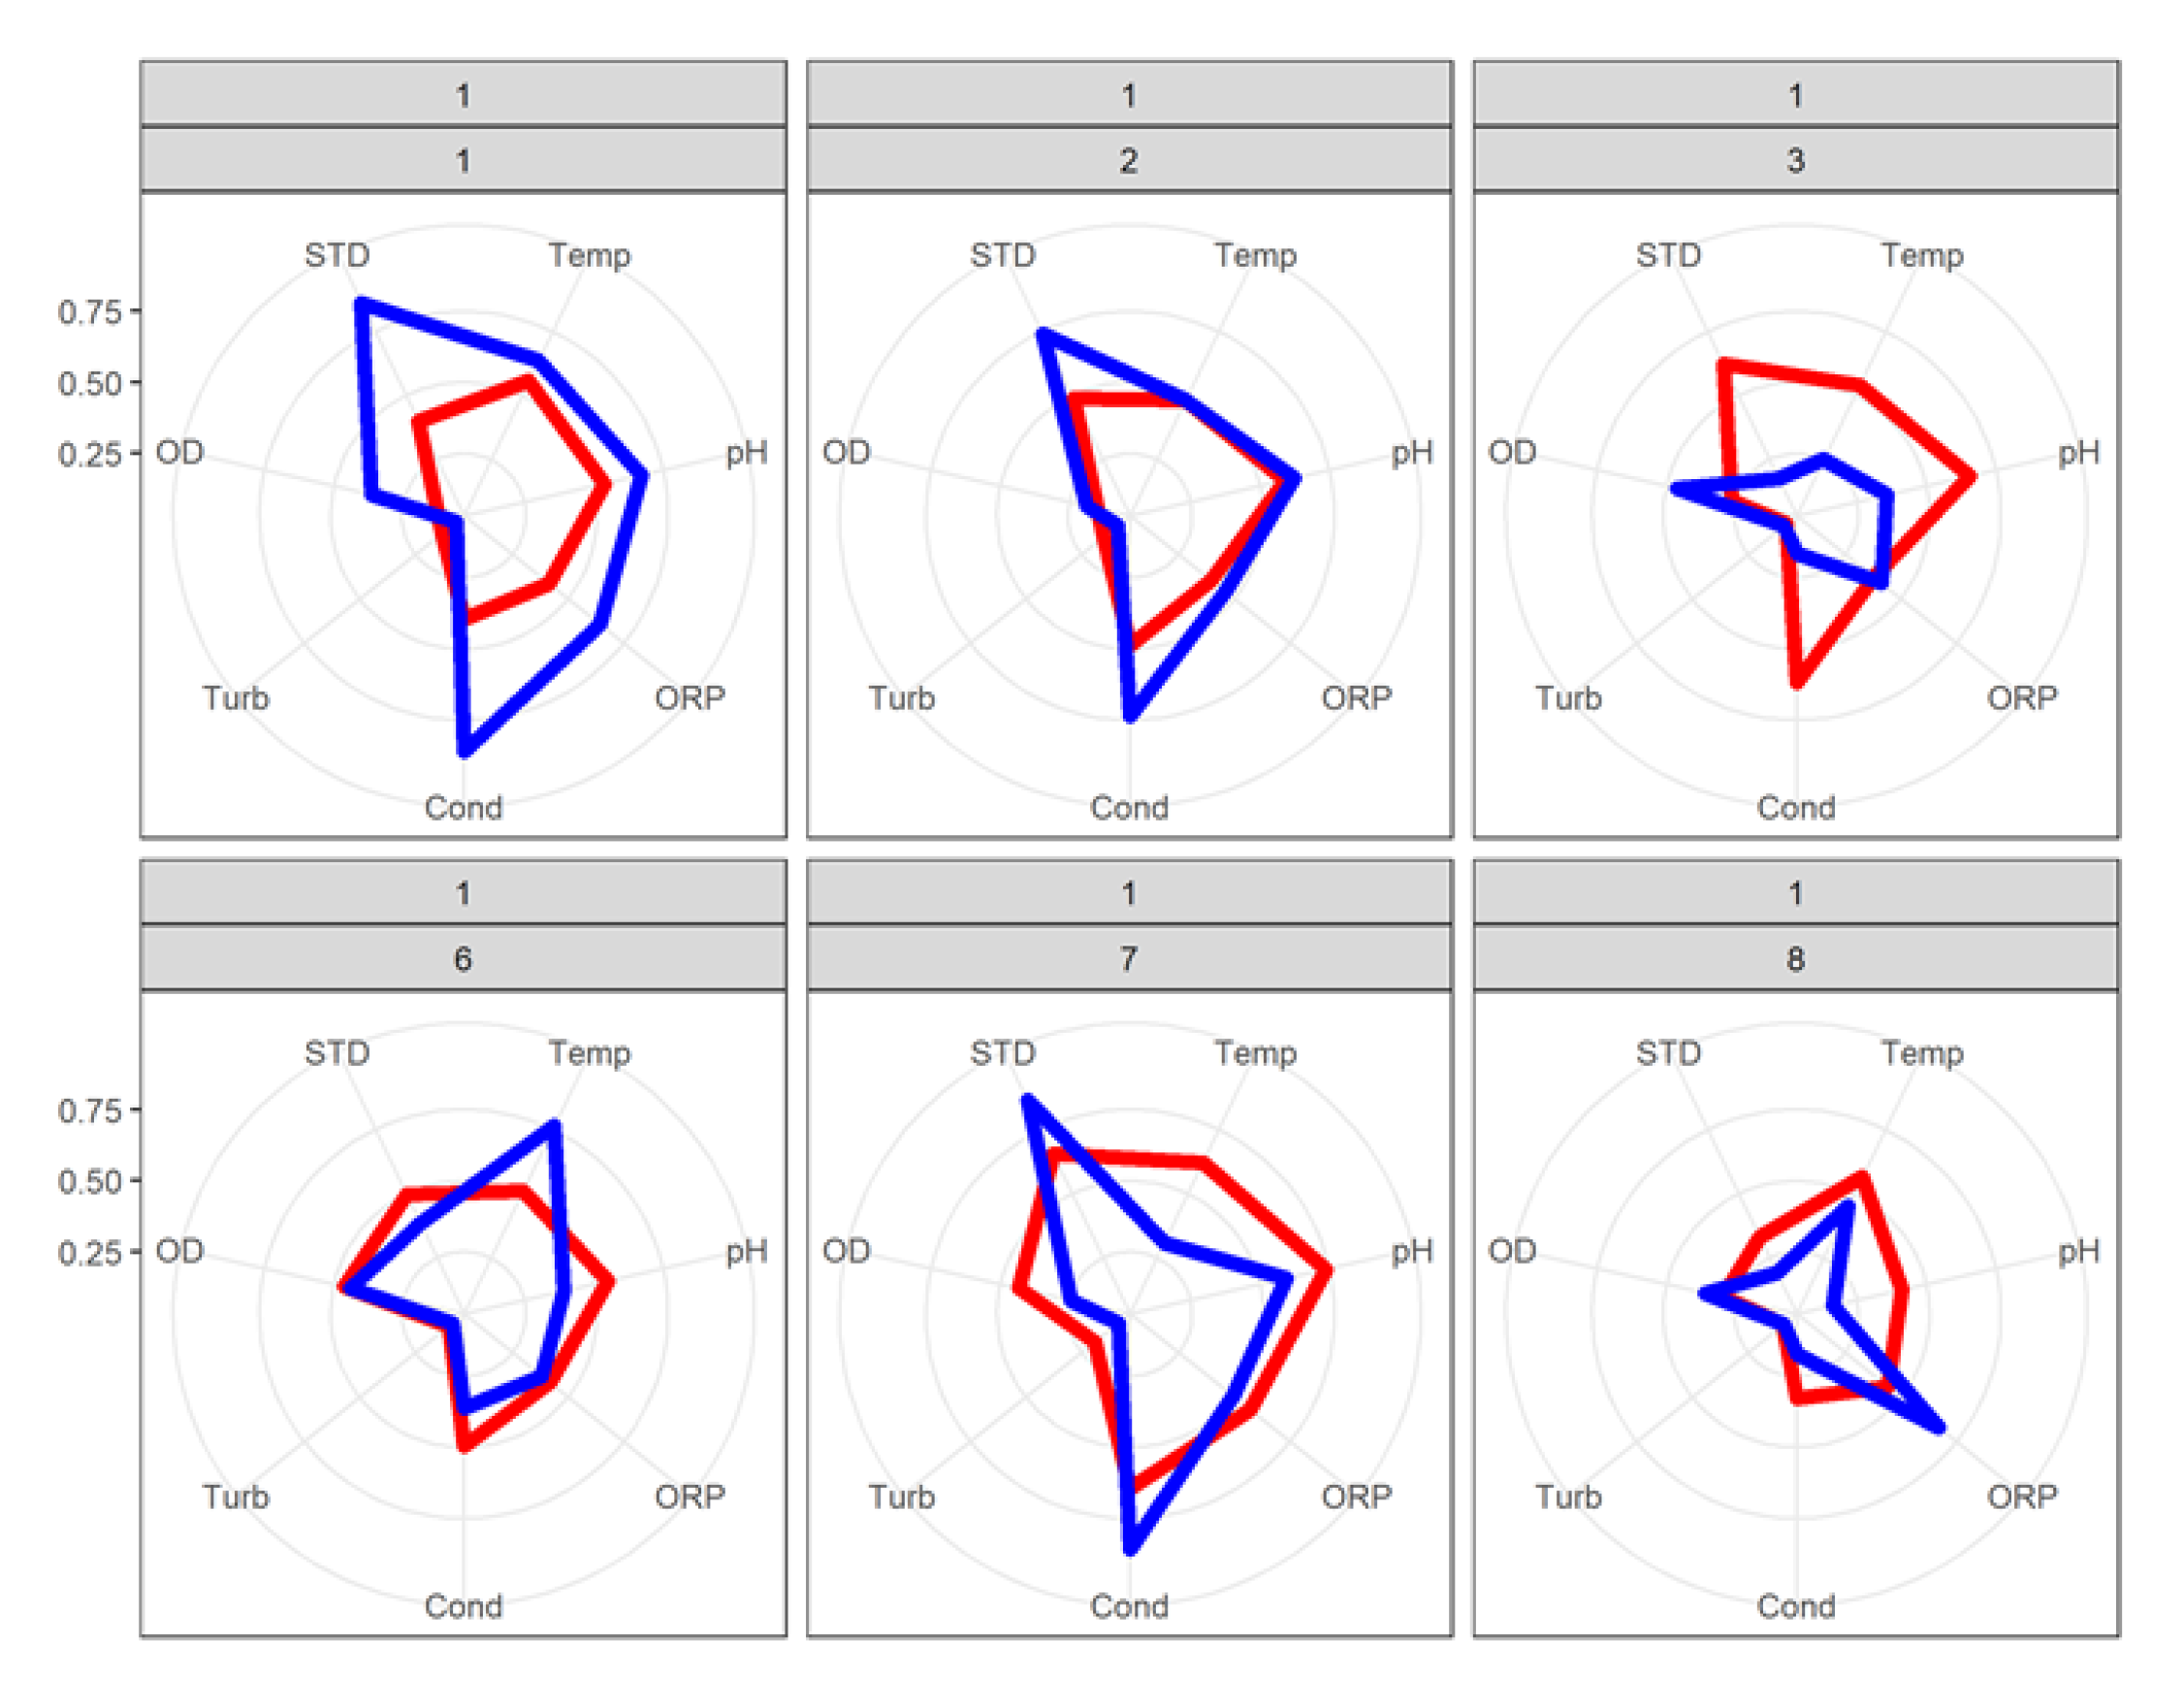
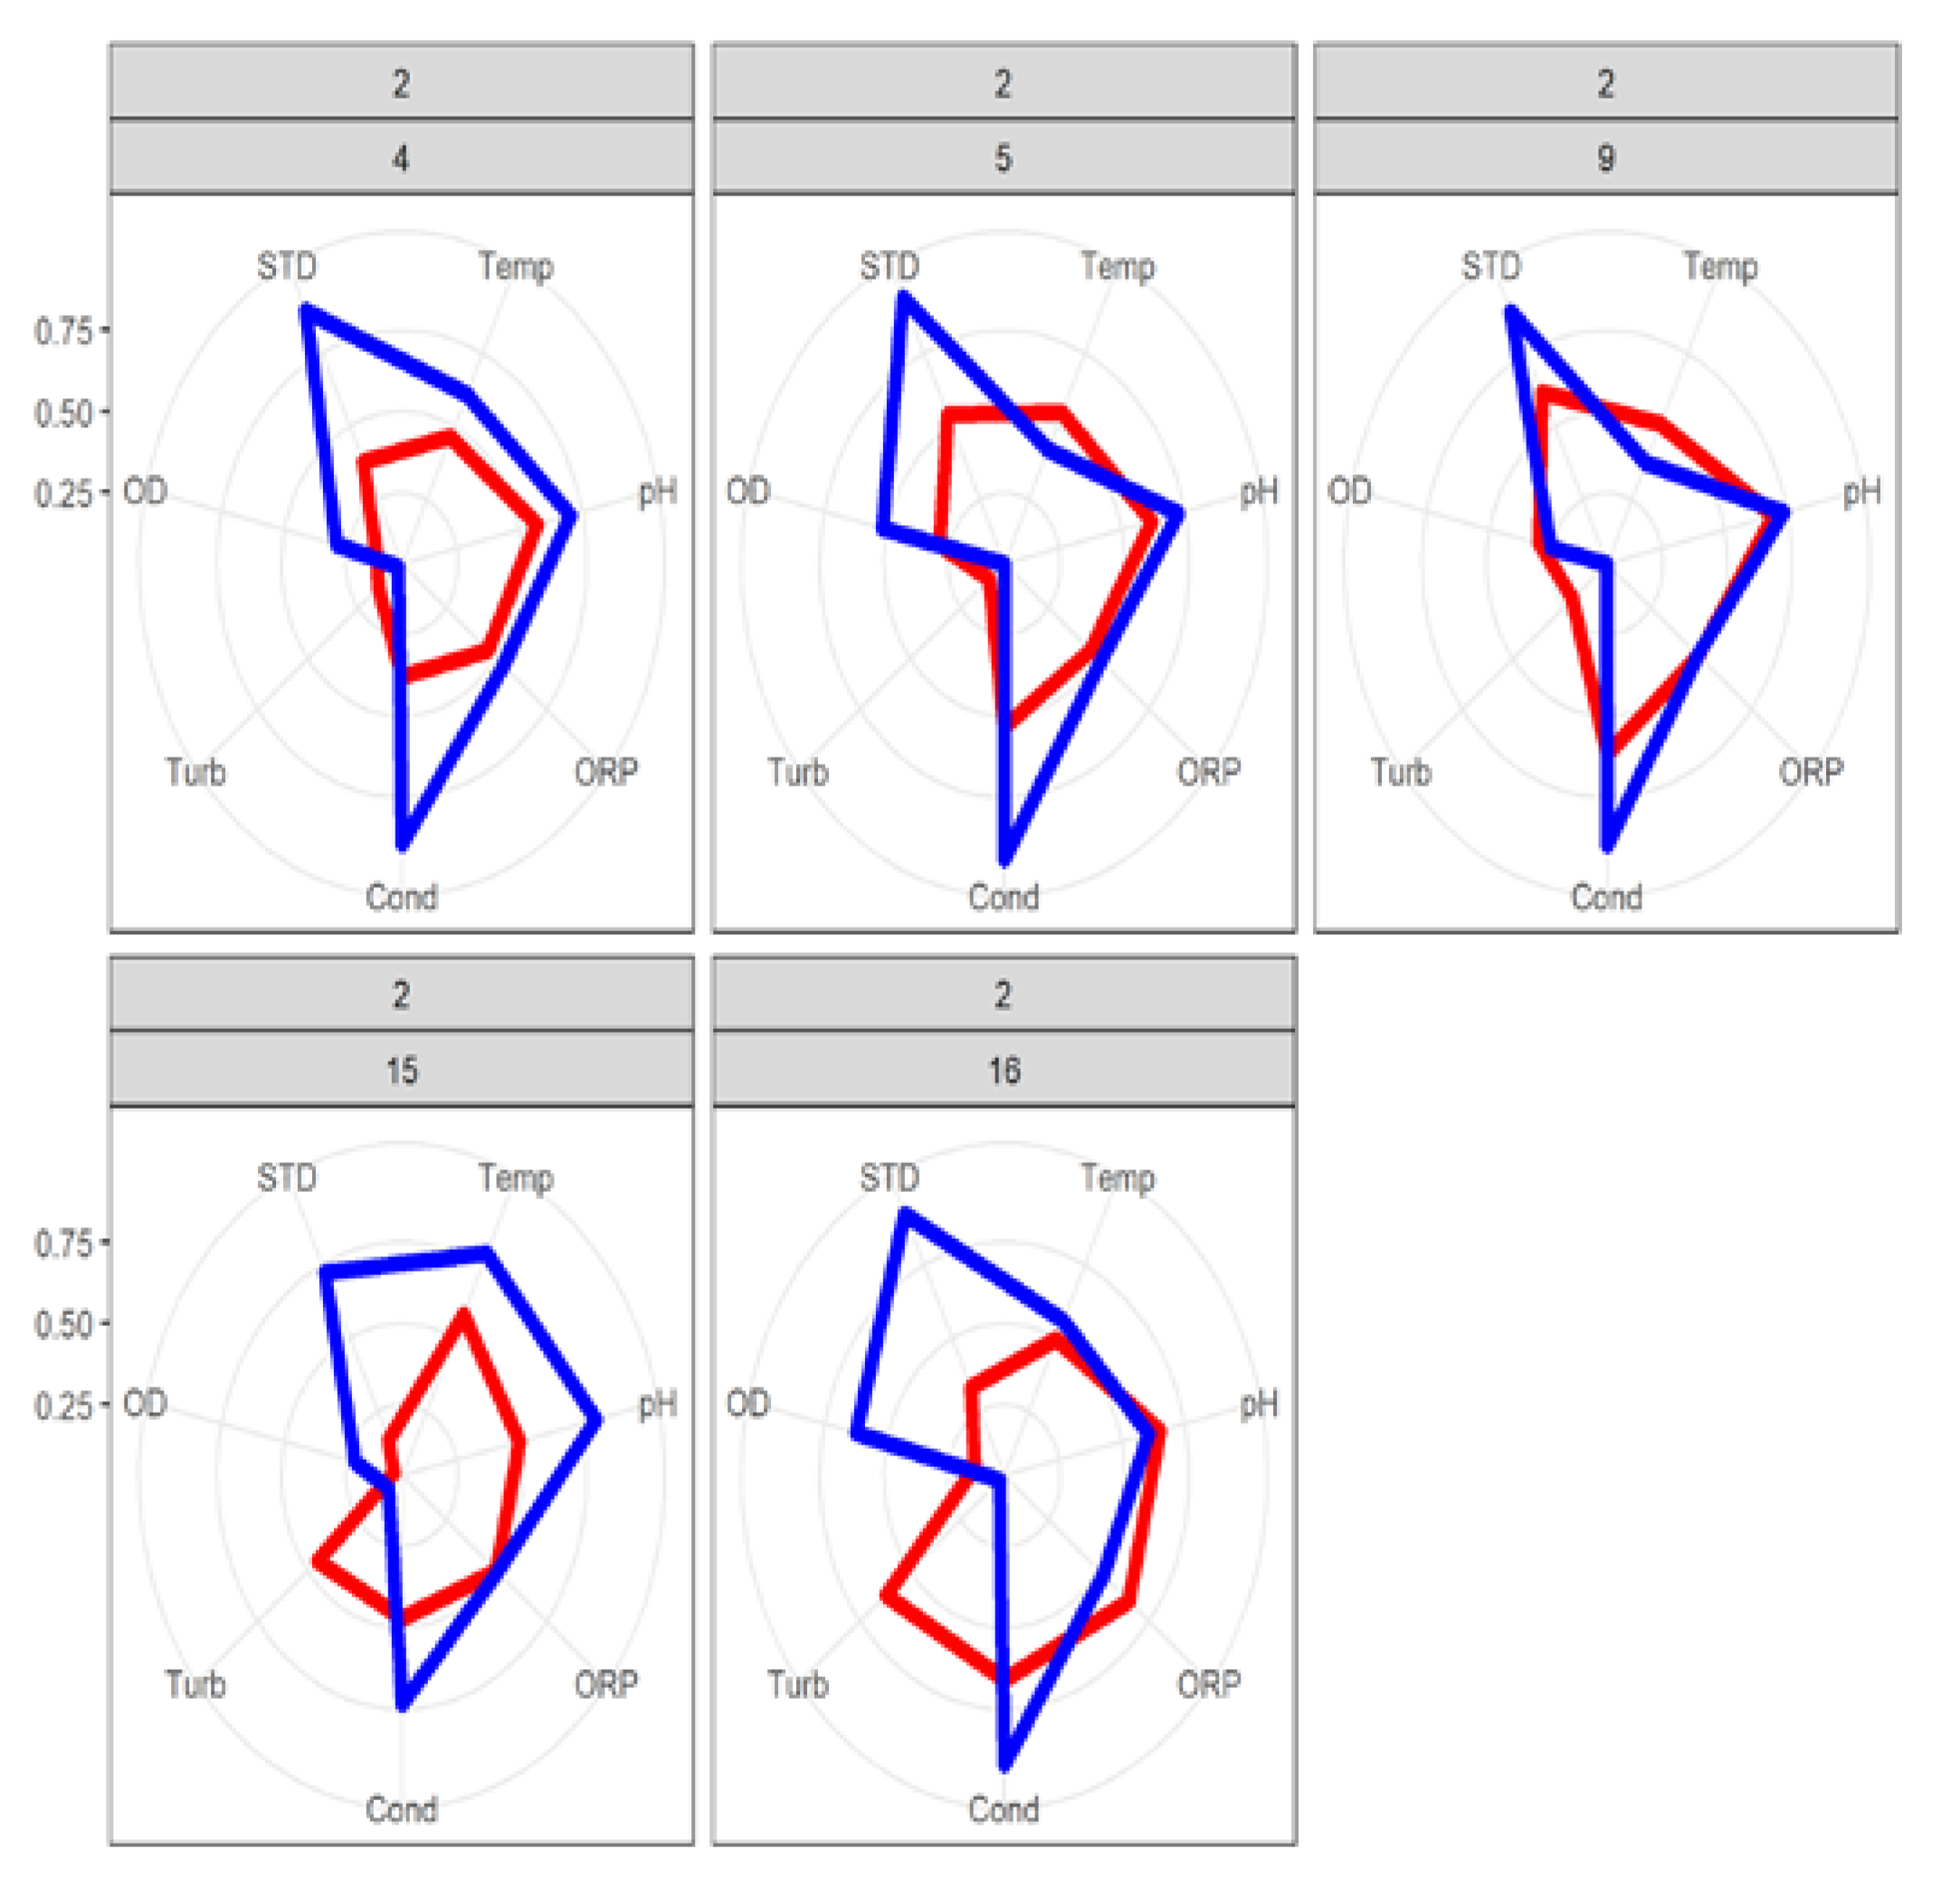
3.1. Water Parameters’ Interaction at the Sample Number and Hydrological Compartments
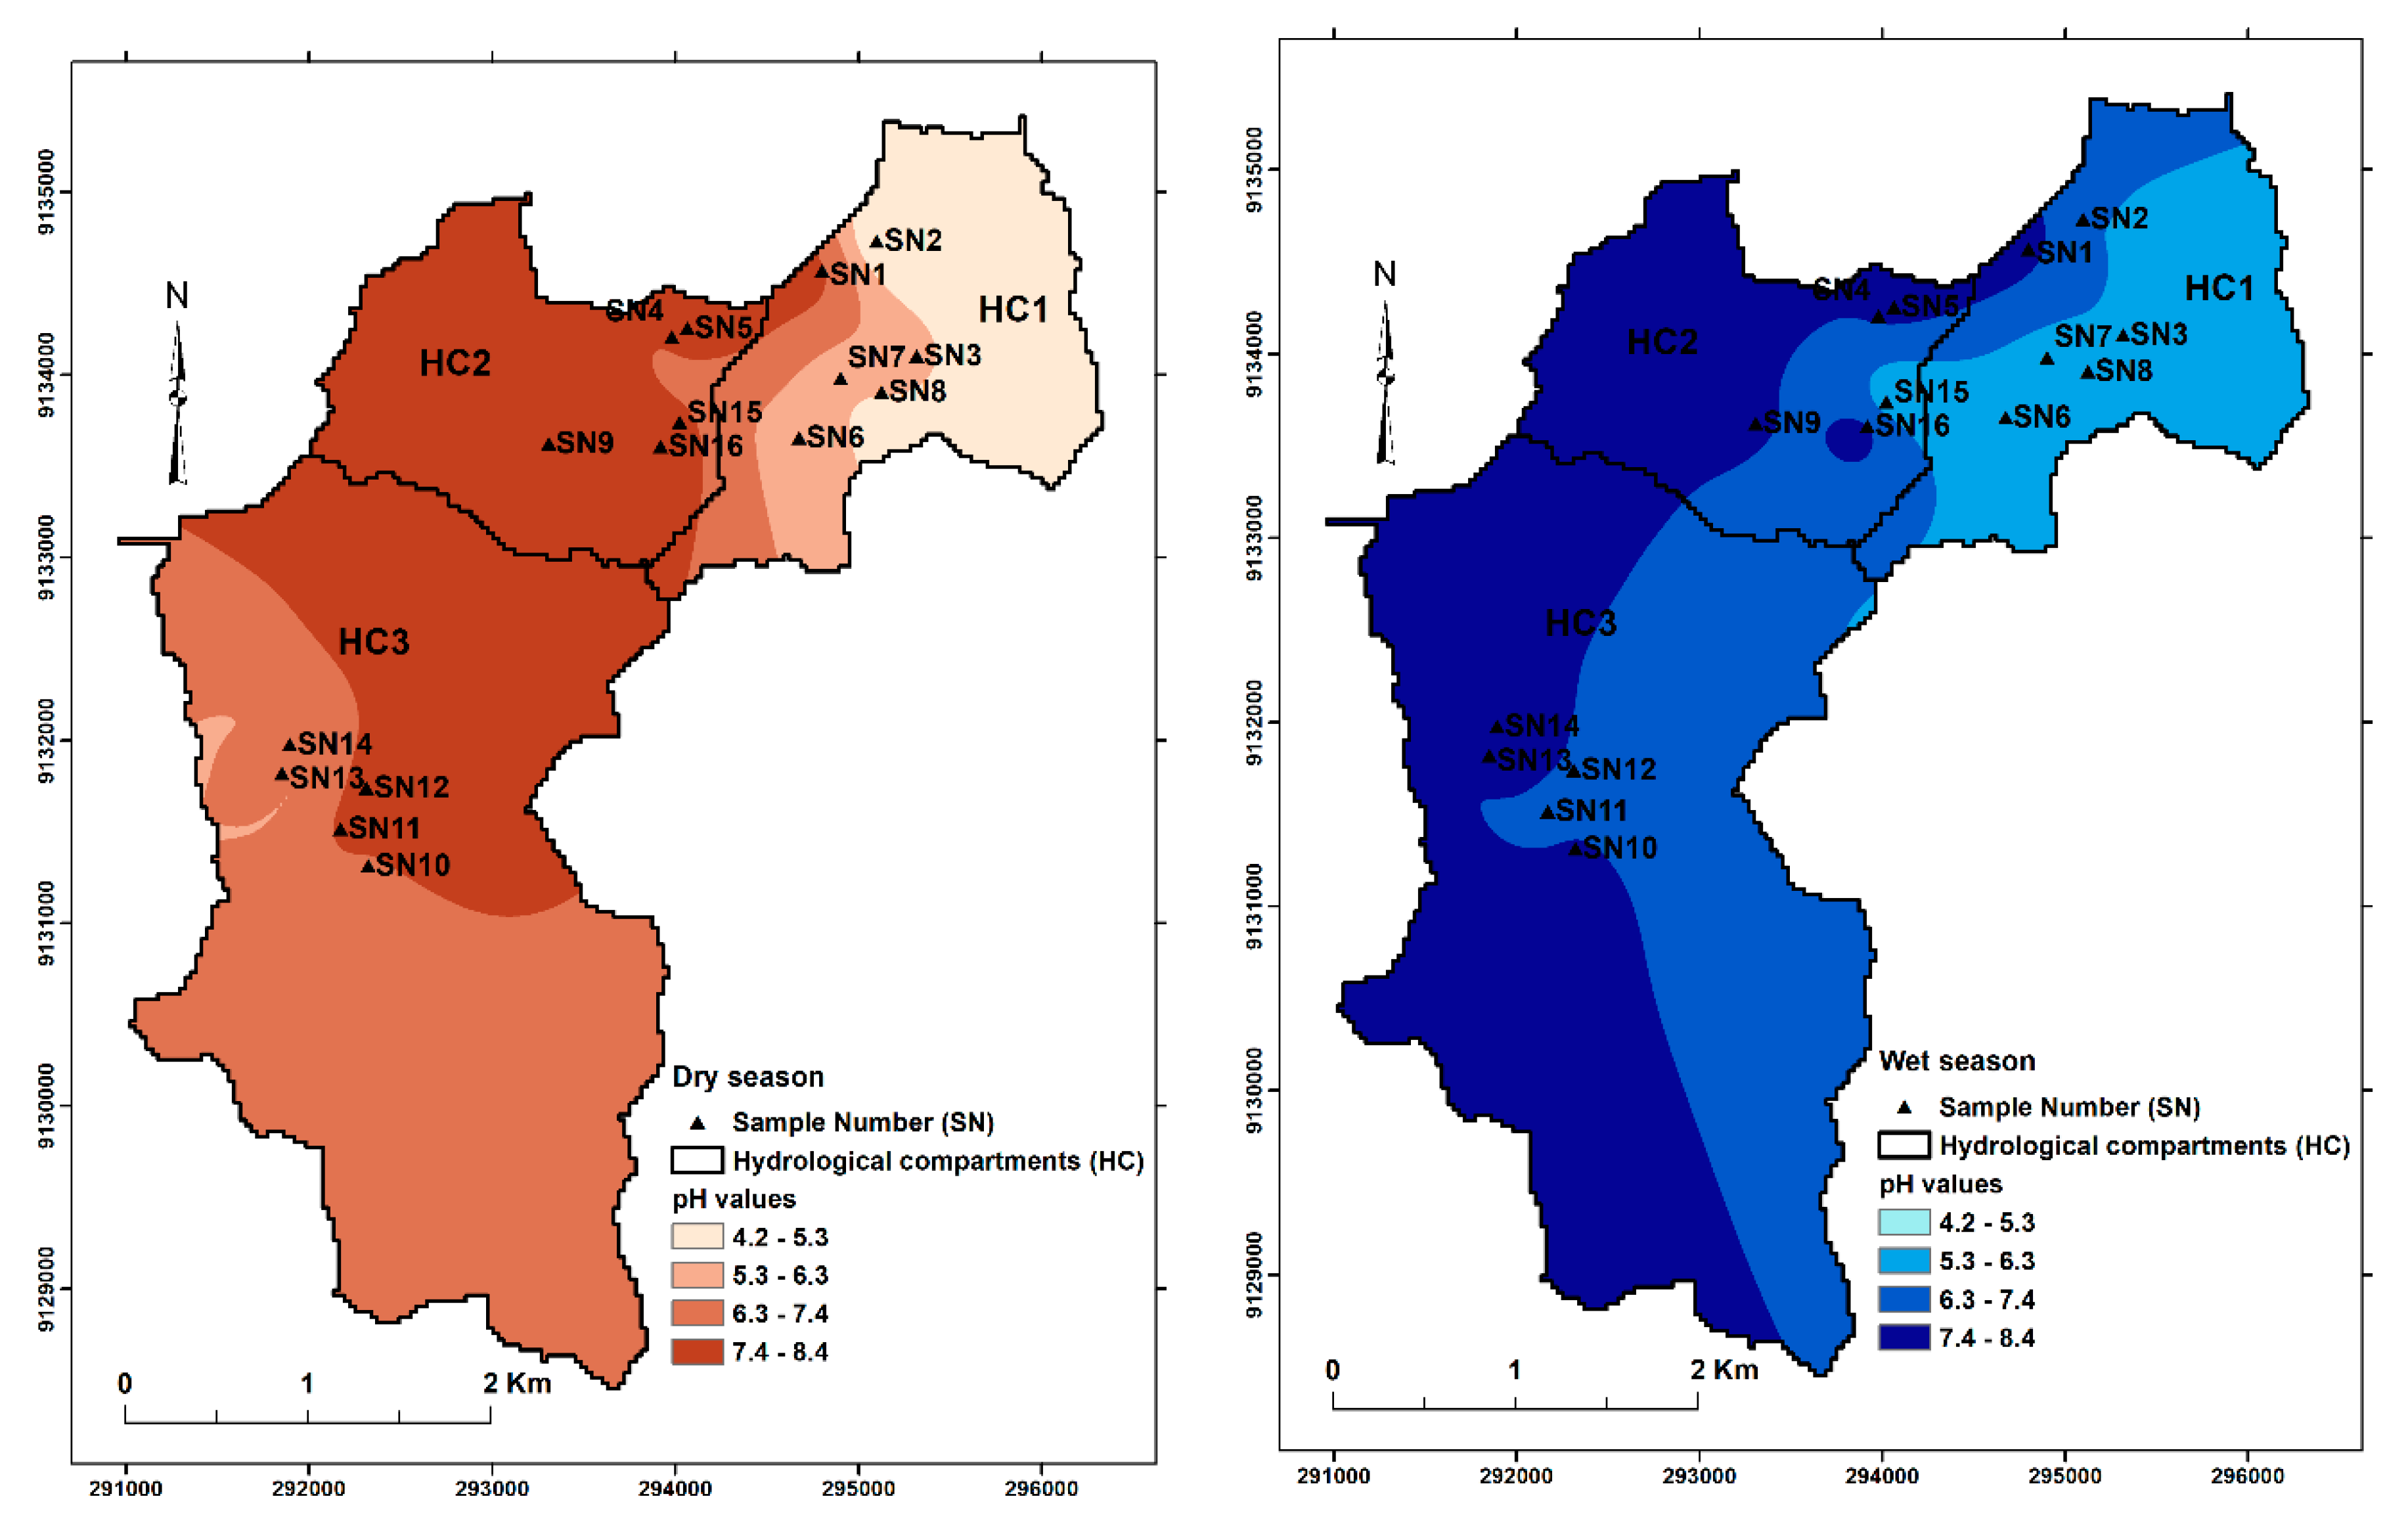
3.1.1. pH
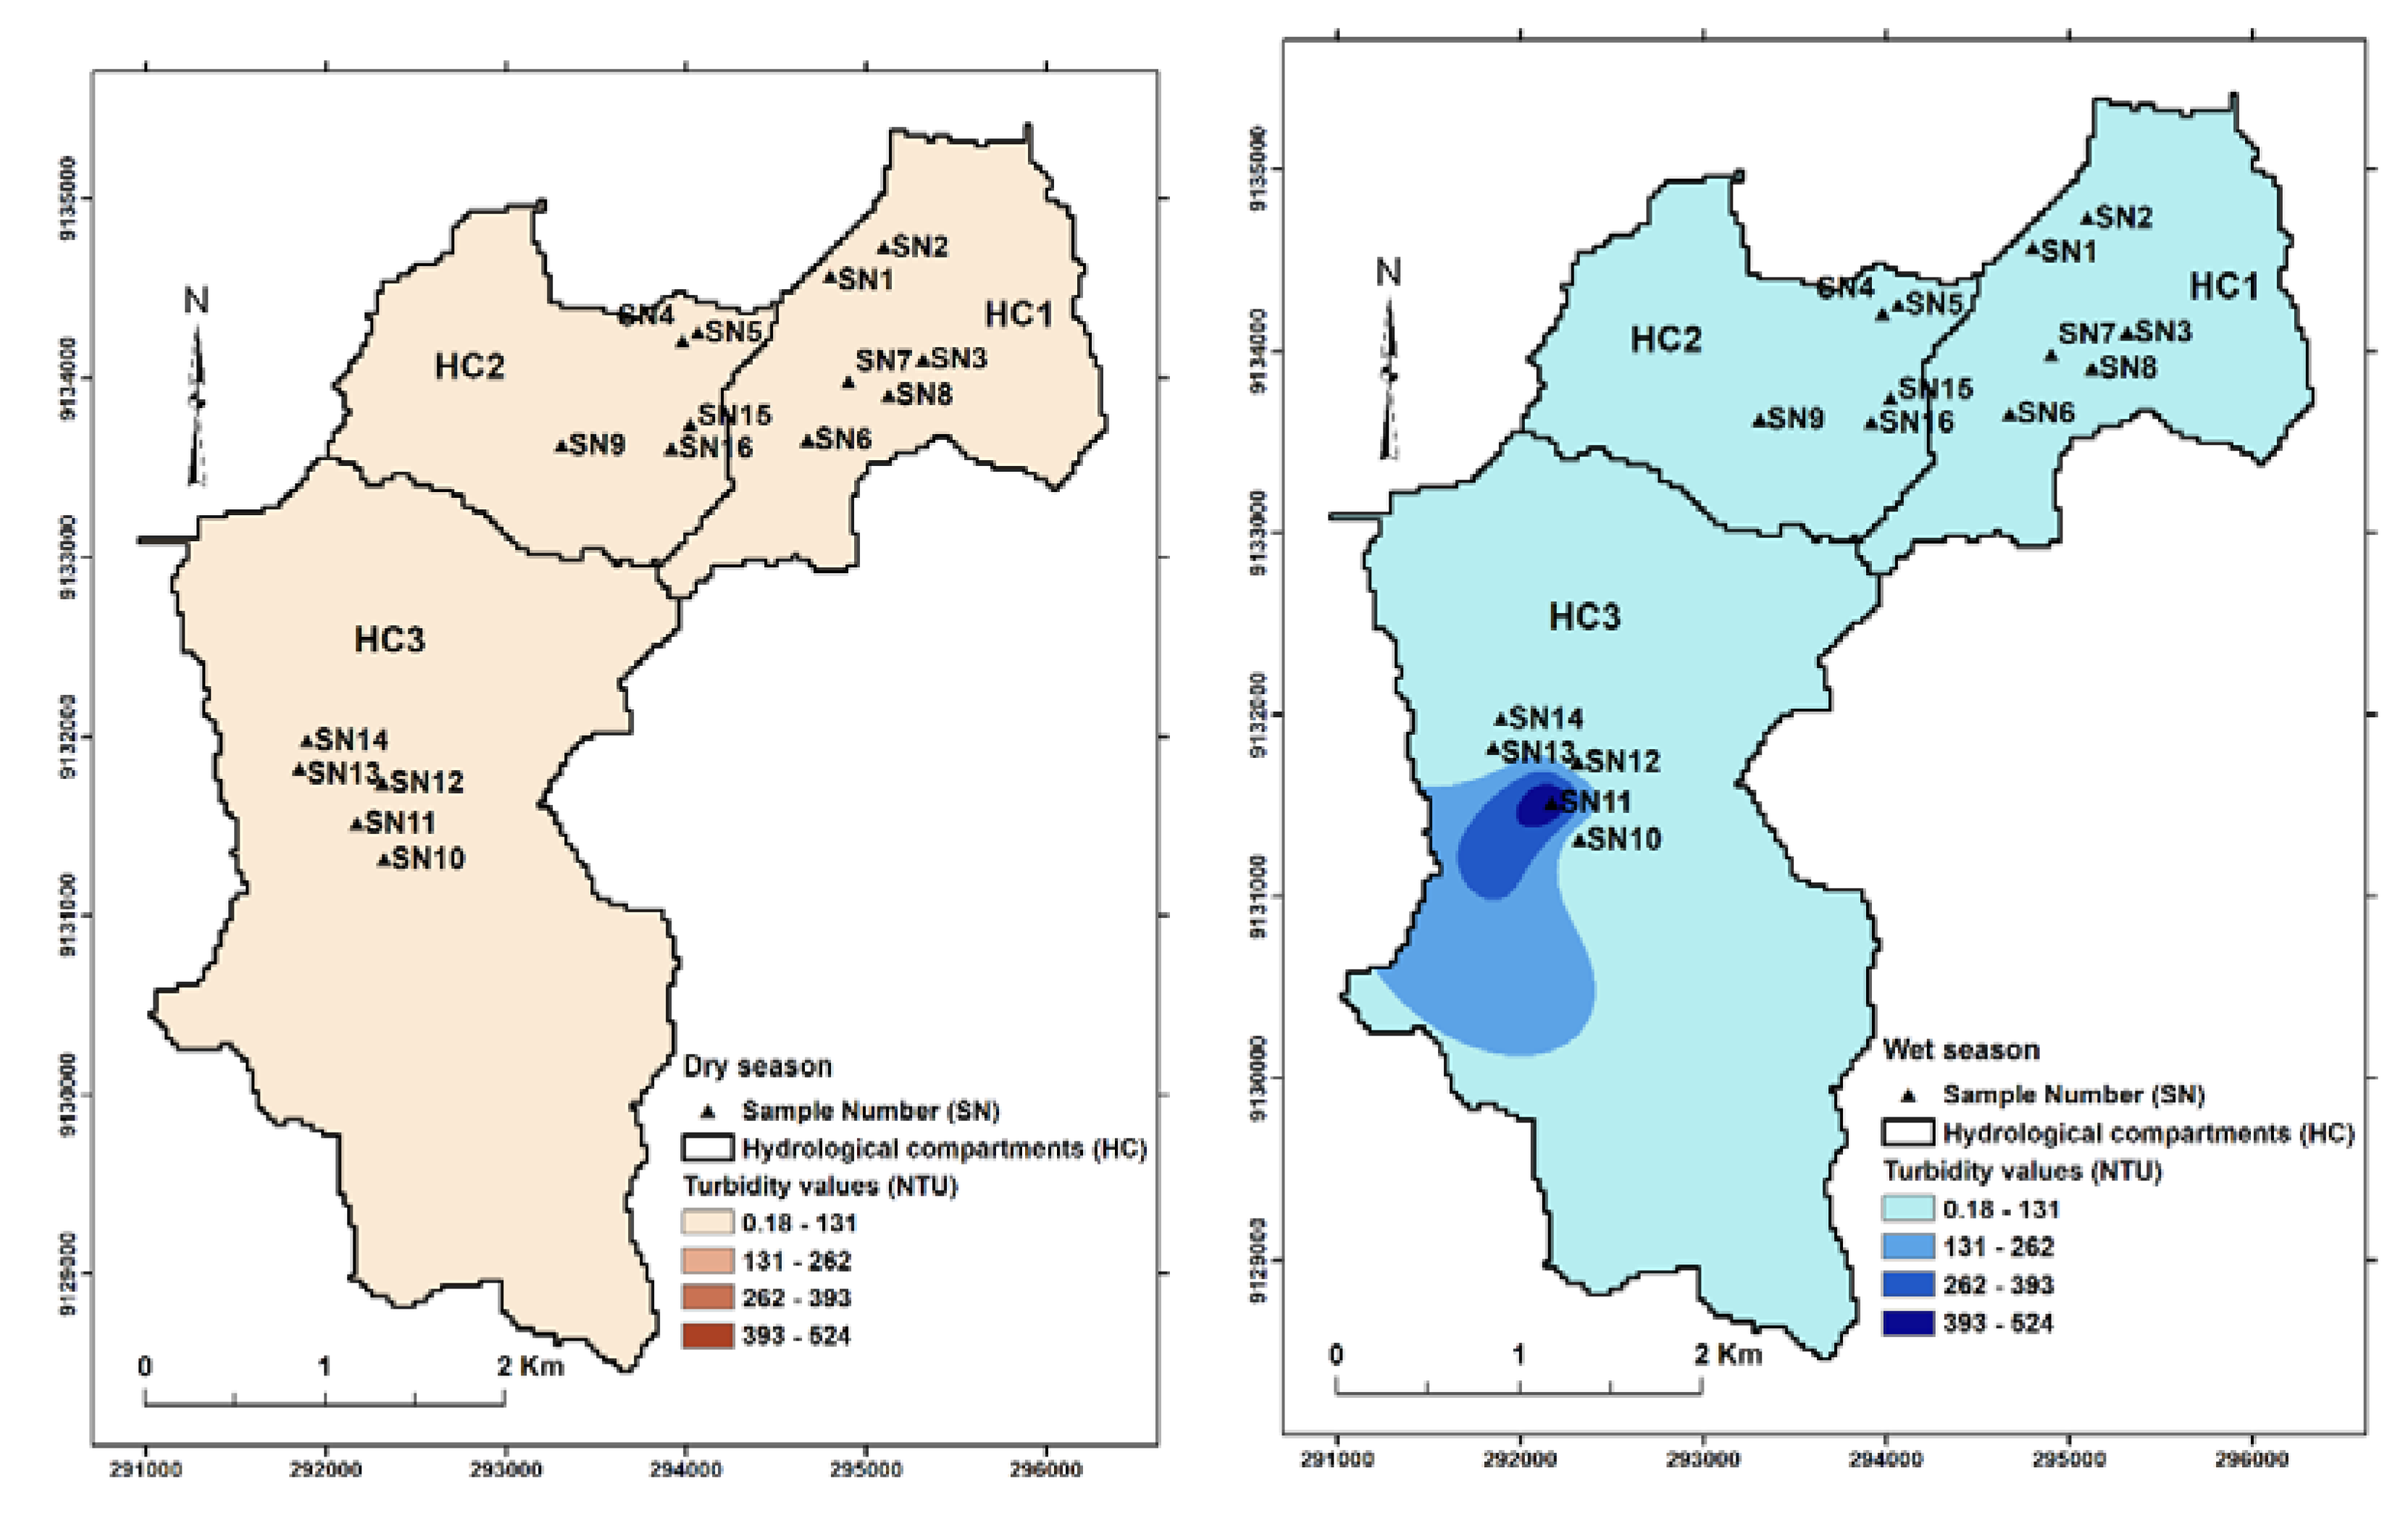
3.1.2. Turbidity
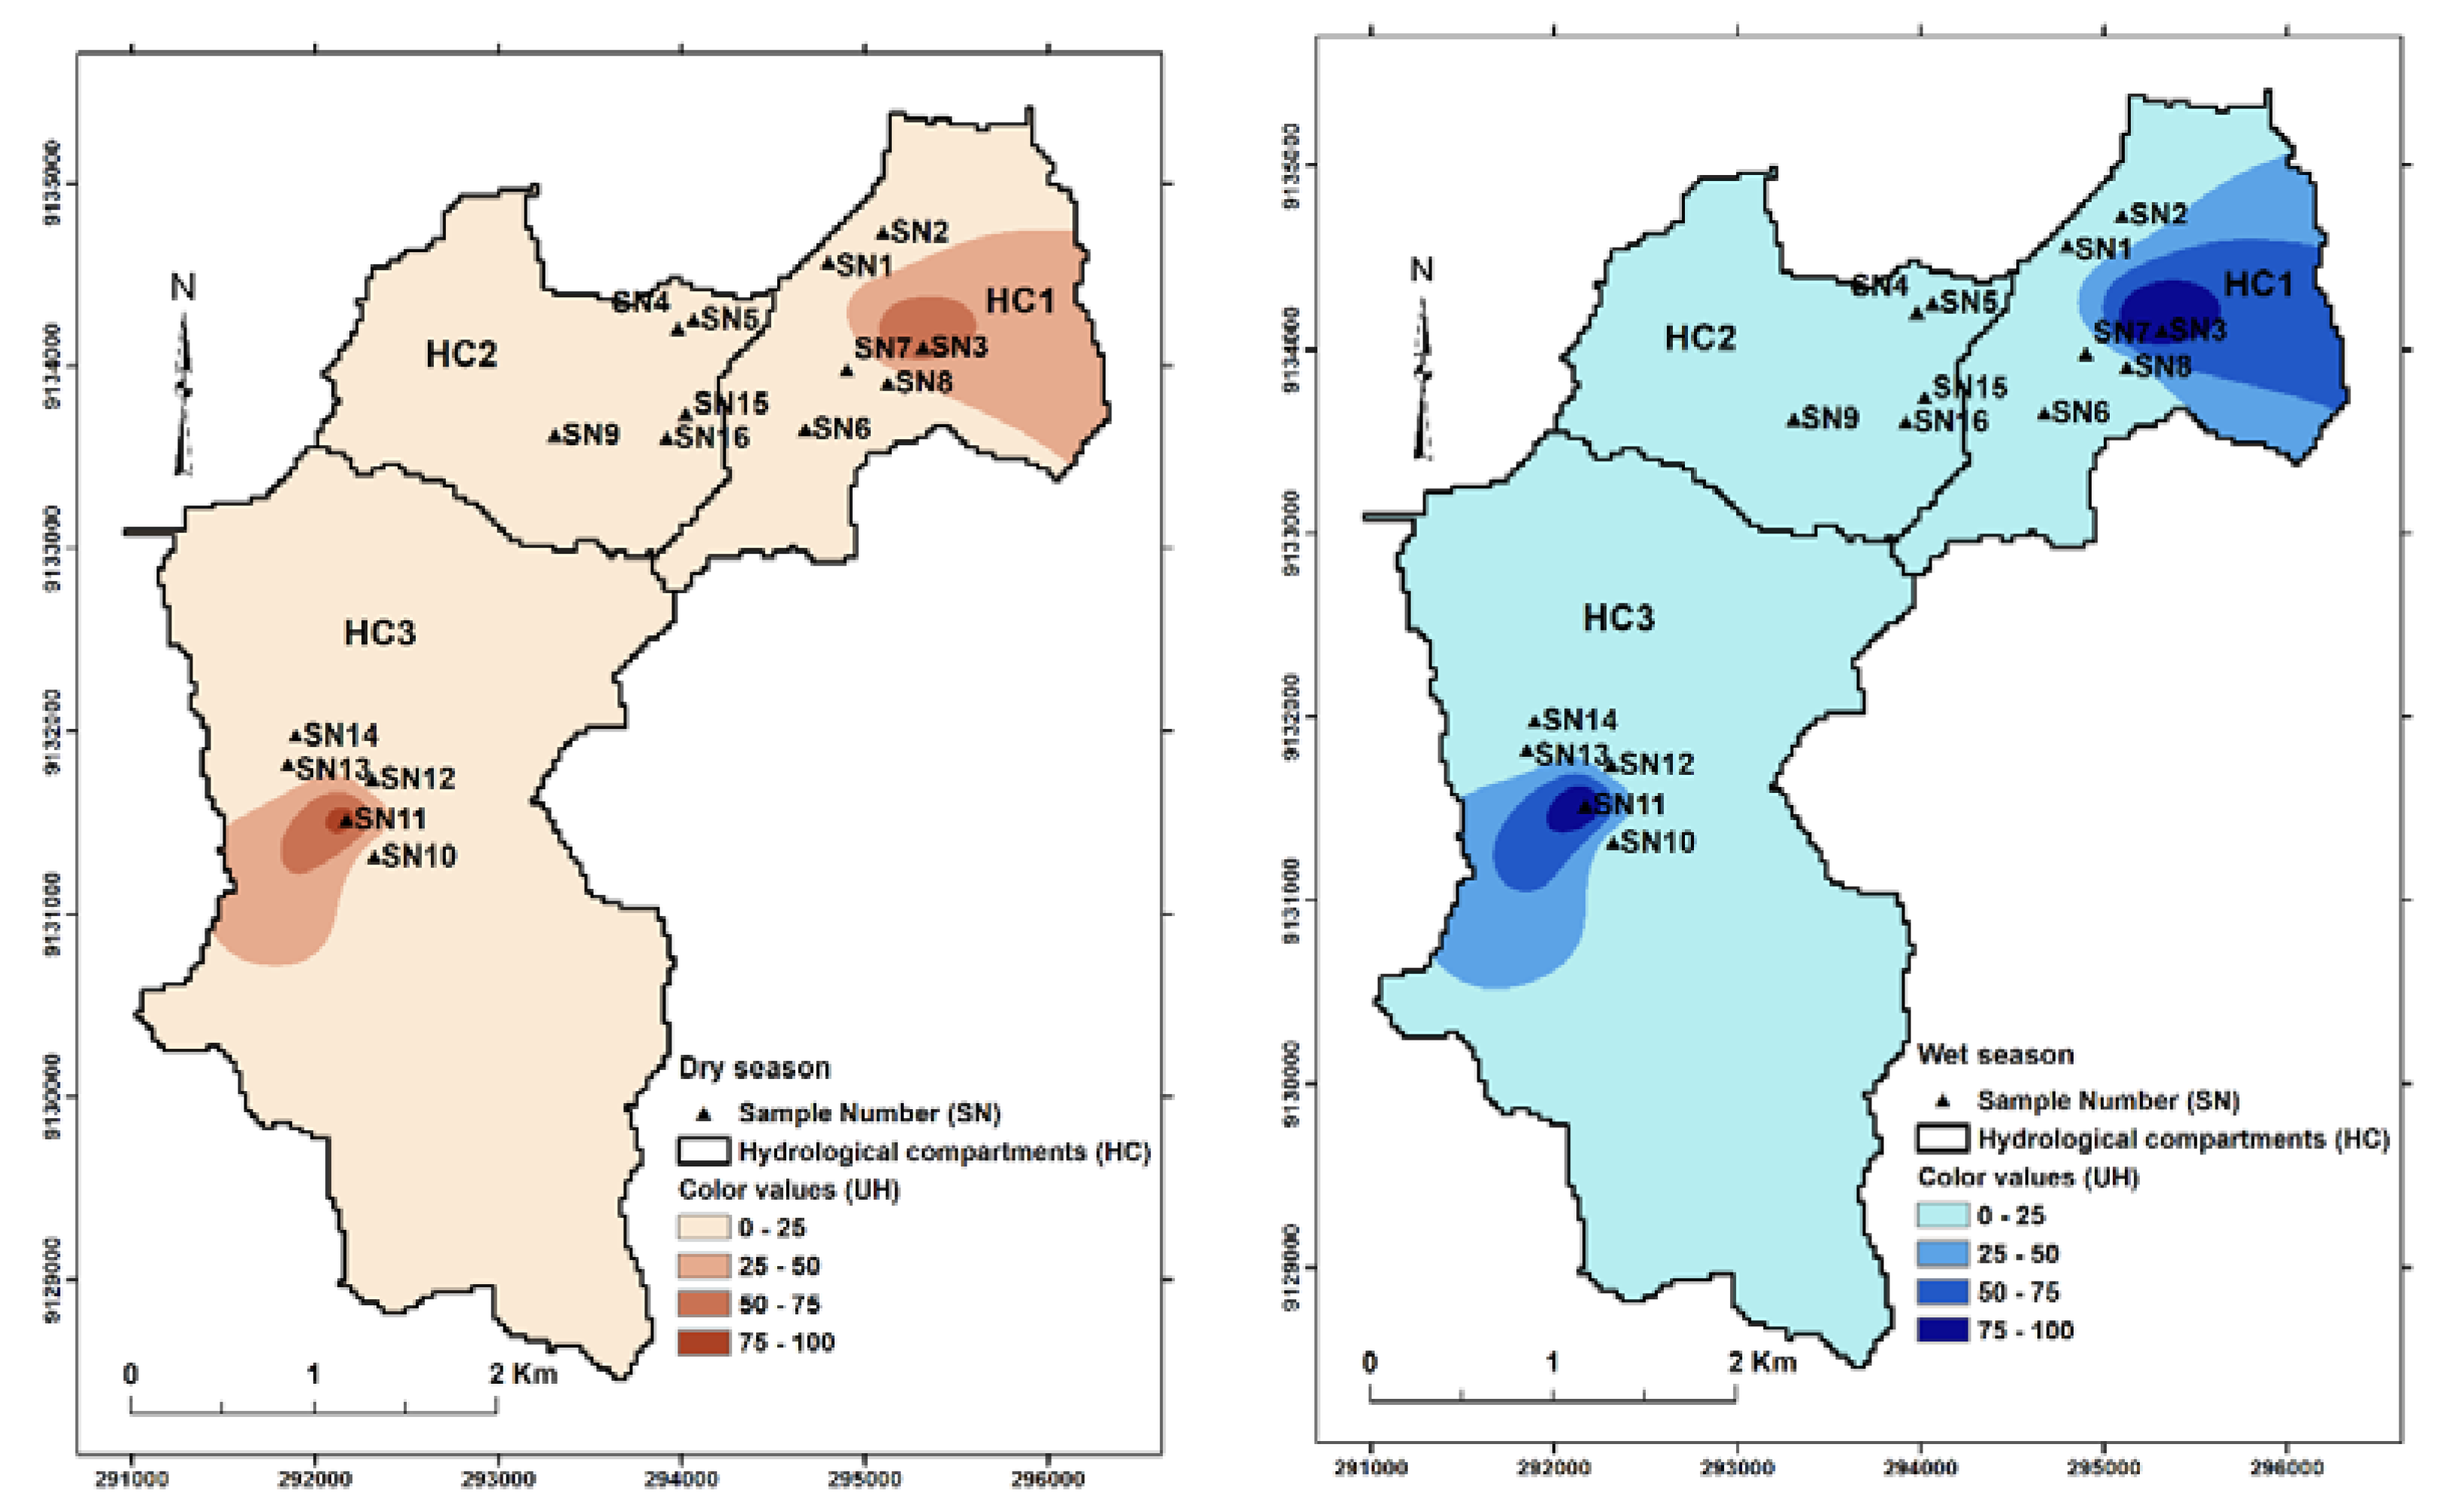
3.1.3. Color
3.1.4. Total Iron
3.1.5. Correlation Analysis
3.2. Microbiological Analyses
3.2.1. Coliforms
3.2.2. Heterotrophic Bacterial Count
3.3. Heavy Metals
4. Conclusions
Supplementary Materials
Author Contributions
Funding
Acknowledgments
Conflicts of Interest
References
- Beyene, G.; Aberra, D.; Fufa, F. Evaluation of the suitability of groundwater for drinking and irrigation purposes in Jimma Zone of Oromia, Ethiopia. Groundw. Sustain. Dev. 2019, 9, 100216. [Google Scholar] [CrossRef]
- Cao, X.; Lu, Y.; Wang, C.; Zhang, M.; Yuan, J.; Zhang, A.; Wang, Y. Hydrogeochemistry and quality of surface water and groundwater in the drinking water source area of an urbanizing region. Ecotoxicol. Environ. Saf. 2019, 186, 109628. [Google Scholar] [CrossRef] [PubMed]
- Erdogan, I.G.; Fosso-Kankeu, E.; Ntwampe, S.K.O.; Waanders, F.B.; Hoth, N.; Rand, A. Groundwater as an alternative source to irregular surface water in the O’Kiep area, Namaqualand, South Africa. Phys. Chem. Earth 2019, 114, 102801. [Google Scholar] [CrossRef]
- FAO. Water for Sustainable Food and Agriculture a Report Produced for the G20 Presidency of Germany; FAO: Rome, Italy, 2017; ISBN 978-92-5-109977-3. [Google Scholar]
- Norman, E.S.; Dunn, G.; Bakker, K.; Allen, D.M.; De Albuquerque, R.C. Water security assessment: Integrating governance and freshwater indicators. Water Resour. Manag. 2013, 27, 535–551. [Google Scholar] [CrossRef]
- Jenifer, M.A.; Jha, M.K. Comprehensive risk assessment of groundwater contamination in a weathered hard-rock aquifer system of India. J. Clean. Prod. 2018, 201, 853–868. [Google Scholar] [CrossRef]
- Clemens, M.; Khurelbaatar, G.; Merz, R.; Siebert, C.; van Afferden, M.; Rödiger, T. Groundwater protection under water scarcity; from regional risk assessment to local wastewater treatment solutions in Jordan. Sci. Total Environ. 2019, 706, 136066. [Google Scholar] [CrossRef] [PubMed]
- Li, C.; Gao, X.; Liu, Y.; Wang, Y. Impact of anthropogenic activities on the enrichment of fluoride and salinity in groundwater in the Yuncheng Basin constrained by Cl/Br ratio, δ18O, δ2H, δ13C and δ7Li isotopes. J. Hydrol. 2019, 579, 124211. [Google Scholar] [CrossRef]
- Guzman, C.D.; Tilahun, S.A.; Dagnew, D.C.; Zimale, F.A.; Zegeye, A.D.; Boll, J.; Steenhuis, T.S. Spatio-temporal patterns of groundwater depths and soil nutrients in a small watershed in the Ethiopian highlands: Topographic and land-use controls. J. Hydrol. 2017, 555, 420–434. [Google Scholar] [CrossRef]
- Han, D.; Currell, M.J.; Cao, G.; Hall, B. Alterations to groundwater recharge due to anthropogenic landscape change. J. Hydrol. 2017, 554, 545–557. [Google Scholar] [CrossRef]
- Pissarra, T.C.T.; Valera, C.A.; Costa, R.C.A.; Siqueira, H.E.; Martins Filho, M.V.; Valle Júnior, R.F.D.; Fernandes, L.F.S.; Pacheco, F.A.L. A Regression Model of Stream Water Quality Based on Interactions between Landscape Composition and Riparian Buffer Width in Small Catchments. Water 2019, 11, 1757. [Google Scholar] [CrossRef] [Green Version]
- Valera, C.A.; Pissarra, T.C.T.; Valle Júnior, R.F.D.; Oliveira, C.F.; Moura, J.P.; Fernandes, L.F.S.; Pacheco, F.A.L. The buffer capacity of riparian vegetation to control water quality in anthropogenic catchments from a legally protected area: A critical view over the Brazilian new forest code. Water 2019, 11, 549. [Google Scholar] [CrossRef] [Green Version]
- Nath, B.K.; Chaliha, C.; Bhuyan, B.; Kalita, E.; Baruah, D.C.; Bhagabati, A.K. GIS mapping-based impact assessment of groundwater contamination by arsenic and other heavy metal contaminants in the Brahmaputra River valley: A water quality assessment study. J. Clean. Prod. 2018, 201, 1001–1011. [Google Scholar] [CrossRef]
- Machiwal, D.; Jha, M.K.; Singh, V.P.; Mohan, C. Assessment and mapping of groundwater vulnerability to pollution: Current status and challenges. Earth Sci. Rev. 2018, 185, 901–927. [Google Scholar] [CrossRef]
- Moreno, L.J.A.; Lemus, D.D.S.Z.; Rosero, J.L.; Morales, D.M.A.; Castaño, L.M.S.; Cuervo, D.P. Evaluation of aquifer contamination risk in urban expansion areas as a tool for the integrated management of groundwater resources. Case: Coffee Growing Region, Colombia. Groundw. Sustain. Dev. 2020, 10, 100298. [Google Scholar] [CrossRef]
- Owamah, H.I. A comprehensive assessment of groundwater quality for drinking purpose in a Nigerian rural Niger delta community. Groundw. Sustain. Dev. 2020, 10, 100286. [Google Scholar] [CrossRef]
- Oliveira Júnior, A.D.; Magalhães, T.D.B.; Mata, R.N.D.; Santos, F.S.G.D.; Oliveira, D.C.D.; Carvalho, J.L.B.D.; Araújo, W.N.D. Drinking Water Quality Surveillance Information System (SISAGUA): Characteristics, evolution and applicability. Epidemiol. Serv. Saude 2019, 28, e2018117. [Google Scholar] [CrossRef] [Green Version]
- Agência Nacional de Águas (ANA). Conjuntura dos Recursos Hídricos: Informe 2016; ANA: Brasília, Brazil, 2016. Available online: http://www3.snirh.gov.br/portal/snirh/centrais-deconteudos/conjuntura-dos-recursos-hidricos/informe-conjuntura-2016.pdf (accessed on 21 November 2019).
- Pacheco, F.A.L.; Fernandes, L.F.S.; Valle Junior, R.F.V.; Valera, C.A.; Pissarra, T.C.T. Land degradation: Multiple environmental consequences and routes to neutrality. Curr. Opin. Environ. Sci. Health 2018, 5, 79–86. [Google Scholar] [CrossRef]
- Qiao, J.; Zhu, Y.; Jia, X.; Niu, X.; Liu, J. Distributions of arsenic and other heavy metals, and health risk assessments for groundwater in the Guanzhong Plain region of China. Environ. Res. 2019, 108957. [Google Scholar] [CrossRef]
- Saran, L.M.; Pissarra, T.C.T.; Silveira, G.A.; Constancio, M.T.L.; de Melo, W.J.; Alves, L.M.C. Land use impact on potentially toxic metals concentration on surface water and resistant microorganisms in watersheds. Ecotoxicol. Environ. Saf. 2018, 166, 366–374. [Google Scholar] [CrossRef]
- Álvarez, X.; Valero, E.; Santos, R.M.B.; Varandas, S.G.P.; Sanches Fernandes, L.F.; Pacheco, F.A.L. Anthropogenic nutrients and eutrophication in multiple land use watersheds: Best management practices and policies for the protection of water resources. Land Use Policy 2017, 69, 1–11. [Google Scholar] [CrossRef]
- Rakib, M.A.; Sasaki, J.; Matsuda, H.; Quraishi, S.B.; Mahmud, M.J.; Bodrud-Doza, M.; Bhuiyan, M.A. Groundwater salinization and associated co-contamination risk increase severe drinking water vulnerabilities in the southwestern coast of Bangladesh. Chemosphere 2019, 125646. [Google Scholar] [CrossRef] [PubMed]
- Dev, R.; Bali, M. Evaluation of groundwater quality and its suitability for drinking and agricultural use in district Kangra of Himachal Pradesh, India. J. Saud. Soc. Agric. Sci. 2019, 18, 462–468. [Google Scholar] [CrossRef]
- Torres, A.; Brandt, J.; Lear, K.; Liu, J. A looming tragedy of the sand commons: Increasing sand extraction, trade, and consumption pose global sustainability challenges. Science 2017, 357, 970–971. Available online: http://science.sciencemag.org/content/357/6355/970 (accessed on 21 November 2019). [CrossRef] [PubMed]
- Aleixo, B.; Rezende, S.; Pena, J.L.; Zapata, G.; Heller, L. Human Right in Perspective: Inequalities in Access to Water in a Rural Community of the Brazilian Northeast. Ambient. Soc. 2016, 19, 63–84. [Google Scholar] [CrossRef] [Green Version]
- Pernambuco. Secretaria de Recursos Hídricos; Plano Estratégico de Recursos Hídricos e Saneamento: Recife, Brazil, 2008; p. 112. [Google Scholar]
- Vijay, R.; Khobragade, P.; Mohapatra, P.K. Assessment of groundwater quality in Puri City, India: An impact of anthropogenic activities. Environ. Monit. Assess. 2011, 177, 409–418. [Google Scholar] [CrossRef] [PubMed]
- CPRM—Serviço Geológico do Brasil Projeto Cadastro de Fontes de Abastecimento por água Subterrânea. Diagnóstico do Município de Igarassu, Estado de Pernambuco/Organizado [por] João de Castro Mascarenhas, Breno Augusto Beltrão, Luiz Carlos de Souza Junior, Manoel Julio da Trindade G. Galvão, Simeones Neri Pereira, Jorge Luiz Fortunato de Miranda; CPRM/PRODEEM: Recife, Brazil, 2005. [Google Scholar]
- Sharma, B.M.; Bečanová, J.; Scheringer, M.; Sharma, A.; Bharat, G.K.; Whitehead, P.G.; Nizzetto, L. Health and ecological risk assessment of emerging contaminants (pharmaceuticals, personal care products, and artificial sweeteners) in surface and groundwater (drinking water) in the Ganges River Basin, India. Sci. Total Environ. 2019, 646, 1459–1467. [Google Scholar] [CrossRef] [PubMed]
- Ruiz-Pico, Á.; Cuenca, Á.P.; Serrano-Agila, R.; Criollo, D.M.; Leiva-Piedra, J.; Salazar-Campos, J. Hydrochemical characterization of groundwater in the Loja Basin (Ecuador). J. Appl. Geochem. 2019, 104, 1–9. [Google Scholar] [CrossRef]
- American Public Health Association (APHA). Standard Methods for Examination of Water and Wastewater, 22nd ed.; APHA: Washington, DC, USA, 2012; 1496p. [Google Scholar]
- BRASIL. Ministério da Saúde. Portaria de Consolidação N°5. Dispõe Sobre os Procedimentos de Controle e de Vigilância da Qualidade da Água Para Consumo Humano e seu Padrão de Potabilidade. 28 de Setembro de 2017. Available online: http://bvsms.saude.gov.br/bvs/saudelegis/gm/2011/prt2914_12_12_2011.html (accessed on 10 November 2018).
- Hutchinson, M.F. A new procedure for gridding elevation and stream line data with automatic removal of spurious pits. J. Hydrol. 1989, 106, 211–232. [Google Scholar] [CrossRef]
- Hutchinson, M.F. Locally adaptive gridding of noisy high resolution topographic data. In XVIII Congresso Mundial IMACS e MODSIM09; Congresso Internacional Sobre Modelagem e Simulação: Cairns, Australia, 2009. [Google Scholar]
- Nogueira, J.D.L.; AMARAL, R.F. Comparação entre os métodos de interpolação (krigagem e Topo to Raster) na elaboração da batimetria na área da folha Touros-RN. In XIV Simpósio Brasileiro de Sensoriamento Remoto; INPE: São José dos Campos, Brazil, 2009. [Google Scholar]
- Gomes, M.C.R.; CAVALCANTE, I.N.; SILVA, M.P. Análise Qualitativa das Águas Subterrâneas de Fortaleza, Ceará. Estudos Geológicos 2016, 26, 62–76. [Google Scholar] [CrossRef]
- Libânio, M. Fundamento de Qualidade e Tratamento de Água, 2nd ed.; Átomo, SP: Campinas, Brazil, 2008. [Google Scholar]
- CPRH—Companhia Pernambucana do Meio Ambiente. Diagnóstico Socioambiental do Litoral Norte de Pernambuco; CPRH: Recife, Brazil, 2003; 214p.
- Figur, C.; Reis, J.T. A influência do uso e cobertura da terra nos parâmetros da qualidade da água na bacia hidrográfica do rio Abaúna, em Getúlio Vargas, RS. Ciênc. Nat. 2017, 39, 352–365. [Google Scholar] [CrossRef] [Green Version]
- Asabonga, M.; Cecilia, B.; Mpundu, M.C.; Vincent, N.M.D. The physical and environmental impacts of sand mining. Trans. R. Soc. S. Afr. 2016, 72, 1–5. [Google Scholar] [CrossRef]
- Tanno, L.C.; Sintoni, A. Recursos Minerais: Conceitos e Panorama de Produção e Consumo. In Mineração e Município: Bases Para Planejamento e Gestão dos Recursos Minerais; Tanno, L.C., Sintoni, A., Eds.; Instituto de Pesquisas Tecnológicas: São Paulo, Brazil, 2003; pp. 9–14, (Publicações IPT, 2850). [Google Scholar]
- Oda, G.H.; Iritanl, M.A.; Silva, C.V.; Ezaki, S.; Stradioto, M.R.; Ferroni, F.R. Caracterização da Qualidade das Águas Subterrâneas da Região Entre Indaiatuba e Capivari (SP), Porção Sul da UGRHI 5—Resultados Preliminares. In Congresso Brasileiro de Águas Subterrâneas; ABAS: São Luis, Anais, 2010; Volume 16, 16p, CD-ROM. [Google Scholar]
- Picanço, F.E.; Lopes, E.C.; Souza, E.L. Fatores Responsáveis Pela Ocorrência de Ferro em Águas Subterrâneas da Região Metropolitana de Belém/PA; ABAS: São Paulo, Brazil, 2002. [Google Scholar]
- Moruzzi, R.B.; Reali, M.A.P. Oxidação e Remoção de Ferro e Manganês em Águas Para Fins de Abastecimento Público ou Industrial—Uma Abordagem Geral. R. Eng. Tecn. 2012, 4. [Google Scholar]
- Von Sperling, M. Estudos e Modelagem da Qualidade da Água de Rios, 1st ed.; Departamento de Engenharia Sanitária e Ambiental, Universidade Federal de Minas Gerais: Belo Horizonte, Brazil, 2007; 588p. [Google Scholar]
- CETESB. Relatório de Qualidade das Águas Interiores do Estado de São Paulo; Apêndice E; Companhia de Saneamento do Estado de São Paulo: Sao Paulo, Brazil, 2017. Available online: https://cetesb.sp.gov.br/aguas-interiores/publicacoes-e-relatorios/ (accessed on 10 January 2019).
- Jardim, W.F. Medição e interpretação de valores do potencial redox (EH) em matrizes ambientais. Quím. Nova 2014, 37, 1233–1235. [Google Scholar] [CrossRef]
- Tundisi, J.G.; Matsumura, T.T. Limnologia; Oficina de Textos: São Paulo, Brazil, 2008; 632p. [Google Scholar]
- Conceição, F.T.; Mazzini, F.; Moruzzi, R.B.; Navarro, G.R.B. Influências Naturais e Antrópicas na Qualidade da Água Subterrânea de Poços de Abastecimento Público na Área Urbana de Marília (SP). Rev. Bras. Recur. Hídricos 2014, 19, 227–238. [Google Scholar] [CrossRef]
- Milani, I.C.B.; Andrade, C.F.F.D.; Attisano, K.K.; Niencheski, L.F.H.; Santos, I.R.D.; Burnett, W. Fluxos subterrâneos de nutrientes e metais traço para a Lagoa Mangueira (RS). In Anais do Congresso Brasileiro de Águas Subterrâneas, Proceedings of the Congresso Brasileiro de Águas Subterrâneas, n. 15, e Encontro Nacional de Perfuradores de Poços, n. 16, 2008, Natal; Available online: https://aguassubterraneas.abas.org/asubterraneas/article/view/23719 (accessed on 10 January 2019).
- Nadiri, A.; Sedghi, Z.; Khatibi, R.; Gharekhani, M. Mapping vulnerability of multiple aquifers using multiple models and fuzzy logic to objectively derive model structures. Sci. Total Environ. 2017, 593–594, 75–90. [Google Scholar] [CrossRef]
- Fonseca, A.R.; Sanches Fernandes, L.F.; Fontainhas-Fernandes, A.; Monteiro, S.M.; Pacheco, F.A.L. The impact of freshwater metal concentrations on the severity of histopathological changes in fish gills: A statistical perspective. Sci. Total Environ. 2017, 599–600, 217–226. [Google Scholar] [CrossRef]
- Fonseca, A.R.; Sanches Fernandes, L.F.; Monteiro, S.M.; Fontainhas-Fernandes, A.; Pacheco, F.A.L. From catchment to fish: Impact of anthropogenic pressures on gill histopathology. Sci. Total Environ. 2016, 550, 972–986. [Google Scholar] [CrossRef]
- Valias, A.P.G.S.; Roqueto, M.A.; Hornink, D.G.; Koroiva, E.H.; Vieira, F.C.; Rosa, G.M.; Silva, M.A.M.L.e. Avaliação da qualidade microbiológica de águas de poços rasos e de nascentes de propriedades rurais do município de São João da Boa Vista, São Paulo. Arq. Ciên.Vet. Zool. 2002, 5, 21–28. [Google Scholar] [CrossRef]
- Souza, T.F. Avaliação da Qualidade Higiênico-Sanitária da Água de Poços Rasos Utilizada Para Consumo Humano no Município de Sete Lagoas-MG; Universidade Federal de São João del Rei: Sao Joao-Dre, Brazil, 2015; 26p. [Google Scholar]
- Da Silva, C.A.; Strapação, S.; Yamanaka, E.H.U.; Ballão, C.; Monteiro, C.S. Diagnóstico da potabilidade da água de poços rasos de uma comunidade tradicional, Curitiba-PR. Revista Biociências 2013, 19. [Google Scholar]


| Sample Number (SN) | Water Source Types Depth (m) | Geographic Coordinate System UTM WGS 84 Longitude Latitude |
|---|---|---|
| 1 | Water well – 117 m | 25M 294,802 9,134,568 |
| 2 | Water well – 15 m | 25M 295,100 9,134,730 |
| 3 | Stream | 25M 295,165 9,134,121 |
| 4 | Cacimba – 8 m | 25M 293,980 9,134,207 |
| 5 | Water well – 128 m | 25M 294,066 9,134,254 |
| 6 | Cacimba – 2 m | 25M 294,675 9,133,656 |
| 7 | Cacimba – 4 m | 25M 294,901 9,133,979 |
| 8 | Cacimba – 4 m | 25M 295,126 9,133,906 |
| 9 | Cacimba – 8 m | 25M 293,308 9,133,622 |
| 10 | Cacimba – 8 m | 25M 292,323 9,131,314 |
| 11 | Water well – 30 m | 25M 292,171 9,131,516 |
| 12 | Dredging Pond – Sand pit | 25M 292,313 9,131,739 |
| 13 | Water well – 15 m | 25M 291,853 9,131,820 |
| 14 | Cacimba - 1.5 m | 25M 291,847 9,131,823 |
| 15 | Water well – 80 m | 25M 294,024 9,133,740 |
| 16 | Cacimba – 8 m | 25M 293,919 9,133,606 |
| Parameter | Measurement Unit | Precision |
|---|---|---|
| Temperature | −5 to 55 | ±0.3 + 0.005 |
| Turbidity | 0 to 800 NTU | ±1 NTU |
| pH | 0 to 14 | ±0.1pH |
| Total dissolved solids | 0 to 100 g/L | ±5 g/L |
| Dissolved oxygen | 0 to 50 mg/L | 0 a 20 mg/L: ±0.2 mg/L 20 a 50 mg/L: ±0.5 mg/L |
| Oxi-redox potential | −2000 mV to + 2000 mV | ±15 mV |
| Electric conductivity | 0.0 µS/cm to 99.9 µS/m | ±1% |
© 2020 by the authors. Licensee MDPI, Basel, Switzerland. This article is an open access article distributed under the terms and conditions of the Creative Commons Attribution (CC BY) license (http://creativecommons.org/licenses/by/4.0/).
Share and Cite
Vieira, I.F.B.; Rolim Neto, F.C.; Carvalho, M.N.; Caldas, A.M.; Costa, R.C.A.; Silva, K.S.d.; Parahyba, R.d.B.V.; Pacheco, F.A.L.; Fernandes, L.F.S.; Pissarra, T.C.T. Water Security Assessment of Groundwater Quality in an Anthropized Rural Area from the Atlantic Forest Biome in Brazil. Water 2020, 12, 623. https://doi.org/10.3390/w12030623
Vieira IFB, Rolim Neto FC, Carvalho MN, Caldas AM, Costa RCA, Silva KSd, Parahyba RdBV, Pacheco FAL, Fernandes LFS, Pissarra TCT. Water Security Assessment of Groundwater Quality in an Anthropized Rural Area from the Atlantic Forest Biome in Brazil. Water. 2020; 12(3):623. https://doi.org/10.3390/w12030623
Chicago/Turabian StyleVieira, Igor Fellipe Batista, Fernando Cartaxo Rolim Neto, Marilda Nascimento Carvalho, Anildo Monteiro Caldas, Renata Cristina Araújo Costa, Karolyne Santos da Silva, Roberto da Boa Viagem Parahyba, Fernando Antonio Leal Pacheco, Luís Filipe Sanches Fernandes, and Teresa Cristina Tarlé Pissarra. 2020. "Water Security Assessment of Groundwater Quality in an Anthropized Rural Area from the Atlantic Forest Biome in Brazil" Water 12, no. 3: 623. https://doi.org/10.3390/w12030623