Water Allocation Using the Bankruptcy Model: A Case Study of the Missouri River


Department of Agribusiness and Applied Economics, North Dakota State University, Dept. 7610, PO Box 6050, Fargo, ND 58108-6050, USA
*
Author to whom correspondence should be addressed.
Water 2020, 12(3), 619; https://doi.org/10.3390/w12030619
Submission received: 30 December 2019
/
Revised: 10 February 2020
/
Accepted: 19 February 2020
/
Published: 25 February 2020
(This article belongs to the Section Water Resources Management, Policy and Governance)
Abstract
:This research applies cooperative game theory—specifically, the bankruptcy model—to address conflicts arising from the scarcity of water resources shared by multiple agents. This case study addresses potential outcomes of five allocation rules applied to the apportionment of water between two agents in the Missouri River. Currently, there is no interstate compact to apportion Missouri River and frequent disputes between upstream and downstream states occur. Upstream states favor managing reservoir water levels to support reservoir recreation and downstream states want water for the downstream navigation channel. The five allocation rules studied are (1) Proportional Sharing, (2) Constrained Equal Awards, (3) Constrained Equal Losses, (4) Sequential Sharing based on Proportional Sharing, and (5) a proposed Modified Constrained Equal Awards rule. The results of the analysis of apportionment during four dry years in the 2000s show that the best approaches are the proposed Modified Constrained Equal Awards Rule and the Proportional Sharing Rule.
1. Introduction
As water becomes scarcer, many regions face internal and international conflicts over shared water resource allocation [1,2,3]. Transboundary conflicts over shared resources can impact both shared international and interstate water bodies. The western United States is generally semi-arid and interstate disputes along long rivers occur because of (i) the unequal population density of riparian states, (ii) the imposition of habitat protection standards along rivers fully allocated to consumptive uses, and (iii) competing consumptive and non-consumptive uses. These disputes have led to lengthy and cumbersome legal disputes concerning shared water resources [4]. River basin compacts can be used to define rules for shared interjurisdictional management and conflict resolution. Although some compacts have proven to have inflexible rules, such as unanimity, which encumber conflict resolution, many have been successful at reducing and resolving conflicts [4,5].
The Missouri River, North America’s longest river, has been characterized by interstate disputes. A series of six large dams and reservoirs in the upper main stem of the Missouri River are controlled by the US Army Corps of Engineers (USACE). The USACE manages reservoir storage and the flow of the Missouri River through these dams and into the downstream navigation channel. The reservoirs and river flows are managed to conform to priorities established in the 1940s, as well as to the USACE’s traditional objectives of navigation and flood control, which generally favor states downstream of the dams. States in the upper basin, where the dams are located, favor managing reservoir levels to support recreation. This long-standing dispute may appear dormant during periods of plentiful water. However, during dry years, any effort to maintain the flow thorough the navigation channel comes at a high cost in terms of lower water levels and reduced access to water in the upper basin reservoirs. Although South Dakota might marginally benefit from navigation, and Nebraska does benefit from access to increased recreation, it is fair to assume that the upstream states include Montana, North Dakota, and South Dakota. The downstream states include Nebraska, Iowa, Kansas, and Missouri. Efforts to maintain water in upstream reservoirs are often complementary to efforts, championed by the U.S. Fish and Wildlife Service in the 2000s, to maintain critical river and floodplain habitats for endangered fish and bird species. Additionally, ecosystem protection has been perceived as a threat to downstream navigation [6,7,8].
The USACE has maintained control over Missouri River water allocation because a variety of alternative management institutions could not garner sufficient political support. These alternatives include a New Deal era federal agency that would mimic the popular Tennessee Valley Authority, and a Missouri River compact. In the U.S. federal system, states are responsible for water allocation and can form congressionally-approved interstate compacts which establish rules for the apportionment of water, as well as facilitate conflict resolution. Many important U.S. rivers feature apportionment compacts, including the Colorado, the Rio Grande, and some important Missouri River tributaries: the Yellowstone, the Republican, and the South Platte [6,9]. A Missouri River compact could establish rules for the division of water between states, especially during dry years, and thus support state control over water allocation [6].
Cooperative game theory (CGT) includes a suite of tools that can be used to identify strategies for developing interstate river compacts. One such tool is the bankruptcy model. The two main reasons to apply the CGT bankruptcy model to the case of the Missouri River relate to (1) the model’s simplicity and ease of use and (2) the model’s design centered around equitable resource allocation when the collective claims of the agents exceed the available water resource [10].
This paper will apply the bankruptcy model as a means of exploring the potential of an interstate compact for the Missouri River. The use of five different allocation rules for the distribution of water between upstream and downstream agents will be assessed. The next section of this paper provides a brief literature review. This is followed by the methodology, which includes an empirical model and a description of the data used. The results section provides comparisons of the likely outcomes from the implementation of five bankruptcy rules. The final section of this paper contains pertinent conclusions and observations.
2. Literature Review
An interstate river compact is a legally binding agreement between two or more states regarding the “highly salient collective goods” [5] (p368). Bennett al. [11] studied U.S. river compacts and provided a case study of the Colorado River Compact, which annually divides water by fixed volumes. The authors concluded that the optimal water allocation solution is best approximated by a combination of a fixed, or volumetric, allocation rule and a rule that distributes water as a percentage of stream flow. Their study showed that the efficiency of a river compact primarily depends on the benefit functions of the different agents and the streamflow distribution. Schlager and Heikkila [5] and Heikkila et al. [12] studied the potential for river compacts to resolve water conflicts in the western United States. They examined fourteen western US river compacts, and found that river compacts linked with government organizations or water-related agencies were useful in water conflict resolution. The authors found that compacts were hindered by unanimity rules and often did not address the most difficult conflicts, as well as courts. Most of the conflicts resolved through these river compacts were zero-sum distributional conflicts, where it was not possible to benefit one party without harming another.
Game theory consists of a group of analytical methodologies for situations in which the optimal action for each individual agent depends on the actions selected by all other agents. Von Neumann and Morgenstern [13] introduced game theory to analytically investigate each agent’s individually optimal strategy within a game, rather than focusing on some overall group objective. Within game theory, games are classified as either (1) “non-cooperative”, when agents cannot forge alliances or when alliances must be self-enforcing via credible threats, or (2) “cooperative”, when agents are able to make binding agreements that can be externally enforced (as in the case of an interstate river compact). Cooperative game theory (CGT) can lead to an agreement between all players in the system, which determines their actions and payoffs [14]. On the other hand, non-cooperative game theory (NCGT) is a game without any possibility of creating any agreement between players. Therefore, CGT can be identified as “coalitional”, while NCGT can be identified as “procedural”.
Becker and Easter used game theory to show that it is possible to have stable cooperation in the management of the North American Great Lakes with a few actors agreeing to cooperate and others free-riding [15]. Frisvold and Caswell showed that interconnected games could be used to support water-related conflict resolution along the US–Mexico border [16]. Wei and coauthors [17] used both NCGT and CGT in a two-level simulation of the impacts of major inter-basin transfer on water scarcity and water quality in China. The results demonstrated that cooperation was a dominant strategy for important players and cooperation led to overall societal benefits.
An early set of literature presented the bankruptcy model as a branch of CGT and linked this to Talmudic principles [18,19,20]. Young [21] suggested that the bankruptcy model can be used to equitably allocate shared water resources during times of scarcity. Since then, a number of researchers have applied the bankruptcy model to shared water resources, including the Nile River [22], the Euphrates River [10], and the Qezelozan-Sefridrud river system [23]. Madani [24] studied game theory and water resources to identify the interactions between the different parties in the system. A novel methodology was developed by Mianabadi et al. [10], considering the agents’ contributions to the asset along with their claims to the asset, both of which play an important role in water resource allocation.
3. Methodology
The main reason this research applies CGT to water resource allocation issues is that these methodologies provide tools that can be used to assess strategies for the development of an interstate river compact. The bankruptcy model is one such cooperative game theory tool which explores how each and every agent’s claim to a resource can be addressed when the resource stock is insufficient to meet all the claims. Another important justification for applying bankruptcy rules to the problem of interstate water allocation in the Missouri River is that, according to Ansink and Weikard [25], bankruptcy allocation rules are easy for water claimants and regulators to understand, apply, and enforce.
3.1. Empirical Model
The five bankruptcy allocation rules analyzed in this research include the Proportional Rule (PRO), Proportional Rule based on the Sequential Sharing Rule (PRO-SSR), Constrained Equal Award Rule (CEA), Constrained Equal Loss Rule (CEL), and a proposed modified CEA rule (MCEA).
Per Mianabadi et al. [10], the general characteristics of bankruptcy allocation rules for shared resource issues are as follows.
The sum of all agents’ contributions to the asset equals the total asset, and the sum of all agents’ claims thereon equals the total claim, as shown in Equations (1) and (2), respectively:
where and denote the total asset and the total claim, respectively; is the number of agents; and and are, respectively, agent i’s contribution and claim.
The total water resource allocation is equal to the sum of all agents’ individual allocations and cannot exceed the total asset, as shown in Equation (3):
where is the total resource allocation, is agent i’s water allocation, and is the total asset.
Lastly, bankruptcy allocation rules constrain resource allocations such that each agent receives a resource allocation () that is nonnegative, but does not exceed its individual claim to the asset (), as indicated by Equation (4).
Each agent’s allocation of the shared resource is thus a function of (1) the number of agents () sharing the asset, (2) each and every agent’s contribution () to the asset, and (3) each and every agent’s claim () to the asset, as follows:
3.1.1. Proportional Rule (PRO)
According to the Proportional Rule (PRO), each agent receives an equivalent proportion of its claim on the resource. Per Madani et al. [23], this proportion is equal to the total asset divided by the total of all agent’s claims, as in Equation (6). To calculate an agent’s allocation, the proportion found in Equation (6) is multiplied by the agent’s claim. Therefore, Equation (7) determines each agent’s allocation based on the PRO allocation rule:
where is the proportion of each agent’s claim that is received, is the total asset, is the total claim, is the amount of water allocated to agent i by the PRO rule, and is the amount of agent i’s claim.
3.1.2. Proportional Rule based on the Sequential Sharing Rule (PRO-SSR)
The Proportional Rule based on the Sequential Sharing Rule (PRO-SSR) was developed by Ansink [26]. This approach considers not only each agent’s claim on the resource, but also each agent’s contribution to the asset. Agent i’s contribution represents all water entering the river from within agent i’s territory via tributaries, and each agent’s contribution is restricted to be nonnegative [21]. Ansink and Weikard [25] introduced two definitions in this approach, as described in Equations (8) and (9) below.
Agent i’s total available water is the sum of agent i’s contribution and the cumulative contributions of all upstream agents minus the cumulative water allocations to all upstream agents:
where is the total asset available in agent i’s territory, is the contribution to the asset from agent i’s territory, is the contribution to the asset from upstream agent j, and is the water allocation to upstream agent j.
The excess claim downstream of agent i (CDi) is the sum of the differences between each agent’s claim and contribution for all agents downstream of agent i:
where is the excess claim downstream of agent i, is the claim of downstream agent j, and is the contribution to the asset from downstream agent j’s territory.
Each agent’s allocation coefficient is obtained by dividing agent i’s available water by the sum of agent i’s claim and the excess claim downstream of agent i, as shown in Equation (10). Agent i’s water allocation is then calculated by multiplying the agent’s allocation coefficient by the agent’s claim, as in Equation (11). The calculations are as follows:
where is agent i’s allocation coefficient, is the total water available in agent i’s territory, is the amount of agent i’s claim, is the amount by which downstream claims exceed downstream contributions, and is the amount of water allocated to agent i by the SSR-PRO rule.
3.1.3. Constrained Equal Award Rule (CEA)
The Constrained Equal Award Rule (CEA) was first proposed by Maimonides in the 12th Century C.E. [19]. This rule apportions the total asset among all n agents such that, if the available water is sufficient, each of them initially receives an amount equal to the smallest of all the agents’ claims, thus fully satisfying at least one agent’s claim. If any water remains unallocated thereafter, an amount equal to the smallest claim among the remaining agents is assigned to each agent whose claim has yet to be fully satisfied. Subsequently, any remaining water is apportioned in this manner to the remaining agents. This process continues until as many agents as possible are fully satisfied, after which any remaining water is divided equally among agents whose claims cannot be fully satisfied, such that the available water supply is exhausted. Therefore, no agent receives an amount that exceeds its claim and each agent gets a positive allocation if the total asset is positive. The calculation is thus
where is agent i’s CEA rule water allocation, is agent i’s claim amount, is the largest fully satisfied claim smaller than that of agent i, is the total asset, is the number of agents, is the number of agents whose claims are fully satisfied, and is the claim of any agent whose fully satisfied claim is smaller than agent i’s claim.
3.1.4. Constrained Equal Loss Rule (CEL)
The Constrained Equal Loss rule, like the CEA rule, was developed by 12th Century Talmudic scholars to divide an estate among claimants when the aggregate claim exceeds the total estate [20]. Different to the CEA rule, however, this rule allots the aggregate deficit equally among claimants, with the restriction that no claimant receives a negative resource allocation. Under this rule, the agent with the smallest claim receives an allocation of zero if its claim is less than the aggregate loss, represented by in Equation (12), divided by the number of claimants. If the smallest claimant receives an allocation of zero, the remainder of the aggregate loss is then apportioned equally among the remaining claimants. This procedure continues until the remaining agents with positive allocations share the remaining loss equally among themselves. Mathematically, this allocation rule can be expressed as follows:
where is agent i’s CEL rule water allocation, is agent i’s claim, is the total water deficit, is the number of agents for whom an equal share of the total deficit exceeds the amount of the claim, and is the total number of agents.
3.1.5. Proposed Modified CEA Rule
In this case study, the total claims exceed the total available water. When the aggregate claim is ten times the available water resource, distributing this paltry amount among two agents is likely to be a challenge to the decision maker and a contentious matter for claimants. Therefore, the Proposed Modified CEA rule presented here was developed to address this challenge. The proposed rule considers the claim rate—that is, —as opposed to the claim amount, as in the unmodified CEA rule. In the first round, the allocation to each agent will be the quantity that corresponds to the smallest claim rate of all agents. Subsequent rounds of resource distribution continue until as many claimants as possible have received the quantities corresponding to their individual claim rates, and claimants that have not received their full claim rate have received at least as much of the resource as any other claimant. Mathematically, this distribution rule is expressed as follows:
where is the modified CEA rule water allocation to agent i, is the total asset, is agent i’s claim amount, is the claim amount of the largest claimant that receives its full claim rate, is the number of agents receiving their full claim rates, and is the total number of agents sharing the resource. This proposed modified CEA rule may be particularly useful for amicably sharing water when it is scarce to such a degree that no agent’s claim—not even the smallest one—can be fully satisfied.
3.2. Application of the Bankruptcy Allocation Rules to the Missouri River Case Study
The Missouri River, the nation’s longest river, is the study area of this research. The Missouri River basin includes parts of ten states, including North Dakota, South Dakota, Wyoming, Nebraska, Montana, Missouri, Kansas, Iowa, Colorado, and Minnesota [6,7,8]. Missouri River water is used for navigation, recreation, irrigation, hydroelectricity generation, household and industrial uses, and ecosystem maintenance. Although the Missouri River flows mostly through the semi-arid western United States, consumptive use of the river is minor. Instead, the major conflicts occur between (1) the sparsely populated and relatively dry upper basin states, which want to utilize Missouri River water for relatively small amounts of consumptive use and reservoir recreation, and (2) the lower basin states, which want to ensure that water is released from the main stem dams in order to maintain a full season of navigation in the downstream barge channel [6,7,8].
The basic element of game theory can be identified as a/an “player/agent”. Considering that the principal source of conflict is the distribution of water between upstream and downstream regions, this analysis will concentrate on these two players/agents. Therefore, in accordance with these two significant purposes in this case study, the two agents were categorized as upstream and downstream agents. Their objectives are, respectively, maintaining a water level suitable for reservoir recreation and securing a sufficient water supply for the navigation channel.
There are six dams managed by the USACE (see Figure 1). These are Oahe, Garrison, Big Bend, Fort Randall, Fort Peck, and Gavins Point. This reservoir system supports the water supply, recreation, fish and wildlife enhancement, and flood control [27]. Additionally, the reservoir system supports barge freight transportation by releasing water to the navigation channel from late March to late November. The normal navigation period is eight months, during which time barge traffic serves five states: Iowa, Nebraska, Kansas, Missouri, and South Dakota. To maintain effective barge transport, a sufficient water level must be made available via releases from upstream reservoirs. Due to periodic droughts, there is a history of scarce water reducing the period in which the USACE maintains the navigation channel. In this case study, the area below the Gavins Point Dam represents the downstream agent, while South Dakota, North Dakota, and Montana represent the upstream agent, according to their purpose of water usage. Due to the distance from the mainstem of the Missouri River, Wyoming, Colorado, and Minnesota states are not considered in this case study.
Only dry years have been studied in the case study, as water scarcity only significantly affects the reservoir water level and the navigation channel when the cumulative inflow is less than the aggregate claim. Water scarcity in dry years leads to drastic declines of barge transport, resulting in a huge economic loss for the states. The navigation channel, which flows downstream from Sioux City, Iowa, has been crucial to the transportation of agricultural commodities from the northern Great Plains for export via the Mississippi River [6]. If the navigation period is reduced or interrupted, this will lead to conflicts between states. Therefore, it is crucial that water allocation rules be implemented fairly and consistently during dry periods to preserve access to international markets through the navigation channel.
3.3. Variables and Data Sources
There are nine variables identified in this study. These are (1) the number of agents, (2) each agent’s claim, (3) the total claim, (4) each agent’s deficit, (5) the total deficit, (6) each agent’s contribution to the asset, (7) the total asset, (8) available water for each agent, and (9) the excess downstream claim of the agent. Primary data was used to obtain the solutions. The data for the upstream agent’s claim, which is the total system storage of multiple use, was provided by the USACE Missouri River water management [27]. The data for the claim of the downstream agent, which was the daily water release from Gavins Point for the wet years, was provided by USACE, Omaha District. The data for the total available water for the upstream agent was retrieved from USACE total system storage, while the data for that variable of the downstream agent was gathered from the USGS Water Data for the Nation database [29]. The excess downstream claim of the upstream agent is the difference between the total system storage of the wet and dry year. The data for USACE’s summary of actual regulations of the Missouri River mainstem reservoir system [30] from the year 1997 to 2017 was used for the total system storage. The excess downstream claim of the downstream agent is the difference in daily water release from Gavins Point between dry and wet years. The dry years used for this analysis were 2004-2007. The data for this variable was provided by USACE Omaha Division Hydraulic Engineer, Joel D. Knofczynski.
4. Results and Discussion
4.1. Descriptive Analysis
A comparison of upstream and downstream agents’ total available water, contribution rate, claim, and claim rate is shown in Table 1.
The results indicate that the claim of the upstream agent is greater than that of the downstream agent, even though their available water is lower than the downstream agent. The reason for this is that the upstream agent has to maintain the reservoir water level for recreation and multiple use carryover purposes, and also release water to the downstream agent for maintenance of the navigation channel. The downstream agent, on the other hand, only demands water to maintain the navigation channel for barge transportation.
4.2. Proportional Rule (PRO Rule)
According to the PRO rule, each agent receives an equal proportion of its claim. To calculate the equal proportion, the total asset is divided by the total claim. The total asset and total claim are the sum of each variable of the upstream and downstream agent, as shown in Equations (1) and (2).
The total available water for the upstream agent is the total reservoir storage volume dedicated to “carryover multiple use”, which is 47.489. This is the difference between the reservoir level when the “carryover multiple use” storage is full (69.1982 km3) and the “permanent pool” water level (21.7092 km3) [6]. It is assumed that this “carryover multiple use” pool of water should be distributed over an eight-year drought period, which corresponds to the “drought of the record” during the 1930s [31]. Hence, the total available water for the upstream agent (EU) is as below:
where 69.1982 km3 is the multiple use carryover water level; 21.7092 km3 is the permanent pool water level; 8 is the number of years that the carryover pool should last; and 245 and 198 are the maximum and minimum number of navigable days downstream, respectively.
The total available water for the downstream agent (ED) is the water released from the Gavins Point, plus the water inflow from the Big Sioux and James rivers. Though the total available water for the upstream agent is constant for all four dry years, the downstream agent’s total available water is different each year for the period from 2004 to 2007, as shown in Table 2 and Table 3.
The claim of the upstream agent is the total system storage at the multiple use carryover water level, or 69.1982 km3. This amount is needed for the upstream agent to provide a reservoir water level sufficient for recreation and other multiple uses for the states, as well as to support the navigation channel. Any water exceeding the 69.1982 km3 level supports seasonal water storage needs. The downstream agent’s claim is the daily water release from Gavins Point during the wet years. The full dataset includes water releases for all years from 1997 to 2017, including the dry years from 2004 to 2007. Therefore, the downstream agent’s claim is the average daily water released from Gavins Point during the navigation period in all years except 2004 to 2007, which is 19.8825 km3. The total claim is the sum of two agents’ claims: 89.0807 km3. The equal proportion used to determine each allocation for each of the four dry years of the study is calculated below, based on Equation (6):
Although this approach allocates each agent an equal proportion of its claim, the allocated quantities differ among agents because their claims are different. The water allocations for both agents are as follows, based on Equation (7):
As this rule allocates each agent an equal proportion of its claim, the allocation will be dependent upon the initial claim. However, since this study considers only two agents, the PRO rule provides an undebatable allocation solution within the total available water range.
4.3. Sequential Sharing Rule-Based PRO Method (SSR-PRO)
The excess downstream claim of the upstream agent can be recognized as the water level needed to maintain the full navigation period. The full navigation period for the Missouri River is 245 days. However, during the dry years from 2004 to 2007, the total number of navigation days was between 198 and 205 days. Table 4 shows the start and end dates for the navigation period each year from 2004 to 2007, along with the total number of navigation days.
The excess claim of the upstream agent, , is presented in Table 5. This is the difference between the total system storage (TSS) during wet years, which is 69.3709 km3, and the TSS during dry years, which ranged between 43.1718 and 46.1322 km3 during the dry period from 2004 to 2007. The excess downstream claim of the downstream agent, , is the amount of water that must be released at Gavins Point to maintain the navigation channel for the full navigation period—i.e., the typical release during wet years—minus the amount that is actually released during the dry years. Table 6 contains the calculated excess downstream claim of the downstream agent during each of the four dry years, which ranges from 0.0913 to 0.1900 km3.
The allocation solution () for the upstream and downstream agents can be determined based on the total water available to each agent ( and ), each agent’s claim ( and ), and each agent’s excess downstream claim ( and ). Table 7 presents the values of these variables, along with the SSR-PRO allocation solution for each year from 2004 to 2007.
In all years, the upstream and downstream agents’ claims remain constant, as their demands for water during wet and dry years are constant. The allocation solution is obtained by multiplying the allocation coefficient and the agent’s claim. The results of this approach show that the water allocation for the upstream agent is constant during all dry years at 0.8304 km3, due to constant claim and allocation coefficient values. On the other hand, the downstream agent should receive 1.5906 km3 during 2004 and 2005, while it should receive 1.7894 km3 during 2006 and 2007.
4.4. Constrained Equal Award Rule (CEA Rule)
This approach prioritizes the lowest claimant when the water is distributed. Since this study’s lowest claim exceeds the total available water and there are only two agents in the system, this approach provides a unique solution. The lowest claim out of the two agents in this system is the downstream agent’s claim (19.8825 km3), which exceeds the total available water (2.8370 km3). Madani et al. [16] mentioned that if the claim exceeds the water availability at any stage of the process, the available water should be distributed equally among all agents who were not satisfied in the early stages. Following the CEA rule, the available water is distributed among the two agents, as shown in Table 8.
4.5. Constrained Equal Loss Rule (CEL Rule)
The concept of this approach is the opposite of the CEA rule, where the highest claimant receives the priority instead of the lowest claimant. Since the highest claim (69.1982 km3) of this study exceeds the total available water, as is the case for the CEA rule allocation solutions, both agents receive equal water allocation, as presented in Table 8.
The results of both the CEA and CEL rules provide the same allocation solutions, as each agent’s claim exceeds the total available water. The solution provided by this approach for this case study is questionable, as both agents receive equal water allocations, despite different claims.
4.6. Proposed Modified CEA Rule
The principle behind the proposed Modified CEA rule is to give priority to the lowest percentage claim rate, as this study’s claim exceeds the total available water and only two agents were considered. The claim rates of the upstream and downstream agents are, respectively,
Considering the percentage claim rates of the two agents, the lowest claim rate is that of the downstream agent. Initially, both agents receive the water allocation that corresponds to the downstream agent’s claim rate. Once this quantity has been distributed, the remaining available water will be allocated to the upstream agent, until the upstream agent has the quantity that corresponds to its claim rate. The downstream agent’s allocation is found by multiplying the total available water by the downstream agent’s claim rate: km3. Once this amount has been allocated to each agent, the remaining 1.5827 km3 of water is allocated to the upstream agent, so that the upstream agent’s allocation is km3. In the case of the Missouri River during dry years, neither agent’s claim can be fully satisfied, but what water is available can be shared equitably for upstream and downstream uses. This proposed modified CEA rule assures that both agents receive a share of the available water, unlike the CEL rule, and ensures that no agent’s full claim amount will be allocated unless all agents can receive their full claim amount, unlike the unmodified CEA rule.
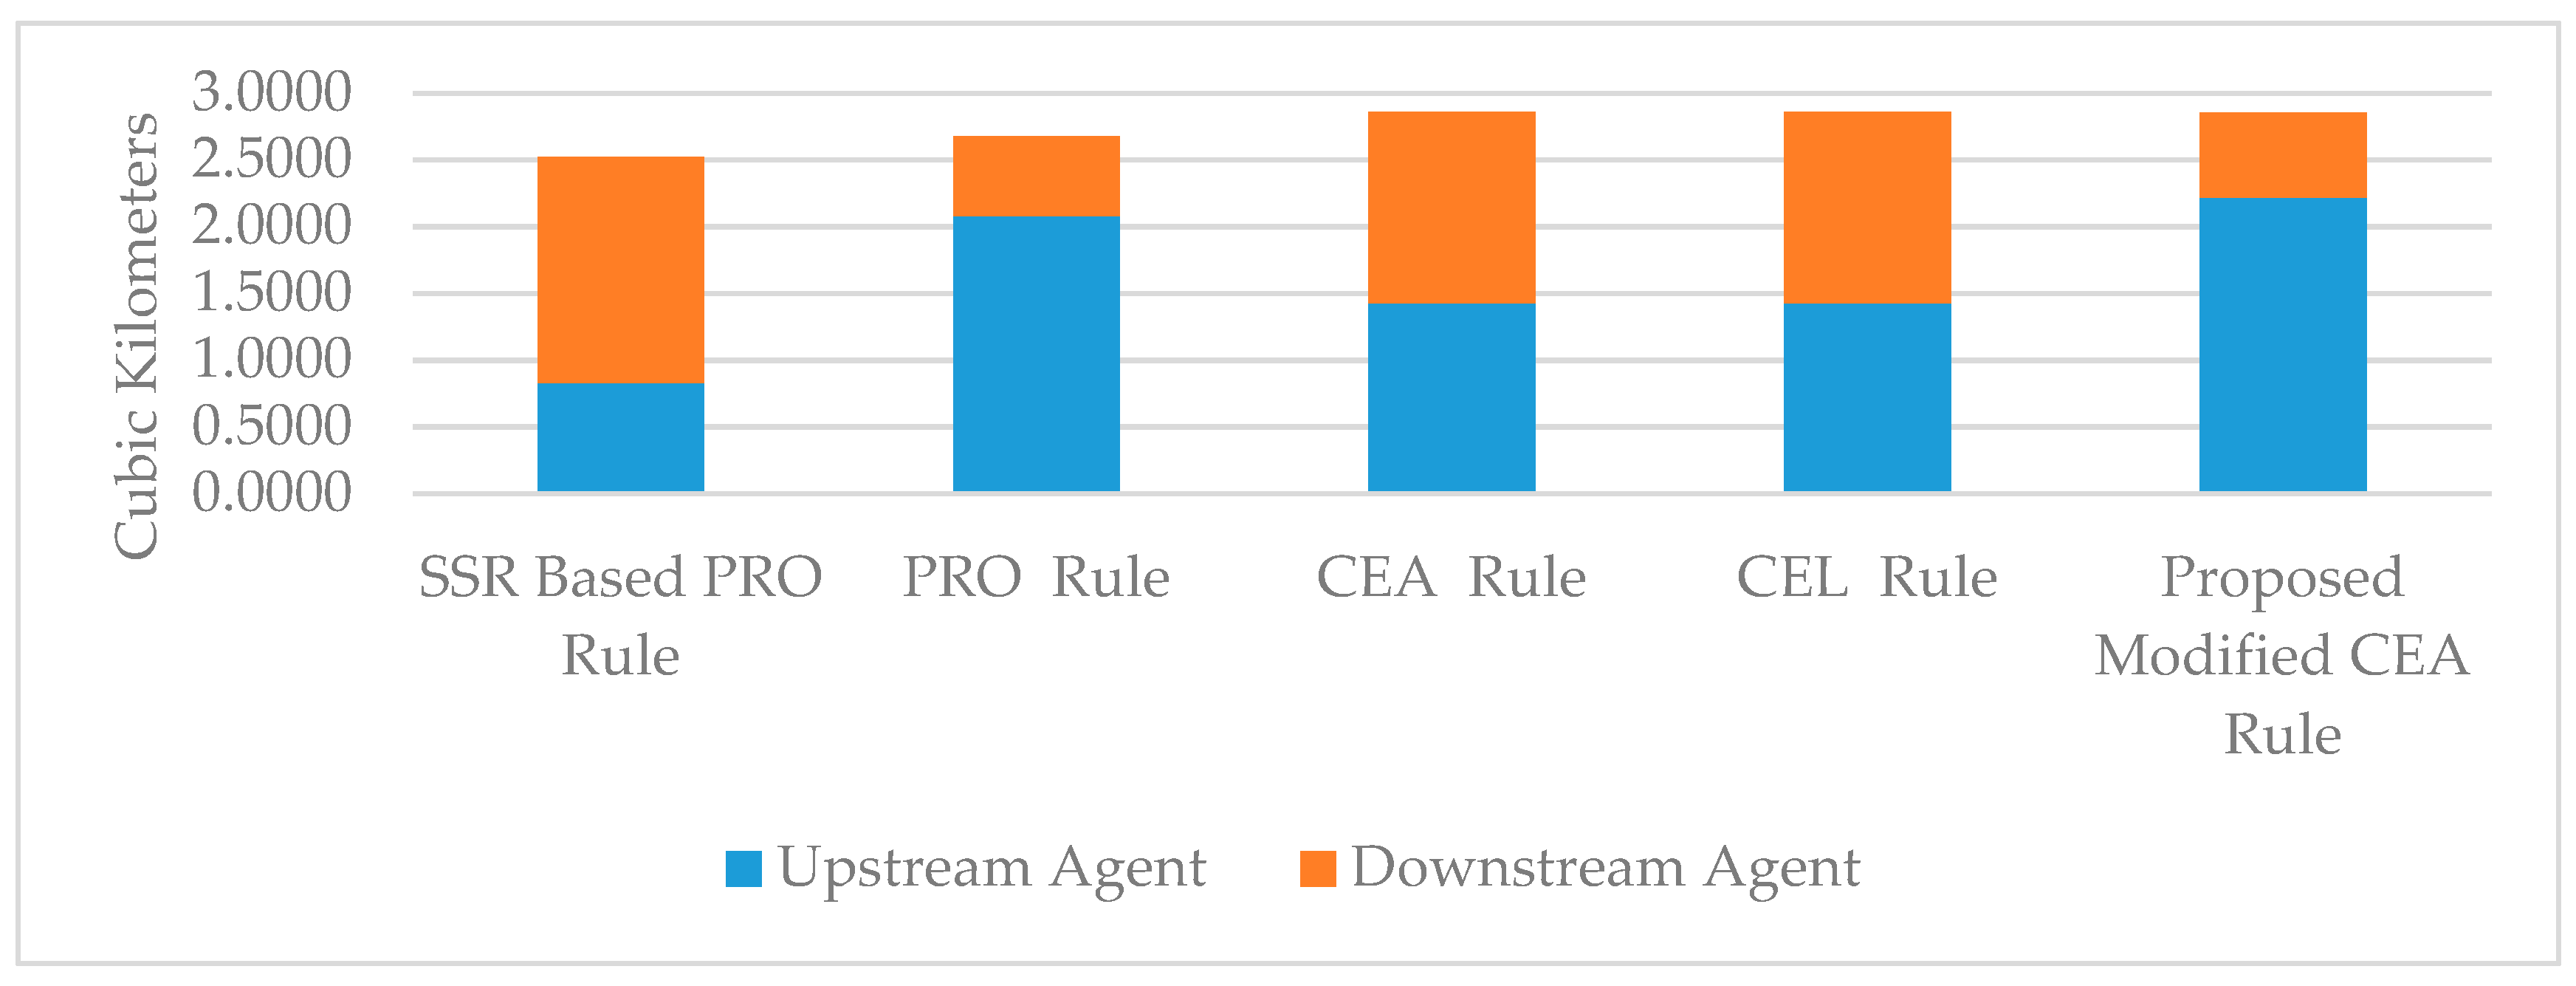
To select the best approach among the five bankruptcy allocation rules studied in the case of the Missouri River, the outcomes of all rules were compared (see Table 9 and Figure 2).
Out of the five allocation rules, the CEA and CEL rules provide solutions which are overly simple as they distributes water equally, despite different claims. In particular, the upstream agent’s claim is much higher than that of the downstream agent, but this claim is not respected. Therefore, in this case study, the CEA and CEL rules do not provide an acceptable allocation solution.
Three allocation rules of the SSR-PRO rule should apply to linearly ordered agents only. The SSR-PRO approach favors the downstream agent, as Ansink and Weikard [26] suggested, regardless of the agents’ claims and contribution to the asset. In this case study, the upstream agent will receive 32.9% of available water, while the downstream agent will receive 67.1%, which demonstrates that the SSR-PRO rule favors the downstream agent. As a result, allocation solutions provided by this methodology cannot be identified as an acceptable approach for addressing the Missouri River water allocation issue.
The PRO rule and proposed Modified CEA rule provide allocation solutions within the total available water range. To overcome the shortcoming of the CEA and CEL rule, this study proposed a modified version of the CEA rule, which considers the lowest percentage claim rate. The results showed that both agents are satisfied with this approach, as the modified CEA rule allocates water at a level similar to the demanded proportion of the claim rates. The allocation solution of the PRO rule also allocates a higher proportion to the upstream agent as their claim is higher. Therefore, the application of the PRO rule for addressing the bankruptcy issues in this case study can be identified as one of the best options.
5. Conclusions
Five different allocation rules under the bankruptcy model were applied to a case study of the Missouri River. In this case study, which is applicable to dry years, the actors are defined as upstream states, interested in maintaining water in reservoirs, and downstream states, which want to support navigation. Bankruptcy allocation rules can play a major role in reducing or preventing conflicts between states over water resources. Additionally, bankruptcy allocation has obvious advantages over fixed volumetric allocation.
Considering all of the above factors, such as the practical shortcomings, unfairness, and unacceptability, the two best approaches for resolving the bankruptcy issue in the Missouri River water allocation are the PRO and proposed modified CEA rule. Nevertheless, the accountability of the allocation solutions of the bankruptcy allocation rules always depend on the agents in the system, as one allocation rule will provide a fair solution for one agent, while it will be unfair for other agents. One of the drawbacks of this study is that not all possible allocation rules were explored. However, the main allocation rules currently in use for water sharing in other river systems were studied for dry periods in the Missouri River from 1997 to 2017. Therefore, assuming that the agents will agree to select the approach which provides the highest allocation solution, and implement it via a river compact, the best allocation rule for the Missouri River water sharing issue is the proposed modified CEA rule, and the second-best approach is the PRO rule.
The findings of the Missouri River case study can be developed further and contribute to the implementation of significant water policies for water resource management, as bankruptcy game theory provides strategies for developing interstate river compacts. Furthermore, innovative ways to include ecological flows and ecosystem services protection might be explored within this context.
Author Contributions
The original draft of this manuscript was prepared by H.M.W. based upon her M.S. thesis supervised by R.R.H.; D.C.R. revised the methodology. R.R.H. and D.C.R. revised the final submission. All authors have read and agreed to the published version of the manuscript.
Funding
This material is based upon work supported, in part: by a Graduate Research Assistantship from Department of Agribusiness and Applied Economics, North Dakota State University; the National Institute of Food and Agriculture, US Department of Agriculture, under Project No. ND01315; and by the National Science Foundation ND EPSCoR award IIA-1355466. Any opinions, findings, conclusions, or recommendations expressed in this publication are those of the author(s) and do not necessarily reflect the view of the U.S. Department of Agriculture or the National Science Foundation.
Acknowledgments
The authors thank USACE Omaha Division Hydraulic Engineer, Joel D. Knofczynski for data assistance and reviewers of this journal for helpful suggestions.
Conflicts of Interest
The authors declare no conflict of interest.
References
- Houba, H.; Do, K.H.P.; Zhu, X. Capacity Choice of Dams Under Rivalry Use and Externalities; SSRN Scholarly Paper 2014 ID 2516751; Social Science Research Network: Rochester, NY, USA, 2014. [Google Scholar]
- Mekonnen, M.M.; Hoekstra, A.Y. Four Billion People Facing Severe Water Scarcity. Sci. Adv. 2016, 2, e1500323. [Google Scholar] [CrossRef] [PubMed] [Green Version]
- del Saz-Salazar, S.; García-Rubio, M.A.; González-Gómez, F.; Picazo-Tadeo, A.J. Managing Water Resources Under Conditions of Scarcity: On Consumers’ Willingness to Pay for Improving Water Supply Infrastructure. Water Resour. Manag. 2016, 30, 1723–1738. [Google Scholar] [CrossRef]
- Dellapenna, J.W. Transboundary Water Sharing and the Need for Public Management. J. Water Resour. Plan. Manag. 2007, 133, 397–404. [Google Scholar] [CrossRef]
- Schlager, E.; Heikkila, T. Resolving Water Conflicts: A Comparative Analysis of Interstate River Compacts. Policy Stud. J. 2009, 37, 367–392. [Google Scholar] [CrossRef] [Green Version]
- Hearne, R.R.; Prato, T. Institutional Evolution of Missouri River Management. Water Policy 2016, 18, 619–634. [Google Scholar] [CrossRef]
- Thorson, J.E. River of Promise River of Peril; University of Kansas Press: Lawrence, KS, USA, 1994. [Google Scholar]
- National Research Council. The Missouri River Ecosystem: Exploring the Prospects for Recovery; The National Academies Press: Washington, DC, USA, 2002. [Google Scholar] [CrossRef]
- US Fish & Wildlife Service. Digest of Federal Resource Laws of Interest to the U.S. Fish and Wildlife Service: Interstate Compacts. Available online: http://www.fws.gov/laws/lawsdigest/compact.html (accessed on 5 January 2020).
- Mianabadi, H.; Mostert, E.; Zarghami, M.; van de Giesen, N. A New Bankruptcy Method for Conflict Resolution in Water Resources Allocation. J. Environ. Manag. 2014, 144, 152–159. [Google Scholar] [CrossRef] [PubMed]
- Bennett, L.L.; Howe, C.W.; Shope, J. The Interstate River Compact as a Water Allocation Mechanism: Efficiency Aspects. Am. J. Agric. Econ. 2000, 82, 1006–1015. [Google Scholar] [CrossRef]
- Heikkila, T.; Schlager, E.; Davis, M.W. The Role of Cross-Scale Institutional Linkages in Common Pool Resource Management: Assessing Interstate River Compacts. Policy Stud. J. 2011, 39, 121–145. [Google Scholar] [CrossRef]
- Von Neumann, J.; Morgenstern, O. Theory of Games and Economic Behavior; Princeton University Press: Princeton, NJ, USA, 1944. [Google Scholar]
- Maskin, E. How Can Cooperative Game Theory Be Made More Relevant to Economics? An Open Problem. In Open Problems in Mathematics; Nash, J., Jr., Rassias, M., Eds.; Springer International Publishing: Cham, Switzerland, 2016; pp. 347–350. [Google Scholar] [CrossRef]
- Becker, N.; Easter, K.W. Conflict and Cooperation in Managing International Water Resources Such as the Great Lakes. Land Econ. 1999, 75, 233–245. [Google Scholar] [CrossRef]
- Frisvold, G.B.; Caswell, M.F. Transboundary water management: Game theoretic lessons for projects on US Mexico. Agric. Econ. 2000, 24, 101–111. [Google Scholar]
- Wei, S.; Yang, H.; Abbaspour, K.; Mousavi, J.; Gnauck, A. Game theory based models to analyze water conflicts in the Middle Route of the South-to-North Water Transfer Project in China. Water Res. 2010, 44, 2499–2516. [Google Scholar] [CrossRef] [PubMed]
- O’Neill, B. A Problem of Rights Arbitration from the Talmud. Math. Soc. Sci. 1982, 2, 345–371. [Google Scholar] [CrossRef] [Green Version]
- Aumann, R.J.; Maschler, M. Game Theoretic Analysis of a Bankruptcy Problem from the Talmud. J. Econ. Theory 1985, 36, 195–213. [Google Scholar] [CrossRef]
- Herrero, C.; Villar, A. The Three Musketeers: Four Classical Solutions to Bankruptcy Problems. Math. Soc. Sci. 2001, 42, 307–328. [Google Scholar] [CrossRef]
- Young, H.P. Handbook of Game Theory with Economic Application; Aumann, R.J., Hart, S., Eds.; Elsevier Science Publishers: Amsterdam, The Netherlands, 1994; Volume 2, pp. 1193–1235. [Google Scholar]
- Degefu, D.M.; He, W.; Yuan, L.; Zhao, J.H. Water Allocation in Transboundary River Basins under Water Scarcity: A Cooperative Bargaining Approach. Water Resour. Manag. 2016, 30, 4451–4466. [Google Scholar] [CrossRef]
- Madani, K.; Zarezadeh, M.; Morid, S. A New Framework for Resolving Conflicts over Transboundary Rivers Using Bankruptcy Methods. Hydrol. Earth Syst. Sci. 2014, 18, 3055–3068. [Google Scholar] [CrossRef] [Green Version]
- Madani, K. Game Theory and Water Resources. J. Hydrol. 2010, 381, 225–238. [Google Scholar] [CrossRef]
- Ansink, E.; Weikard, H.-P. Sequential Sharing Rules for River Sharing Problems. Soc. Choice Welf. 2012, 38, 187–210. [Google Scholar] [CrossRef] [Green Version]
- Ansink, E. Game-Theoretic Models of Water Allocation in Transboundary River Basins. Ph.D. Thesis, Wageningen University, Wageningen, The Netherlands, 2009. Available online: https://pdfs.semanticscholar.org/0444/5ea2a359972632d0754f7e89a8c8f52c3159.pdf (accessed on 20 February 2020).
- US Army Corps of Engineers Omaha Division. Missouri River Mainstem Reservoir System Master Water Control Manual Missouri River Basin. 2006. Available online: https://digitalcommons.unl.edu/usarmyceomaha/71/ (accessed on 29 December 2019).
- Vineyard, J.D. Missouri State Water Plan Series Volume VI, Water Resource Sharing—The Realities of Interstate Rivers; Water Resources Report No. 50; Missouri Department of Natural Resources’ Division of Geology and Land Survey: Rolla, MO, USA, 1997; p. 4.
- US Geological Service. USGS Water Data for the Nation. Undated. Available online: https://nwis.waterdata.usgs.gov/usa/nwis/ (accessed on 20 February 2020).
- US Army Corps of Engineers Northwestern Division. Missouri River Stage Trends Technical Report. 2017. Available online: https://usace.contentdm.oclc.org/utils/getfile/collection/p266001coll1/id/5716 (accessed on 29 December 2019).
- National Drought Mitigation Center. The Dustbowl. Available online: https://drought.unl.edu/dustbowl/Home.aspx (accessed on 29 December 2019).
Figure 1.
Map of the Missouri River basin with mainstem dams. [28].
Figure 1.
Map of the Missouri River basin with mainstem dams. [28].

Figure 2.
Comparison of results of alternative bankruptcy allocation rules.


Table 1.
Summary of the descriptive analysis.
| Upstream Agent | Downstream Agent | |||
|---|---|---|---|---|
| Variable | Quantity | Proportion | Quantity | Proportion |
| Total available water () | 1.1385 | (39.9%) | 1.7184 | (60.1%) |
| Contribution rate | 0.4915 | (39.9%) | 0.7419 | (60.1%) |
| Claim () | 69.1982 | (77.7%) | 19.8824 | (22.3%) |
| Claim rate | 0.9581 | (77.7%) | 0.2750 | (22.3%) |
Units: Cubic Kilometer.
Table 2.
Total available water for the downstream agent for dry years (2004-2007).
| Year | Average Water Released from Gavins Point (m3/s) | Average Water Released from Big Sioux River (m3/s) | Average Water Released from James River (m3/s) | Unallocated Upstream Water (km3) | Available Water (ED) (km3) |
|---|---|---|---|---|---|
| 2004 | 305.43 | 25.21 | 11.40 | 0.3081 | 1.6949 |
| 2005 | 289.91 | 48.96 | 3.43 | 0.3081 | 1.6981 |
| 2006 | 327.03 | 17.85 | 2.49 | 0.3081 | 1.7187 |
| 2007 | 276.43 | 78.71 | 2.78 | 0.3081 | 1.7615 |
Sources: USGS and US Army Corps of Engineers (USACE) database. Units: Cubic meters per second (m3/s) and cubic kilometer (km3).
Table 3.
The total available water for all four dry years (2004–2007).
| Year | EU | ED | Total Available Water (E) |
|---|---|---|---|
| 2004 | 1.1385 | 1.6949 | 2.8334 |
| 2005 | 1.1385 | 1.6981 | 2.8366 |
| 2006 | 1.1385 | 1.7187 | 2.8572 |
| 2007 | 1.1385 | 1.7615 | 2.9000 |
Units: Cubic kilometer.
Table 4.
Summary of the navigation period for the dry years.
| Year | Start Date | End Date | Number of Days of Navigation |
|---|---|---|---|
| 2004 | 23rd of March | 6th of October | 198 |
| 2005 | 23rd of March | 6th of October | 198 |
| 2006 | 23rd of March | 6th of October | 198 |
| 2007 | 23rd of March | 13th of October | 205 |
Table 5.
Claim for the dry years of Missouri River for the upstream agent.
| Year | TSS (Wet)–TSS (Dry) | Excess Claim |
|---|---|---|
| 2004 | 69.3709–44.1586 | 25.2123 |
| 2005 | 69.3709–44.6520 | 24.7189 |
| 2006 | 69.3709–43.1718 | 26.1991 |
| 2007 | 69.3709–46.1322 | 23.2387 |
Units: Cubic kilometers.
Table 6.
Excess claim for the dry years of Missouri River for the downstream agent.
| Year | Excess Claim (CD) |
|---|---|
| 2004 | 0.1567 |
| 2005 | 0.1900 |
| 2006 | 0.1258 |
| 2007 | 0.0913 |
Units: Cubic kilometers.
Table 7.
Allocation solution for two agents.
| Year | Upstream Agent | Downstream Agent | ||||||
|---|---|---|---|---|---|---|---|---|
| 2004 | 1.1385 | 69.1982 | 25.4097 | 0.8304 | 1.6949 | 19.8825 | 0.1567 | 1.5906 |
| 2005 | 1.1385 | 69.1982 | 24.7189 | 0.8304 | 1.6981 | 19.8825 | 0.1900 | 1.5906 |
| 2006 | 1.1385 | 69.1982 | 26.1991 | 0.8304 | 1.7187 | 19.8825 | 0.1258 | 1.7894 |
| 2007 | 1.1385 | 69.1982 | 23.2388 | 0.8304 | 1.7615 | 19.8825 | 0.0913 | 1.7894 |
Units: Cubic kilometers.
Table 8.
Constrained Equal Loss and Constrained Equal Award Water allocations for four dry years.
| Year | EU | ED | Total Water Availability | Water Allocation |
|---|---|---|---|---|
| 2004 | 1.1385 | 1.6949 | 2.8334 | 1.4168 |
| 2005 | 1.1385 | 1.6981 | 2.8366 | 1.4184 |
| 2006 | 1.1385 | 1.7187 | 2.8572 | 1.4286 |
| 2007 | 1.1385 | 1.7615 | 2.9000 | 1.4501 |
Units: Cubic kilometers.
Table 9.
Overall comparison of bankruptcy allocation rules.
| SSR Based PRO Rule | PRO Rule | CEA Rule | CEL Rule | Proposed Modified CEA | |
|---|---|---|---|---|---|
| Upstream Agent | 0.8304 (32.9%) | 2.0759 (77.7%) | 1.4285 (50%) | 1.4285 (50%) | 2.2155 (77.7%) |
| Downstream Agent | 1.6900 (67.1%) | 0.5970 (22.3%) | 1.4285 (50%) | 1.4285 (50%) | 0.6371 (22.3%) |
Units: Cubic kilometers.
© 2020 by the authors. Licensee MDPI, Basel, Switzerland. This article is an open access article distributed under the terms and conditions of the Creative Commons Attribution (CC BY) license (http://creativecommons.org/licenses/by/4.0/).
Share and Cite
MDPI and ACS Style
Wickramage, H.M.; Roberts, D.C.; Hearne, R.R. Water Allocation Using the Bankruptcy Model: A Case Study of the Missouri River. Water 2020, 12, 619. https://doi.org/10.3390/w12030619
AMA Style
Wickramage HM, Roberts DC, Hearne RR. Water Allocation Using the Bankruptcy Model: A Case Study of the Missouri River. Water. 2020; 12(3):619. https://doi.org/10.3390/w12030619
Chicago/Turabian StyleWickramage, Heshani Manaweera, David C. Roberts, and Robert R. Hearne. 2020. "Water Allocation Using the Bankruptcy Model: A Case Study of the Missouri River" Water 12, no. 3: 619. https://doi.org/10.3390/w12030619
Note that from the first issue of 2016, this journal uses article numbers instead of page numbers. See further details here.