The Effect of Salinity on the Growth of Lavender Species
by
 and
and
Angeliki T. Paraskevopoulou
1,*, 
Anna Kontodaimon Karantzi
1,
Georgios Liakopoulos
2,
Paraskevi A. Londra
3 and
Konstantinos Bertsouklis
1
1
Laboratory of Floriculture and Landscape Architecture, Department of Crop Science, School of Plant Sciences, Agricultural University of Athens, Iera Odos 75, 118 55 Athens, Greece
2
Laboratory of Plant Physiology and Morphology, Department of Crop Science, School of Plant Sciences, Agricultural University of Athens, Iera Odos 75, 118 55 Athens, Greece
3
Laboratory of Agricultural Hydraulics, Department of Natural Resources Management & Agricultural Engineering, School of Environment and Agricultural Engineering, Agricultural University of Athens, Iera Odos 75, 118 55 Athens, Greece
*
Author to whom correspondence should be addressed.
Water 2020, 12(3), 618; https://doi.org/10.3390/w12030618
Submission received: 10 February 2020
/
Accepted: 23 February 2020
/
Published: 25 February 2020
(This article belongs to the Special Issue Study of the Soil Water Movement in Irrigated Agriculture)
Abstract
:Long term degradation of water quality from natural resources has led to the use of alternative water resources for irrigation that are saline. Saline water irrigation in floriculture for the production of nursery crops requires an understanding of plant response. The pot growth of four lavender species (Lavandula angustifolia, Lavandula dentata var. dentata, Lavandula dentata var. candicans and Lavandula stoechas) irrigated with water containing different concentrations of NaCl (0, 25, 50, 100 and 200 mM) was investigated under greenhouse conditions. Overall results of different plant growth variables were consistent, showing a significant decrease at 100 and 200 mM NaCl. All lavender species showed signs of salinity stress that included chlorosis, followed by leaf and stem necrosis at NaCl concentrations greater than 50 mM. L. dentata var. dentata showed the greatest plant growth followed in descending order by L. dentata var. candicans, L. stoechas and L. angustifolia. Despite greater growth of L. dentata var. dentata, the appearance of L. dentata var. candicans was “healthier”. In areas with saline irrigation water, L. dentata var. dentata and L. dentata var. candicans are proposed for the production of lavender nursery crops.
1. Introduction
In arid, semi-arid and coastal areas, natural resources for good quality water have decreased. They are often characterized by high contents of total soluble salts due to groundwater overexploitation, seawater intrusion into aquifers and increased demand for freshwater, particularly in densely populated areas [1,2]. Long term degradation of water quality has led to the use of alternative water resources for irrigation derived from water reuse and recycling that is also saline [3,4]. Irrigation with saline water affects the growth and development of many plant species, even at low concentrations [5,6]. In the ground whether in the wild, field or garden, the effect of salinity on plants is determined by various variables such as ion concentration, soil composition, proximity to the sea, altitude, evapotranspiration rate, temperature and rainfall frequency [5,6,7]. In many parts of the world, salinity affects agricultural production and is predicted to become more intense in future decades [8]. It is considered as one of the most important stress factors in plant growth and yield that could lead to plant death under persisting saline conditions [6,9]. Plant tolerance to salinity stress depends on the capacity of plants to exclude salt from the shoots or tolerate high leaf salt concentrations [10].
Irrigation with saline water initially creates a water deficit induced by osmotic stress and demonstrated by the reduced ability of plants to absorb water hence reduced plant growth rate [11]; the high saline concentrations cause osmotic and ionic imbalances between soil and plants, and plants exhibit signs of wilt despite the fact they have been irrigated [12,13]. Afterwards, a salt-specific or ion-excess effect of salinity is demonstrated by the salt entrance into the plant transpiration stream, causing eventual injury of transpiring leaf cells and further reduction of plant growth [11]. The high saline concentrations within the plant affect the anatomy, physiology and morphology of plant parts and particularly of leaves [4,6,14,15]. The salts absorbed by the plant are concentrated within the mature leaves, leading to leaf death over an extended time period due to the inability of leaf cells to compartmentalize salts in the vacuole; hence the salts either accumulate in the cytoplasm, inhibiting enzyme function, or accumulate in the cell walls, dehydrating the leaf cells [11]. The level of stress caused by salinity is dependent on the plant species and variety, the growth substrate and the applied method of irrigation. The more tolerant nonhalophytic species avoid the ion-excess effect. However, they may exhibit water deficits affecting cell extension and/or division. Therefore, potential reductions in photosynthesis may represent a secondary effect of reduced growth [16].
In floriculture, the use of saline water for the production of nursery crops requires an understanding of plant response to the effect of salinity through irrigation [17]. Some effects of salinity, on one hand, could be desirable such as decreased length and/or number of internodes [17] and others on the other hand could be undesirable such as chlorosis and marginal leaf necrosis. The effect of saline irrigation on floriculture has received less attention, as ornamental plants are normally irrigated with good-quality water [18,19]. In areas with limited or poor water quality resources, the cultivation of floriculture crops that can tolerate saline water irrigation can be an advantage [20]. Lavender species and varieties are popular floriculture crops. Lavender plants such as Lavandula angustifolia, L. dentata, and L. stoechas and their numerous cultivars are sold as ornamental plants for the garden. These species exhibit a variety of leaves and inflorescences with ornamental value and are highly aromatic due to the essential oils present in glands that cover much of the plant surface. The Lavandula genus includes 47 species and many varieties [21]. Some Lavandula species such as Lavandula stoechas and Lavandula angustifolia are found naturally growing in the Mediterranean coniferous coastal dune woodlands, coastal garrigues and sea cliffs, often exposed to sea spray [22,23]. The literature on the effect of saline irrigation on Lavandula species for nursery crops is limited. Potted L. multifida plants were able to grow in a mixture of sphagnum peat-moss and perlite when irrigated with 60 mM NaCl without significant biomass reduction [24]; however, the total plant dry weight of L. multifida decreased when irrigated with 100 mM and 200 mM NaCl [20,24]. Despite this, there are no comparative studies among different lavender species grown under greenhouse conditions and irrigated with different NaCl solutions.
This study examines the pot growth of four Lavandula species irrigated with different concentrations of saline water for nursery production to support floriculture in areas with poor water quality, using saline water for irrigation.
2. Materials and Methods
2.1. Experimental Site and Growth Conditions
Uniform in size, young (5 months old) and fully developed potted lavender plants were supplied by the nursery Kalantzis Plants (Marathonas, Greece). The pot size was 2.5 L (dimensions: 17 cm top diameter, 12.3 cm base diameter and 15 cm height). The growth substrate of the supplied potted lavender plants contained pure sphagnum peat (Base Substrate 2 medium, Klausmann-Deilmann Europe GmbH, Germany) and perlite (Perloflor, ISOCON S.A., Piraeus, Greece) in a 96:4 ratio (v/v) with pH 5.5–6.0 and EC 0.8 mS m−1. Plants were placed on metal benches (dimensions: 2.5 m length, 0.85 m width and 0.80 m height) in an automated glass greenhouse of the Laboratory of Floriculture & Landscape Architecture of the Agricultural University of Athens (lat. 37°58′57″N and long. 23°42′17″E), with average daily and night temperatures of 21.4 ± 0.311 °C and 14.3 ± 0.065 °C, respectively, and average humidity during daytime of 57.6 ± 0.705% and night-time average humidity of 84.6 ± 0.309%. Plants were acclimatized to the new growth conditions for a month and the experiment took place in late winter-early spring over 56 days (from 3 February; day 1 to 30 March 2018; day 56). All plants received the same cultivation practices (i.e., applications of fertilizer, fungicide, etc.) throughout the duration of the experiment that included the application of 2 g L−1 H2O fertilizer 20-20-20 (Fast-Grow, Humofert S.A., Metamorfosi, Greece) and pesticide (Decis 25 EC, Bayer AG, Leverkusen, Germany) at monthly intervals.
2.2. Experimental Design and Irrigation Treatments
Four lavender species were studied: Lavandula angustifolia, Lavandula dentata var. dentata, Lavandula dentata var. candicans and Lavandula stoechas. The effect of salinity was investigated using different concentrations of NaCl solutions through irrigation that included 0 (control), 25, 50, 100 and 200 mM of NaCl. The corresponding EC levels for the irrigation water were 0.3, 3.0, 5.8, 10.6 and 20.7 dSm−1 and pH values were in the range 8.0–8.2 (at 25 °C).
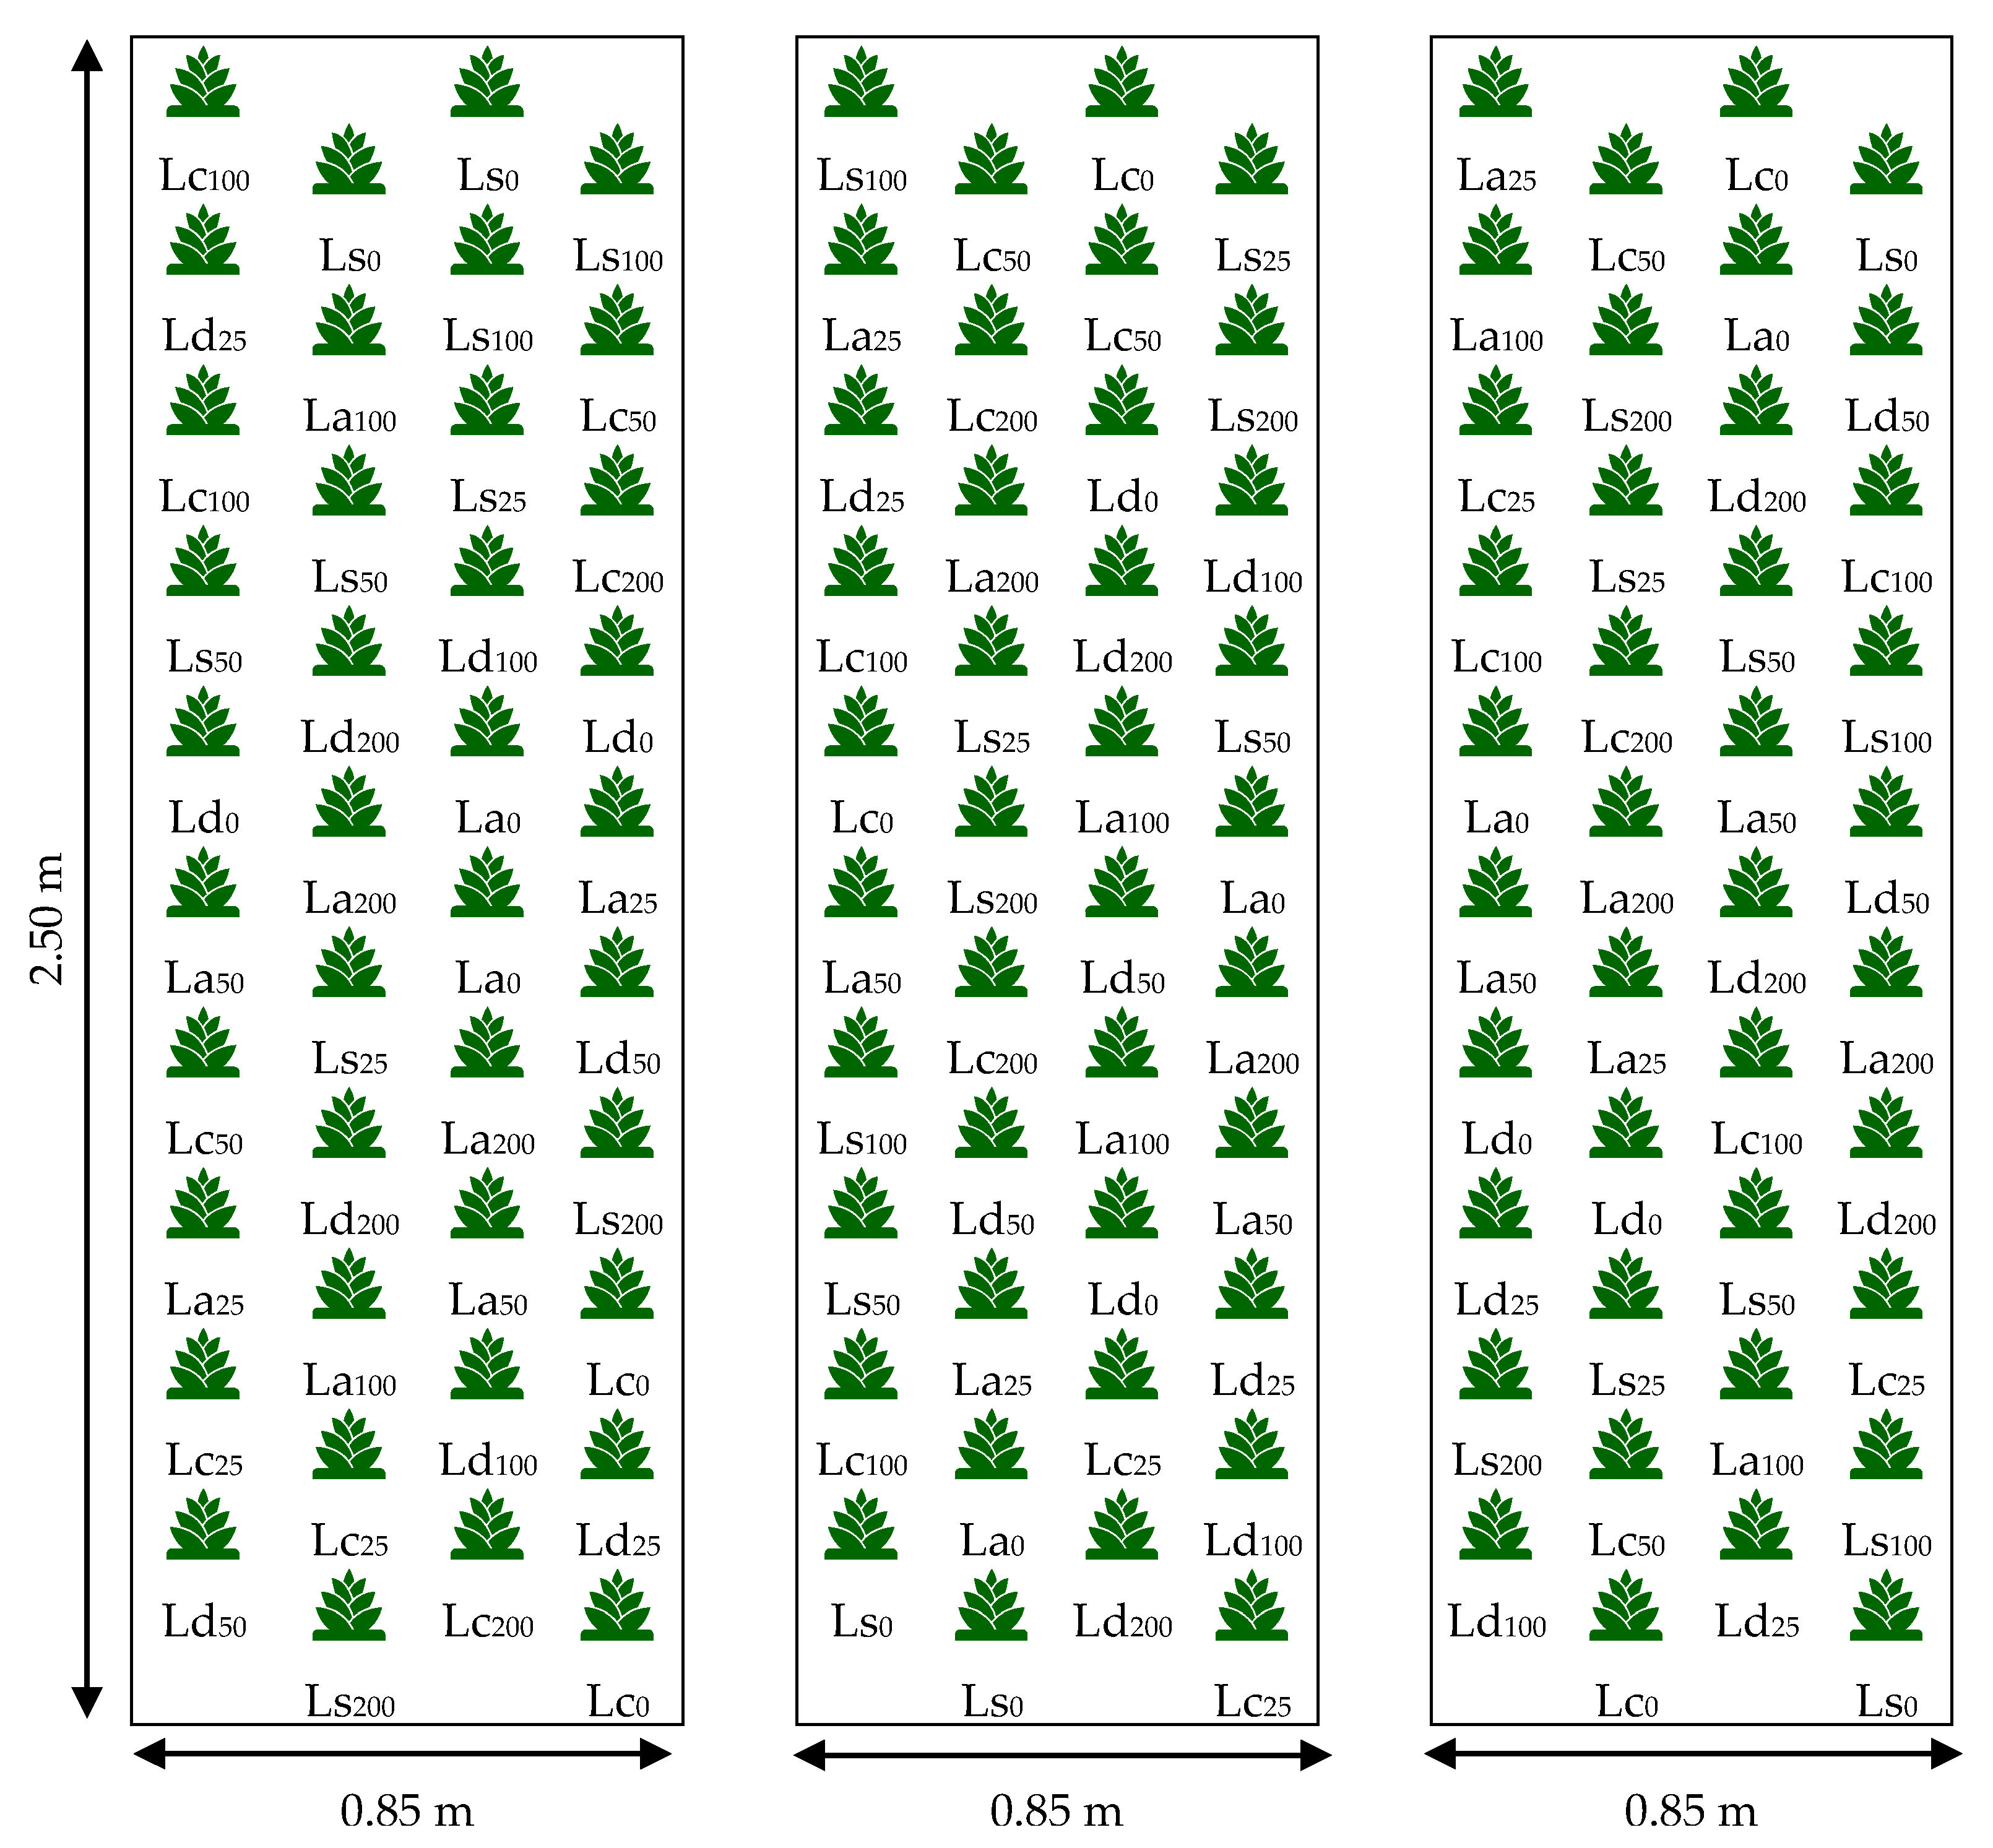
Plants were arranged in a randomized complete block that consisted of 4 lavender species, 5 NaCl solution irrigation treatments and 6 replicates (plants) arranged in 3 blocks (metal benches) i.e., 2 plants per species and NaCl solution irrigation treatment per metal bench. The number of plants totaled 120 and the experimental surface area occupied approximately 6.5 m2 (Figure 1).
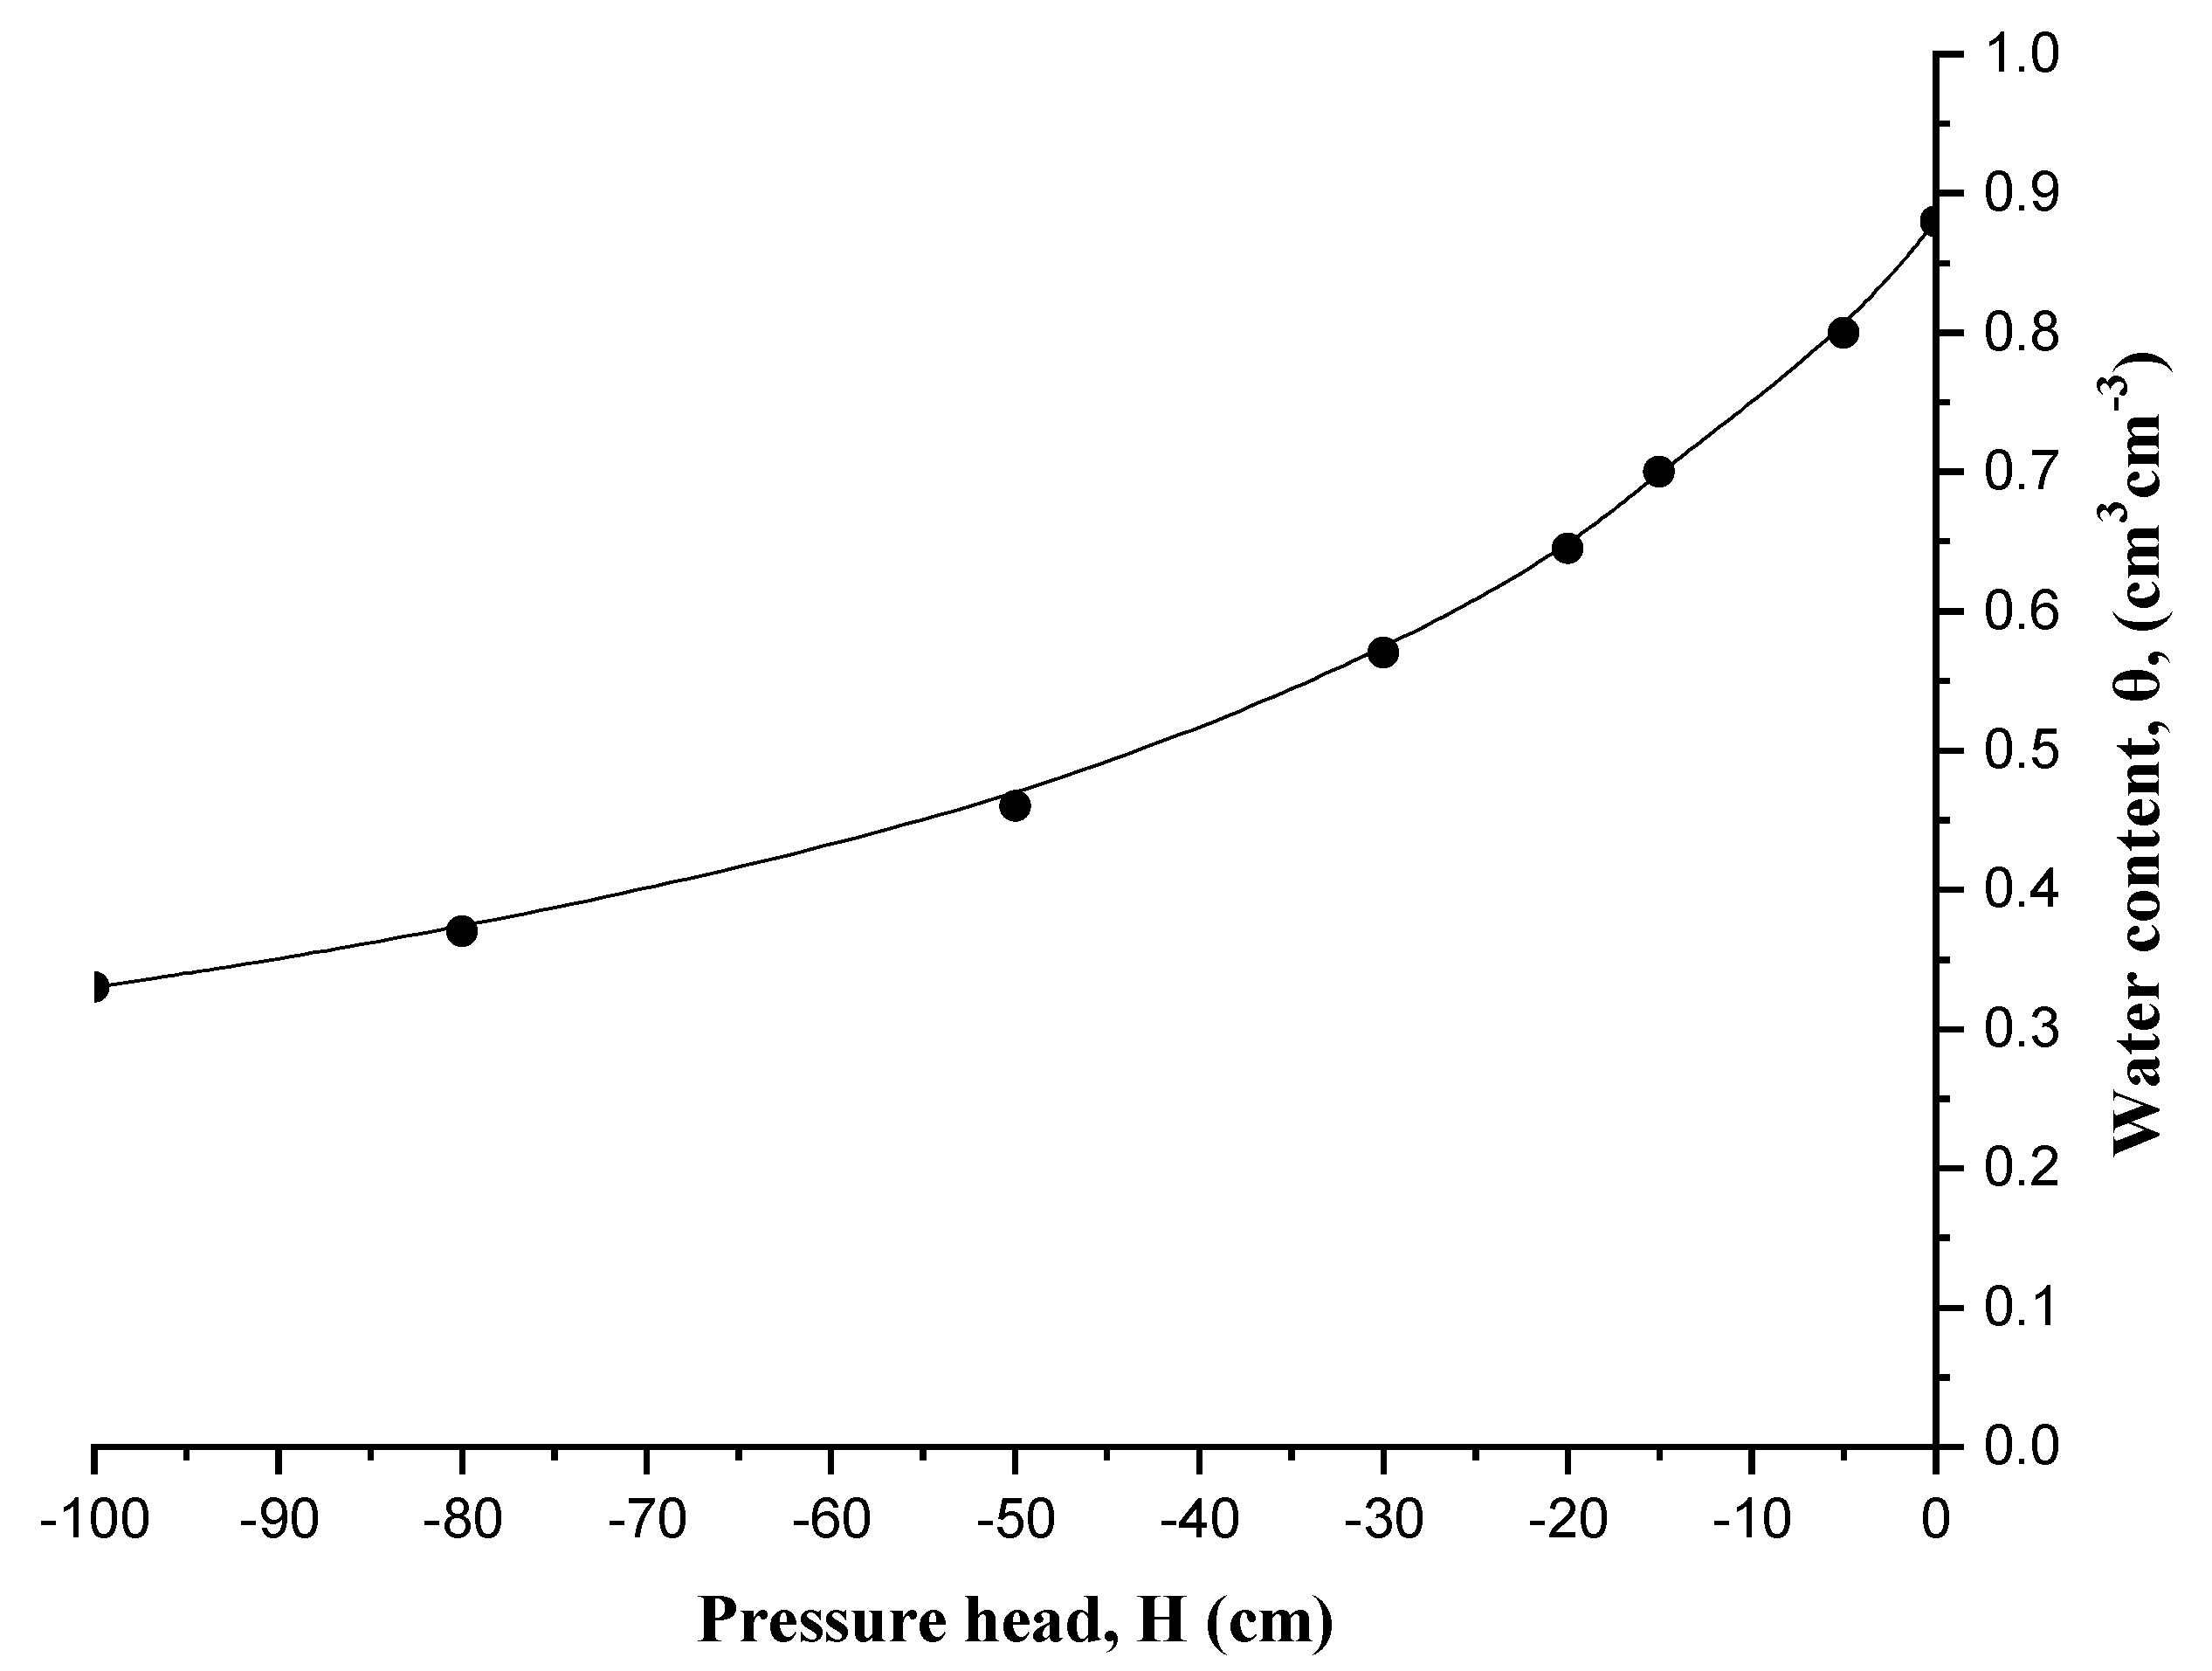
At the start of the experiment (day 1), all plants were irrigated with the corresponding NaCl solutions to saturation and weighed half an hour later to determine the water container capacity of the substrate. Substrate water content was monitored using a handheld TDR moisture sensor (HH2, Delta-T Devise, Cambridge, UK) set at the ‘organic soil’ setting, appropriate for use with peat-based substrates and calibrated to the used substrate. The probes were fully inserted into the substrate with the central rod positioned 5 cm away from the plant center. Irrigation was performed manually when the TDR sensor showed a water content value of approximately 0.46 cm3 cm−3, which was determined from the substrate water retention curve at corresponding a pressure head of −50 cm (Figure 2), and with an amount of water ensuring substrate water availability within the easily available water area (Table 1). This amount of irrigation water of plants was determined with the mean accumulated daily difference in weight of six potted plants from each NaCl treatment between two consecutive irrigations that corresponded to the amount of water lost from evapotranspiration.
2.3. Plant Growth Variables
Measurements started one week (day 7) after irrigation with the NaCl solutions for the first time and ended 56 days later. Plant height (determined from the pot rim of the substrate surface), shoot canopy diameter (mean value of the widest width and perpendicular width), and growth index ((height + widest width + perpendicular width)/3) were measured at weekly intervals. Additionally, during flowering, for each plant, the number and length of all inflorescences that were fully open >60% as well as the corresponding peduncle length, were recorded at weekly intervals. The maximum efficiency of PSII photochemistry (ΦPSIIo) of mature leaves (3 leaves per plant) was determined fortnightly (day 14, 35, 56) using a MINI-PAM Photosynthesis Yield Analyzer (Heinz Walz GmbH, Effeltrich, Germany). All measurements were performed in the morning after dark acclimation of the samples for 30 min using the saturation pulse technique. Saturation pulse (intensity circa 12,000 μmol quanta m−2 s−1) lasted 0.8 s.
At the end of the experiment (day 56) the leaf thickness of mature leaves was determined with cross sections taken at a distance of 3 cm from the leaf base (3 leaves per plant) under a Zeiss Axiolab microscope (Carl Zeiss, Jena, Germany) using the x100 lens. Plants were harvested at the end of the experiment (day 56) and divided at soil level into shoot and root. The substrate was carefully washed off the harvested root. Following both harvested shoots and roots were separately dried in an oven at 70 °C until a constant weight was reached, and their dry weights were determined. Weekly recordings of observations for signs of salinity stress were undertaken, throughout the duration of the experiment. In plants, the onset of visual symptoms induced by salinity (leaf and stem chlorosis and necrosis) was recorded during the experiment and assessed at the end of the experiment (day 56). Visual symptoms induced by salinity were assessed on a 6 point scale from 0–5, where 0: plant mortality, 1: no leaf injury, 2: mild leaf chlorosis, 3: moderate leaf chlorosis 25–50% approximately, 4: leaf necrosis 50–75% approximately, 5: leaf necrosis >75%.
2.4. Physical-Hydraulic Properties of Substrate
A tension plate apparatus in a Haines-type assembly [25], with an air-entry value of −180 cm of a water column was employed to define the substrate water retention curve. Substrate sample sized 3 cm in height and 10.2 cm in diameter was positioned on the vibrating porous plate of a Buchner filter funnel to achieve satisfactory packing and following was subjected to gradual wetting from the bottom of the plate until saturation (for 48 h). Measurements of the water content at different pressure heads were taken to obtain the water retention curve. The retention curve was the mean of three substrate samples (n = 3).
Particle size distribution of the substrates was determined with screen analysis. Weighed substrate samples were placed in the top sieve of a column of sieves arranged from top to bottom in descending order of screen mesh size (>20.00, 16.00, 10.00, 8.00, 4.00, 2.00, 1.00, 0.50, 0.25, 0.106 and <0.053 mm) rested on a sieve shaker for 3 min at 30 shakes per minute.
2.5. Statistical Analysis
The experiment followed a randomized complete block design with two factors that constituted of four lavender species and five NaCl solution irrigation treatments. There were six replications (plants) per species and NaCl solution irrigation treatment. A two-way analysis of variance (ANOVA) was applied to test the significance of the experimental data using SPSS Statistical Software v. 17.0 (SPSS Inc., Chicago, U.S.A.), and treatment means were compared using Tukey HSD test at a probability level p < 0.05.
3. Results and Discussion
3.1. Physical–Hydraulic Properties of Substrate
Pressure heads of the experimental water retention curve of the substrate ranged between 0 and –100 cm providing important information concerning plant growth (Figure 2). In accordance to De Boodt and Verdonck [26], water retention in substrates with negative pressure heads greater than −100 cm decreases plant growth, while a negative pressure head that is less than −10 cm creates inadequate substrate aeration for plant growth. The main substrate hydraulic characteristics derived from the water retention curve are shown in Table 1.
With an aim to retain the substrate water content in the easily available water range, i.e., water content between 0.76 and 0.46 cm3 cm−3 (at −10 and −50 cm pressure head, respectively) (Table 1, Figure 2), when the TDR reading reached a volumetric water content of 46%, plants were irrigated with the corresponding NaCl treatments at amounts equal to the amount lost from evapotranspiration.
Particle size distribution affects the aeration and water retention properties of substrates [27,28]. Therefore, the above retention curve was defined in part by the substrate particle size distribution that was characterized by a relatively small percentage (≈11%) of particles >8 mm, a large percentage of particles (≈61%) in the range of 8-1 mm and a moderate percentage (≈28%) of particles < 1 mm (Table 2).
3.2. Symptoms Induced by Salinity
Indicator of the effect of salinity are the visible symptoms of the induced damage in plants (such as leaf chlorosis, browning and necrosis) that affects plant ornamental value [29]; an important consideration in floriculture [30]. Throughout the experiment, there was no plant mortality. At the high concentrations of 100 and 200 mM NaCl, all species demonstrated signs of salinity stress expressed initially with chlorosis of the leaves located at the middle and base of the plants followed by gradual necrosis of leaves and stems; at the end of the experiment (day 56), all lavender species irrigated with 200 mM NaCl had leaf necrosis >75% (Table 3). When irrigated with 100 mM NaCl, symptoms of leaf necrosis were more intense in both Lavandula angustifolia and L. stoechas than in both L. dentata var. dentata and L. dentata var. candicans. L. stoechas was the first species to demonstrate salinity stress (approximately 28 days since the start of the experiment), followed a week later by L. angustifolia and a further week later by both L. dentata var. candicans and L. dentata var. dentata (data not shown). On the other hand, all species irrigated with 50 mM NaCl demonstrated moderate signs of salinity stress at completion of the experiment expressed with chlorosis of the leaves (25%–50%) located at the middle and base of the plants; these symptoms reduce the commercial value of the plants. Furthermore, at 25 mM NaCl leaf chlorosis was inconspicuous in all species. Additionally, during the experiment it was noted that only the control of L. dentata var. dentata demonstrated mild signs of chlorosis suggesting nutrient deficiency; generally, L. dentata var. dentata developed greater growth (see Section 2.2) in comparison to the other species, therefore, is possible to have had a greater demand for nutrients.
Moderate symptoms of salinity at 50 mM suggest the need for further research to establish the effect of salinity in the range of 25–50 mM NaCl. The use of good quality water between saline water irrigations for strategic leaching of salts could contribute to reducing or delaying the effect of salinity [31]. To further reduce the use of good quality water natural resources for irrigation further research, studying the possibility of strategic leaching of salts with good quality water between saline water irrigations (>50 mM) is also suggested. Overall symptoms were more apparent in L. dentata var. dentata and L. stoechas due to the natural green color foliage of the particular species compared to the natural grey-green foliage of the other two species. Concerning L. angustifolia the above symptoms of plants irrigated with 100 and 200 mM NaCl (10.6 dSm−1 and 20.7 dSm−1, respectively) were obtained after 56 days of irrigation leading to plant death if the experiment was prolonged further and were similar to the results obtained by Niu and Rodriguez [32] for L. angustifolia pot grown plants in peat-perlite based substrate and under greenhouse conditions after 11 weeks of irrigation with NaCl solutions; plants irrigated with 0.8 dS m−1 showed good quality with acceptable reduction growth and little leaf injury, whereas plants irrigated with 3.2 dS m−1 showed stunted growth and moderate leaf injury (25%–50%), while plants irrigated with either 6.4 dS m−1 or 12.0 dS m−1 died.
3.3. Plant Growth
With the exception of measurements taken near completion of the experiment (42 and 49 days) in all four species, two-way ANOVA for data concerning the various plant growth variables measured throughout the duration of the experiment showed no significant interactions of the main experimental factors that are between species and irrigated NaCl solutions. In most measured plant variables (plant height, shoot canopy diameter, growth index, ΦPSIIo, inflorescence number) there was a significant effect of the main factors from the beginning of the experiment until day 42. Significant interactions were shown on day 49 and 56 for plant height, day 35 and 56 for ΦPSIIo and at the end of the experiment (day 56) for leaf thickness, inflorescence number and length, peduncle length and root dry weight.
Overall results confirm that salinity stress is initially expressed in the above ground growth parameter of plants [33]. More specifically, plant height was significantly reduced at 200 mM NaCl from day 21 onwards and until day 42 (Table 4). Overall L. angustifolia showed the smallest height while L. dentata var. dentata showed the greatest plant height (p < 0.05) between day 7 and 42. Both L. stoechas and L. dentata var. candicans showed similar development in plant height between them that was intermediate of the other two species (p < 0.05). Following, near completion of the experiment (days 49 and 56) L. angustifolia continued to show the least plant height compared to the other species. On both day 49 and day 56, plant height at 200 mM NaCl was significantly reduced compared to the control in L. stoechas and L. dentata var. candicans. Furthermore, on day 56, plant height at both 100 and 200 mM NaCl was significantly reduced compared to the control in L. dentata var. dentata. Our results agree with previous research findings that showed salinity induced the decrease in plant height of pot grown Arbutus unedo in peat, sand and clay-loam based substrate and irrigated for 16 weeks with 52 mM and 105 mM [34].
Similar results to plant height were obtained for shoot canopy diameter. Shoot canopy diameter was reduced significantly at both 100 and 200 mM NaCl compared to the control from day 49 of the experiment onwards (Table 5). Overall L. angustifolia showed the smallest shoot canopy diameter while L. dentata var. dentata the greatest one throughout the duration of the experiment (p < 0.05). L. dentata var. candicans showed a similar development in shoot canopy diameter with L. dentata var. dentata until day 35; afterwards, it showed a similar shoot canopy development with L. stoechas that was between that of the other two species (p < 0.05). Results were also consistent for the plant growth index. Plant growth index was reduced significantly at 200 mM NaCl compared to the control from day 35 of the experiment onwards (Table 6). Overall L. angustifolia showed the smallest growth index while L. dentata var. dentata the greatest one throughout the duration of the experiment (p < 0.05). L. dentata var. candicans showed a similar growth index with L. dentata var. dentata on day 7. Afterwards, it showed a similar growth index with L. stoechas that was between that of the other two species (p < 0.05). Similarly, in our results, the canopy and biomass of both Cistus albidus and C. monspeliensis grown in pots containing peat-pelite based substrate were reduced after 4 months irrigation with 70 and 140 mM NaCl [35]. Also, the canopy and biomass of potted Asteriscus maritimus in peat and sand based substrate were reduced after 150 days of irrigation with 70 and 140 mM NaCl [33].
A decrease in shoot dry weight is also an initial effect of reduced growth due to salinity [31]. Shoot dry weight was significantly reduced compared to the control at both 100 and 200 mM NaCl (Table 7). In a similar experiment, the total plant dry weight of L. multifida decreased when irrigated with 100 mM and 200 mM NaCl [20,24]. Both L. dentata var. dentata and L. dentata var. candicans developed similar shoot dry weights that were significantly greater than the other two species. Furthermore L. angustifolia developed the smallest shoot dry weight amongst the studied species (p < 0.05). It is possible that there is the presence of some interspecies variation, as the salinity shoot dry weight decrease of the corresponding control at 200 mM was the smallest for L. angustifolia (3%), followed in ascending order by L. dentata var. candicans (18%), L. dentata var. dentata (27%) and L. stoechas (32%). Although L. angustifolia (3%) showed the least decrease in shoot dry weight from the corresponding control, the appearance of the plant at the end of the experiment in comparison to the other species exhibited a large amount of leaf and stem necrosis at both 100 mM and 200 mM NaCl (see Section 2.1). The above results agree with the decrease in shoot dry weight due to irrigation with NaCl solutions in other pot grown ornamental species under greenhouse conditions such as Nerium oleander [36], Achillea millefolium, Agastache cana, Gaillardia aristata [37], and Rosmarinus officinalis [38]. On the other hand, although root dry weight in all species increased at low NaCl concentrations followed by a decrease at 100 and 200 mM NaCl, root dry weights compared to the control were not significantly different. As there were non-significant differences between the control and various NaCl solutions, it is possible that L. dentata var. candicans developed the greatest root dry weight, while the other species developed similar root dry weights (p < 0.05) due to interspecies variation.
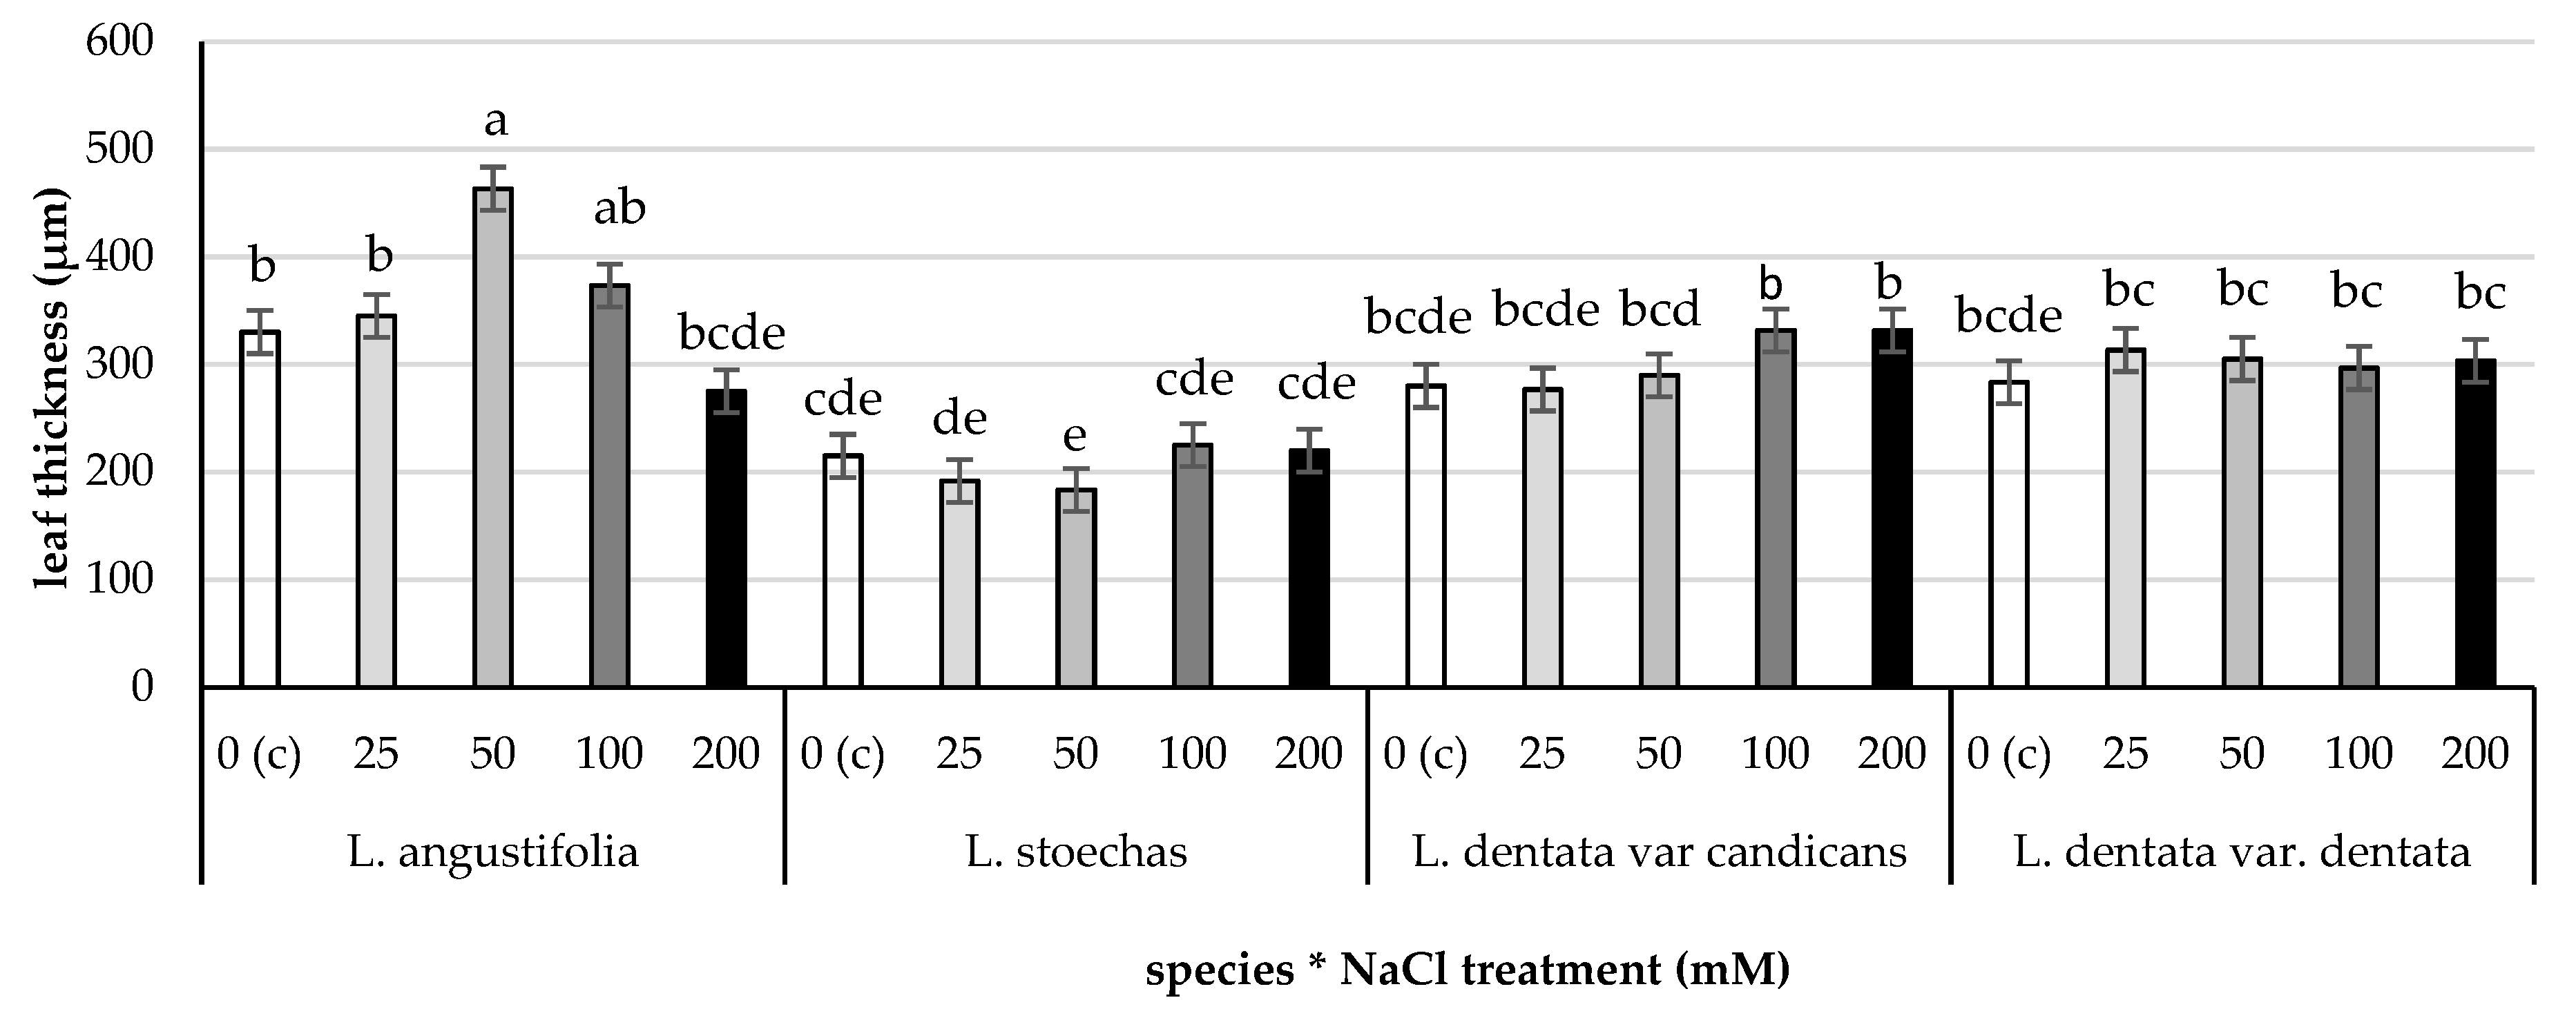
Leaf thickening is a common response to salinity [31,39], whereby salt content in the leaves is diluted by increased succulence [40]. Leaf thickness increased significantly compared to the control only in L. angustifolia at 50 mL NaCl (Figure 3); however, non-significant leaf thickness increase compared to the control was generally observed at concentrations >50 mM NaCl in the remaining lavender species. It is possible over the 56 days, NaCl levels, especially in the higher concentrations (100 and 200 mM NaCl), exceeded the threshold of long-term acclimation mechanisms related to leaf thickness. Further research with smaller NaCl levels is necessary to study the effect of salinity on leaf thickness.
A secondary effect of reduced growth induced by salinity includes the potential reduction in photosynthesis of plant leaves [16]. Concerning ΦPSIIo, L. dentata var. dentata showed the least ΦPSIIo compared to the other species (p < 0.05) on day 14 (Table 8), suggesting the presence of interspecies variation in plant nutrient demand, as there were non-significant differences between the control and the different NaCl solutions applied and the fact that L. dentata var. dentata ΦPSIIo values in the control (0.77) were relatively less than optimum (circa 0.83) [41]. With regards to the latter, L. dentata var. dentata also showed mild signs of chlorosis in the control, suggesting a greater demand for nutrients in comparison to the other species (see Section 2.1). Following this, ΦPSIIo significantly decreased in plants irrigated with 200 mM NaCl compared to the control on day 35 only in L. angustifolia, and on day 56 in both L. angustifolia and L. dentata var. candicans. The ΦPSIIo values for all species irrigated with 200 NaCl was lower than the optimum ΦPSIIo value for most plant species (circa 0.83), indicating the exposure of plants to stress, in this study salt stress [41]. Although no significant differences were shown, the remaining ΦPSIIo values of plants irrigated with either 100 mM or 200 mM were also less than the optimum ΦPSIIo in all species. The decrease in ΦPSIIo suggests the presence of salt stress that led to chlorosis and premature senescence of mature leaves [42]. These results agree with the symptoms or leaf chlorosis and necrosis observed on the plants irrigated with 100 and 200 mM NaCl and also with Munns’ [43] findings that high potassium concentrations cause premature senescence, chlorosis, and necrosis in leaves due to the disrupt of plant protein synthesis.
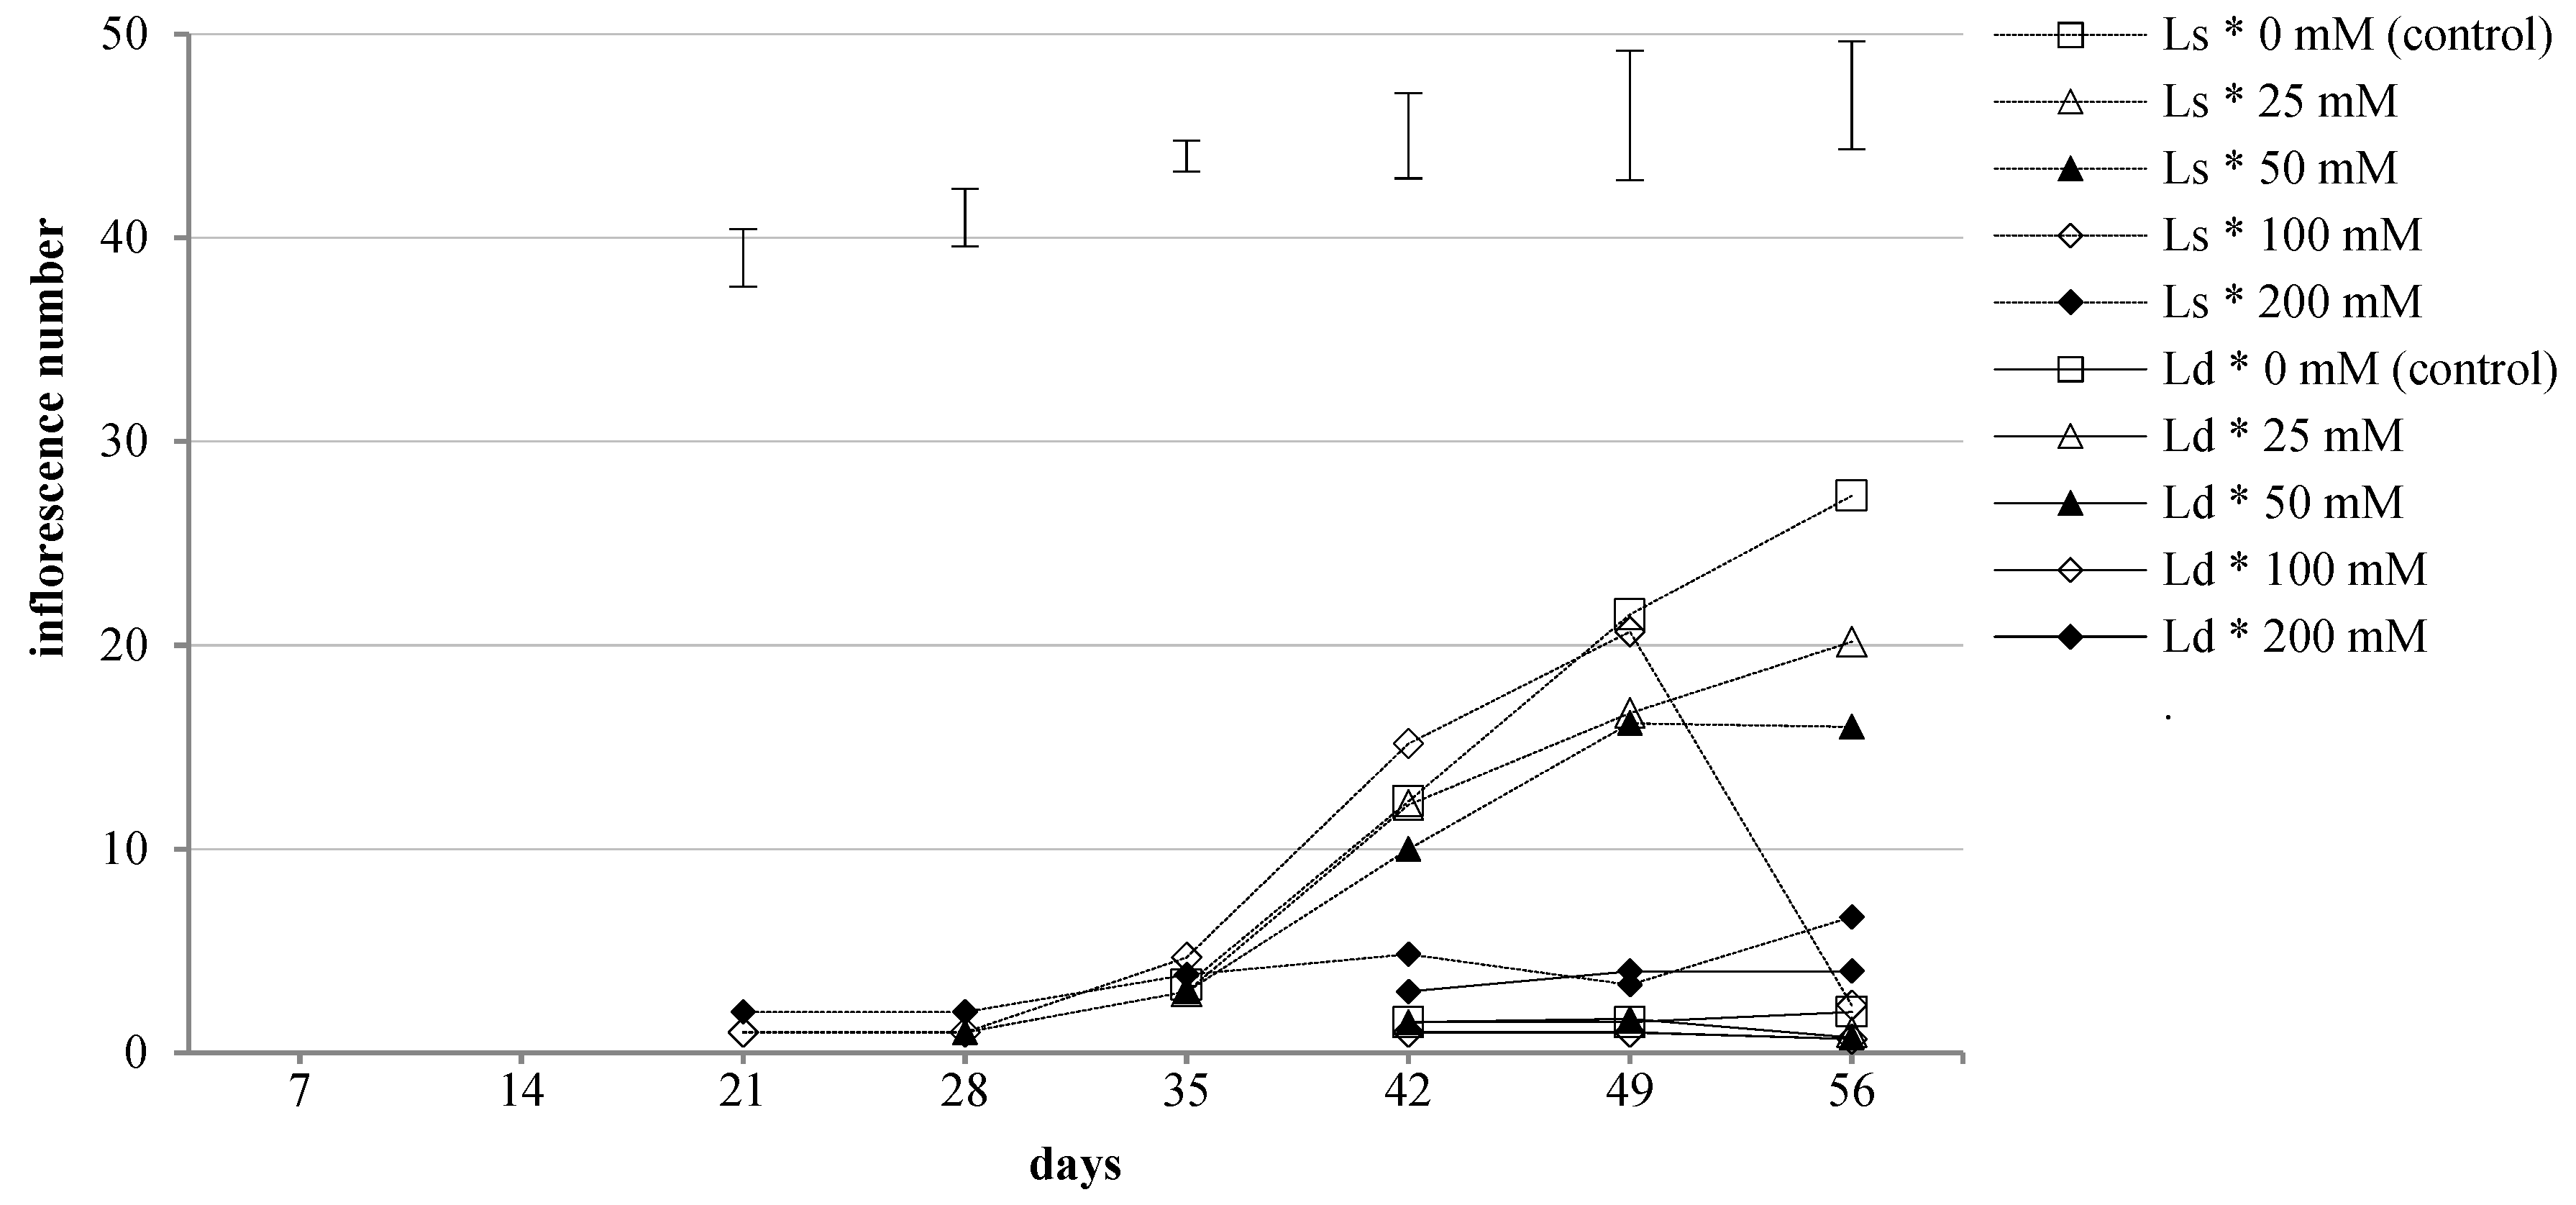
Plants subjected to salt stress could reduce the inflorescence number, influence flowering time (speed or delay) and duration, reduce inflorescence and reduce peduncle length. Throughout the duration of the experiment, only two lavender species flowered (L. stoechas and L. dentata var. dentata). The experiment took place in late winter–early spring (Feb-March) and as the control of both non-flowered lavenders (L. angustifolia and Lavandula dentata var. candicans) did not produce inflorescences, it is possible that the season in which the experiment took place was too early for these species to flower. It is reported that L. dentata var. dentata flower all year round in mild-winter areas such as Athens [44] and L. stoechas flowers in early spring [45], whereas L. dentata var. candicans from early spring to late fall and L. angustifolia flowers from early to midsummer [44]. Anthesis in both L. stoechas and L. dentata var. dentata started earlier at 100 and 200 mM NaCl compared to the control (Figure 4). At the end of the experiment (day 56), the inflorescence number for the two lavender species that flowered was reduced significantly at 100 and 200 mM in comparison to the control only for L. stoechas, suggesting a tendency for earlier inflorescence death under salt stress. Similarly, the inflorescence length was reduced significantly at 100 and 200 mM only for L. stoechas. On the other hand, the inflorescence peduncle was reduced significantly compared to the control in all NaCl concentrations for both flowered L. stoechas and L. dentata var. dentata. The above results agree with the findings of several authors that have studied the effect of salinity on various ornamental plant species. García-Caparrós and Lao [46] state that salinity could bring forward and shorten the duration of anthesis. Salinity has been reported to decrease the inflorescence number in gerbera [47,48], different cultivars of Rosa x hybrida L. [48,49], Matricaria chamomilla [50], inflorescence length in Eustoma grandiflorum [18] as well as the peduncle length / stem length (measured from the basis of the plant to the first flower) in Dianthus caryophyllus, Gerbera jamesonii L [47], Eustoma grandiflorum [18], Rosa hybrida ‘Kardinal’ [51], and Matricaria chamomilla [50]. Results also showed that Lavandula stoechas developed significantly more inflorescences than L. dentata var. dentata on both day 42 and 49, which is possibly due to interspecies differences, as there were no differences between the control and applied NaCl solutions.
Considering all of the above, the overall performance of the studied lavender species under the effect of salinity was satisfactory at levels <25 mM NaCl in all species. Further research is necessary to establish the effect of salinity between 25–50 mM NaCl or possibly >50 mM in combination with the interchanged use of irrigation with good quality water with the aim to contribute towards the conservation of good quality water natural resources. The adverse effects induced by high levels of NaCl (>100 mM) amongst lavender species in ascending order was Lavandula dentata var. dentata, L. dentata var. candicans, L. stoechas and L. angustifolia. Therefore, in areas with saline irrigation water, the use of the better performed in the current study under saline irrigation conditions Lavandula dentata var. dentata and L. dentata var. candicans is proposed.
4. Conclusions
The study of the effect of saline irrigation in floriculture is important to consider for producing nursery crops without signs of salinity injury. Amongst other factors, the level of salinity stress induced on plants is dependent on plant species and varieties. The effect of salinity through irrigation on the growth of four lavender species was determined. The applied irrigation method allowed plants to receive the adequate amount of water for plant growth (easily available water), ensuring the effect of irrigation was induced by water quality i.e., applied NaCl solutions.
The effect of salinity was initially expressed in most of the above ground growth variables of the plants studied. Generally, growth was satisfactory in all species irrigated with <25 mM NaCl. Symptoms of salinity injury were moderate at 50 mM NaCl, affecting the commercial value of the ornamental species. At high NaCl levels (100 and 200 mM), plants showed severe symptoms of salt stress that included leaf and stem necrosis. Only two lavender species flowered, possibly due to season variation between species. Anthesis time was quicker and anthesis duration was reduced for plants irrigated with high saline concentrations.
Overall results of the effect of salinity were consistent, allowing to rank species in descending order of plant development as follows: Lavandula dentata var. dentata, L. dentata var. candicans, L. stoechas and L. angustifolia. Throughout the duration of the experiment, both Lavandula dentata var. dentata and L. dentata var. candicans showed better growth, and hence are suggested for areas with poor water quality using saline water for irrigation.
Author Contributions
Conceptualization, A.T.P.; methodology, A.T.P., P.A.L. and G.L.; formal analysis, A.T.P. A.K.K. and K.B.; investigation, A.K.K. and A.T.P.; writing—original draft preparation, A.T.P.; writing—review and editing, A.T.P., P.A.L., G.L. and K.B.; supervision, A.T.P., P.A.L. and G.L.; project administration, A.T.P. A.K.K. and K.B. All authors have read and agreed to the published version of the manuscript.
Funding
This research received no external funding.
Acknowledgments
We would like to thank Kalantzis Plants for the free supply of lavender plants.
Conflicts of Interest
The authors declare no conflict of interest.
References
- Daniele, L.; Vallejos, A.; Sola, F.; Corbella, M.; Pullido-Bosch, A. Hydrogeochemical processes in the vicinity of a desalination plant (Cabo de Gata, SE Spain). Desalination 2011, 277, 338–347. [Google Scholar] [CrossRef]
- Alfarrah, N.; Walraevens, K. Groundwater Overexploitation and Seawater Intrusion in Coastal Areas of Arid and Semi-Arid Regions. Water 2018, 10, 143. [Google Scholar] [CrossRef] [Green Version]
- Liakou, E. Θεσμικό πλαίσιο για την επαναχρησιμοποίηση επεξεργασμένων υγρών αστικών αποβλήτων (Legislative Framework For the Reuse of Treated Urban Waste Water); Hμερίδα, Eπαναχρησιμοποίηση αστικών λυμάτων για άρδευση, Θεσμικό πλαίσιο, εφαρμογές και προοπτικές για την Eλλάδα. Δ.E.Υ.A.X. και Πολυτεχνείο Κρήτης: Xανιά, Eλλάδα, 2013. [Google Scholar]
- Cai, X.; Sun, Y.; Starman, T.; Hall, C. Response of 18 Earth-Kind Rose Cultivars to Salt Stress. HortScience 2014, 49, 544–549. [Google Scholar] [CrossRef] [Green Version]
- Pessarakli, M.; Szabolcs, I. Soil salinity and sodicity as particular plant/crop stress factors. In Handbook of Plant and Crop Stress, 3rd ed.; Pessarakli, M., Ed.; CRC Press Taylor and Francis Group: Boca Raton, FL, USA, 2011; pp. 3–21. [Google Scholar]
- Karabourniotis, G.; Liakopoulos, G.; Nikolopoulos, D. Φυσιολογία Καταπονήσεων των Φυτών: Οι λειτουργίες των φυτών κάτω από αντίξοες συνθήκες του περιβάλλοντος (Plant Stress Physiology: Plant Functioning under Environmental Stress); Εκδόσεις Έμβρυο: Egaleo, Greece, 2012. [Google Scholar]
- Lambers, H. Dryland salinity: A key environmental issue in southern Australia. Plant Soil 2003, 257. [Google Scholar] [CrossRef]
- Batool, N.; Shahzad, A.; Ilyas, N. Plants and Salt stress. Int. J. Agric. Crop. Sci. 2014, 7, 1439–1446. [Google Scholar]
- Parida, A.K.; Das, A.B. Salt tolerance and salinity effects on plants: A review. Ecotox. Environ. Saf. 2005, 60, 324–349. [Google Scholar] [CrossRef] [PubMed]
- James, R.A.; Rivelli, A.R.; Munns, R.; von Caemmerer, S. Factors affecting CO2 assimilation, leaf injury and growth in salt-stressed durum wheat. Fun. Plant Biol. 2002, 29, 1393–1403. [Google Scholar] [CrossRef]
- Munns, R. Genes and salt tolerance: Bringing them together. New Phytol. 2005, 167, 645–663. [Google Scholar] [CrossRef]
- Bernstein, L. Effects of salinity and sodicity on plant growth. Ann. Rev. Phytopathol. 1975, 13, 295–312. [Google Scholar] [CrossRef]
- Nikaya, A.; Masui, M.; Ishida, A. Salt tolerance of muskmelons in sand nutrient solution cultures. J. Jpn. Soc. Hort. Sci. 1983, 49, 93–101. [Google Scholar] [CrossRef] [Green Version]
- Carillo, P.; Annunziata, M.G.; Pontecorvo, G.; Fuggi, A.; Woodrow, P. Salinity Stress and Salt Tolerance. In Abiotic Stress in Plants–Mechanisms and Adaptations; Shanker, A., Ed.; Tech: Rijeka, Croatia, 2011; pp. 21–38. [Google Scholar]
- Demiral, M.A. Effect of salt stress on concentration of nitrogen and phosphorus in root and leaf of strawberry plant. Eurasian J. Soil Sci. 2017, 6, 357–364. [Google Scholar] [CrossRef] [Green Version]
- Greenway, H.; Munns, R. Mechanisms of salt tolerance in nonhalophytes. Ann. Rev. Plant Physiol. 1980, 31, 149–190. [Google Scholar] [CrossRef]
- Grieve, C.M. Review: Irrigation of floricultural and nursery crops with saline wastewaters. Isr. J. Plant Sci. 2011, 59, 187–196. [Google Scholar] [CrossRef]
- Shillo, R.; Ding, M.; Pasternak, D.; Zaccai, M. Cultivation of cut flower and bulb species with saline water. Sci. Hortic. 2002, 92, 41–54. [Google Scholar] [CrossRef]
- Fornes, F.; Belda, R.M.; Carrión, C.; Noguera, V.; García-Agustín, P.; Abad, M. Pre-conditioning ornamental plants to drought by means of saline water irrigation as related to salinity tolerance. Sci. Hortic. 2007, 113, 52–59. [Google Scholar] [CrossRef]
- Plaza, B.M.; Jiménez-Becker, S.; García-Caparrós, P.; del M. Verdejo, M. Influence of Salinity on Vegetative Growth of Six Native Mediterranean Species. Acta Hortic. 2015, 1099, 755–760. [Google Scholar] [CrossRef]
- The Plant List (2013). Version 1.1. Available online: http://www.theplantlist.org/1.1/browse/A/Lamiaceae/Lavandula/ (accessed on 6 January 2020).
- Schaminée, J.H.J.; Chytrý, M.; Hennekens, S.M.; Janssen, J.A.M.; Jiménez-Alfaro, B.; Knollová, I.; Marceno, C.; Mucina, L.; Rodwell, J.S.; Tichý, L. Review of Grassland Habitats and Development of Distribution Maps of Heathland, Scrub and Tundra Habitats of EUNIS Habitats Classification; Report EEA/NSV/15/005; Stichting Dienst Landbouwkundig Onderzoek–Alterra (ALT): Wageningen, The Netherlands, 2016. [Google Scholar]
- Polunin, O. Flowers of Greece and the Balkans, a Field Guide; Oxford University Press: New York, NY, USA, 1997. [Google Scholar]
- García-Caparrós, P.; Llanderal, A.; Pestana, M.; Correia, P.J.; Lao, M.T. Lavandula multifida response to salinity: Growth, nutrient uptake, and physiological changes. J. Plant Nutr. Soil Sci. 2016, 1–9. [Google Scholar] [CrossRef]
- Haines, W.B. Studies in the physical properties of soils. V. The hysteresis effect in capillary properties and the modes of moisture distribution associated therewith. J. Agric. Sci. 1930, 20, 97–116. [Google Scholar] [CrossRef]
- De Boodt, M.; Verdonck, O. The physical properties of the substrates in horticulture. Acta Hortic. 1972, 26, 37–44. [Google Scholar] [CrossRef]
- Raviv, M.; Lieth, J.H. Soilless Culture Theory and Practice; Elsevier BV: London, UK, 2008; p. 587. [Google Scholar]
- Naaz, R.; Bussières, P. Particle Sizes Related to Physical Properties of Peat-Based Substrates. Acta Hortic. 2011, 893, 971–978. [Google Scholar] [CrossRef]
- Caser, M.; Scariot, V.; Gaino, W.; Larcher, F.; Devecchi, M. The Effects of Sodium Chloride on the Aesthetic Value of Buxus spp. Eur. J. Hort. Sci. 2013, 78, 153–159. [Google Scholar]
- Cassaniti, C.; Leonardi, C.; Flowers, T.J. The effect of sodium chloride on ornamental shrubs. Sci. Hortic. 2009, 122, 586–593. [Google Scholar] [CrossRef]
- Cassaniti, C.; Romano, D.; Flowers, T.J. The Response of Ornamental Plants to Saline Irrigation Water. In Irrigation-Water Management, Pollution and Alternative Strategies; Garcia-Garizabal, I., Ed.; Tech: London, UK, 2012; pp. 131–158. [Google Scholar]
- Niu, G.; Rodriguez, D.S. Relative salt tolerance of selected herbaceous perennials and groundcovers. Sci. Hortic. 2006, 110, 352–358. [Google Scholar] [CrossRef]
- Rodríguez, P.; Torrecillas, A.; Morales, M.A.; Ortuño, M.F.; Sánchez-Blanco, M.J. Effects of NaCl salinity and water stress on growth and leaf water relations of Asteriscus maritimus plants. Environ. Exp. Bot. 2005, 53, 113–123. [Google Scholar] [CrossRef]
- Navarro, A.; Bañon, S.; Olmos, E.; Sánchez-Blanco, M.J. Effect of sodium chloride on water potential components, hydraulic conductivity, gas exchange and leaf ultrastructure of Arbutus unedo plants. Plant Sci. 2007, 172, 473–480. [Google Scholar] [CrossRef]
- Torrecillas, A.; Rodríguez, P.; Sánchez-Blanco, M.J. Comparison of growth, leaf water relations and gas exchange of Cistus albidus and C. monspeliensis plants irrigated with water of different NaCl salinity levels. Sci. Hortic. 2003, 97, 353–368. [Google Scholar] [CrossRef]
- Bañón, S.; Fernández, J.A.; Ochoa, J.; Sánchez-Blanco, M.J. Paclobutrazol as an aid to reduce some effects of salt stress in oleander seedlings. Eur. J. Hort. Sci. 2005, 70, 43–49. [Google Scholar]
- Niu, G.; Rodriguez, D.S. Relative salt tolerance of five herbaceous perennials. Hortscience 2006, 41, 1493–1497. [Google Scholar] [CrossRef] [Green Version]
- Alarcón, J.J.; Morales, M.A.; Ferrández, T.; Sánchez-Blanco, M.J. Effects of water and salt stress on growth, water relations and gas exchange in Rosmarinus officinalis. J. Hortic. Sci. Biotech. 2006, 81, 845–853. [Google Scholar] [CrossRef]
- Imbrahim, K.M.; Collins, J.C.; Collin, H.A. Effects of salinity on growth and ionic composition of Coleus blumei and Salvia splendens. J. Hortic. Sci. 2015, 66, 215–222. [Google Scholar] [CrossRef]
- Luttge, U.; Smith, J.A.C. Structural, biophysical and biochemical aspects of the role of leaves in plant adaption to salinity and water stress. In Salinity Tolerance in Plant. Strategies for Crop Improvement; Staples, R.C., Toenniessen, G.H., Eds.; Wiley International: New York, NY, USA, 1984; pp. 125–150. [Google Scholar]
- Maxwell, K.; Johnson, G.N. Chlorophyll fluorescence, a practical guide. J. Exp. Bot. 2000, 51, 659–668. [Google Scholar] [CrossRef] [PubMed]
- Sultana, N.; Ikeda, T.; Itoh, R. Effect of NaCl salinity photosynthesis and dry matter accumulation in developing rice grains. Environ. Exp. Bot. 1999, 42, 211–220. [Google Scholar] [CrossRef]
- Munns, R. Comparative physiology of salt and water stress. Plant Cell Environ. 2002, 25, 239–250. [Google Scholar] [CrossRef] [PubMed]
- Brenzel, K.N. Sunset Western Garden Book; Sunset Publishing Corporation: Oakland, CA, USA, 2007; p. 768. [Google Scholar]
- Sfikas, G. Αγριολούλουδα της Κρήτης (Wildflowers of Crete); Eυσταθιάδης και Υιοί A.E.: Aθήνα, Eλλάδα, 1987; p. 310. [Google Scholar]
- García-Caparrós, P.; Lao, M.T. The effects of salt stress on ornamental plants and integrative cultivation practices. Sci. Hortic. 2018, 240, 430–439. [Google Scholar] [CrossRef]
- Baas, R.; Nijssen, H.M.C.; van den Berg, T.J.M.; Warmenhoven, M.G. Yield and quality of carnation (Dianthus caryophyllus L.) and gerbera (Gerbera jamesonii L.) in a closed nutrient system as affected by sodium chloride. Sci. Hortic. 1995, 61, 273–284. [Google Scholar] [CrossRef]
- Sonneveld, C.; Baas, R.; Nijssen, H.M.C.; de Hoog, J. Salt Tolerance of Flower Crops Grown in Soilless Culture. J. Plant Nutr. 1999, 22, 1033–1048. [Google Scholar] [CrossRef]
- Cai, X.; Niu, G.; Starman, T.; Hall, C. Response of six garden roses (Rosa x hybrida L.) to salt stress. Sci. Hortic. 2014, 168, 27–32. [Google Scholar] [CrossRef]
- Rajzmoo, K.; Heydarizadeh, P.; Sabzalian, M.R. Effect of Salinity and Drought Stresses on Growth Parameters and Essential Oil Content of Matricaria chamomila. Int. J. Agric. Biol. 2008, 10, 451–454. [Google Scholar]
- Wahome, P.K.; Jesch, H.H.; Grittner, I. Effect of NaCl on the vegetative growth and flower quality of roses. J. Appl. Bot. 2000, 74, 38–41. [Google Scholar]
Figure 1.
The layout of the experiment studying the effect of different NaCl solution irrigation treatments on the growth of 4 lavender species. Plants were arranged in a randomized complete block that consisted of 4 lavender species, 5 NaCl solution irrigation treatments (0, 25, 50, 100, 200 mM NaCl) and 6 replicates (plants) arranged in 3 blocks (metal benches; dimensions 2.50 cm length and 0.85 m width). La: Lavandula angustifolia, Ld: Lavandula dentata var. dentata, Lc: Lavandula dentata var. candicans, Ls: Lavandula stoechas, and subscripts denote applied NaCl solution irrigation treatments.

Figure 2.
Water retention curve of the potted lavender plants’ growth substrate Ps96:P4 (Ps: pure sphagnum peat and P: perlite in a 96:4 volume ratio).
Figure 2.
Water retention curve of the potted lavender plants’ growth substrate Ps96:P4 (Ps: pure sphagnum peat and P: perlite in a 96:4 volume ratio).

Figure 3.
The combined effect of the interaction between lavender species and NaCl solution irrigation treatments (0, 25, 50, 100, 200 mM) on leaf thickness of plants (n = 6, p < 0.05). Differences between means ± S.E. shown with different letters (Tukey HSD, p < 0.05). Note c: control.
Figure 3.
The combined effect of the interaction between lavender species and NaCl solution irrigation treatments (0, 25, 50, 100, 200 mM) on leaf thickness of plants (n = 6, p < 0.05). Differences between means ± S.E. shown with different letters (Tukey HSD, p < 0.05). Note c: control.

Figure 4.
The combined effect of the interaction between lavender species and NaCl solution irrigation treatments (0, 25, 50, 100, 200 mM) on plant inflorescence number (n = 6, p < 0.05). Note: Ls: L. stoechas, Ld: L. dentata var. dentata. Bars represent S.E.
Figure 4.
The combined effect of the interaction between lavender species and NaCl solution irrigation treatments (0, 25, 50, 100, 200 mM) on plant inflorescence number (n = 6, p < 0.05). Note: Ls: L. stoechas, Ld: L. dentata var. dentata. Bars represent S.E.


Table 1.
Hydraulic characteristics of the potted lavender plants’ growth substrate Ps96:P4 (Ps: pure sphagnum peat and P: perlite in a 96:4 volume ratio).
Table 1.
Hydraulic characteristics of the potted lavender plants’ growth substrate Ps96:P4 (Ps: pure sphagnum peat and P: perlite in a 96:4 volume ratio).
| Total Porosity 1 (cm3 cm−3) | Airspace 2 (cm3 cm−3) | Water Content at −10 cm (cm3 cm−3) | Water Content at −50 cm (cm3 cm−3) | Easily Available Water 3 (cm3 cm−3) | Water Buffering Capacity 4 (cm3 cm−3) |
|---|---|---|---|---|---|
| 0.88 | 0.12 | 0.76 | 0.46 | 0.30 | 0.13 |
1 water content at 0 cm pressure head (saturation); 2 air filled pores at −10 cm pressure head; 3 released amount of water between pressure heads of −10 and −50 cm; 4 released amount of water between pressure heads of −50 and −100 cm.
Table 2.
Particle size distribution of the potted lavender plants’ growth substrate Ps96:P4 (Ps: pure sphagnum peat and P: perlite in a 96:4 volume ratio).
Table 2.
Particle size distribution of the potted lavender plants’ growth substrate Ps96:P4 (Ps: pure sphagnum peat and P: perlite in a 96:4 volume ratio).
| Particle Size (mm) | Particle Size Distribution (% by wt) |
|---|---|
| >20 | 1.24 |
| 20–16 | 1.18 |
| 16–10 | 2.09 |
| 10–8 | 6.70 |
| 8–4 | 18.19 |
| 4–2 | 20.79 |
| 2–1 | 21.85 |
| 1–0.5 | 11.22 |
| 0.5–0.25 | 7.18 |
| 0.25–0.106 | 3.94 |
| 0.106–0.053 | 2.72 |
| <0.053 | 2.90 |
Table 3.
Assessment of visual symptoms of potted lavender plants induced by salinity based on a 6-point scale (0–5).
Table 3.
Assessment of visual symptoms of potted lavender plants induced by salinity based on a 6-point scale (0–5).
| NaCl Solution | |||||
|---|---|---|---|---|---|
| Species | 0 mM (Control) | 25 mM | 50 mM | 100 mM | 200 mM |
| L. angustifolia | 1* | 2 | 3 | 5 | 5 |
| L. stoechas | 1 | 2 | 3 | 5 | 5 |
| L. dentata var. candicans | 1 | 2 | 3 | 4.0 | 5 |
| L. dentata var. dentata | 1.5 | 2 | 3 | 4.5 | 5 |
where, 0: plant mortality, 1: no leaf injury, 2: mild leaf chlorosis <25%, 3: moderate leaf chlorosis 25%–50% approximately, 4: leaf necrosis 50%-75% approximately, 5: leaf necrosis >75%.
Table 4.
The effect of irrigation with different NaCl solutions on plant height (cm) of Lavandula species (n = 6, p < 0.05). Differences between means ± S.E. shown with different letters (Tukey HSD, p < 0.05).
Table 4.
The effect of irrigation with different NaCl solutions on plant height (cm) of Lavandula species (n = 6, p < 0.05). Differences between means ± S.E. shown with different letters (Tukey HSD, p < 0.05).
| Day | 7 | 14 | 21 | 28 | 35 | 42 | 49 | 56 | |
|---|---|---|---|---|---|---|---|---|---|
| Species | |||||||||
| L. angustifolia | 16.467 ± 0.456c | 18.047 ± 0.389c | 18.583 ± 0.408c | 19.063 ± 0.405c | 19.257 ± 0.390c | 19.267 ± 0.412c | -† | - | |
| L. stoechas | 25.700 ± 0.456b | 28.510 ± 0.389b | 29.023 ± 0.408b | 29.657 ± 0.405b | 30.463 ± 0.390b | 31.810 ± 0.412b | - | - | |
| L. dentata var candicans | 25.583 ± 0.456b | 27.410 ± 0.389b | 28.207 ± 0.408b | 28.900 ± 0.405b | 29.280 ± 0.390b | 29.623 ± 0.412b | - | - | |
| L. dentata var. dentata | 29.767 ± 0.456a | 33.327 ± 0.389a | 34.617 ± 0.408a | 36.237 ± 0.405a | 37.603 ± 0.390a | 38.840 ± 0.412a | - | - | |
| NaCl (mM) | |||||||||
| 0 mM (control) | ns | ns | 27.779 ± 0.456ab | 28.825 ± 0.453a | 29.983 ± 0.436a | 31.463 ± 0.461a | - | - | |
| 25 mM | ns | ns | 27.763 ± 0.456ab | 28.850 ± 0.453a | 29.450 ± 0.436a | 30.275 ± 0.461ab | - | - | |
| 50 mM | ns | ns | 28.525 ± 0.456a | 29.392 ± 0.453a | 30.271 ± 0.436a | 30.829 ± 0.461a | - | - | |
| 100 mM | ns | ns | 27.467 ± 0.456ab | 28.213 ± 0.453ab | 28.604 ± 0.436ab | 28.904 ± 0.461bc | - | - | |
| 200 mM | ns | ns | 26.504 ± 0.456b | 27.042 ± 0.453b | 27.446 ± 0.436b | 27.954 ± 0.461c | - | - | |
| Interaction (species x NaCl) | |||||||||
| L. angustifolia x | 0 mM (control) | ns | ns | ns | ns | ns | ns | 18.817 ± 0.936i | 18.817 ± 0.985j |
| 25 mM | ns | ns | ns | ns | ns | ns | 19.300 ± 0.936i | 19.300 ± 0.985j | |
| 50 mM | ns | ns | ns | ns | ns | ns | 19.683 ± 0.936i | 19.817 ± 0.985j | |
| 100 mM | ns | ns | ns | ns | ns | ns | 20.083 ± 0.936i | 20.083 ± 0.985j | |
| 200 mM | ns | ns | ns | ns | ns | ns | 18.367 ± 0.936i | 18.367 ± 0.985j | |
| L. stoechas x | 0 mM (control) | ns | ns | ns | ns | ns | ns | 35.950 ± 0.936bcde | 36.283 ± 0.985cdef |
| 25 mM | ns | ns | ns | ns | ns | ns | 32.483 ± 0.936cdefg | 32.950 ± 0.985defgh | |
| 50 mM | ns | ns | ns | ns | ns | ns | 33.500 ± 0.936cdef | 33.750 ± 0.985defg | |
| 100 mM | ns | ns | ns | ns | ns | ns | 31.400 ± 0.936efgh | 31.400 ± 0.985fghi | |
| 200 mM | ns | ns | ns | ns | ns | ns | 29.567 ± 0.936fgh | 29.567 ± 0.985ghi | |
| L. dentata var. candicans x | 0 mM (control) | ns | ns | ns | ns | ns | ns | 32.100 ± 0.936defg | 32.517 ± 0.985defgh |
| 25 mM | ns | ns | ns | ns | ns | ns | 30.600 ± 0.936fgh | 30.600 ± 0.985ghi | |
| 50 mM | ns | ns | ns | ns | ns | ns | 31.633 ± 0.936efgh | 31.633 ± 0.985efgh | |
| 100 mM | ns | ns | ns | ns | ns | ns | 27.950 ± 0.936gh | 27.950 ± 0.985hi | |
| 200 mM | ns | ns | ns | ns | ns | ns | 27.183 ± 0.936h | 26.467 ± 0.985i | |
| L. dentata var. dentata x | 0 mM (control) | ns | ns | ns | ns | ns | ns | 41.600 ± 0.936a | 42.183 ± 0.985a |
| 25 mM | ns | ns | ns | ns | ns | ns | 40.917 ± 0.936a | 41.500 ± 0.985ab | |
| 50 mM | ns | ns | ns | ns | ns | ns | 40.333 ± 0.936ab | 40.333 ± 0.985abc | |
| 100 mM | ns | ns | ns | ns | ns | ns | 36.833 ± 0.936abcd | 36.933 ± 0.985bcd | |
| 200 mM | ns | ns | ns | ns | ns | ns | 36.983 ± 0.936abc | 36.517 ± 0.985bcde | |
| Fspecies/sig. | 151.694/0.000* | 270.206/0.000* | 266.763/0.000* | 305.079/0.000* | 375.767/0.000* | 386.198/0.000* | 397.793/0.000 | 364.676/0.000 | |
| FΝaCl/sig. | 2.158/0.079 | 1.641/0.170 | 2.568/0.043* | 3.926/0.005* | 6.909/0.000* | 9.685/0.000* | 12.834/0.000 | 14.908/0.000 | |
| Finteraction/sig. | 0.981/0.472 | 1.135/0.341 | 0.740/0.709 | 0.695/0.753 | 1.272/0.247 | 1.374/0.191 | 1.856/0.049* | 1.961/0.036* | |
ns: non-significant; * denotes significant differences between means at p < 0.05, shown with different letters within columns. †When interactions are significant, factors are not considered and mean values are not shown.
Table 5.
The effect of irrigation with different NaCl solutions on shoot canopy diameter (cm) of Lavandula species (n = 6, p < 0.05). Differences between means ± S.E. shown with different letters (Tukey HSD, p < 0.05).
Table 5.
The effect of irrigation with different NaCl solutions on shoot canopy diameter (cm) of Lavandula species (n = 6, p < 0.05). Differences between means ± S.E. shown with different letters (Tukey HSD, p < 0.05).
| Day | 7 | 14 | 21 | 28 | 35 | 42 | 49 | 56 | |
|---|---|---|---|---|---|---|---|---|---|
| Species | |||||||||
| L. angustifolia | 15.940 ± 0.413c | 18.747 ± 0.441c | 19.473 ± 0.417c | 19.903 ± 0.418c | 20.037 ± 0.412c | 20.407 ± 0.415c | 20.510 ± 0.418c | 20.533 ± 0.419c | |
| L. stoechas | 21.890 ± 0.413b | 26.647 ± 0.441b | 27.600 ± 0.417b | 28.330 ± 0.418b | 29.173 ± 0.412b | 29.950 ± 0.415b | 30.417 ± 0.418b | 30.417 ± 0.419b | |
| L. dentata var. candicans | 27.233 ± 0.413a | 31.457 ± 0.441a | 32.873 ± 0.417a | 33.840 ± 0.418a | 34.097 ± 0.412a | 34.427 ± 0.415b | 34.473 ± 0.418b | 34.473 ± 0.419b | |
| L. dentata var. dentata | 26.350 ± 0.413a | 31.750 ± 0.441a | 32.603 ± 0.417a | 34.477 ± 0.418a | 35.203 ± 0.412a | 37.160 ± 0.415a | 37.797 ± 0.418a | 37.863 ± 0.419a | |
| NaCl (mM) | |||||||||
| 0 mM (control) | ns | ns | ns | ns | ns | ns | 32.021 ± 0.467a | 32.117 ± 0.469a | |
| 25 mM | ns | ns | ns | ns | ns | ns | 31.063 ± 0.467ab | 31.079 ± 0.469ab | |
| 50 mM | ns | ns | ns | ns | ns | ns | 31.125 ± 0.467ab | 31.125 ± 0.469ab | |
| 100 mM | ns | ns | ns | ns | ns | ns | 30.163 ± 0.467b | 30.163 ± 0.469b | |
| 200 mM | ns | ns | ns | ns | ns | ns | 29.625 ± 0.467b | 29.625 ± 0.469b | |
| Fspecies/sig. | 156.673/0.000* | 189.365/0.000* | 226.035/0.000* | 260.722/0.000* | 280.935/0.000* | 313.565/0.000* | 321.313/0.000* | 320.620/0.000* | |
| FΝaCl/sig. | 1.289/0.280 | 0.536/0.710 | 0.395/0.811 | 1.518/0.203 | 1.315/0.270 | 1.933/0.111 | 3.950/0.005* | 4.215/0.003* | |
| Finteraction/sig. | 1.302/0.229 | 0.243/0.995 | 0.382/0.967 | 1.305/0.228 | 0.556/0.872 | 0.528/0.892 | 0.635/0.808 | 0.656/0.789 |
ns: non-significant; * denotes significant differences between means at p < 0.05, shown with different letters within columns.
Table 6.
The effect of irrigation with different NaCl solutions on plant growth index of Lavandula species (n = 6, p < 0.05). Differences between means ± S.E. shown with different letters (Tukey HSD, p < 0.05).
Table 6.
The effect of irrigation with different NaCl solutions on plant growth index of Lavandula species (n = 6, p < 0.05). Differences between means ± S.E. shown with different letters (Tukey HSD, p < 0.05).
| Day | 7 | 14 | 21 | 28 | 35 | 42 | 49 | 56 | |
|---|---|---|---|---|---|---|---|---|---|
| Species | |||||||||
| L. angustifolia | 16.100 ± 0.335c | 18.493 ± 0.323c | 19.157 ± 0.318c | 19.617 ± 0.327c | 19.767 ± 0.309c | 20.010 ± 0.318c | 20.073 ± 0.329c | 20.097 ± 0.333c | |
| L. stoechas | 23.153 ± 0.335b | 27.250 ± 0.323b | 28.067 ± 0.318b | 28.760 ± 0.327b | 29.593 ± 0.309b | 30.553 ± 0.318b | 31.110 ± 0.329b | 31.187 ± 0.333b | |
| L. dentata var. candicans | 26.687 ± 0.335a | 30.087 ± 0.323b | 31.297 ± 0.318b | 32.173 ± 0.327b | 32.480 ± 0.309b | 32.807 ± 0.318b | 32.927 ± 0.329b | 32.910 ± 0.333b | |
| L. dentata var. dentata | 27.483 ± 0.335a | 32.263 ± 0.323a | 33.253 ± 0.318a | 34.720 ± 0.327a | 35.993 ± 0.309a | 37.710 ± 0.318a | 38.310 ± 0.329a | 38.407 ± 0.333a | |
| NaCl (mM) | |||||||||
| 0 mM (control) | ns | ns | ns | ns | 30.296 ± 0.345a | 31.300 ± 0.356a | 32.038 ± 0.367a | 32.213 ± 0.372a | |
| 25 mM | ns | ns | ns | ns | 29.617 ± 0.345ab | 30.492 ± 0.356ab | 30.967 ± 0.367ab | 31.071 ± 0.372ab | |
| 50 mM | ns | ns | ns | ns | 29.821 ± 0.345ab | 30.825 ± 0.356ab | 31.171 ± 0.367ab | 31.204 ± 0.372ab | |
| 100 mM | ns | ns | ns | ns | 28.996 ± 0.345ab | 29.717 ± 0.356bc | 29.775 ± 0.367bc | 29.783 ± 0.372bc | |
| 200 mM | ns | ns | ns | ns | 28.563 ± 0.345b | 29.017 ± 0.356c | 29.075 ± 0.367c | 28.979 ± 0.372c | |
| Fspecies/sig. | 239.689/0.000* | 351.413/0.000* | 384.017/0.000* | 406.690/0.000* | 224.500/0.000* | 550.696/0.000* | 542.787/0.000* | 532.256/0.000* | |
| FΝaCl/sig. | 0.464/0.762 | 0.138/0.968 | 0.948/0.440 | 2.267/0.067 | 3.933/0.049* | 6.514/0.000* | 10.242/0.000* | 11.675/0.000* | |
| Finteraction/sig. | 0.862/0.587 | 0.431/0.948 | 0.619/0.822 | 0.962/0.490 | 0.922/0.528 | 0.860/0.590 | 1.139/0.338 | 1.256/0.257 |
ns: non-significant; * denotes significant differences between means at p < 0.05, shown with different letters within columns.
Table 7.
The effect of irrigation with different NaCl solutions on shoot and root dry weights (g) of Lavandula species (n = 6, p < 0.05). Differences between means ± S.E. shown with different letters (Tukey HSD, p < 0.05).
Table 7.
The effect of irrigation with different NaCl solutions on shoot and root dry weights (g) of Lavandula species (n = 6, p < 0.05). Differences between means ± S.E. shown with different letters (Tukey HSD, p < 0.05).
| Shoot | Root | ||
|---|---|---|---|
| Species | |||
| L. angustifolia | 20.638 ± 0.950c | -† | |
| L. stoechas | 34.428 ± 0.950b | - | |
| L. dentata var. candicans | 47.178 ± 0.950a | - | |
| L. dentata var. dentata | 43.854 ± 0.650a | - | |
| NaCl (mM) | |||
| 0 mM (control) | 41.270 ± 1.062a | - | |
| 25 mM | 36.907 ± 1.062 b | - | |
| 50 mM | 37.534 ± 1.062ab | - | |
| 100 mM | 34.974 ± 1.062bc | - | |
| 200 mM | 31.937 ± 1.062c | - | |
| Interaction (species x NaCl) | |||
| L. angustifolia x | 0 mM (control) | ns | 5.917 ± 0.501cd |
| 25 mM | ns | 6.282 ± 0.501c | |
| 50 mM | ns | 4.865 ± 0.501cd | |
| 100 mM | ns | 4.985 ± 0.501cd | |
| 200 mM | ns | 5.123 ± 0.501cd | |
| L. stoechas x | control | ns | 5.593 ± 0.501cd |
| 25 mM | ns | 6.417 ± 0.501c | |
| 50 mM | ns | 4.752 ± 0.501cd | |
| 100 mM | ns | 5.575 ± 0.501cd | |
| 200 mM | ns | 3.488 ± 0.501d | |
| L. dentata var. candicans x | 0 mM (control) | ns | 13.887 ± 0.501ab |
| 25 mM | ns | 14.847 ± 0.501ab | |
| 50 mM | ns | 15.180 ± 0.501a | |
| 100 mM | ns | 15.422 ± 0.501a | |
| 200 mM | ns | 12.277 ± 0.501b | |
| L. dentata var. dentata x | 0 mM (control) | ns | 5.315 ± 0.501cd |
| 25 mM | ns | 4.800 ± 0.501cd | |
| 50 mM | ns | 5.533 ± 0.501cd | |
| 100 mM | ns | 4.667 ± 0.501cd | |
| 200 mM | ns | 4.703 ± 0.501cd | |
| Fspecies/sig. | 156.577/0.000* | 415.648/0.000 | |
| FΝaCl/sig. | 10.444/0.000* | 6.470/0.000 | |
| Finteraction/sig. | 1.312/0.223 | 2.396/0.009* |
ns: non-significant; * denotes significant differences between means at p < 0.05, shown with different letters within columns. †When interactions are significant, factors are not considered, and mean values are not shown.
Table 8.
The effect of irrigation with different NaCl solutions on leaf ΦPSIIo of Lavandula species (n = 6, p < 0.05). Differences between means ± S.E. shown with different letters (Tukey HSD, p < 0.05).
Table 8.
The effect of irrigation with different NaCl solutions on leaf ΦPSIIo of Lavandula species (n = 6, p < 0.05). Differences between means ± S.E. shown with different letters (Tukey HSD, p < 0.05).
| Day | 14 | 35 | 56 | |
|---|---|---|---|---|
| Species | ||||
| L. angustifolia | 0.821 ± 0.007a | -† | - | |
| L. stoechas | 0.807 ± 0.007a | - | - | |
| L. dentata var. candicans | 0.810 ± 0.007a | - | - | |
| L. dentata var. dentata | 0.755 ± 0.007b | - | - | |
| NaCl (mM) | ||||
| 0 mM (control) | ns | - | - | |
| 25 mM | ns | - | - | |
| 50 mM | ns | - | - | |
| 100 mM | ns | - | - | |
| 200 mM | ns | - | - | |
| Interaction (species x NaCl) | ||||
| L. angustifolia x | 0 mM (control) | ns | 0.788 ± 0.056a | 0.821 ± 0.075a |
| 25 mM | ns | 0.816 ± 0.056a | 0.833 ± 0.075a | |
| 50 mM | ns | 0.789 ± 0.056a | 0.794 ± 0.075a | |
| 100 mM | ns | 0.674 ± 0.056a | 0.500 ± 0.075abc | |
| 200 mM | ns | 0.160 ± 0.056b | 0.215 ± 0.075bc | |
| L. stoechas x | 0 mM (control) | ns | 0.815 ± 0.056a | 0.832 ± 0.075a |
| 25 mM | ns | 0.790 ± 0.056a | 0.798 ± 0.075a | |
| 50 mM | ns | 0.797 ± 0.056a | 0.775 ± 0.075a | |
| 100 mM | ns | 0.723 ± 0.056a | 0.470 ± 0.075abc | |
| 200 mM | ns | 0.566 ± 0.056a | 0.493 ± 0.075abc | |
| L. dentata var. candicans x | 0 mM (control) | ns | 0.821 ± 0.056a | 0.807 ± 0.075a |
| 25 mM | ns | 0.820 ± 0.056a | 0.821 ± 0.075a | |
| 50 mM | ns | 0.796 ± 0.056a | 0.828 ± 0.075a | |
| 100 mM | ns | 0.748 ± 0.056a | 0.631 ± 0.075a | |
| 200 mM | ns | 0.728 ± 0.056a | 0.130 ± 0.075c | |
| L. dentata var. dentata x | 0 mM (control) | ns | 0.770 ± 0.056a | 0.788 ± 0.075a |
| 25 mM | ns | 0.743 ± 0.056a | 0.731 ± 0.075a | |
| 50 mM | ns | 0.717 ± 0.056a | 0.767 ± 0.075a | |
| 100 mM | ns | 0.632 ± 0.056a | 0.585 ± 0.075ab | |
| 200 mM | ns | 0.660 ± 0.056a | 0.523 ± 0.075ab | |
| Fspecies/sig. | 19.181/0.000* | 5.358/0.000 | 0.450/0.718 | |
| FΝaCl/sig. | 0.352/0.842 | 16.579/0.000 | 30.580/0.000 | |
| Finteraction/sig. | 1.061/0.401 | 4.322/0.000* | 1.959/0.036* |
ns: non-significant; * denotes significant differences between means at p < 0.05, shown with different letters within columns. † When interactions are significant, factors are not considered, and mean values are not shown.
© 2020 by the authors. Licensee MDPI, Basel, Switzerland. This article is an open access article distributed under the terms and conditions of the Creative Commons Attribution (CC BY) license (http://creativecommons.org/licenses/by/4.0/).
Share and Cite
MDPI and ACS Style
Paraskevopoulou, A.T.; Kontodaimon Karantzi, A.; Liakopoulos, G.; Londra, P.A.; Bertsouklis, K. The Effect of Salinity on the Growth of Lavender Species. Water 2020, 12, 618. https://doi.org/10.3390/w12030618
AMA Style
Paraskevopoulou AT, Kontodaimon Karantzi A, Liakopoulos G, Londra PA, Bertsouklis K. The Effect of Salinity on the Growth of Lavender Species. Water. 2020; 12(3):618. https://doi.org/10.3390/w12030618
Chicago/Turabian StyleParaskevopoulou, Angeliki T., Anna Kontodaimon Karantzi, Georgios Liakopoulos, Paraskevi A. Londra, and Konstantinos Bertsouklis. 2020. "The Effect of Salinity on the Growth of Lavender Species" Water 12, no. 3: 618. https://doi.org/10.3390/w12030618
Note that from the first issue of 2016, this journal uses article numbers instead of page numbers. See further details here.