Change of Contributions from Different Natural Processes to the Ionic Budget in the Yarlung Tsangpo River


Key Lab for Resources Use & Environmental Remediation, Institute of Geographic Sciences and Natural Resources Research, Chinese Academy of Sciences, Beijing 100101, China
*
Authors to whom correspondence should be addressed.
Water 2020, 12(3), 616; https://doi.org/10.3390/w12030616
Submission received: 20 December 2019
/
Revised: 21 February 2020
/
Accepted: 21 February 2020
/
Published: 25 February 2020
(This article belongs to the Section Water Quality and Contamination)
Abstract
:Understanding the geochemistry of natural waters is helpful for grasping how the water environment responds to climate and environment changes. The basin of the Yarlung Tsangpo River, the most important river in the Tibetan Plateau, was selected as the study area. Based on our field sampling data and the previously published data of major ions in the river, we distinguished the different sources of the riverine ionic budget. Subsequently, the changes in their contributions were determined over the past four decades. The results indicate that carbonate weathering was the main source of the dissolved ions in the Yarlung Tsangpo River. Consequently, an increasing trend was found in the Ca2+, Mg2+, and HCO3− concentrations in the river water. Conversely, silicate weathering, the secondary source of ions, declined after 2000. More notably, the sulfide oxidation process was considerably enhanced over the study period, which resulted in a two-fold increase in SO42− in the riverine water.
1. Introduction
Riverine dissolved salts have many sources such as atmosphere inputs, including sea salt aerosols and rainwater; products from the chemical weathering of rocks, including silicates, carbonates, evaporites, and sulfides; and anthropogenic inputs [1]. Therefore, the study of water geochemistry can help with understanding the water environment in a region, as well as revealing the linkage between climate, weathering, and tectonic impacts. Presently, the water geochemistry of a basin is understood for a certain period [2,3,4,5,6,7]; however, analyses of its temporal differences are lacking. With the current dramatic climate and environmental changes, the sources of riverine dissolved salts are also shifting significantly [8]. Therefore, establishing a long-term dataset of water chemistry and identifying the changes of the impacts of various natural processes on the water ionic chemistry are necessary. For this purpose, stoichiometry based on the ion content can provide simple methods (e.g., forward and inverse models) to create these datasets [9]. These methods have been applied in many river basins around the world [10,11,12,13,14,15].
Since Raymo and Ruddiman hypothesized that the uplift of the Tibetan Plateau caused an increase in chemical weathering [16], the river geochemistry in this area has received wide attention. Many studies were conducted for the Ganges–Brahmaputra [17,18,19,20], Yangtze [21,22,23,24,25,26], Yellow [27,28,29], Indus [30,31], Yamuna [32], and Red [33] Rivers. The Yarlung Tsangpo River basin, the headwater of the Brahmaputra River, is the largest river in the Tibetan Plateau, and affects the sediment and chemical budgets in the Himalayas. In this study, we built the water chemistry dataset for the Yarlung Tsangpo River by pairing our field sampling data from 2013 and 2015 with historical data published in previous studies. Subsequently, we used this dataset to distinguish the different sources of the riverine dissolved salts. Finally, the changes in contributions from different natural processes to the ionic budget in the Yarlung Tsangpo River for the past 40 years were revealed.
2. Materials and Methods
2.1. Hydrologic and Geologic Setting of the Study Area
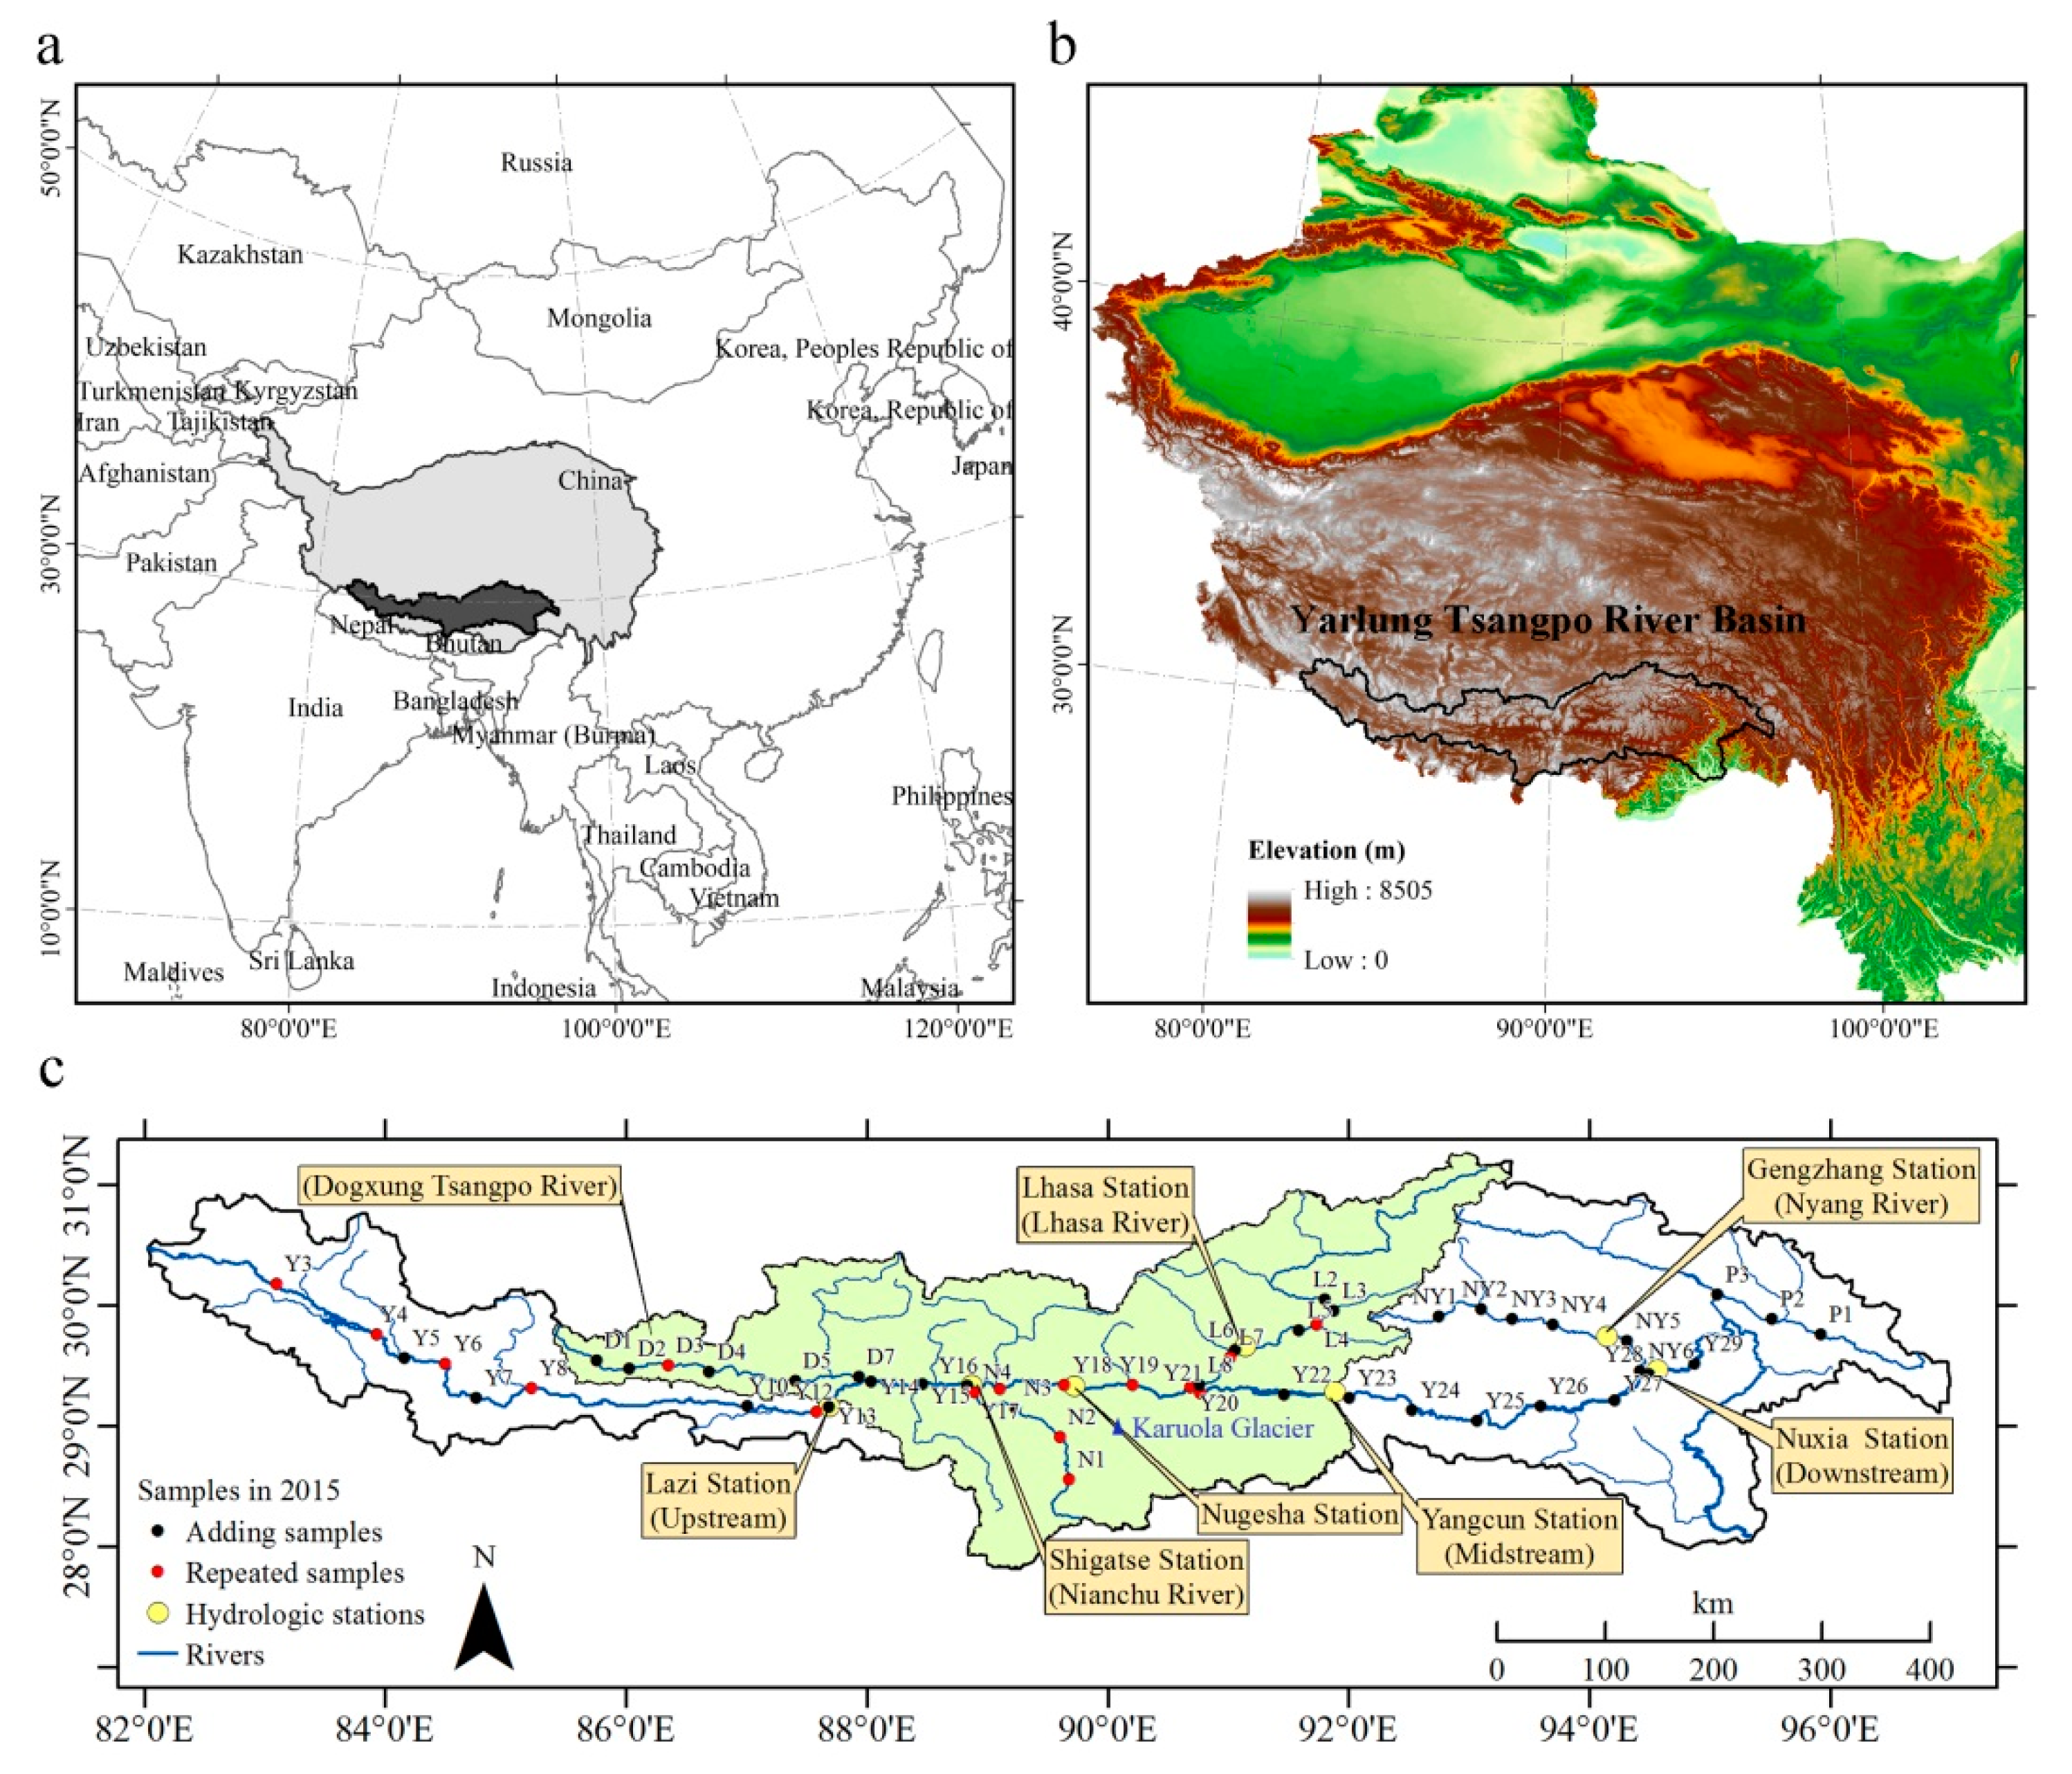
The Yarlung Tsangpo River originates at the base of the Chamyungdung Glacier in Northern Himalaya and collects many tributaries, including the Dugxung Tsangpo, Nianchu, Lhasa, Nyang, and Po Tsangpo Rivers. The elevation of the basin ranges from ~7000 to ~150 m. The Nuxia Hydrological Station is the lowest station providing long-term runoff observations. The region above the station has an elevation that is generally higher than ~3000 m; the elevation drops suddenly at the eastern syntaxis to less than 100 km below the station. Thus, the observational data from the Nuxia Station represent the runoff characteristics for the higher portion of the Yarlung Tsangpo River. The basin has a drainage area of ~16.8 × 10⁴ km2 and an annual water discharge of ~585.1 × 10⁸ m3. The basin can be divided into different areas by four hydrological stations (Figure 1). The runoff for each region is shown in Table 1. The study area is characterized by a semi-humid and semi-arid plateau monsoon climate system, with an annual average precipitation of ~494.6 mm. June to September are the peak monsoon months, accounting for ~85% of the annual precipitation; these are also the months with the highest temperatures. From the headwater to the downstream, both the temperature and precipitation increase due to elevation changes and water vapor transport from the Indian Ocean.
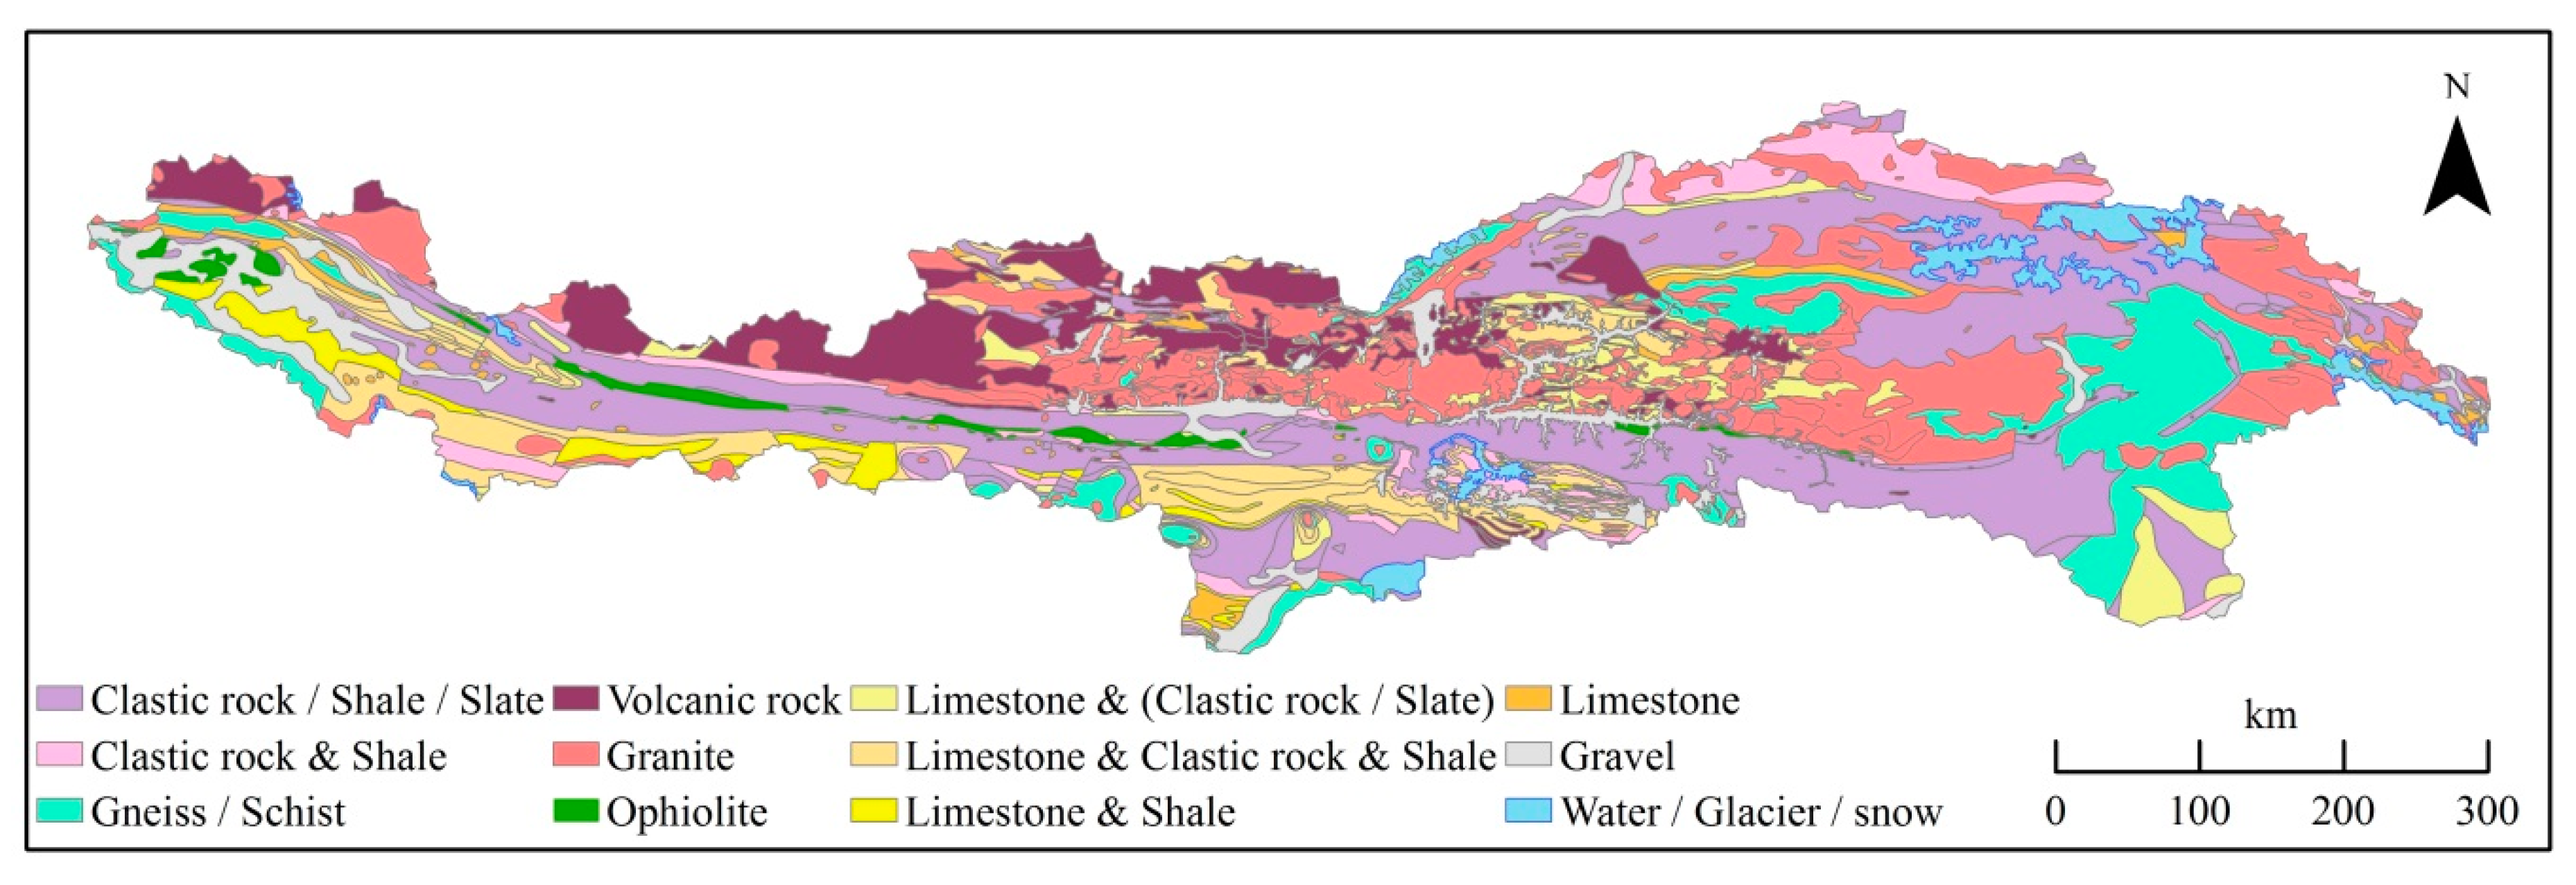
Strata of various ages can be found in the Yarlung Tsangpo River Valley and adjacent regions, with the Mesozoic strata being particularly well exposed. Sedimentary, metamorphic, and igneous rocks all occupy a certain proportion in the study area [34]. The clastic rock, shale, slate, and their mixed forms are most widely distributed in the basin (Figure 2). The igneous rocks, mainly in the form of volcanic rocks and granite, appear mostly in the area north of the Yarlung Tsangpo River. The limestone is mostly associated with some siliceous sedimentary and metamorphic rocks, which are mainly found in the upstream and midstream of the basin. Carbonate such as limestone is significantly less distributed than silicate rocks in the Yarlung Tsangpo River Basin. In addition, evaporate rocks, such as halite and gypsum, often occur in other silicate or carbonate sedimentary rocks.
2.2. Sampling and Chemical Analysis
Heavy monsoon rainfall can induce large changes in the characteristics of the riverine solute load [35]. This will affect the calculation of chemical denudation deduced from stoichiometry. Therefore, we sampled the main stream and major tributaries of the Yarlung Tsangpo River four times before and after the monsoon seasons in 2013 and 2015 (June and October of 2013 and April and September of 2015). We selected sites where tributaries ran into the main stream, sites with significantly different land covers, and sites where human disturbance is frequent; this allowed us to obtain water chemical data that reflect the combined influences of various factors. In 2015, sampling was conducted from the headwater to the location near Nuxia Station, and a part of the sampling sites were a repeated collecting of 2013 (Figure 1). A total of 16 water samples were collected for each period in 2013, and 48 samples were collected for each period of 2015. The samples were collected at a depth of 10 cm, filtered using a 0.45 μm cellulose acetate membrane filter, and then stored, free of air, in pre-cleaned 50 mL polyethylene bottles. The pH was measured in the field using a Horiba U53 multi-parameter meter (HORIBA. Ltd., Kyoto, Japan). Subsequently, the water samples were returned to the laboratory and placed in the freezer for cryopreservation. The samples melted naturally at room temperature prior to the chemical measurements. The major cations (K+, Na+, Ca2+, and Mg2+) and SiO2 concentrations were determined using an inductively coupled plasma optical emission spectrometer (ICP–OES; PerkinElmer Corporation, USA). The anion concentrations (SO42−, Cl−, and NO3−) were measured with high-performance liquid chromatography (LC–10ADvp; (Shimadzu Corporation, Japan). The instrument error was ±2% for cations and ±5% for anions. The alkalinity was represented by HCO3-, which was calculated using the ionic charge balance.
2.3. Historical Chemical Data Collection
Besides our measurements, which can provide the newest ion contents for the Yarlung Tsangpo River, we also compiled a historical water ion dataset for the mainstreams and tributaries of the Yarlung Tsangpo River for 1973–1976 [36], 1985 [37], 2005 [19], and 2008 [34]. To maintain consistency in the samples of different periods, we selected published data from sites where the samples were close to our samples. Then, the data were re-encoded based on our sampling codes. This resulted in 35, 19, 28, and 29 sites of major ion sample data for the four historical data periods, respectively.
3. Results and Discussion
3.1. Major Ion Chemistry and Variation During the Period of 1975 to 2015
The results showed that water in the Yarlung Tsangpo River Basin is alkaline, with a pH value of ~8.0. The annual mean total dissolved solids (TDS) value in the basin was 138.6 mg/L (individual measurements range from 80.3 to 208.3 mg/L; Table 2), which is higher than the typical average levels of the world’s rivers (70–130 mg/L) [38]. This result is consistent with those of several rivers originating in the Himalayas, which have TDS values of 99–491 mg/L [39]. The dominant cation in the river water was Ca2+, with a mean content of 766 (range 573 to 1151) μmol/L, accounting for 53.3% of the total cation content. The Na+ content, with a mean of 384 (125–594) μmol/L, was higher than the Mg2+ content, with a mean of 245 (113.3–440.4) μmol/L. The lowest cation content was observed for K+, with a mean of 40.9 (33.3–60) μmol/L, accounting for only 2.8% of the total cation content. The dominant anion in the river water was HCO3-, accounting for 77% of the total anion content, with a mean of 1716 (1053–2661) μmol/L. In contrast, the SO42− and Cl− contents were relatively low, with mean values of 385.1 (160–544.2) μmol/L and 154.9 (40–232.5) μmol/L, respectively. The analysis also showed that the dissolved ion levels of water in the upstream reach were significantly higher than those in the downstream reach; the TDS of the Nianchu and Dogxung Tsangpo Rivers were the highest, and that of the downstream reaches of the Nyang and Po Tsangpo Rivers were the lowest. This is largely due to more precipitation in the downstream region, contributing to more runoff and lower concentrations of dissolved solids. Unlike other ions, the Na+ concentration was the highest in the midstream of Yarlung Tsangpo River, whereas K+ was prevalent in the Nyang and Po Tsangpo Rivers.
The ion contents of the Yarlung Tsangpo River and its major tributaries of the past 40 years were compared. We found that the average TDS values of the whole basin before and after 2000 were 124.6 and 152.0 mg/L, respectively (Table 3). The increase in dissolved ions was much higher in the upstream than in the downstream region. The TDS of the Dogxung Tsangpo River was up to twice as high after 2000 when compared with before. In contrast, the TDS of the Nianchu River remained relatively stable over the 40-year period, and the TDS of the Lhasa River decreased 15.9% after 2000. The most significantly increased ion in the basin was SO42−, which trended upward after 1985, and doubled concentration as of 2015. The increase was particularly clear in the Dogxung Tsangpo and Po Tsangpo Rivers, where the SO42− content increased by a factor of three. The Ca2+, Mg2+, and HCO3− concentrations also increased over the 40-year period, with increases of 16%–30% after 2000. Conversely, the K+, Na+, and Cl− contents showed a downward trend in most regions after 2000, with levels of 75%, 84.2%, and 90% of those in the 1970s and 1980s, respectively.
The water samples in the Yarlung Tsangpo River Basin fell near the Ca2+ apex in the cation ternary plot (Figure 3a), indicating the dominance of Ca2+ in the river water; the Ca2+ content peaked in 2005. In the anion ternary plot, the water samples fell closer to the HCO3− apex and extended to the Cl− + SO42− apex (Figure 3b), which implied that carbonate weathering was relatively severe and evaporite weathering was accelerating in the region. Additionally, the distribution of the samples in the ternary plot indicated the difference of the water samples before and after the monsoon season in 2015. Before the monsoon season, the samples fell closer to the HCO3− apexes (average of 119.33 meq/L with a standard deviation of 28.91); however, after the monsoon season, the samples fell closer to the Cl− + SO42− apex (average of 42.73 meq/L with SD of 13.26). The percent of the Cl− + SO42- in the total anions content after the monsoon season (39.9%) was higher than that before the monsoon season (23.7%) at a significant level of 95%. The SiO2 content after the monsoon season (average of 16.52 meq/L) was slightly higher than that before the monsoon season (average of 13.09 meq/L). These changes in the Cl−, SO42−, and SiO2 contents indicated that both the chemical weathering of silicate rocks and the dissolution of evaporites increased with increased precipitation and runoff.
3.2. Anthropogenic Impact on Riverine Dissolved Ions
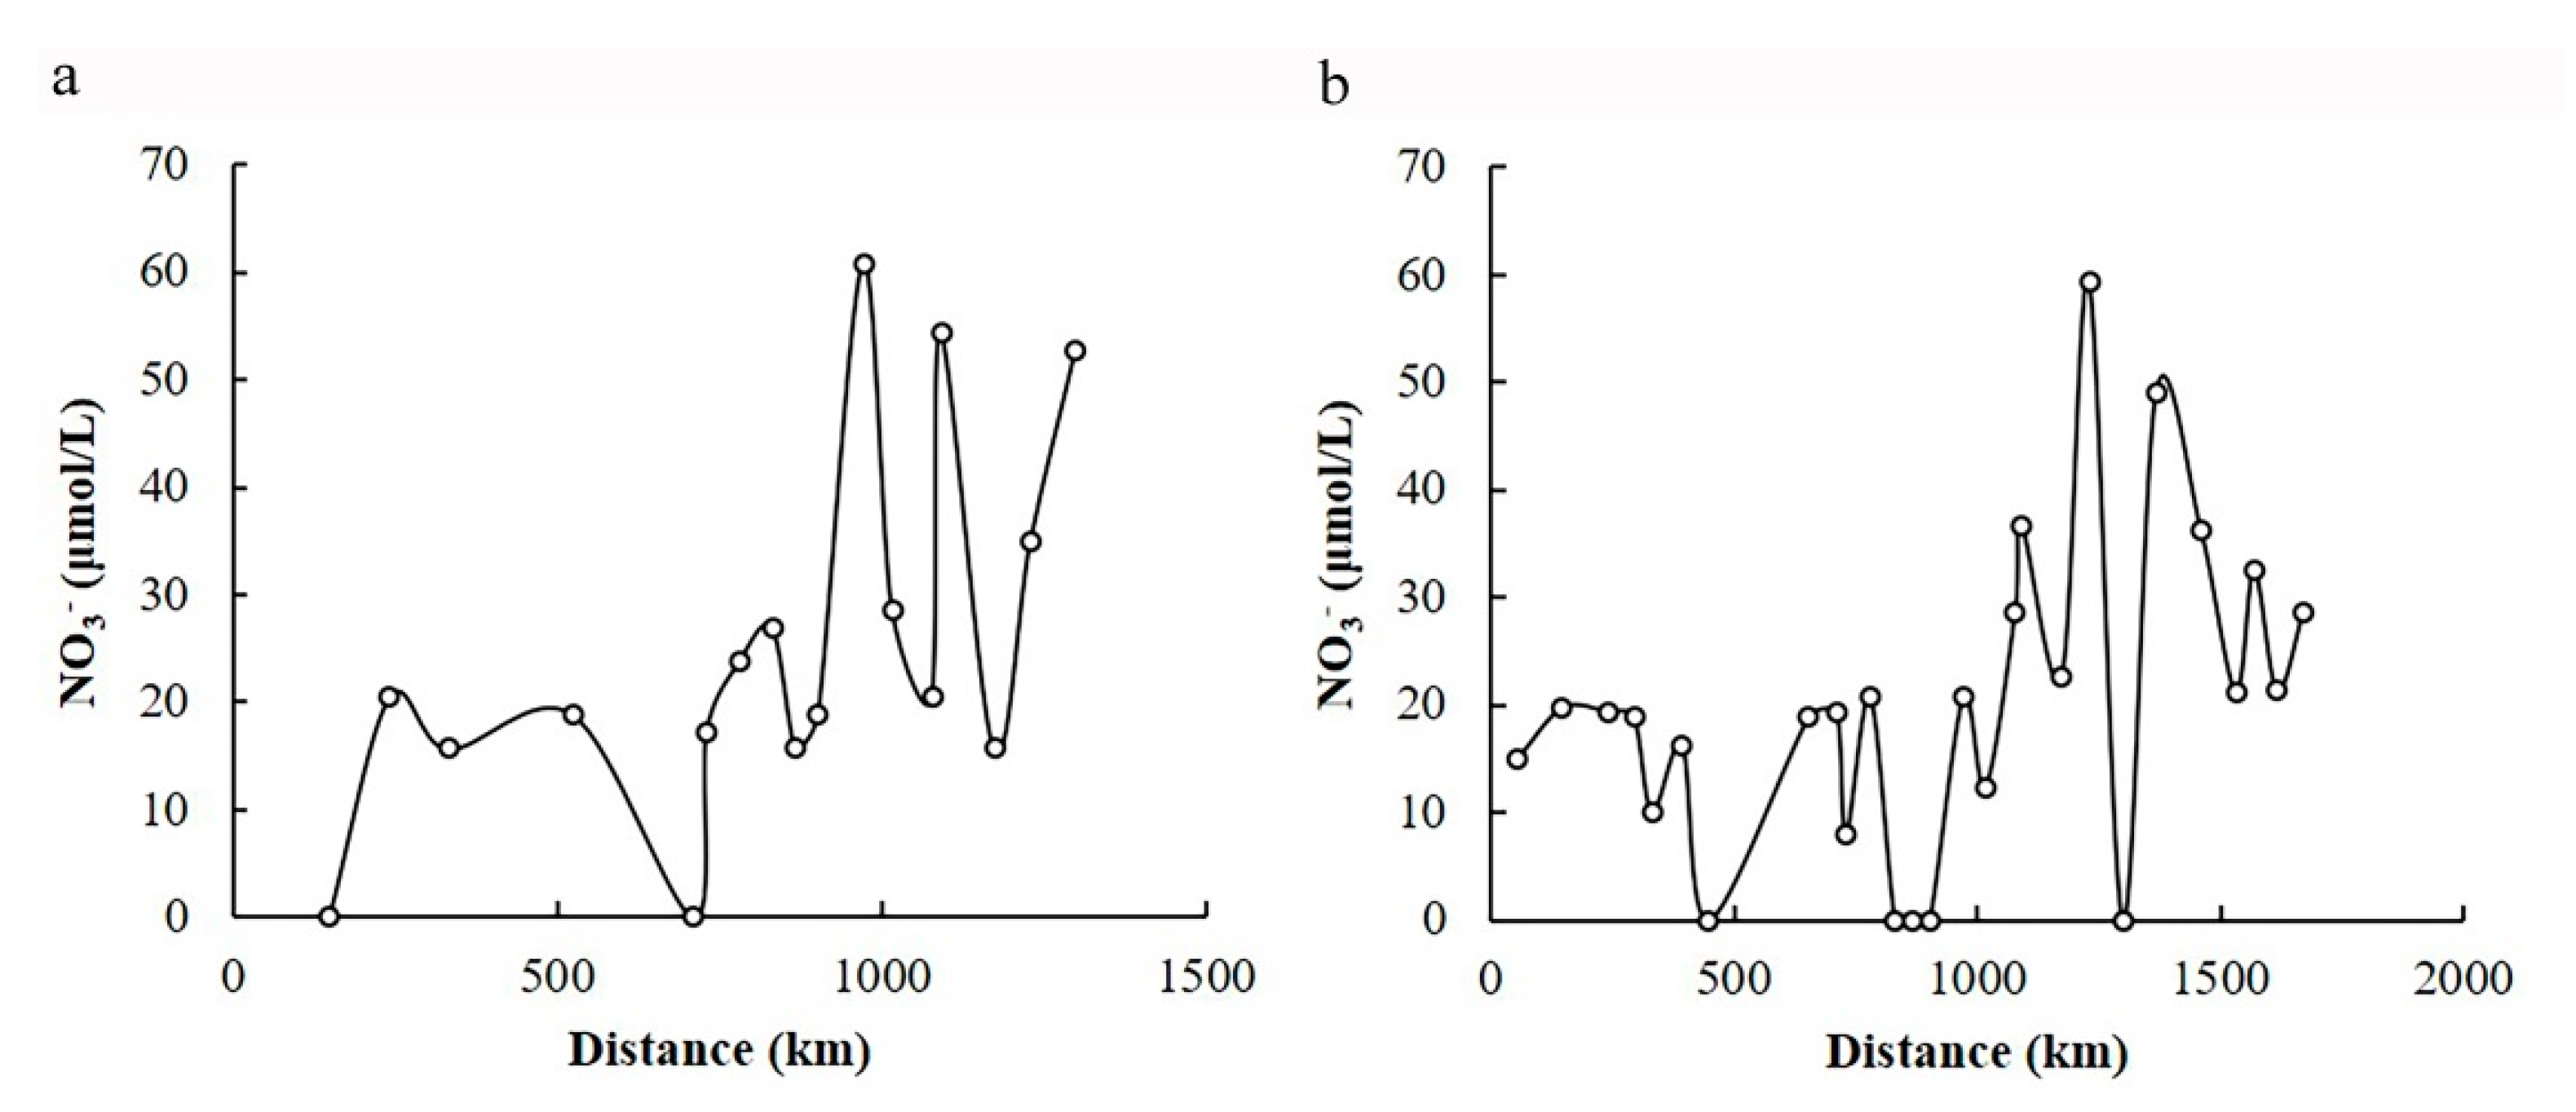
Human activity can increase the ion content of rivers through agricultural fertilizers, animal waste, and municipal and industrial effluents [40]. The NO3− concentration is generally considered to be a good tracer of the influence of agricultural runoff and sewage from the increasing population [41,42,43]; in the Yarlung Tsangpo River Basin, the NO3− concentration has a notably spatial variation. The historical NO3− content of the rainwater indicated that anthropogenic pollutants had a limited effect in the study area before the 1980s; however, the anthropogenic influence became increasingly significant after 2000 (Table 4). The highest NO3− concentrations were found in the flood season in the downstream region near the Shigatse and Lhasa stations (Figure 4). Additionally, the NO3− concentrations in two tributaries of the Lhasa and Nianchu Rivers were relatively high. This indicated that urbanization and increased agricultural production in the densely inhabited districts of Tibet had an increasingly significant impact on the river ion chemistry. However, the mean NO3− molar mass accounted for only ~1.5% (ranging from 0% to 8.1% for different rivers) of the total anion content of the study area. Thus, the anthropogenic input from domestic and agricultural activity can be ignored in this study. Mining activities were proven to have local impacts on hydrochemistry; however, the watercourse in the basin can, in general, be considered relatively pristine [34,44]. Land use and cover change (LUCC) is thought to reflect the extent of the impact of human activities. LUCC was not significant in the past several decades in the Yarlung Tsangpo River Basin, with the change rates between land use/land cover types being mostly less than 1%, except residential areas, which only accounted for less than 1% of the basin area [45,46]. Therefore, the anthropogenic impact on the riverine dissolved ions was negligible in the study area.
3.3. Atmospheric Contribution to Riverine Dissolved Ions
Because the Himalayas are far from the sea, the cyclic variations in sea salt aerosols have little effect on the ion content of the river water [49]. This was confirmed by the significant spatial randomness of the Cl− content at different times (Table 1). Therefore, the atmospheric contribution to the riverine solutes from rainwater can be calculated as follows [3]:
where X is the ion type, [X]rain is the contribution to the river’s ion X from precipitation (μmol/L), [X/Cl]rain is the average molar ratio between ion X and Cl− in the rainwater, and [Cl]rain is the contribution to the river’s Cl− content from precipitation (μmol/L).
[X]rain = [X/Cl]rain × [Cl]rain
The atmospheric contribution to the riverine solute load is determined by the rainwater’s ion contents, which are normalized by Cl−. Because our study spanned over 40 years, we used different values of [X/Cl]rain for the different time periods (Table 4). The minimum Cl− content (Cl−min) in river water samples was assumed to be derived entirely from rain contribution in previous studies [19,26]. However, in this study, we found significant differences between Cl−min for different periods, ranging from 1.97 (June 1985) to 30.99 μmol/L (September 2008). Using an individual Cl−min for each period would potentially bias the calculation of the atmosphere’s relative contribution, as the dissolved Cl− in glacial melt water is thought to be totally due to rainfall and the glacier, and the chemical composition in a glacier surface is stable in the short term. The lowest contents of Cl− were both found in the samples at the terminus of the Karuola Glacier (Figure 1) for sampling in June and October, 2013, with values of 5.0 and 9.2 μmol/L, respectively. Because one flood season occurred between these two periods and no bursts in human activity or any natural processes substantially affected the glacial melt water at that time, the difference between the two measured Cl− contents (4.2 μmol/L) was assumed to be entirely due to precipitation contributions to the basin, that is, [Cl]rain. Consequently, the calculations using Equation (1) showed that the mean atmospheric contribution by Ca2+ was 2.3% (0.8%–6.4%), Mg2+ was 0.8% (0.2%–1.9%), Na+ was 2.0% (0.3%–7.2%), K+ was 3.7% (0.7%–10.9%), HCO3− was 2.3% (0.5%–5.4%), SO42− was 1.2% (0.1%–2.9%), and Cl− was 6.8% (2.2%–21.0%).
3.4. Contribution of Chemical Weathering to Riverine Dissolved Ions
3.4.1. Contribution from Halite and Non-Silicate Sodium Salts
After the atmospheric correction, the remaining Cl− content in the river can be derived from the dissolution of halite (NaCl), which is completely balanced with Na+ (Equation (2)). The mean riverine Na+ content derived from halite in the Yarlung Tsangpo River was ~166.0 μmol/L (ranging from 94.2 to 215.8 μmol/L), accounting for 37.1% (23.8%–48.4%) of the total Na+ content and 10.8% (6.2%–14.5%) of the total cation content. Theoretically, the remaining Na+ content in the river (after removing the contribution of the atmospheric input and dissolution of halite) is derived from the chemical weathering of silicates [3]. However, non-silicate salts, such as borax (Na2CO3), are widespread in the study area. Their dissolution in the midstream region contributes more than 50% to the Na+ content in the rivers [19]. Thus, the equations are as follows:
where [Na]river is the Na+ content in the river (μmol/L); [Na]rain, [Na]halite, [Na]silicate, and [Na]non-silicate are the contributions of precipitation, halite, silicate, and non-silicate salts, respectively, to the Na+ content in the river (μmol/L); and [Cl]evaporite is the contribution of halite to the Cl− content (μmol/L).
[Cl]evaporite = [Cl]river − [Cl]rain = [Na]halite
[Na]river = [Na]rain + [Na]halite + [Na]silicate + [Na]non-silicate
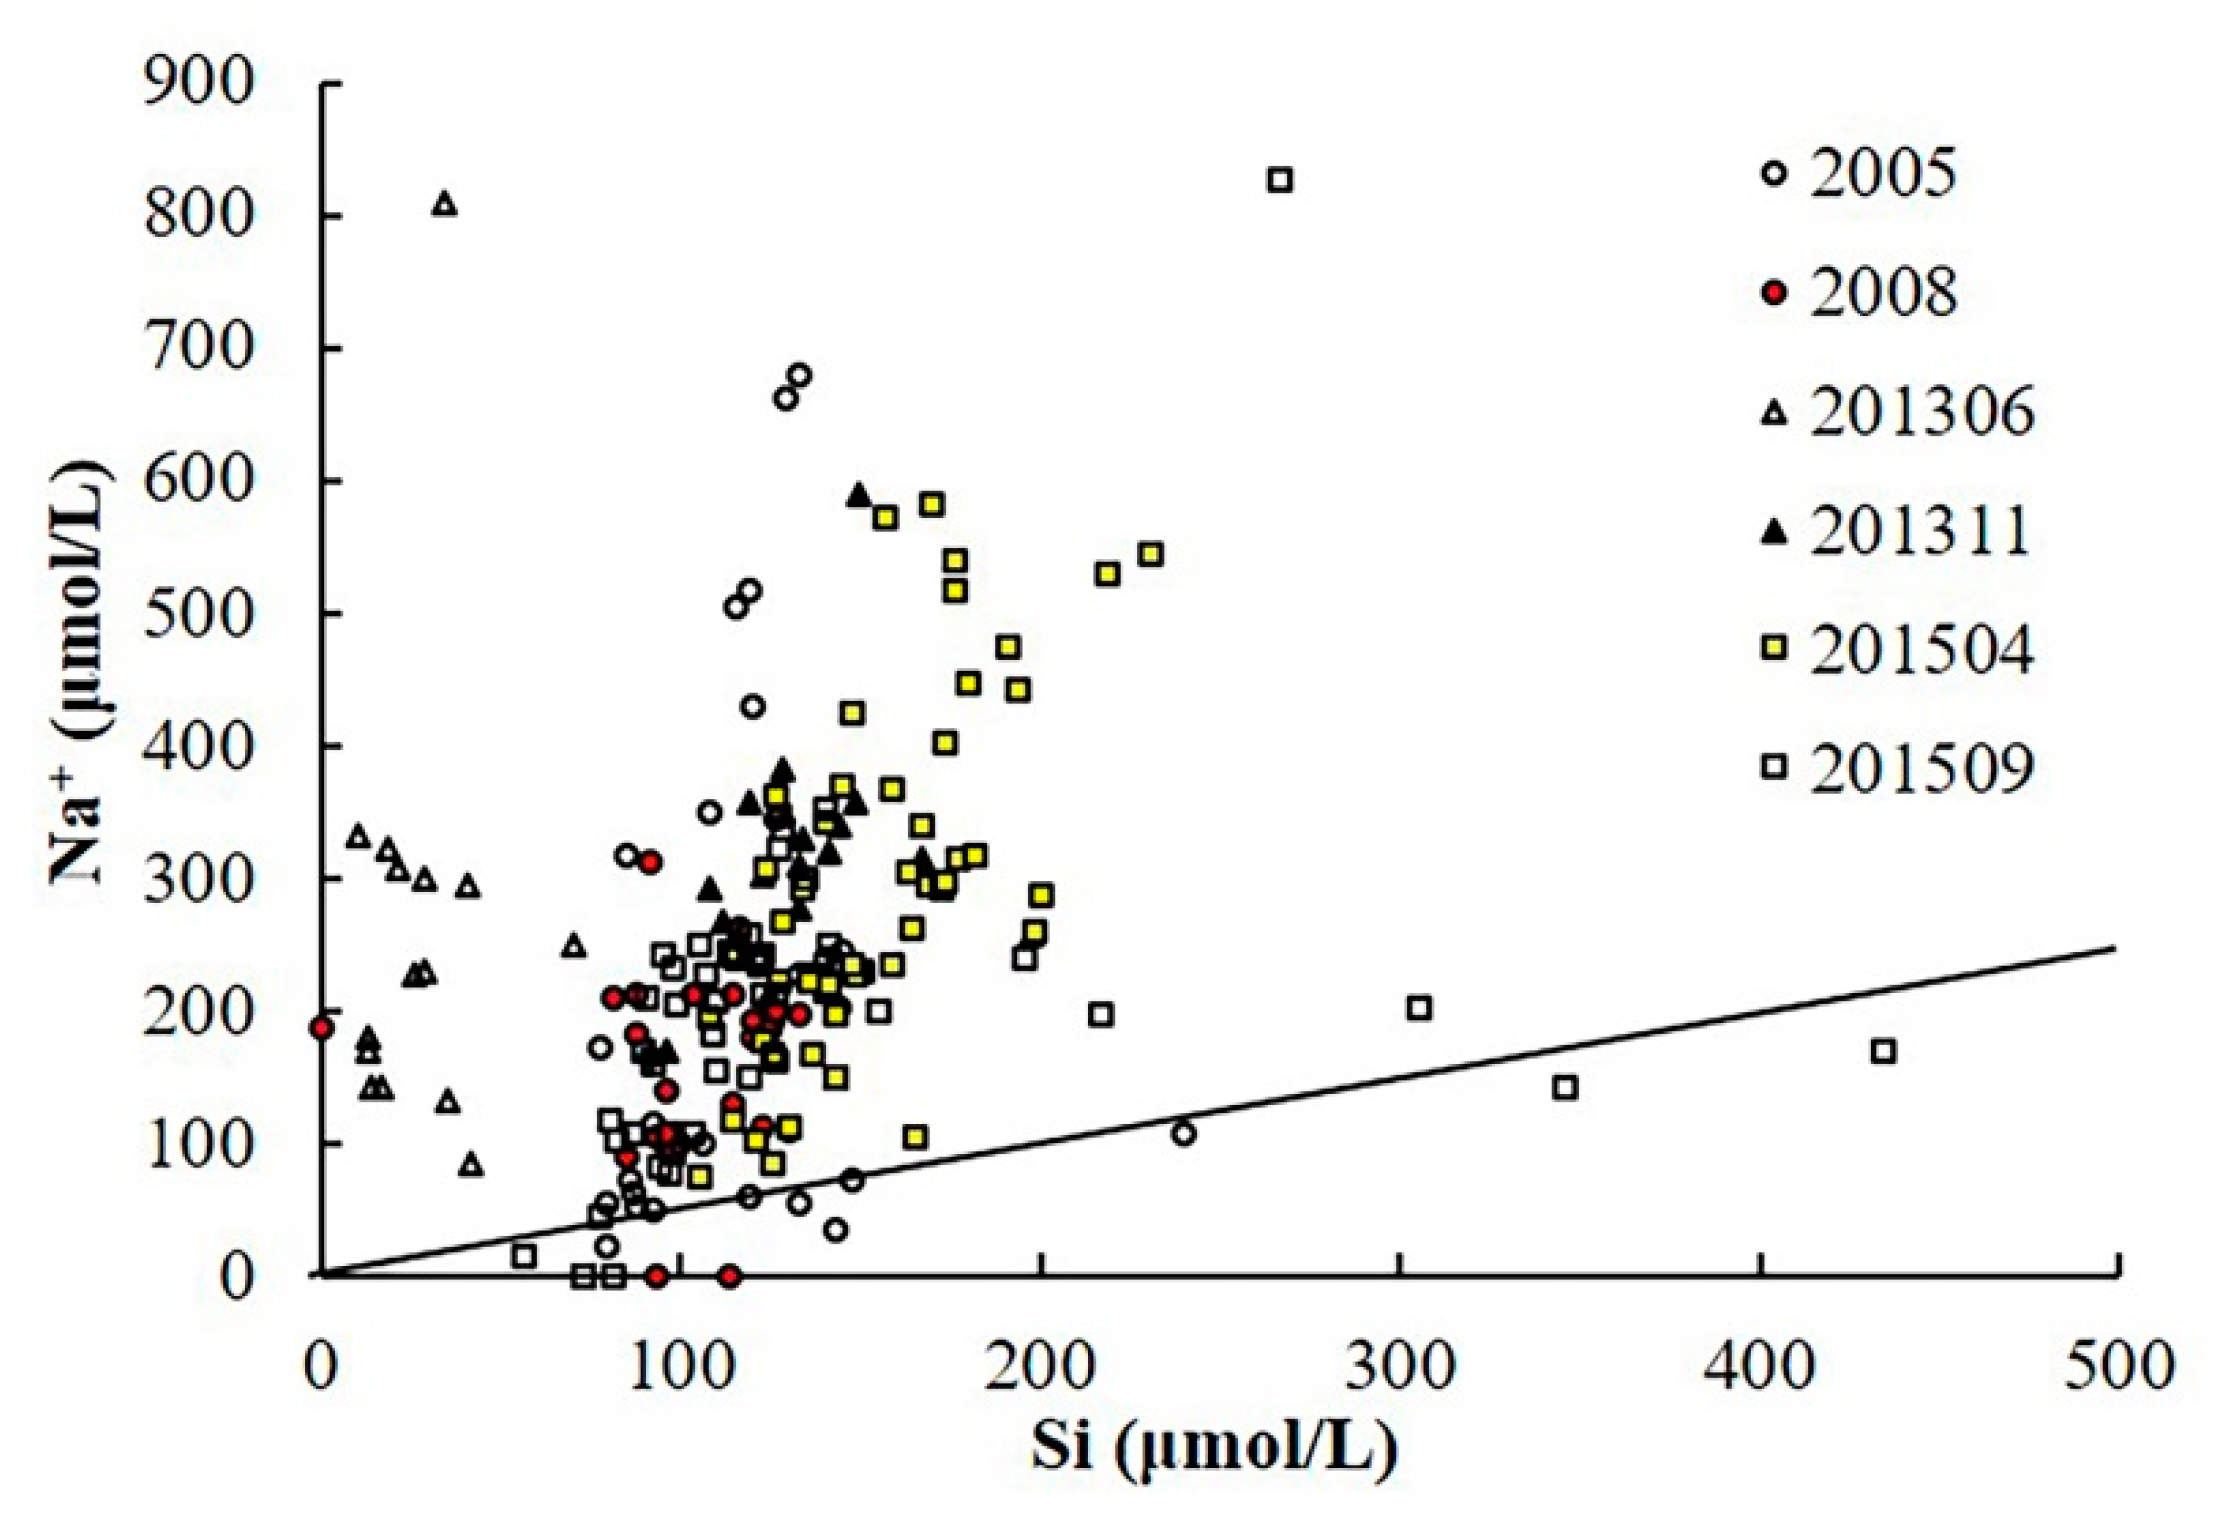
Ideally, Na+ and H4SiO2 released into solution during the weathering of sodium silicate minerals (generally plagioclase) to kaolinites follow a linear relationship of 1:2 [50]. However, we found that only ~10% of the water samples from 2005 to 2015 followed the expected relationship (Figure 5). Therefore, we subtracted the residuals of those samples, which fell well off the line of 1:2, to follow the relationship. Because the Si content was not measured in 1975 and 1985, we used the relationship between the calculated non-silicate Na+ and riverine HCO3− (coefficient of determination (R2) = 0.26; p < 0.05) for the estimation instead. The results showed that the contribution of non-silicate sodium salts to the Na+ content in the river was approximately 173.9 μmol/l (ranging from 100.3 to 256.4 μmol/L), which accounted for 37.4% (23.5–48.3%) of the river’s Na+ content.
3.4.2. Contribution from Evaporites and Sulfides
Evaporites (generally taken to be gypsum, CaSO4) and sulfides (generally taken to be pyrite, FeS2) are the major sources of SO42− in river water (Equation (4)) [33]. The Ca2+ content from evaporites is equal to the SO42− content (Equation (5)). These contributions are calculated by:
where [SO4]river is the SO42− content in the river water (μmol/L); [SO4]rain, [SO4]evaporite, and [SO4]sulfide are the contributions from precipitation, evaporites, and sulfides, respectively, to SO42− in the rivers (μmol/L); and [Ca]evaporite is the contribution of evaporites to Ca2+ (μmol/L).
[SO4]river = [SO4]rain + [SO4]evaporite + [SO4]sulfide
[SO4]evaporite = [Ca]evaporite
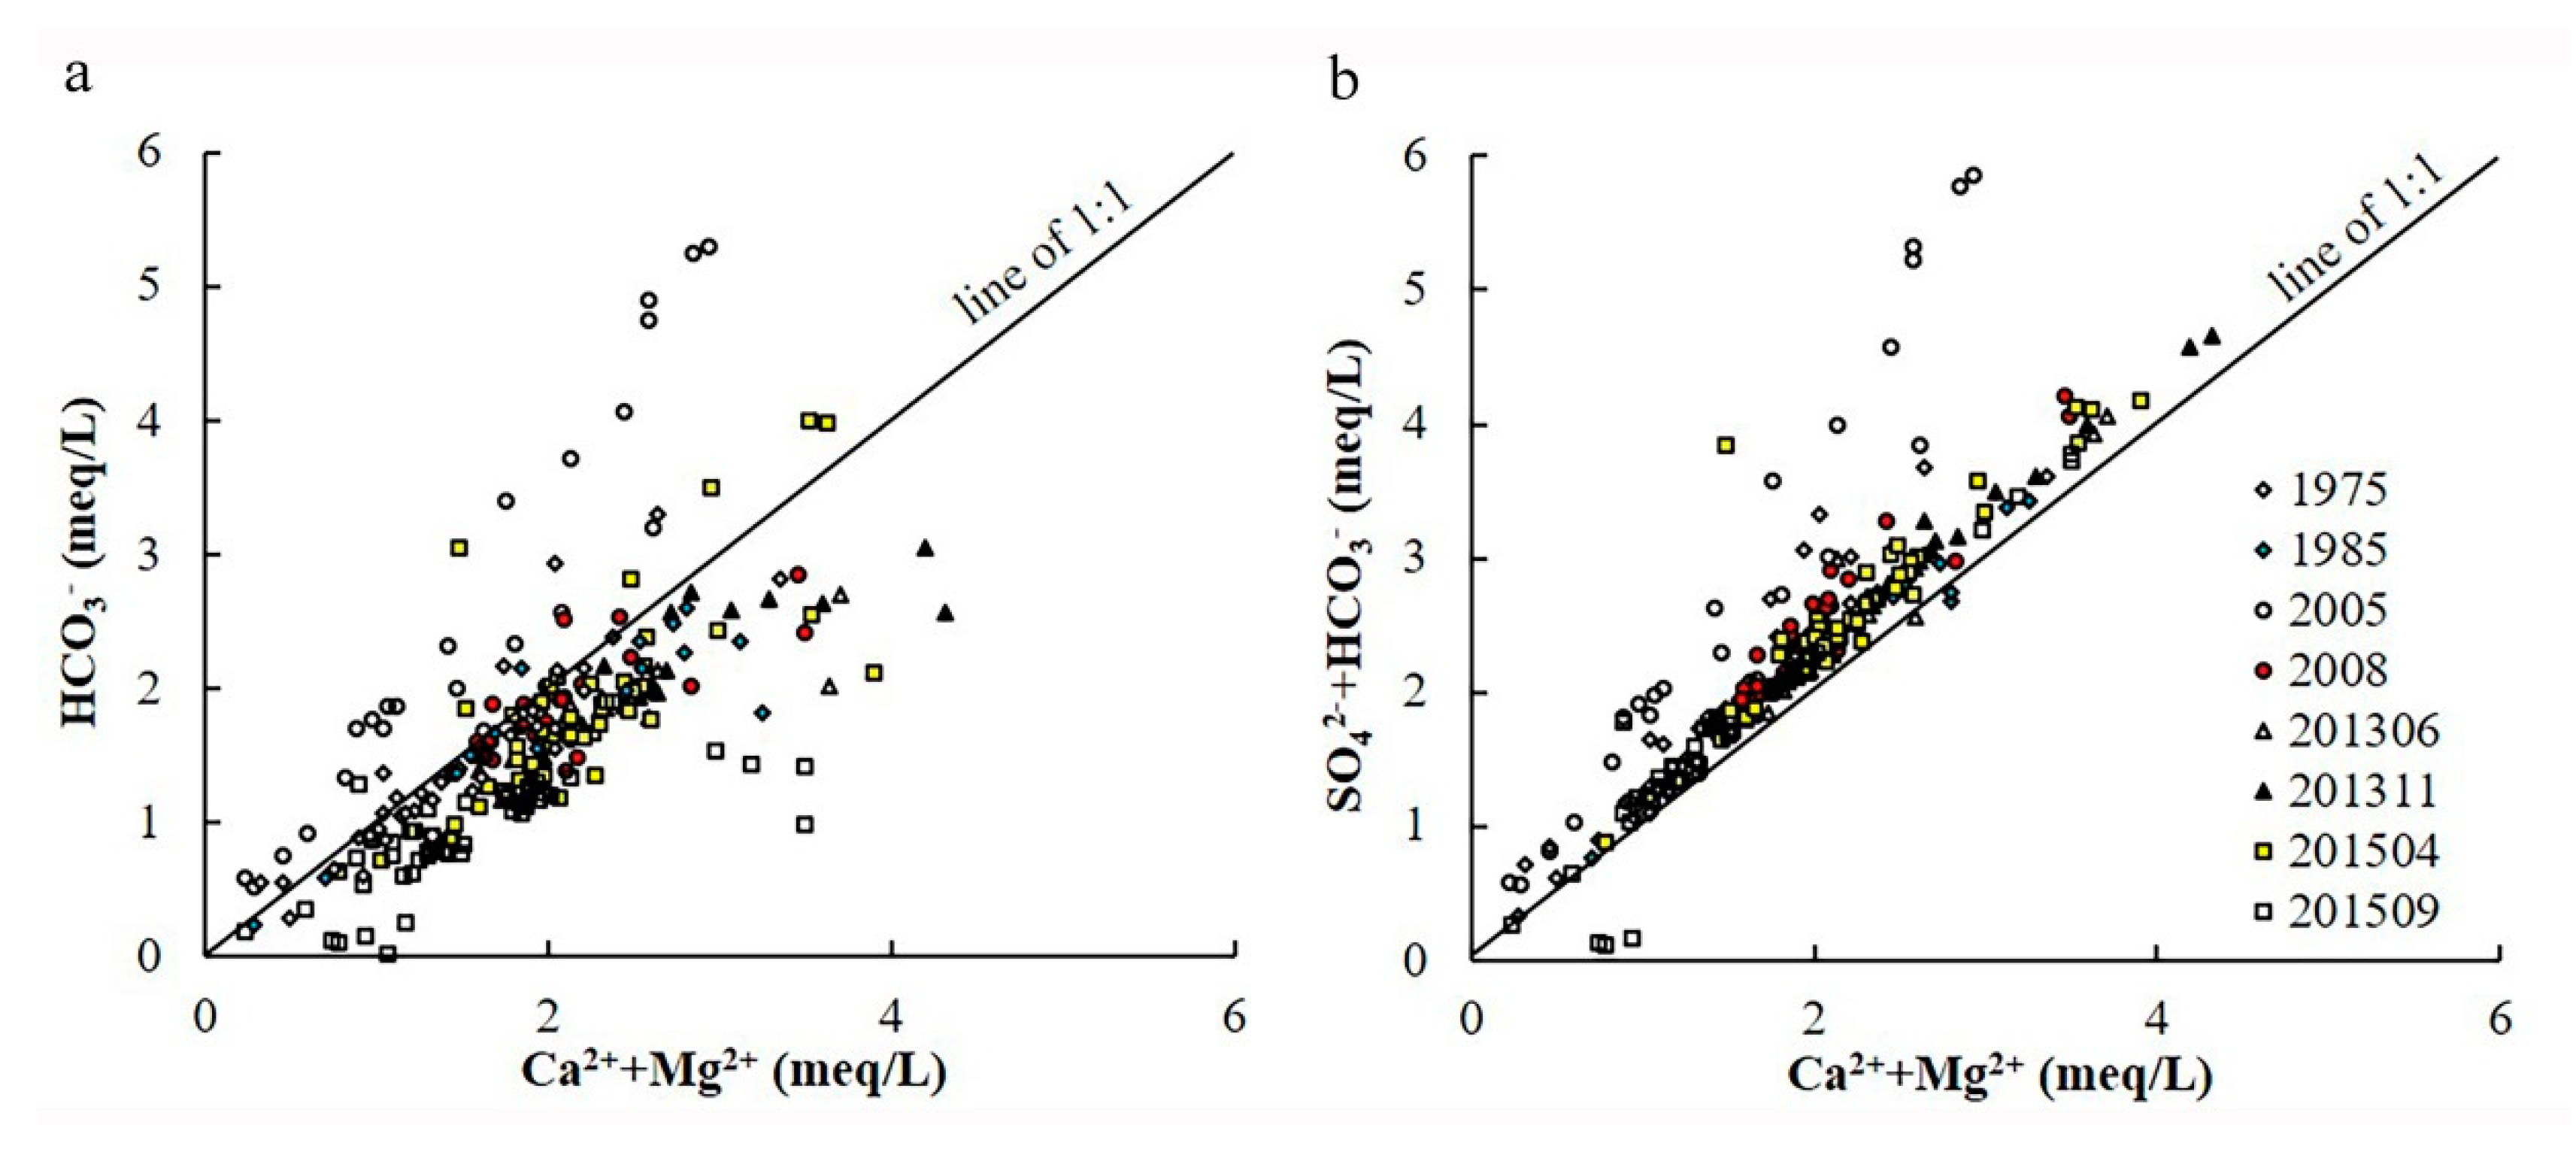
After applying the atmospheric correction, the equivalent weights of Ca2+ + Mg2+ were larger than the equivalent weight of HCO3− in ~88.3% of the water samples (excluding the samples from 2005); the mean ratio of HCO3−/(Ca2+ + Mg2+) was ~0.8 (ranging from 0.56 to 0.97) (Figure 6a). Accounting for the SO42− cation balance in the river water, almost all samples had (HCO3− + SO42−):(Ca2+ + Mg2+) ratios slightly higher than 1:1, with a mean of ~1.16 (ranging from 1.08 to 1.26). A linear relationship was also found between the equivalent weights of Ca2+ + Mg2+ and HCO3− + SO42− (R2 = 0.91, range 0.78 to 0.98, p < 0.05; Figure 6b). This implied that the rock weathering in the basin was actuated by H2SO4 in addition to H2CO3. Therefore, the oxidation of pyrite, which is the main source of H2SO4 in the environment, is suggested to contribute a considerable amount of the SO42− content to the Yarlung Tsangpo River.
To quantify the contribution of gypsum dissolution, we first calculated the contribution of the oxidation of pyrite ([SO4]sulfide) using the equality between the equivalent weight of HCO3− + SO42− and that of Ca2+ + Mg2+. This way, the minimum assessment of evaporite contribution ([SO4]evaporite) was obtained. If the equivalent weight of HCO3− is larger than that of Ca2+ + Mg2+, then the contribution of [SO4]sulfide to the total SO42− content can be estimated using the mean values of [SO4]sulfide from other samples in the same sampling period. The results demonstrated that the mean contribution of gypsum dissolution to the ion chemistry in the river was [SO4]evaporite = [Ca]evaporite = 143.7 μmol/L (range of 86.6 to 203.1 μmol/L). The SO42− and Ca2+ content derived from evaporite accounted for 6.4% (4.1%–8.7%) and 13.3% (6.7%–39.5%) of the anion and cation content in the study area, respectively. Most samples deviated from the Cl− + SO42- apex on the ternary diagram (Figure 3b) and had relatively low ratios of SO42−/Ca2+ (mean of 0.4, range of 0.28 to 0.47); this indicated that the evaporites had a relatively minimal effect on the ion chemistry in the Yarlung Tsangpo River Basin. This is consistent with previous studies, which concluded that sulfate mainly comes from the oxidation of pyrite rather than from the dissolution of gypsum [51].
3.4.3. Silicate and Carbonate Weathering
The chemical weathering of silicate and carbonate rocks is the most important natural source of dissolved ions in the river. Excluding the contributions from atmospheric transport and evaporites, Na+ and K+ are derived solely from silicate weathering (excluding non-silicate Na+), and Ca2+ and Mg2+ are derived from both silicate and carbonate weathering; this is described by:
where [X]river (where X can be K, Ca, or Mg) is the ion content in the river water (μmol/L); and [X]rain, [X]evaporite, [X]silicate, and [X]carbonate are contributions to the riverine ion content from precipitation, halite, silicate, and carbonate, respectively (μmol/L).
[K]river = [K]rain + [K]silicate
[Ca]river = [Ca]rain + [Ca]evaporite + [Ca]silicate + [Ca]carbonate
[Mg]river = [Mg]rain + [Mg]silicate + [Mg]carbonate
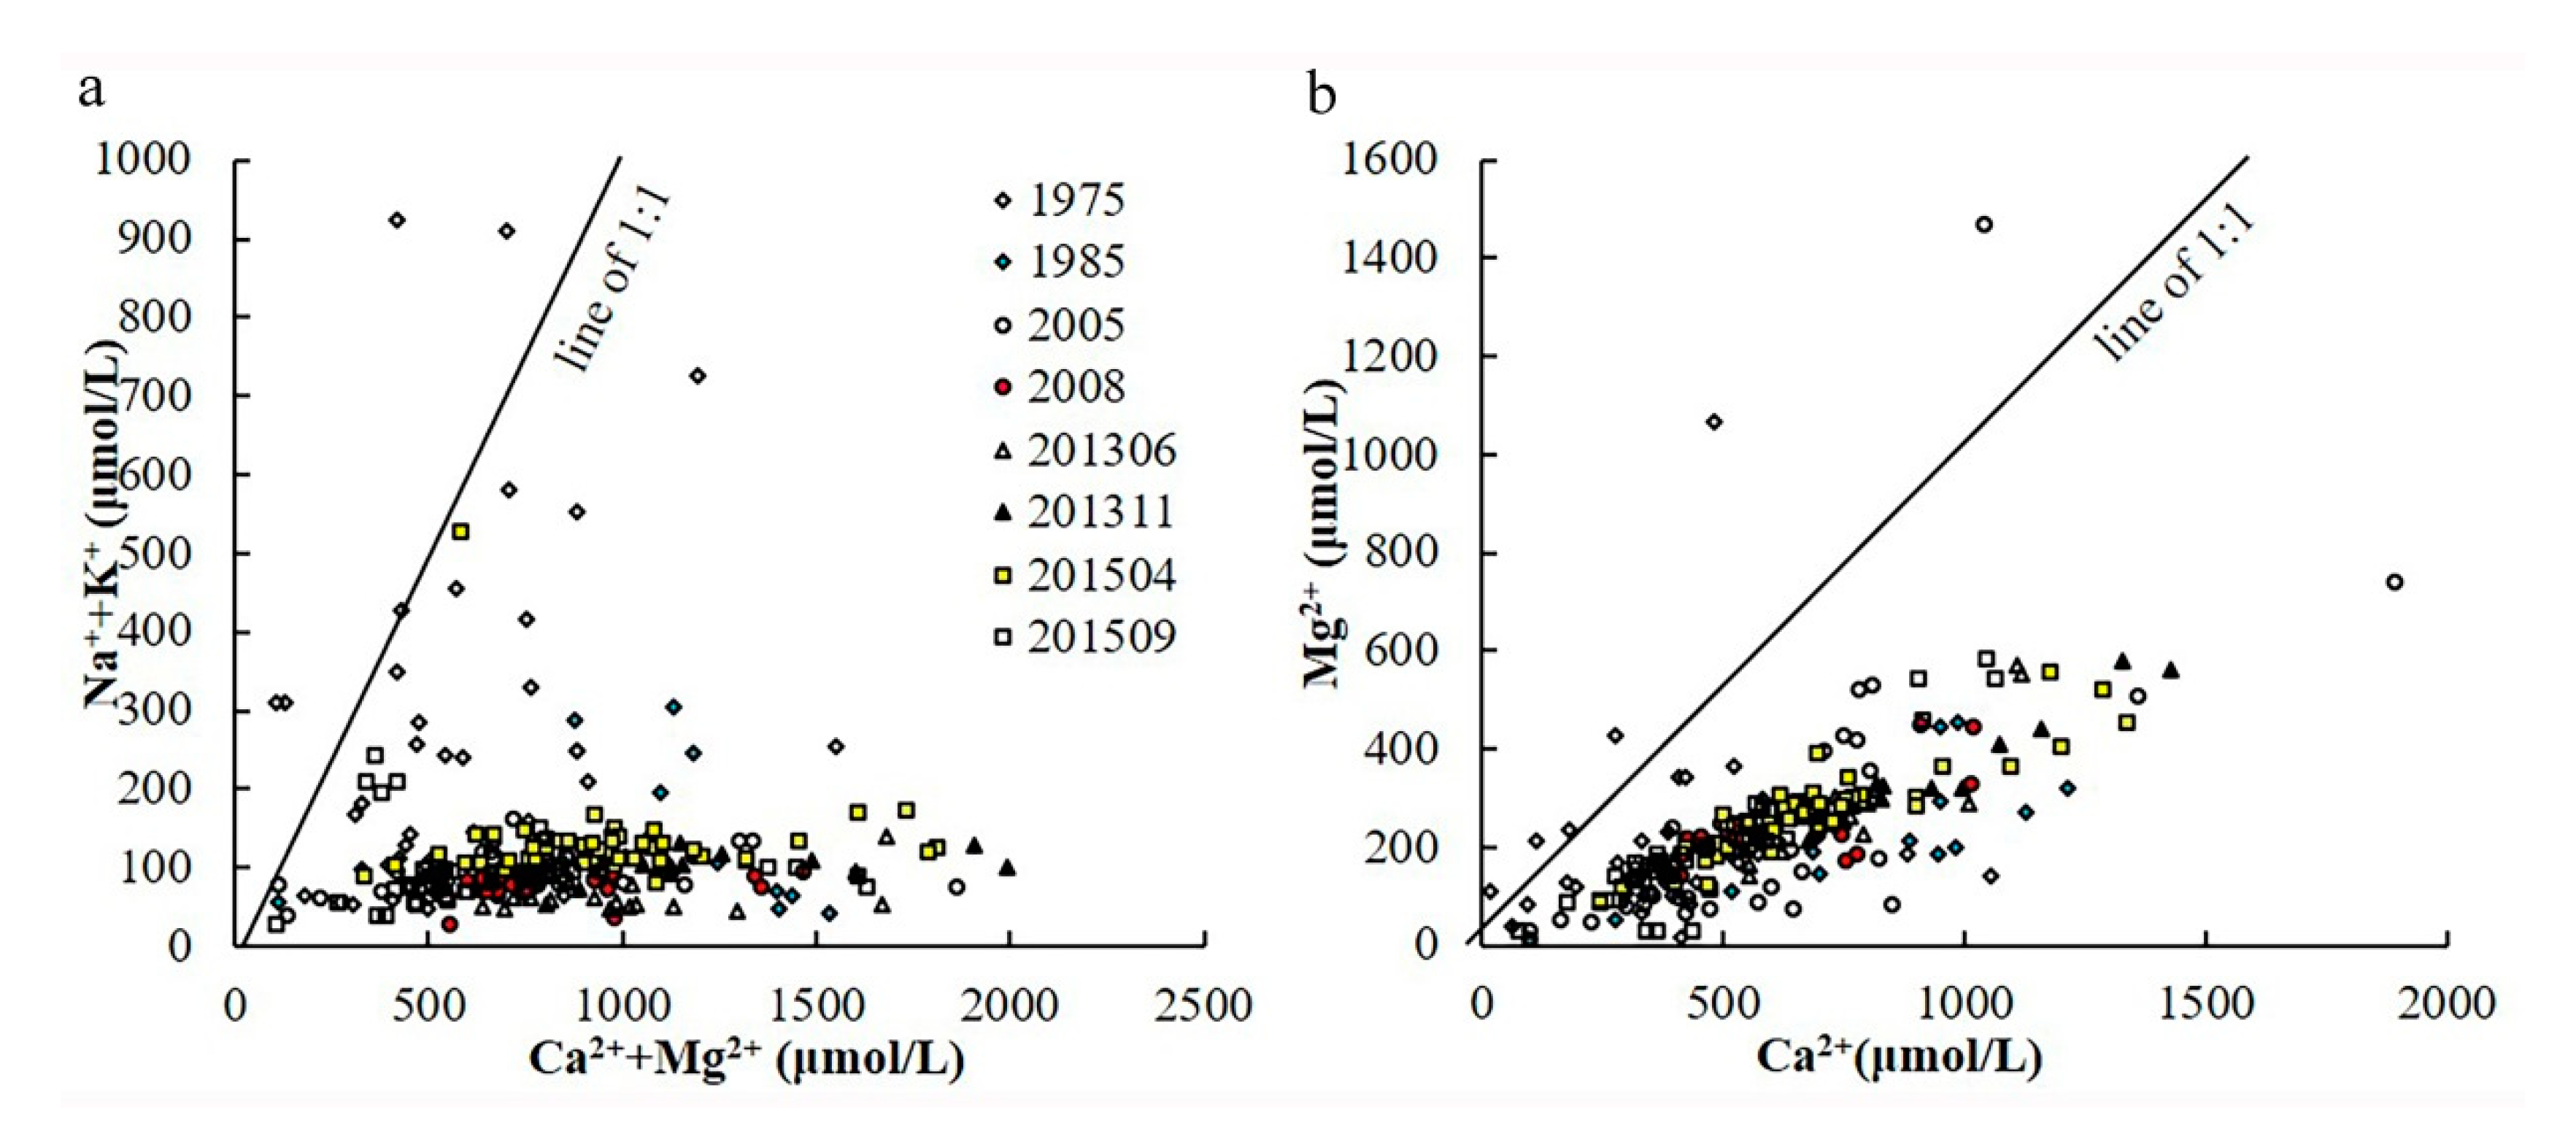
Sarin et al. demonstrated that silicate weathering releases less Ca2+ and Mg2+ than Na+ and K+ [17]. Simply, after the above corrections, the Na+ + K+ content in the river samples was much lower than the Ca2+ + Mg2+ content (Figure 7a); this indicated that carbonate weathering, rather than silicate weathering, was the dominant source of the riverine ion content. The molar ratio of Mg2+/Ca2+ in the river was ~0.42 (ranging from 0.29 to 0.72), which was moderate and indicated that the substantial contributions of carbonate weathering to the riverine solute load were derived from dolomite (CaMg(CO3)2, Mg2+/Ca2+ = ~1.1) and calcite (CaCO3, Mg2+/Ca2+ = ~0.1; Figure 7b).
Because quantifying the Ca2+ and Mg2+ content released from the weathering of silicates is difficult, they were estimated using the ratios of Ca2+/Na+ and Mg2+/Na+ reported in previous studies [52,53]. Based on many rock samples collected along the Yarlung Tsangpo River, Hren et al. found that most rocks in the stream bedload can be classified as granite [19]. We used the measured ratios of Ca2+/Na+ and Mg2+/Na+ in plagioclase (0.55 and 0.3, respectively) [19] to estimate the contribution of silicate weathering to the Ca2+ and Mg2+ contents. The results showed that the mean K+, Na+, Ca2+, and Mg2+ contents in the river water due to silicate weathering were (with ranges indicated in parentheses) 41.0 (28.3–56.9), 71.1 (18.3–147.0), 39.1 (10.1–80.9), and 21.3 (5.5–44.1) μmol/L, respectively. The sum of these cations accounted for 13.3% (4.6%–23.8%) of the total cation content after excluding the atmospheric contribution. Subsequently, the contribution of carbonate weathering to riverine solutes was obtained. The mean [Ca]carbonate and [Mg]carbonate contributions were 601.7 (range of 295.7–871.8) and 227.6 (range of 141.7–322.3) μmol/L, respectively; this accounted for 55.9% (39.7%–62.7%) of the total cation content after excluding the precipitation contribution. These results demonstrated that carbonates were the major mineral type affecting the water chemistry in the Yarlung Tsangpo River Basin.
3.5. Variation of Different Process Contributions During the Period of 1975 to 2015
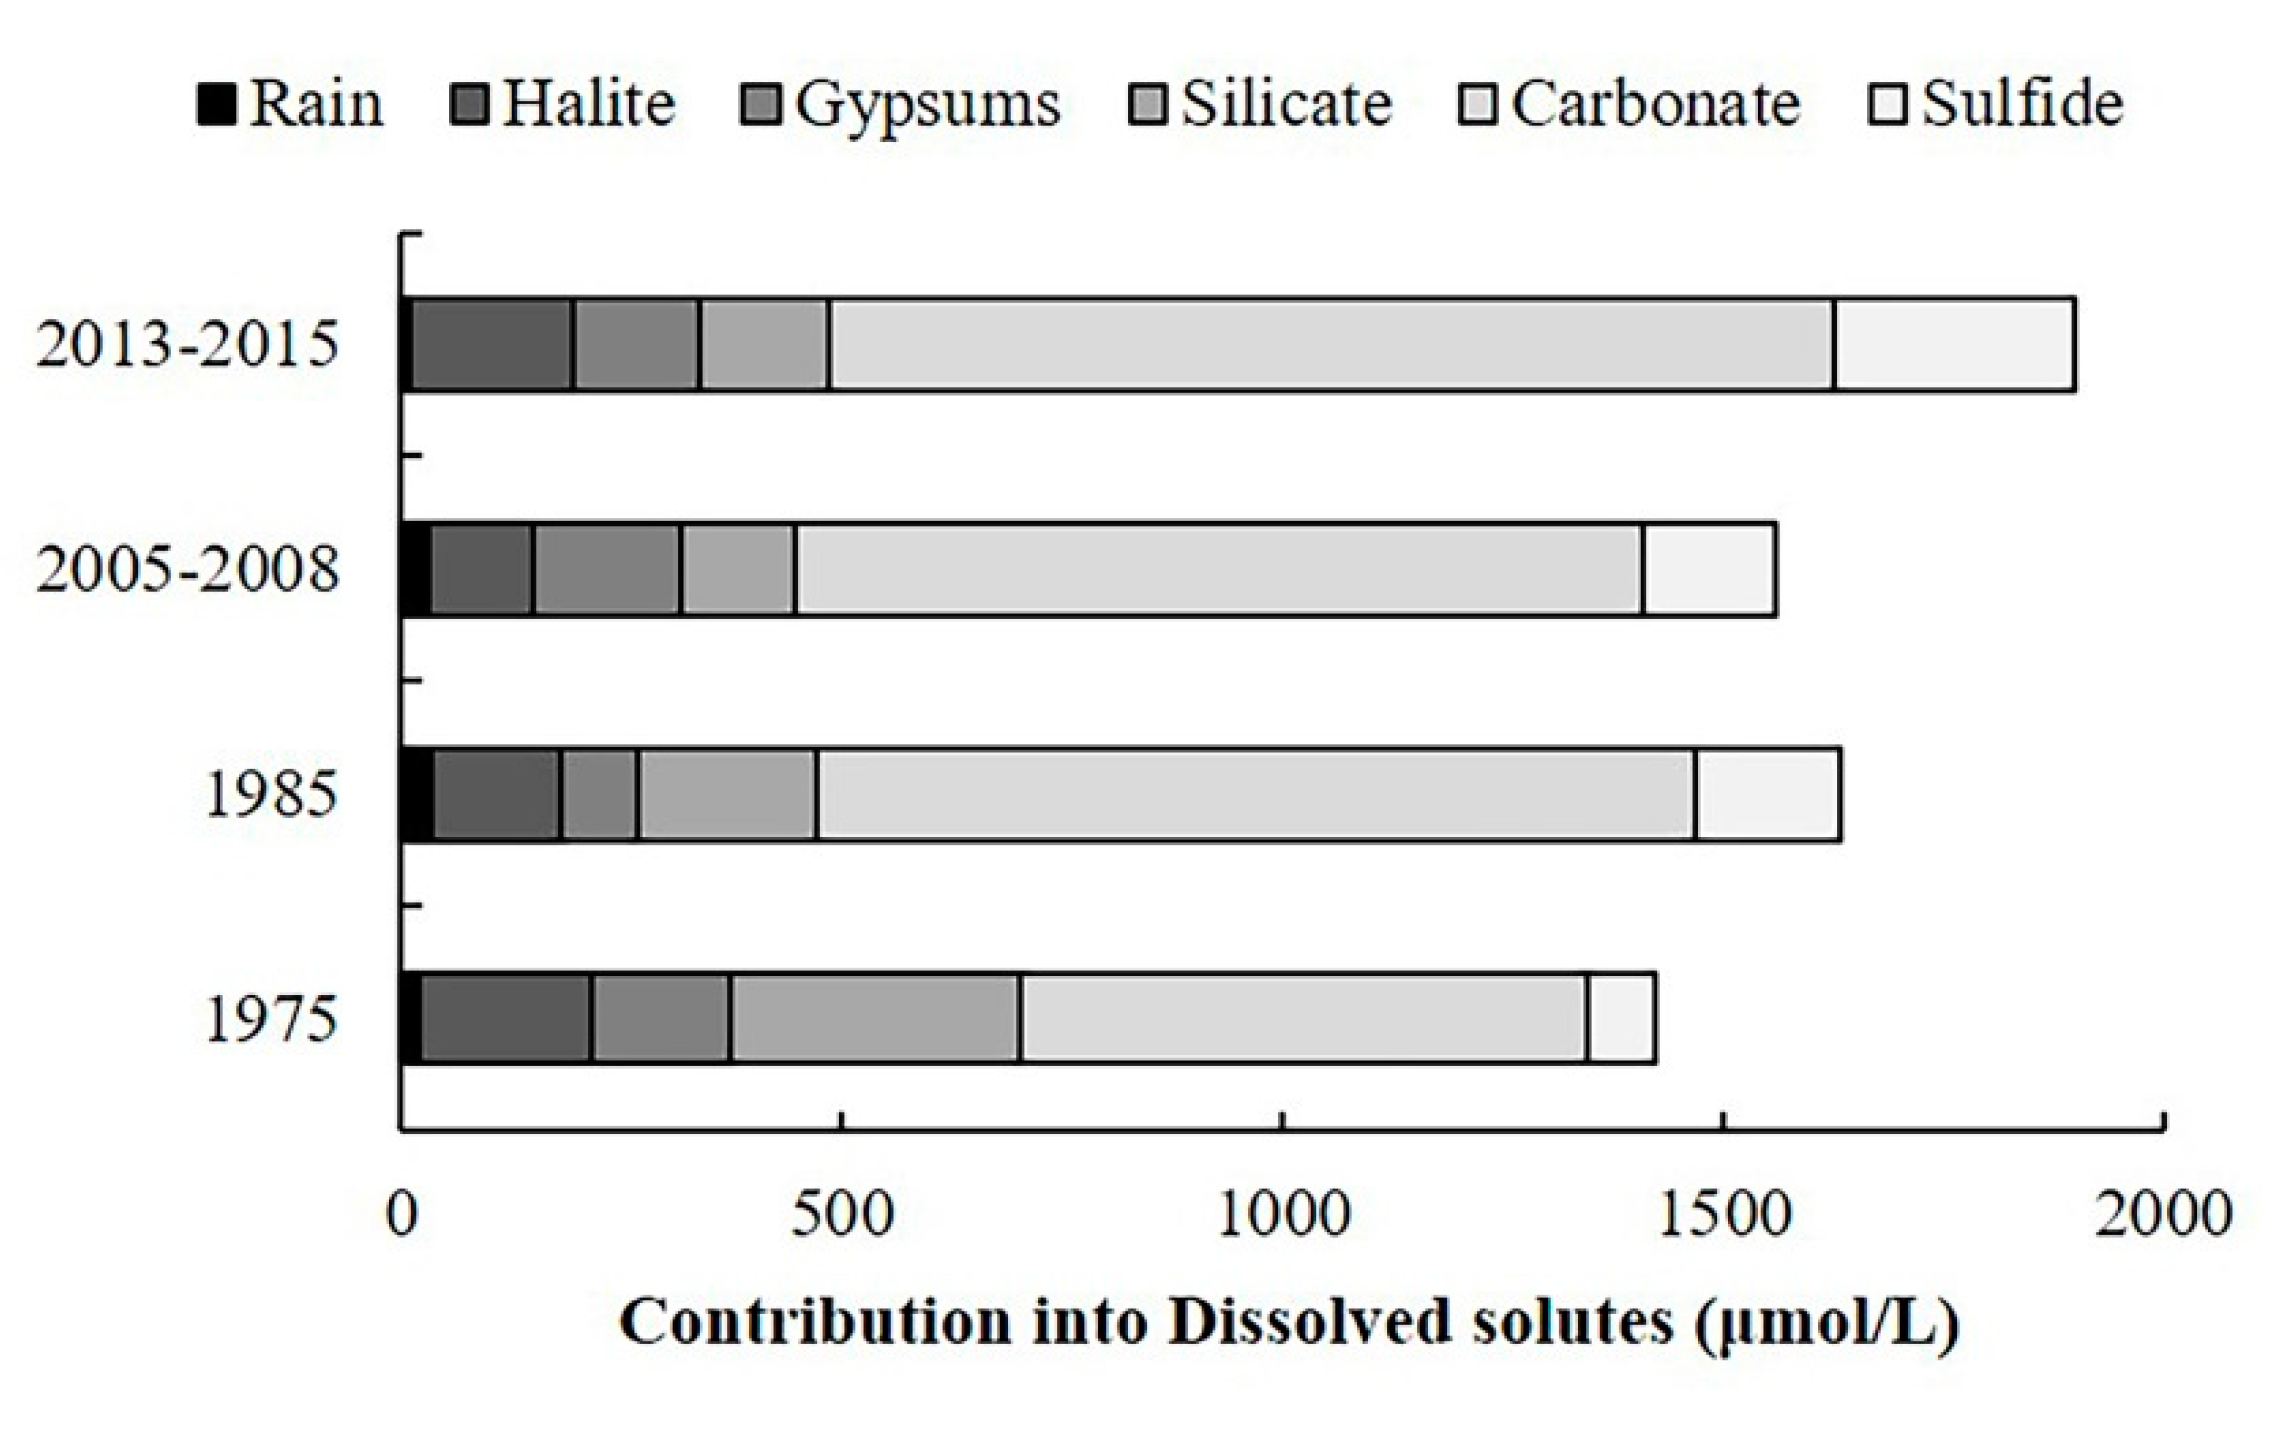
With respect to the contributions from different sources to the total ionic budget, we showed that various natural processes and mineral inputs affect the ion chemistry to varying degrees in this area (Figure 8). The contribution from rainwater declined gradually from 1985 to 2015, which was related to the reduced precipitation after 2000 [54]. Silicate rocks, such as clastic rock, shale, slate, and granite, are widely distributed in the basin (Figure 2). The processes of rainwater scouring and confluence can directly affect silicate weathering [55]. The reduction in precipitation after 2000 thus weakened the present contribution from silicate weathering compared to that in 1975. This decrease in weathering may also be the result of the decreased water–rock interaction along with the reduction in precipitation. However, the Yarlung Tsangpo River Basin experienced spatiotemporally varying precipitation changes and attendant runoff fluctuations during the 40-year period [46]. This may be the main cause for the irregular changes found in the dissolution of halite and gypsums over time. A significant negative correlation was found between the runoff and SO42− concentration in the river (Table 5), whereas the contribution from sulfides significantly increased during the studied period. This implies that, besides climate and associated runoff changes, the oxidation of sulfides may be affected by other processes such as mining activity, which has enhanced the exposure of sulfides in gangue and ore in mine tailings. In addition, the formation of sulfuric acid (H2SO4) from the enhanced process of sulfides oxidation can also facilitate the contribution of chemical weathering of other rocks to river water ions. Under this influence, an increasing trend was observed in the contribution of carbonate weathering. As a result, the TDS in the river exhibited a non-significant increasing trend in the Yarlung Tsangpo River Basin, although the correlation with runoff, which is a proxy for rainfall, was significantly negative.
4. Conclusions
Based on the field sample data collected in 2013 and 2015, and combined with the compiled historical data from previous studies, the spatial and temporal changes of ionic composition and their natural sources were estimated in the Yarlung Tsangpo River Basin. The results indicated that the average TDS in the basin was 138.6 mg/L, which increased slightly after 2000, especially in the upstream region. Carbonate weathering was the main source of the riverine dissolved ions, followed by silicate weathering. As a result, Ca2+ and HCO3− were found to be the dominant cation and anion in the river water, respectively, accounting for 53.3% and 77% of the total cation and anion content, respectively. Over the 40-year period, an increasing trend was found in the Ca2+, Mg2+, and HCO3− concentrations, especially in SO42–, which increased two-fold. This mainly occurred due to the significant increase in sulfide oxidation and carbonate weathering, which may be affected by both climate change and human activities. Conversely, the ion contribution to the river from silicate weathering and rainwater declined after 2000 due to the reduced rainfall and associated decreased water–rock interactions in the Yarlung Tsangpo River Basin.
Author Contributions
R.W., Z.Y. and Z.L. conceived and designed the experiments. R.W. and Z.Y. analyzed the data. R.W. and Z.L. wrote and revised the paper. All authors have read and agreed to the published version of the manuscript.
Funding
This research was funded by the National Nature Science Foundation of China, grant number 41601021, the Special Project of the Ministry of Science and Technology, grant number 2015FY111000, and the Strategic Priority Research Program of the Chinese Academy of Sciences, grant number XDA 20060202.
Acknowledgments
We thank Lei Wang, Yinghua Zhang and Liguang Jiang for collection of the water samples during the year 2013 and 2015. The authors also would like to thank the Associate Editor and anonymous reviewers for their helpful remarks.
Conflicts of Interest
The authors declare no conflict of interest.
References
- Gaillardet, J.; Duprè, B.; Louvat, P.; Allègre, C.J. Global silicate weathering and CO2 consumption rates deduced from the chemistry of large rivers. Chem. Geol. 1999, 159, 3–30. [Google Scholar] [CrossRef]
- Gibbs, R.J. Mechanisms controlling world water chemistry. Science 1970, 170, 1088–1990. [Google Scholar] [CrossRef]
- Galy, A.; France–Lanord, C. Weathering processes in the Ganges–Brahmaputra basin and the riverine alkalinity budget. Chem. Geol. 1999, 159, 31–60. [Google Scholar] [CrossRef]
- Amiotte–Suchet, P.; Probst, J.L.; Ludwig, W. Worldwide distribution of continental rock lithology: Implications for the atmospheric/soil CO2 uptake by continental weathering and alkalinity river transport to the oceans. Glob. Biogeochem. Cycles 2003, 17, 1038. [Google Scholar] [CrossRef] [Green Version]
- Li, S.Y.; Zhang, Q.F. Geochemistry of the upper Han River basin, China. 2: seasonal variations in major ion compositions and contribution of precipitation chemistry to the dissolved load. J. Hazard Mater. 2009, 170, 605–611. [Google Scholar] [CrossRef] [PubMed]
- Li, S.Y.; Lu, X.X.; Bush, R.T. Chemical weathering and CO2 consumption in the Lower Mekong River. Sci. Total Environ. 2014, 472, 162–177. [Google Scholar] [CrossRef]
- Jiang, L.G.; Yao, Z.J.; Wang, R.; Liu, Z.F.; Wang, L.; Wu, S.S. Hydrochemistry of the middle and upper reaches of the Yarlung Tsangpo River system: Weathering processes and CO2 consumption. Environ. Earth Sci. 2015, 74, 2369–2379. [Google Scholar] [CrossRef]
- Beaulieu, E.; Goddéris, Y.; Donnadieu, L.; Labat, D.; Roelandt, C. High sensitivity of the continental–weathering carbon dioxide sink to future climate change. Nat. Clim. Chang. 2012, 2, 346–349. [Google Scholar] [CrossRef]
- Moses, C.; Robinson, D.; Barlow, J. Methods for measuring rock surface weathering and erosion: A critical review. Earth Sci. Rev. 2014, 135, 141–161. [Google Scholar] [CrossRef]
- Meybeck, M. Global chemical weathering of surficial rocks estimated from river dissolved loads. Am. J. Sci. 1987, 287, 401–428. [Google Scholar] [CrossRef]
- Mortatti, J.; Probst, J.L. Silicate rock weathering and atmospheric/soil CO2 uptake in the Amazon basin estimated from river water geochemistry: Seasonal and spatial variations. Chem. Geol. 2003, 197, 177–196. [Google Scholar] [CrossRef] [Green Version]
- Gao, Q.Z.; Tao, Z.; Huang, X.K.; Nan, L.; Yu, K.F.; Wang, Z.G. Chemical weathering and CO2 consumption in the Xijiang River basin, South China. Geomorphology 2009, 106, 324–332. [Google Scholar] [CrossRef]
- Wu, W.H.; Zheng, H.B.; Yang, J.D.; Luo, C.; Zhou, B. Chemical weathering, atmospheric CO2 consumption, and the controlling factors in a subtropical metamorphic–hosted watershed. Chem. Geol. 2013, 356, 141–150. [Google Scholar] [CrossRef]
- Conceição, F.T.; Santos, C.M.; Sardinha, D.S.; Navarro, G.R.; Godoy, L.H. Chemical weathering rate, denudation rate, and atmospheric and soil CO2 consumption of Paraná flood basalts in São Paulo State, Brazil. Geomorphology 2015, 233, 41–51. [Google Scholar] [CrossRef]
- Wang, R.; Liu, Z.F.; Jiang, L.G.; Yao, Z.J.; Wang, J.B.; Ju, J.T. Comparison of surface water chemistry and weathering effects of two lake basins in the Changtang Nature Reserve, China. J. Environ. Sci. 2016, 41, 183–194. [Google Scholar] [CrossRef] [PubMed] [Green Version]
- Raymo, M.E.; Ruddiman, W.F. Tectonic forcing of late Cenozoic climate. Nature 1992, 359, 117–122. [Google Scholar] [CrossRef]
- Sarin, M.M.; Krishnaswamy, S.; Dilli, K.; Somayajulu, B.L.K.; Moore, W.S. Major ion chemistry of Ganga–Brahmaputra river system: Weathering processes and fluxes of the Bay of Bengal. Geochim. Cosmochim. Acta 1989, 53, 997–1009. [Google Scholar] [CrossRef]
- Singh, S.K.; Sarin, M.M.; France-Lanord, C. Chemical erosion in the eastern Himalaya: Major ion composition of the Brahmaputra and 13C of dissolved inorganic carbon. Geochim. Cosmochim. Acta 2005, 69, 3573–3588. [Google Scholar] [CrossRef]
- Hren, M.T.; Chamberlain, C.P.; Hilley, G.E.; Blisniuk, P.M.; Bookhagen, B. Major ion chemistry of the Yarlung Tsangpo–Brahmaputra river: Chemical weathering, erosion, and CO2 consumption in the southern Tibetan plateau and eastern syntaxis of the Himalaya. Geochim. Cosmochim. Acta 2007, 71, 2907–2935. [Google Scholar] [CrossRef] [Green Version]
- Tripathy, G.R.; Singh, S.K. Chemical erosion rates of river basins of the Ganga system in the Himalaya: Reanalysis based on inversion of dissolved major ions, Sr, and 87Sr/86Sr. Geochem. Geophys. Geosyst. 2010, 11, Q03013. [Google Scholar] [CrossRef]
- Hu, M.H.; Stallard, R.F.; Edmond, J.M. Major ion chemistry of some large Chinese rivers. Nature 1982, 298, 550–553. [Google Scholar]
- Chen, J.S.; Wang, F.Y.; Xia, X.H.; Zhang, L.T. Major element chemistry of the Changjiang (Yangtze River). Chem. Geol. 2002, 187, 231–255. [Google Scholar] [CrossRef]
- Chetelat, B.; Liu, C.Q.; Zhao, Z.Q.; Wang, Q.L.; Li, S.L.; Li, J. Geochemistry of the dissolved load of the Changjiang Basin rivers: Anthropogenic impacts and chemical weathering. Geochim. Cosmochim. Acta 2008, 72, 4254–4277. [Google Scholar] [CrossRef]
- Li, S.Y.; Zhang, Q.F. Geochemistry of the upper Han River basin, China, 1: Spatial distribution of major ion compositions and their controlling factors. Appl. Geochem. 2008, 23, 3535–3544. [Google Scholar] [CrossRef]
- Müller, B.; Berg, M.; Pernet–Coudrier, B.; Qi, W.X.; Liu, H.J. The geochemistry of the Yangtze River: Seasonality of concentrations and temporal trends of chemical loads. Glob. Biogeochem. Cycles 2012, 26, GB2028. [Google Scholar] [CrossRef]
- Jiang, L.G.; Yao, Z.J.; Liu, Z.F.; Wang, R.; Wu, S.S. Hydrochemistry and its controlling factors of rivers in the source region of the Yangtze River on the Tibetan Plateau. J. Geochem. Explor. 2015, 155, 76–83. [Google Scholar] [CrossRef]
- Chen, J.S.; Wang, F.Y.; Meybeck, M.; He, D.W.; Xia, X.H.; Zhang, L.T. Spatial and temporal analysis of water chemistry records (1958–2000) in the Huanghe (Yellow River) basin. Glob. Biogeochem. Cycles 2005, 19, GB3016.1–GB3016.24. [Google Scholar] [CrossRef]
- Li, J.Y.; Zhang, J. Chemical weathering processes and atmospheric CO2 consumption of Huanghe River and Changjiang River basins. Chin. Geogr. Sci. 2005, 15, 16–21. [Google Scholar] [CrossRef]
- Wang, L.; Zhang, L.J.; Cai, W.J.; Wang, B.S.; Yu, Z.G. Consumption of atmospheric CO2 via chemical weathering in the Yellow River basin: The Qinghai–Tibet Plateau is the main contributor to the high dissolved inorganic carbon in the Yellow River. Chem. Geol. 2016, 430, 34–44. [Google Scholar] [CrossRef] [Green Version]
- Pande, K.; Sarin, M.M.; Trivedi, J.R.; Krishnaswami, S.; Sharma, K.K. The Indus system (India–Pakistan): Major ion chemistry, uranium and strontium isotopes. Chem. Geol. 1994, 116, 245–259. [Google Scholar] [CrossRef]
- Karim, A.; Veizer, J. Weathering processes in the Indus River Basin: Implications from riverine carbon, sulfur, oxygen, and strontium isotopes. Chem. Geol. 2000, 170, 153–177. [Google Scholar] [CrossRef]
- Dalai, T.K.; Krishnaswami, S.; Sarin, M.M. Major ion chemistry in the headwaters of the Yamuna river system: Chemical weathering, its temperature dependence and CO2 consumption in the Himalaya. Geochim. Cosmochim. Acta 2002, 66, 3397–3416. [Google Scholar] [CrossRef]
- Moon, S.; Huh, Y.; Qin, J.; Pho, N.V. Chemical weathering in the Hong (Red) River basin: Rates of silicate weathering and their controlling factors. Geochim. Cosmochim. Acta 2007, 71, 1411–1430. [Google Scholar] [CrossRef]
- Huang, X.; Sillanpaa, M.; Gjessing, E.T.; Peraniemi, S.; Vogt, R.D. Water quality in the southern Tibetan Plateau: Chemical evaluation of the Yarlung Tsangpo (Brahmaputra). River Res. Appl. 2011, 27, 113–121. [Google Scholar] [CrossRef]
- Qin, J.H.; Huh, Y.; Edmond, J.M.; Du, G.; Ran, J. Chemical and physical weathering in the Min Jiang, a headwater tributary of the Yangtze River. Chem. Geol. 2006, 227, 53–69. [Google Scholar] [CrossRef]
- Tibetan Plateau comprehensive expedition of the Chinese Academy of Sciences. Tibetan Water Conservation; Science Press: Beijing, China, 1981. (In Chinese) [Google Scholar]
- Munetsugu, K.; Takashi, N. Salt concentrations and chemical types of lake, river, snow, and hot spring waters from the Tibetan Plateau. Jpn. J. Limnol. 1989, 50, 93–104. [Google Scholar]
- Meybeck, M.; Helmer, R. The quality of rivers: From pristine stage to global pollution. Palaeogeogr. Palaeoclimatol. Palaeoecol. 1989, 175, 283–309. [Google Scholar] [CrossRef]
- Meybeck, M. Concentrations des eaux fluviales en elements majeurs et apports en solution aux oceans. Rev Geol. Dynam. Geogr. Phys. 1979, 21, 5–46. [Google Scholar]
- Han, G.L.; Tang, X.; Xu, Z.F. Fluvial geochemistry of rivers draining karst terrain in South west China. J. Asian Earth Sci. 2010, 38, 65–75. [Google Scholar] [CrossRef]
- Rashid, I.; Romshoo, S.A. Impact of anthropogenic activities on water quality of Lidder River in Kashmir Himalayas. Environ. Monit. Assess. 2013, 185, 4705–4719. [Google Scholar] [CrossRef]
- Wang, R.; Yao, Z.J.; Liu, Z.F.; Wu, S.S.; Jiang, L.G. Spatial–temporal patterns of major ion chemistry and its controlling factors in the Manasarovar Basin, Tibet. J. Geogr. Sci. 2015, 25, 687–700. [Google Scholar]
- Liu, J.; Zhao, Y.; Li, Z.; Guo, H. Quantitative source apportionment of water solutes and CO2 consumption of the whole Yarlung Tsangpo River basin in Tibet, China. Environ. Sci. Pollut. R. 2019, 26, 28243–28255. [Google Scholar] [CrossRef] [PubMed]
- Qu, B.; Zhang, Y.; Kang, S.; Sillanpaa, M. Water chemistry of the southern Tibetan Plateau: An assessment of the Yarlung Tsangpo river basin. Environ. Earth Sci. 2017, 76, 74. [Google Scholar] [CrossRef]
- Li, F.; Xu, Z.; Feng, Y.; Liu, M.; Liu, W. Changes of land cover in the Yarlung Tsangpo River basin from 1985 to 2005. Environ. Earth Sci. 2013, 68, 181–188. [Google Scholar] [CrossRef]
- Cuo, L.; Li, N.; Liu, Z.; Ding, J.; Liang, L.; Zhang, Y.; Gong, T. Warming and human activities induced changes in the Yarlung Tsangpo basin of the Tibetan plateau and their influences on streamflow. J. Hydrol. Reg. Stud. 2019, 25, 100625. [Google Scholar] [CrossRef]
- Wang, D.X.; Li, H.Z.; Ding, G.A. The preliminary discussion on atmospheric environment background in Mt. Everest area. In Scientific Investigating Report of Mt. Everest Area; Science Press: Beijing, China, 1980; pp. 171–188. (In Chinese) [Google Scholar]
- Zhang, D.D.; Peart, M.; Jim, C.Y.; He, Y.Q.; Li, B.S.; Chen, J.A. Precipitation chemistry of Lhasa and other remote towns. Tibet. Atmos. Environ. 2003, 37, 231–240. [Google Scholar] [CrossRef] [Green Version]
- Stallard, R.F.; Edmond, J.M. Geochemistry of the Amazon 1. Precipitation chemistry and the marine contribution to the dissolved load at the time of peak discharge. J. Geophys. Res. 1981, 86, 9844–9858. [Google Scholar] [CrossRef]
- Drever, J.I. The Geochemistry of Natural Waters: Surface and Groundwater Environments; Prentice Hall: Upper Saddle River, NJ, USA, 1997. [Google Scholar]
- Zhao, P.; Dor, J.; Jian, J. A new geochemical model of the Yangbajin geothermal field, Tibet. In Proceedings of the World Geothermal Congress, Kyushu-Tohoku, Japan, 28 May 2000. [Google Scholar]
- Noh, H.; Huh, Y.; Qin, J.H.; Ellis, A. Chemical weathering in the three rivers region of Eastern Tibet. Geochim. Cosmochim. Acta 2009, 73, 1857–1877. [Google Scholar] [CrossRef]
- Wu, W.H.; Xu, S.J.; Yang, J.D.; Yin, H.W. Silicate weathering and CO2 consumption deduced from the seven Chinese rivers originating in the Qinghai–Tibet Plateau. Chem. Geol. 2008, 249, 307–320. [Google Scholar] [CrossRef]
- Wang, R.; Yao, Z.J.; Liu, Z.F.; Wu, S.S.; Jiang, L.G. Changes in climate and runoff in the middle course area of the Yarlung Zangbo River Basin. Resour. Sci. 2015, 37, 0619–0628. (In Chinese) [Google Scholar]
- Goldsmith, S.T.; Harmon, R.S.; Lyons, W.B. Evaluation of controls on silicate eathering in tropical mountainous rivers: Insights from the Isthmus of Panama. Geology 2015, 43, 563–566. [Google Scholar] [CrossRef]
Figure 1.
Map of the Yarlung Tsangpo River Basin showing the (a) location, (b) elevation, and (c) sampling locations in 2015 (elevation data were obtained from the Shuttle Radar Topography Mission (SRTM) 90 m digital elevation data downloaded from the Consultative Group for International Agricultural Research (CGIAR)-Consortium for Spatial Information (http://srtm.csi.cgiar.org/)).

Figure 2.
Geologic map of the Yarlung Tsangpo River Basin from the Geological Atlas of China (2001).
Figure 2.
Geologic map of the Yarlung Tsangpo River Basin from the Geological Atlas of China (2001).

Figure 3.
Ternary diagrams showing the relative abundances of (a) cations and (b) anions on a molar basis.
Figure 3.
Ternary diagrams showing the relative abundances of (a) cations and (b) anions on a molar basis.

Figure 4.
NO3− concentration along the mainstream of the Yarlung Tsangpo River during different periods: (a) September 2008 and (b) September 2015 (μmol/L).
Figure 4.
NO3− concentration along the mainstream of the Yarlung Tsangpo River during different periods: (a) September 2008 and (b) September 2015 (μmol/L).

Figure 5.
Diagram of dissolved Na+ against Si concentrations after correction for atmospheric input and evaporite weathering for all sampling periods (except 1975 and 1985) (μmol/L).
Figure 5.
Diagram of dissolved Na+ against Si concentrations after correction for atmospheric input and evaporite weathering for all sampling periods (except 1975 and 1985) (μmol/L).

Figure 6.
Scatter diagrams showing the relationship between Ca2+ + Mg2+ vs. (a) SO42− + HCO3− and (b) HCO3− after correction for atmospheric input for all sampling periods (meq/L).
Figure 6.
Scatter diagrams showing the relationship between Ca2+ + Mg2+ vs. (a) SO42− + HCO3− and (b) HCO3− after correction for atmospheric input for all sampling periods (meq/L).

Figure 7.
Scatter diagrams showing the relationship of (a) Ca2+ + Mg2+ vs. Na+ + K+ and (b) Ca2+ vs. Mg2+ after correction for atmospheric input, evaporites, and sources of non-silicate Na+ input for all sampling periods (μmol/L).
Figure 7.
Scatter diagrams showing the relationship of (a) Ca2+ + Mg2+ vs. Na+ + K+ and (b) Ca2+ vs. Mg2+ after correction for atmospheric input, evaporites, and sources of non-silicate Na+ input for all sampling periods (μmol/L).

Figure 8.
Bar chart showing the contribution of the different natural sources to the riverine solute load for different periods during 1975 to 2015 (μmol/L).
Figure 8.
Bar chart showing the contribution of the different natural sources to the riverine solute load for different periods during 1975 to 2015 (μmol/L).


Table 1.
Hydrological settings of the Yarlung Tsangpo River Basin.
| Station | River | Elevation (m) | Distance Downstream (km) | Drainage Area (104 km2) | Annual Runoff (108 m3) |
|---|---|---|---|---|---|
| Lazi | main stream | 3974 | 619.4 | 4.34 | 53.6 |
| Nugesha | main stream | 3839 | 833.7 | 7.46 | 163.8 |
| Yangcun | main stream | 3590 | 1049.5 | 13.00 | 304.7 |
| Nuxia | main stream | 2918 | 1333.2 | 16.81 | 585.1 |
| Shigatse | Nianchu River | 3836 | 215.5 | 1.42 | 16.9 |
| Lhasa | Lhasa River | 3656 | 408.1 | 2.59 | 97.1 |
| Gengzhang | Nyang River | 3062 | 206.3 | 1.78 | 145.8 |
Table 2.
Summary of the chemical components of the mainstream and tributaries in the Yalung Tsangpo River Basin (annual mean value).
Table 2.
Summary of the chemical components of the mainstream and tributaries in the Yalung Tsangpo River Basin (annual mean value).
| pH | TDS mg/L | Ca2+ μmol/L | Mg2+ μmol/L | Na+ μmol/L | K+ μmol/L | HCO3− μmol/L | SO42− μmol/L | Cl− μmol/L | NO3− μmol/L | ||
|---|---|---|---|---|---|---|---|---|---|---|---|
| Mainstream | Average | 8.1 | 142.9 | 783.3 | 240.0 | 438.3 | 40.0 | 1930.0 | 305.8 | 177.5 | 46.8 |
| SD | 0.4 | 18.7 | 110.6 | 41.4 | 115.3 | 7.1 | 466.5 | 71.3 | 40.7 | 49.8 | |
| Upstream | Average | 8.1 | 156.0 | 893.3 | 275.0 | 433.3 | 43.0 | 2107.5 | 325.0 | 198.3 | 27.7 |
| SD | 0.4 | 37.8 | 231.0 | 106.1 | 116.9 | 8.4 | 556.6 | 153.0 | 79.3 | 22.6 | |
| Midstream | Average | 8.1 | 146.7 | 758.3 | 246.7 | 499.2 | 37.0 | 1953.3 | 332.5 | 178.3 | 63.7 |
| SD | 0.4 | 25.1 | 126.5 | 58.6 | 173.4 | 4.5 | 634.6 | 129.1 | 27.1 | 79.1 | |
| Downstream | Average | 8.1 | 119.2 | 617.5 | 192.5 | 360.0 | 33.3 | 1647.5 | 271.3 | 122.5 | 31.7 |
| SD | 0.6 | 11.2 | 73.3 | 15.5 | 134.7 | 5.8 | 532.1 | 77.9 | 35.9 | 19.7 | |
| Dogxung Tsangpo | Average | 8.2 | 190.7 | 1151.0 | 291.5 | 594.0 | 35.0 | 1661.0 | 700.5 | 138.0 | 37.5 |
| SD | 0.3 | 108.3 | 917.9 | 252.8 | 284.1 | 12.9 | 437.8 | 618.5 | 102.0 | 50.9 | |
| Nianchu | Average | 8.2 | 218.0 | 1188.0 | 489.5 | 541.0 | 38.8 | 2513.0 | 635.0 | 243.0 | 52.0 |
| SD | 0.4 | 26.5 | 251.5 | 139.6 | 249.6 | 8.9 | 492.9 | 283.3 | 72.4 | 32.1 | |
| Lhasa | Average | 8.2 | 125.5 | 632.0 | 212.5 | 383.0 | 32.5 | 1849.0 | 238.0 | 170.0 | 32.1 |
| SD | 0.5 | 17.1 | 123.2 | 48.9 | 241.7 | 7.1 | 262.3 | 110.1 | 100.0 | 32.5 | |
| Nyang | Average | 7.9 | 72.5 | 345.8 | 120.0 | 238.3 | 35.0 | 946.7 | 138.3 | 200.0 | 19.7 |
| SD | 1.4 | 24.4 | 205.2 | 28.4 | 140.3 | 28.3 | 821.4 | 35.0 | 186.1 | 7.9 | |
| Po Tsangpo | Average | 7.5 | 100.7 | 615.0 | 166.7 | 106.7 | 65.0 | 1426.7 | 245.0 | 30.0 | 22.4 |
| SD | 2.5 | 42.4 | 194.5 | 155.6 | 21.2 | 12.1 | 226.3 | 254.6 | 42.4 | 24.6 |
Table 3.
Ion chemistry for the mainstream and tributaries in the Yalung Tsangpo River Basin during different periods.
Table 3.
Ion chemistry for the mainstream and tributaries in the Yalung Tsangpo River Basin during different periods.
| River | pH | TDS mg/L | Ca2+ μmol/L | Mg2+ μmol/L | Na+ μmol/L | K+ μmol/L | HCO3− μmol/L | SO42− μmol/L | Cl− μmol/L | NO3− μmol/L | |
|---|---|---|---|---|---|---|---|---|---|---|---|
| 1975 a | Mainstream | 7.7 | 124.7 | 625 | 200 | 640 | 1550 | 270 | 200 | ||
| Dx Tsangpo b | 7.9 | 98.7 | 485 | 140 | 580 | 1260 | 200 | 140 | |||
| Nianchu | 7.7 | 208.4 | 905 | 605 | 1000 | 3070 | 295 | 350 | |||
| Lhasa | 7.8 | 126.3 | 535 | 220 | 760 | 1760 | 180 | 310 | |||
| Nyang | 7.0 | 62.0 | 230 | 145 | 350 | 530 | 200 | 160 | |||
| Po Tsangpo | 5.7 | 67.0 | 465 | 95 | 140 | 980 | 115 | 70 | |||
| 1985 | Mainstream | 7.7 | 124.5 | 790 | 195 | 340 | 50 | 1810 | 190 | 160 | |
| Dx Tsangpo | |||||||||||
| Nianchu | 8.2 | 199.1 | 1215 | 390 | 370 | 30 | 2110 | 655 | 280 | ||
| Lhasa | |||||||||||
| Nyang | |||||||||||
| Po Tsangpo | |||||||||||
| 2005 | Mainstream | 7.8 | 164.6 | 795 | 295 | 360 | 40 | 2770 | 290 | 110 | 13.8 |
| Dx Tsangpo | 8.0 | 375.4 | 2755 | 740 | 240 | 20 | 2300 | 1775 | 10 | 2.0 | |
| Nianchu | |||||||||||
| Lhasa | 8.0 | 160.3 | 685 | 195 | 350 | 40 | 3400 | 90 | 180 | 2.0 | |
| Nyang | 7.6 | 84.3 | 390 | 110 | 170 | 30 | 1680 | 80 | 60 | 14.2 | |
| Po Tsangpo | 108.0 | 640 | 90 | 70 | 80 | 2000 | 145 | 10 | 5.0 | ||
| 2008 | Mainstream | 8.6 | 145.9 | 810 | 230 | 360 | 30 | 1940 | 335 | 190 | 25.0 |
| Dx Tsangpo | 8.7 | 143.1 | 900 | 180 | 400 | 30 | 1440 | 480 | 70 | 10.3 | |
| Nianchu | 8.7 | 230.2 | 1300 | 450 | 350 | 30 | 2650 | 750 | 150 | 47.9 | |
| Lhasa | 8.4 | 108.5 | 630 | 210 | 180 | 20 | 1540 | 245 | 80 | 23.6 | |
| Nyang | |||||||||||
| Po Tsangpo | |||||||||||
| 2013 c | Mainstream | 8.3 | 165.0 | 960 | 283 | 500 | 40 | 2040 | 378 | 230 | 121.0 |
| Dx Tsangpo | 8.2 | 191.3 | 973 | 230 | 905 | 40 | 1925 | 608 | 205 | 112.5 | |
| Nianchu | 7.8 | 226.4 | 1290 | 493 | 485 | 45 | 2480 | 695 | 225 | 85.9 | |
| Lhasa | 8.0 | 125.4 | 723 | 233 | 340 | 35 | 1460 | 325 | 165 | 78.3 | |
| Nyang | |||||||||||
| Po Tsangpo | |||||||||||
| 2015 c | Mainstream | 8.6 | 132.6 | 720 | 238 | 430 | 40 | 1470 | 373 | 175 | 27.4 |
| Dx Tsangpo | 8.4 | 145.0 | 643 | 168 | 845 | 50 | 1380 | 440 | 265 | 25.5 | |
| Nianchu | 8.5 | 225.7 | 1230 | 510 | 500 | 50 | 2255 | 780 | 210 | 22.1 | |
| Lhasa | 8.95 | 106.9 | 588 | 205 | 285 | 35 | 1085 | 350 | 115 | 24.4 | |
| Nyang | 9 | 71.1 | 418 | 105 | 195 | 40 | 630 | 135 | 380 | 25.3 | |
| Po Tsangpo | 9.2 | 127.0 | 740 | 315 | 110 | 50 | 1300 | 475 | 10 | 39.8 |
a Na+ concentration in 1975 represents the content of (Na+ + K+). b Dx Tsangpo is the Dogxung Tsangpo. c Ion chemistry in 2013 and 2015 are the average value of two sampling periods.
Table 4.
Solute chemistry of rainwater in or near the Yarlung Tsangpo River Basin (μmol/L).
| Year | Location | Ca2+ | Mg2+ | Na+ | K+ | HCO3− | SO42− | Cl− | NO3− |
|---|---|---|---|---|---|---|---|---|---|
| 1975 [47] | Nyalam County | 77.5 | 15.2 | 37.8 | 24.1 | 155.8 | 30 | 31.5 | - |
| 1987–988 [48] | Lhasa | 75.15 | 2.83 | 88.96 | 14.8 | 288.9 | 1.235 | 21.7 | 1.96 |
| 1998–2000 [48] | Lhasa | 98.7 | 5.5 | 11.2 | 5.14 | 231.7 | 2.6 | 9.7 | 6.9 |
| 2015 | Gongbogvamda | 27.35 | 2.2 | 5.1 | 0.9 | 34.8 | 8.65 | 13 | 16.34 |
| Ca2+/Cl− | Mg2+/Cl− | Na+/Cl− | K+/Cl− | HCO3−/Cl− | SO42−/Cl− | NO3−/Cl− | |||
| 1975 | 2.46 | 0.48 | 1.20 | 0.77 | 4.95 | 0.95 | - | - | |
| 1987–1988 | 3.46 | 0.13 | 4.10 | 0.68 | 13.31 | 0.06 | - | 0.09 | |
| 1998–2000 | 10.18 | 0.57 | 1.15 | 0.53 | 23.89 | 0.27 | - | 0.71 | |
| 2015 | 2.10 | 0.17 | 0.39 | 0.07 | 2.68 | 0.67 | - | 1.26 | |
Table 5.
Pearson correlations of major ions and runoff in the basin.
| TDS | Ca2+ | Mg2+ | Na+ | K+ | HCO3− | SO42− | Cl− | Runoff | |
|---|---|---|---|---|---|---|---|---|---|
| TDS | - | ||||||||
| Ca2+ | 0.96 * | - | |||||||
| Mg2+ | 0.92 * | 0.86 * | - | ||||||
| Na+ | 0.48 | 0.28 | 0.65 * | - | |||||
| K+ | 0.38 | 0.30 | 0.39 | 0.69 * | - | ||||
| HCO3− | 0.80 * | 0.64 * | 0.66 * | 0.48 | 0.22 | - | |||
| SO42− | 0.81 * | 0.91 * | 0.76 * | 0.13 | 0.30 | 0.32 | - | ||
| Cl− | 0.22 | 0.15 | 0.32 | 0.59 * | 0.49 | 0.11 | 0.04 | - | |
| Runoff | −0.95 * | −0.90 * | −0.93* | −0.60 * | −0.33 | −0.69 * | −0.79 * | 0.35 | - |
* Correlation is significant at the 95% level.
© 2020 by the authors. Licensee MDPI, Basel, Switzerland. This article is an open access article distributed under the terms and conditions of the Creative Commons Attribution (CC BY) license (http://creativecommons.org/licenses/by/4.0/).
Share and Cite
MDPI and ACS Style
Wang, R.; Yao, Z.; Liu, Z. Change of Contributions from Different Natural Processes to the Ionic Budget in the Yarlung Tsangpo River. Water 2020, 12, 616. https://doi.org/10.3390/w12030616
AMA Style
Wang R, Yao Z, Liu Z. Change of Contributions from Different Natural Processes to the Ionic Budget in the Yarlung Tsangpo River. Water. 2020; 12(3):616. https://doi.org/10.3390/w12030616
Chicago/Turabian StyleWang, Rui, Zhijun Yao, and Zhaofei Liu. 2020. "Change of Contributions from Different Natural Processes to the Ionic Budget in the Yarlung Tsangpo River" Water 12, no. 3: 616. https://doi.org/10.3390/w12030616
Note that from the first issue of 2016, this journal uses article numbers instead of page numbers. See further details here.