Seasonal Groundwater Quality Status and Nitrogen Contamination in the Shallow Aquifer System of the Kathmandu Valley, Nepal

 ,
,
Abstract
:1. Introduction
2. Methods
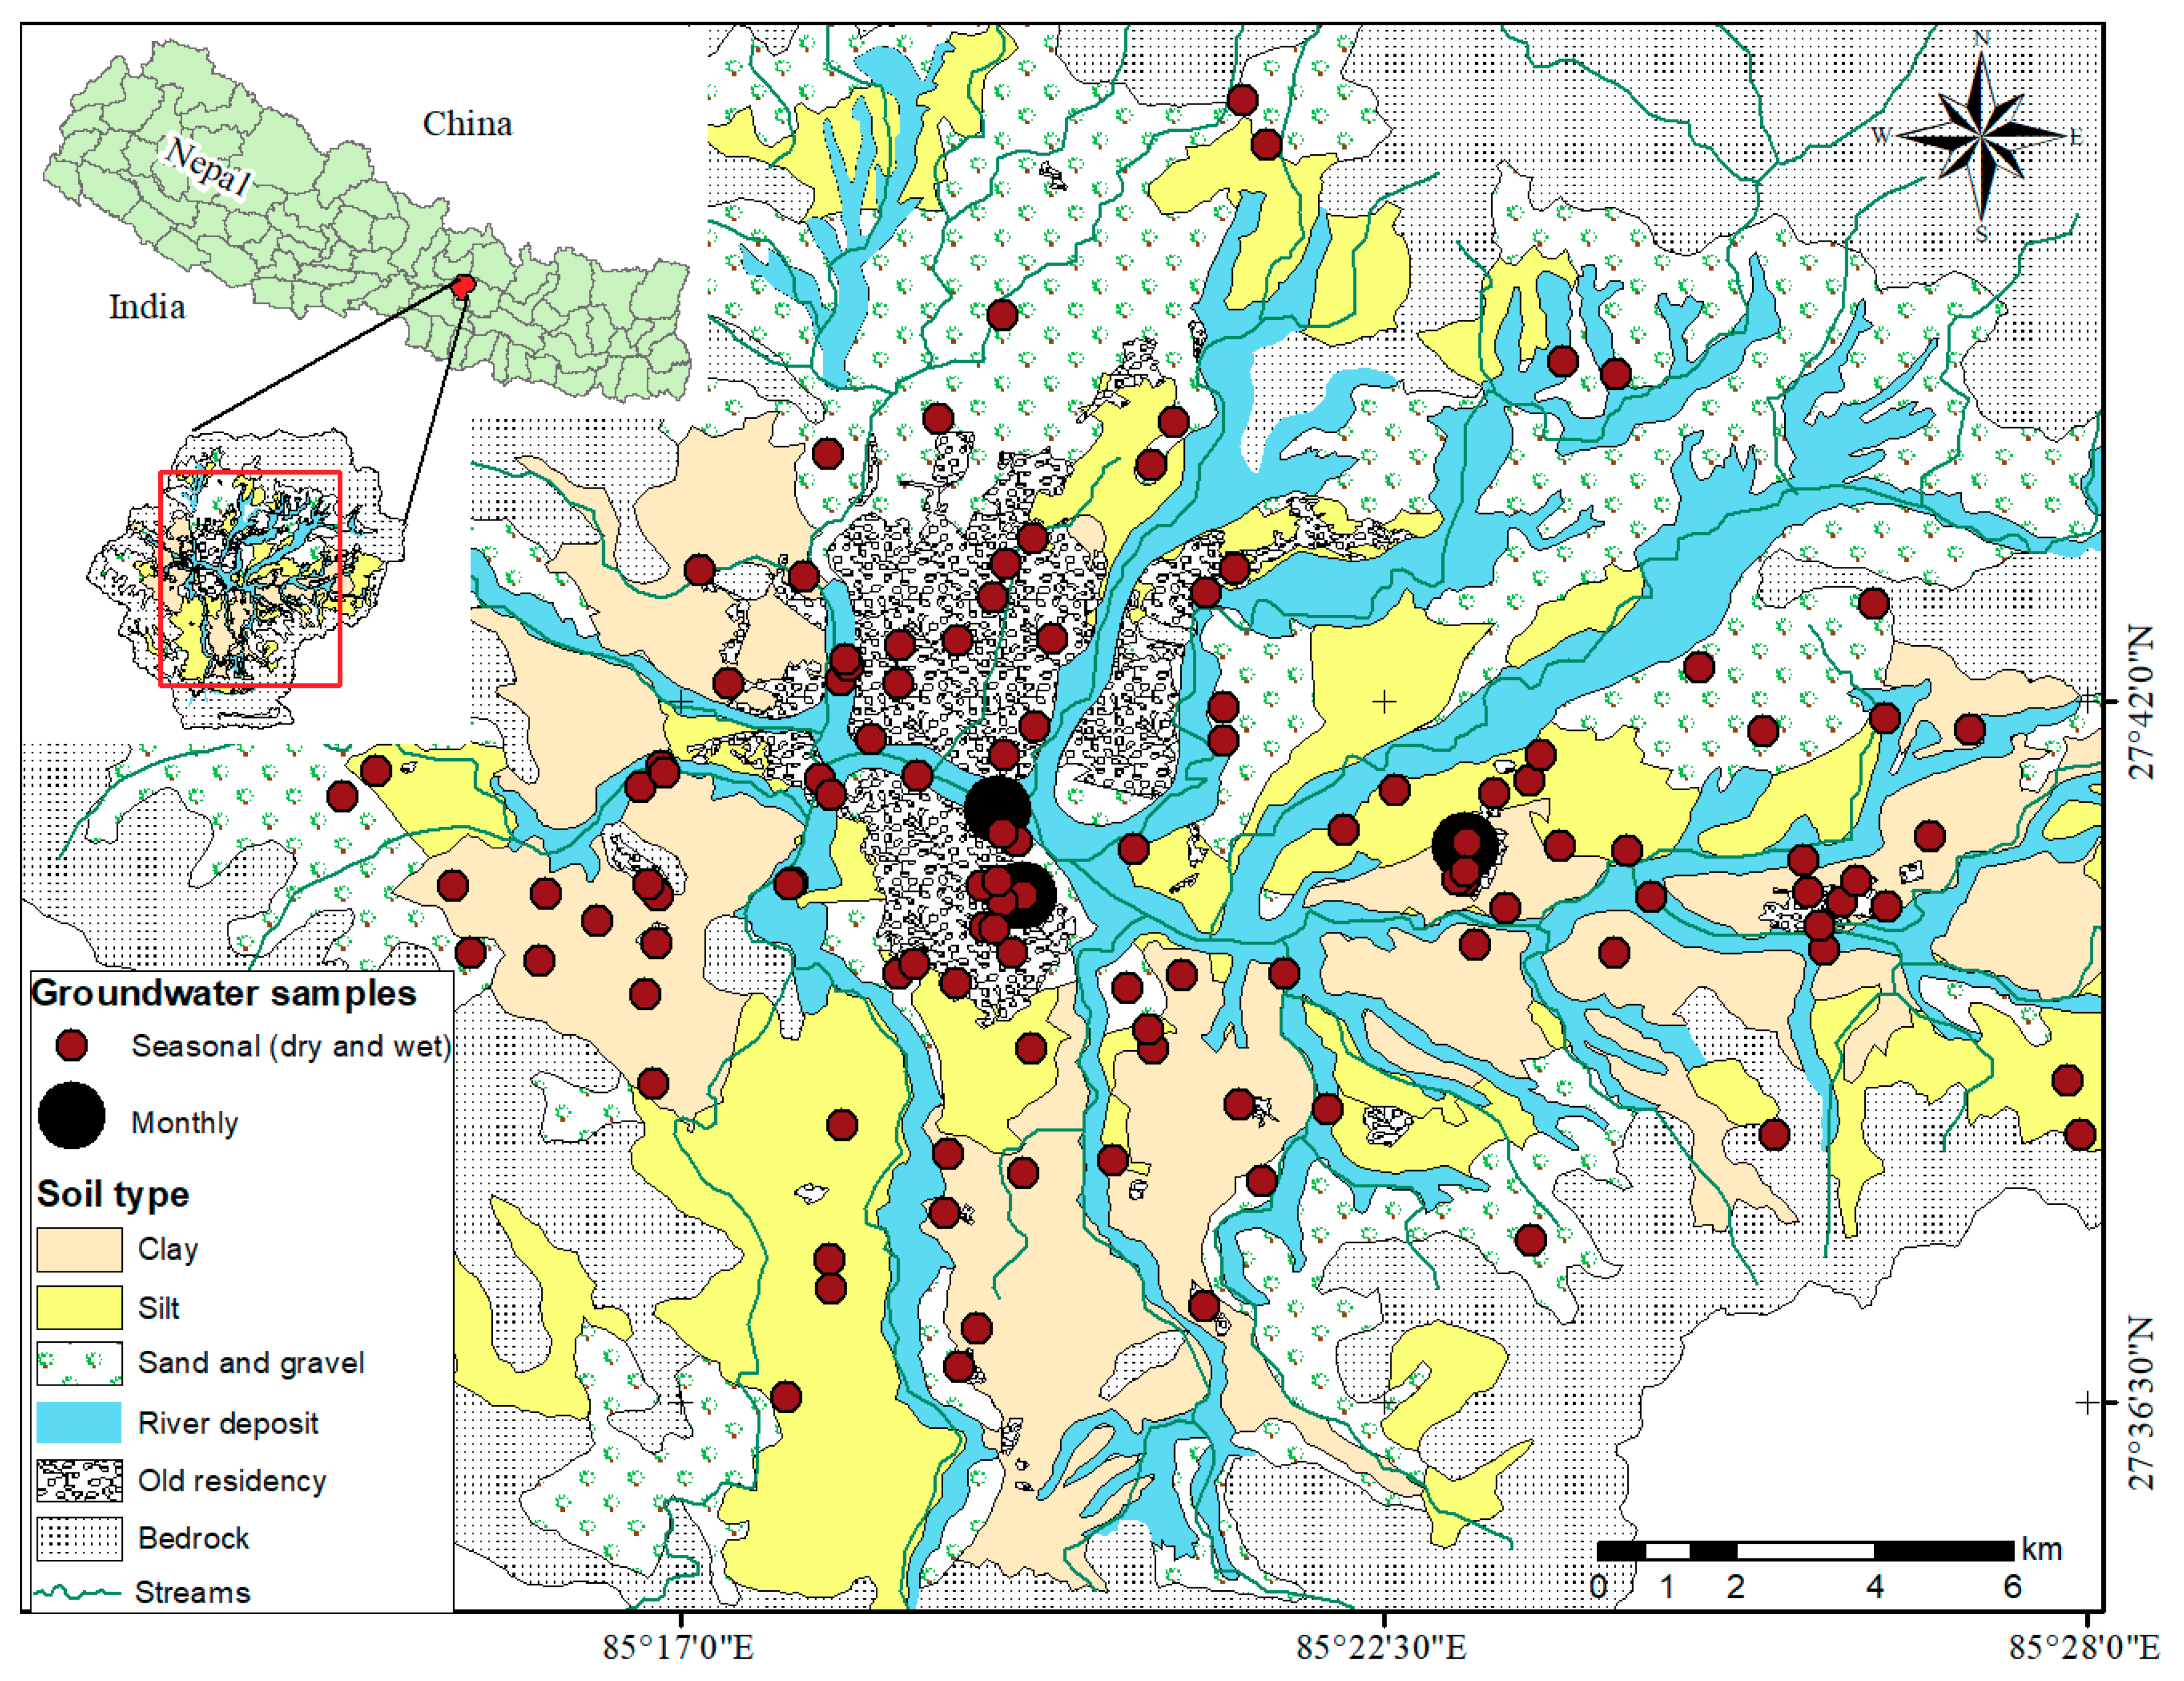
2.1. Study Area
2.2. Water Sampling and Data Collection
2.3. Measurement Equipment
2.4. Statistical Analysis
3. Results
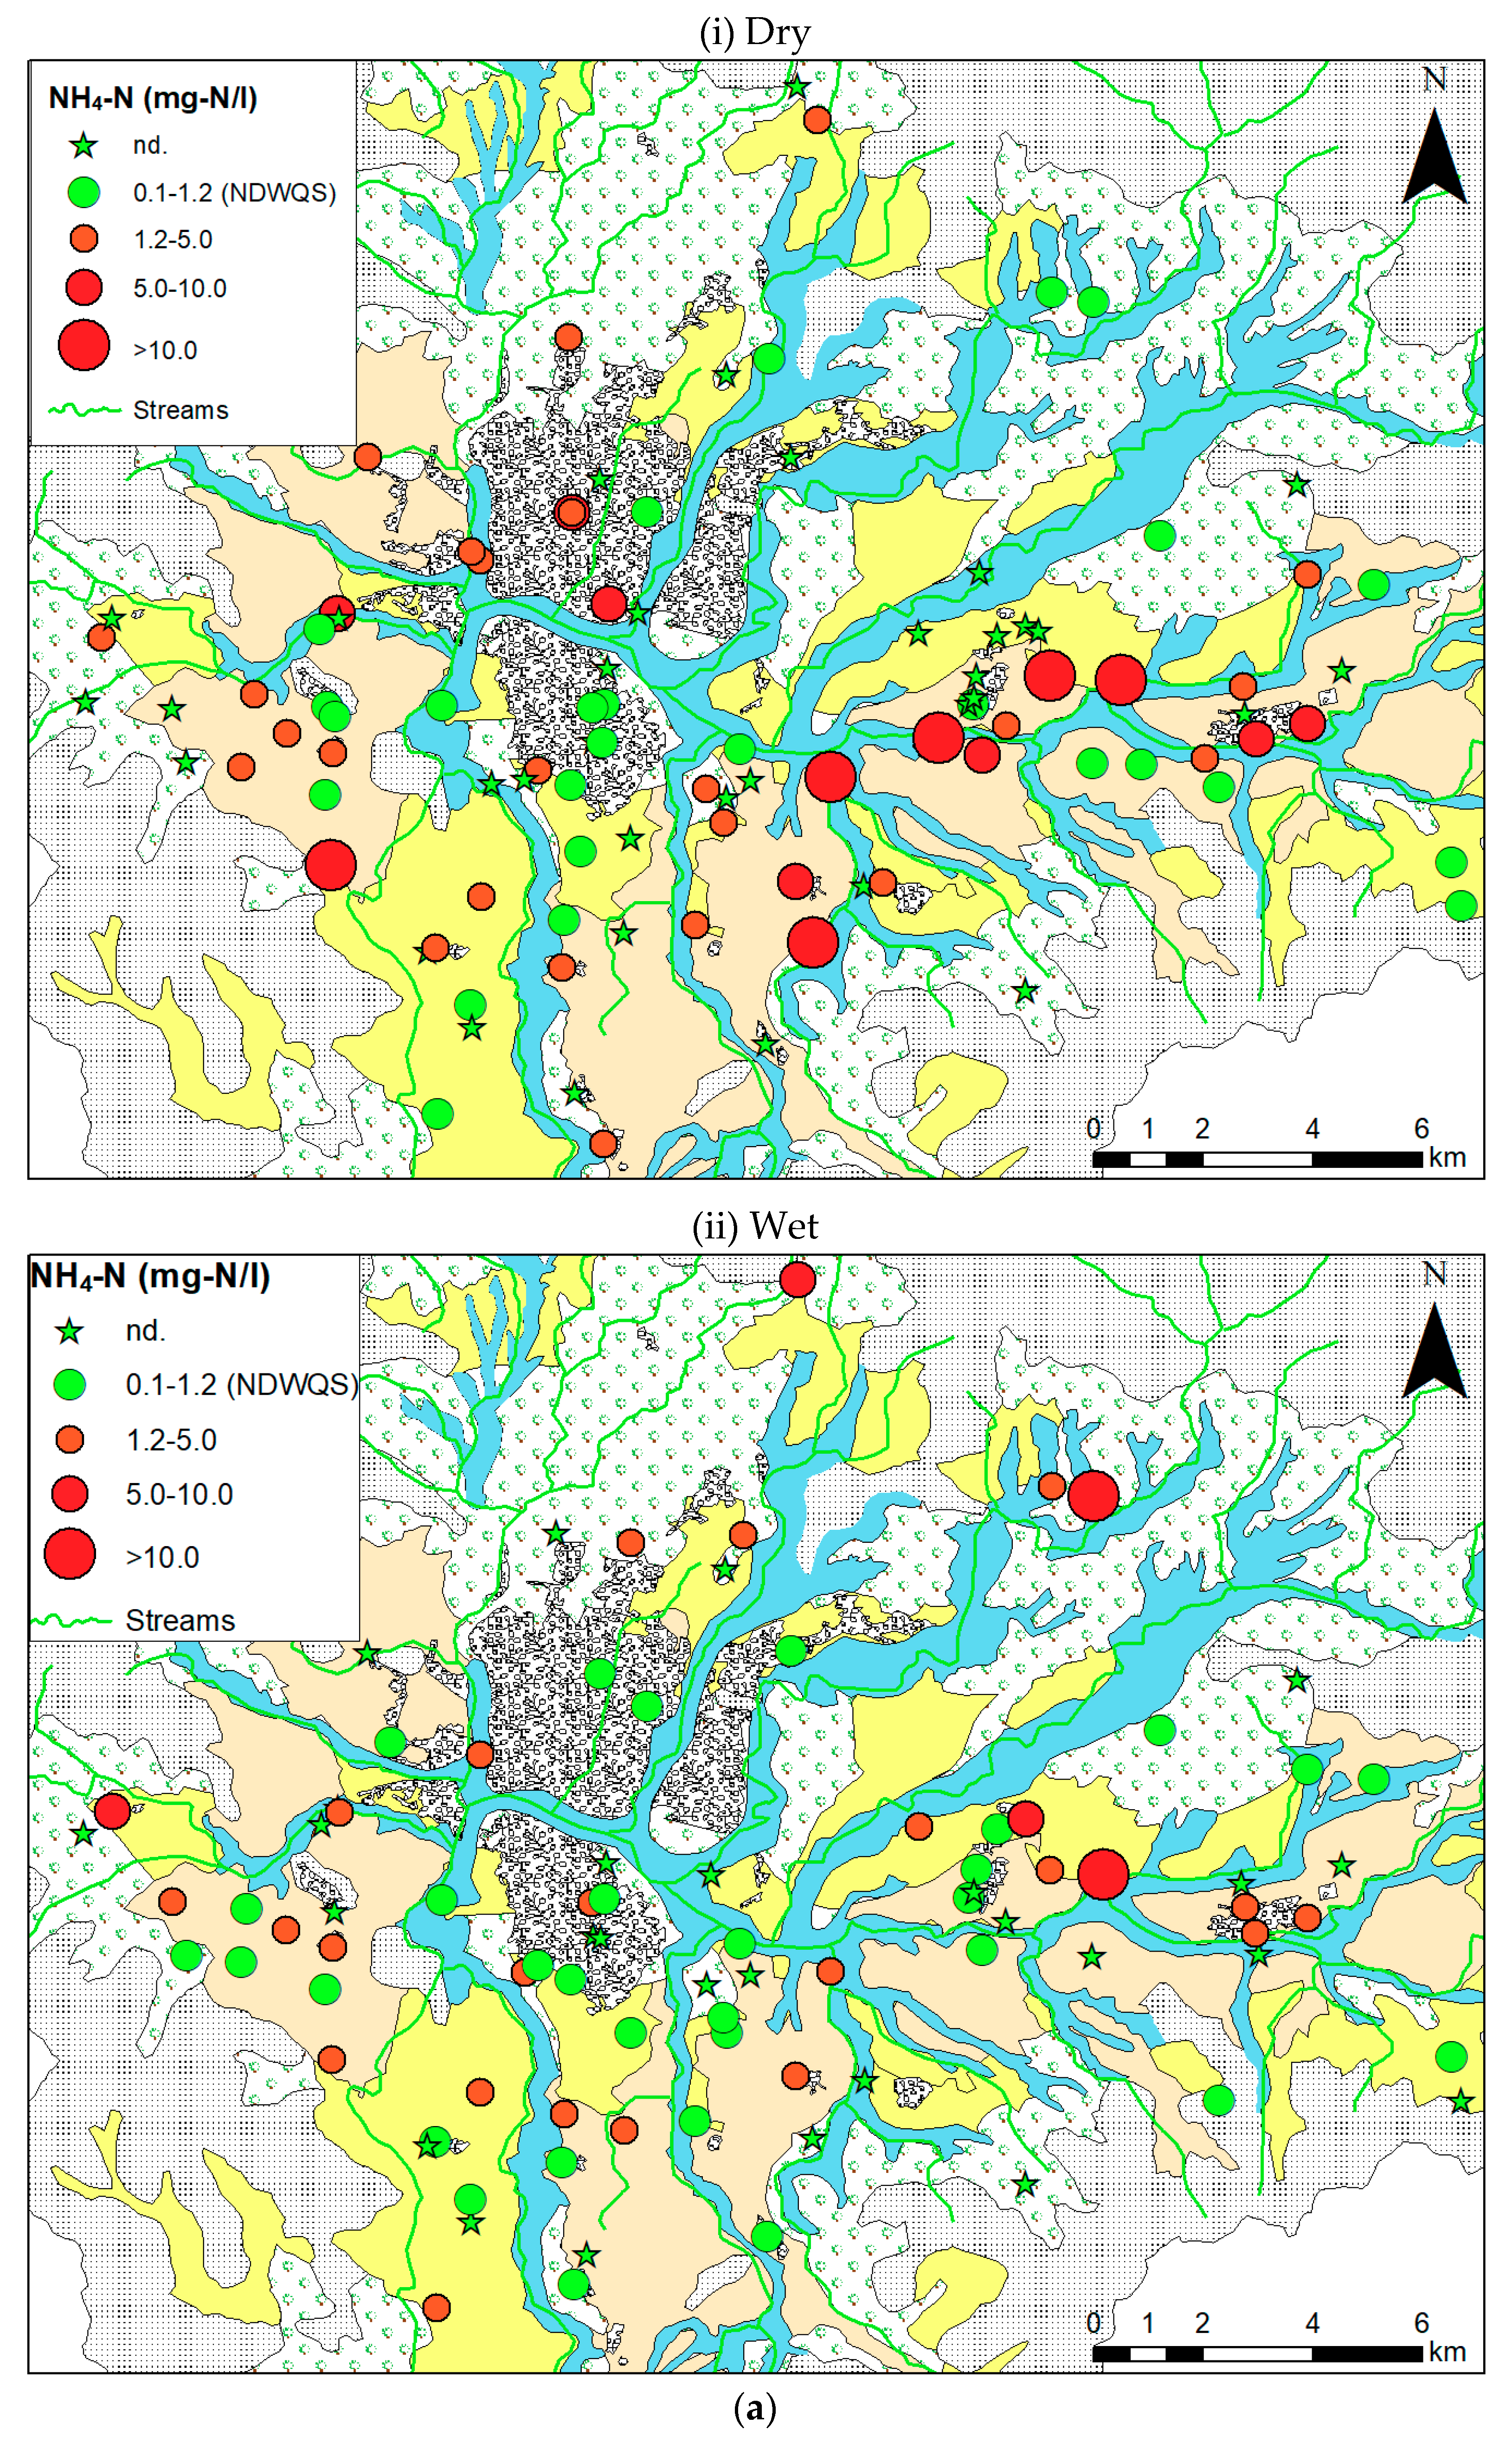
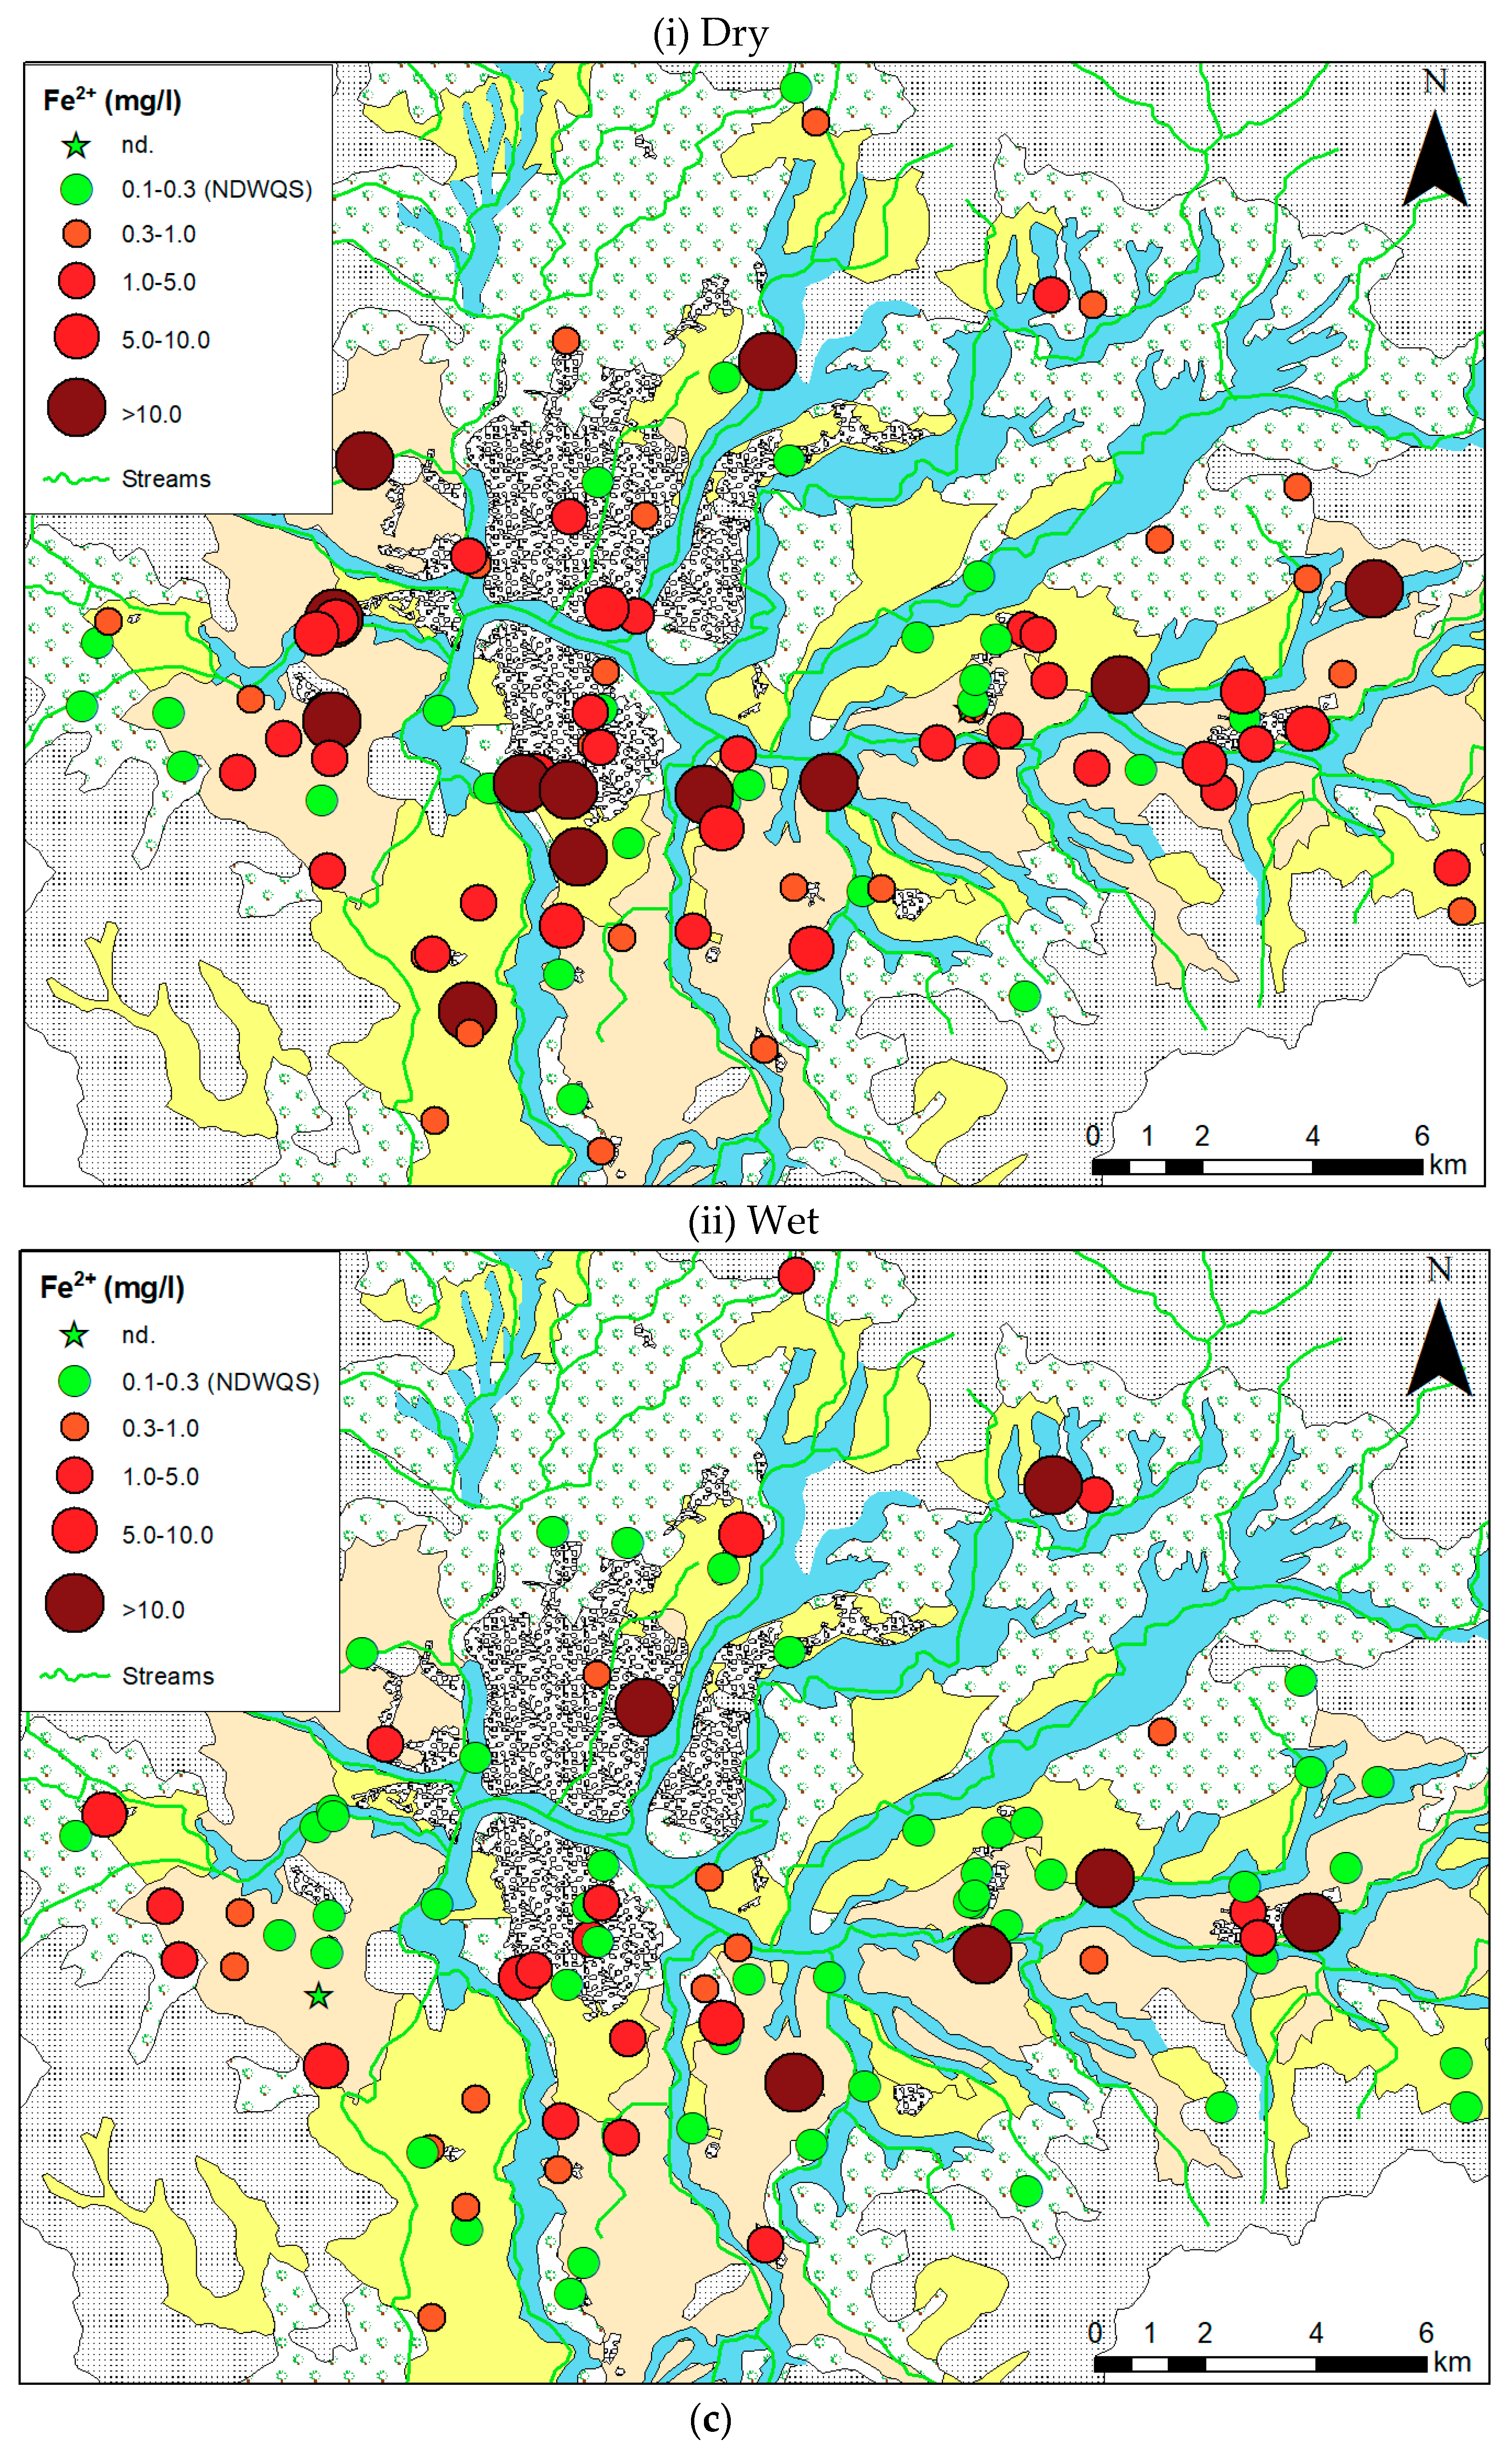
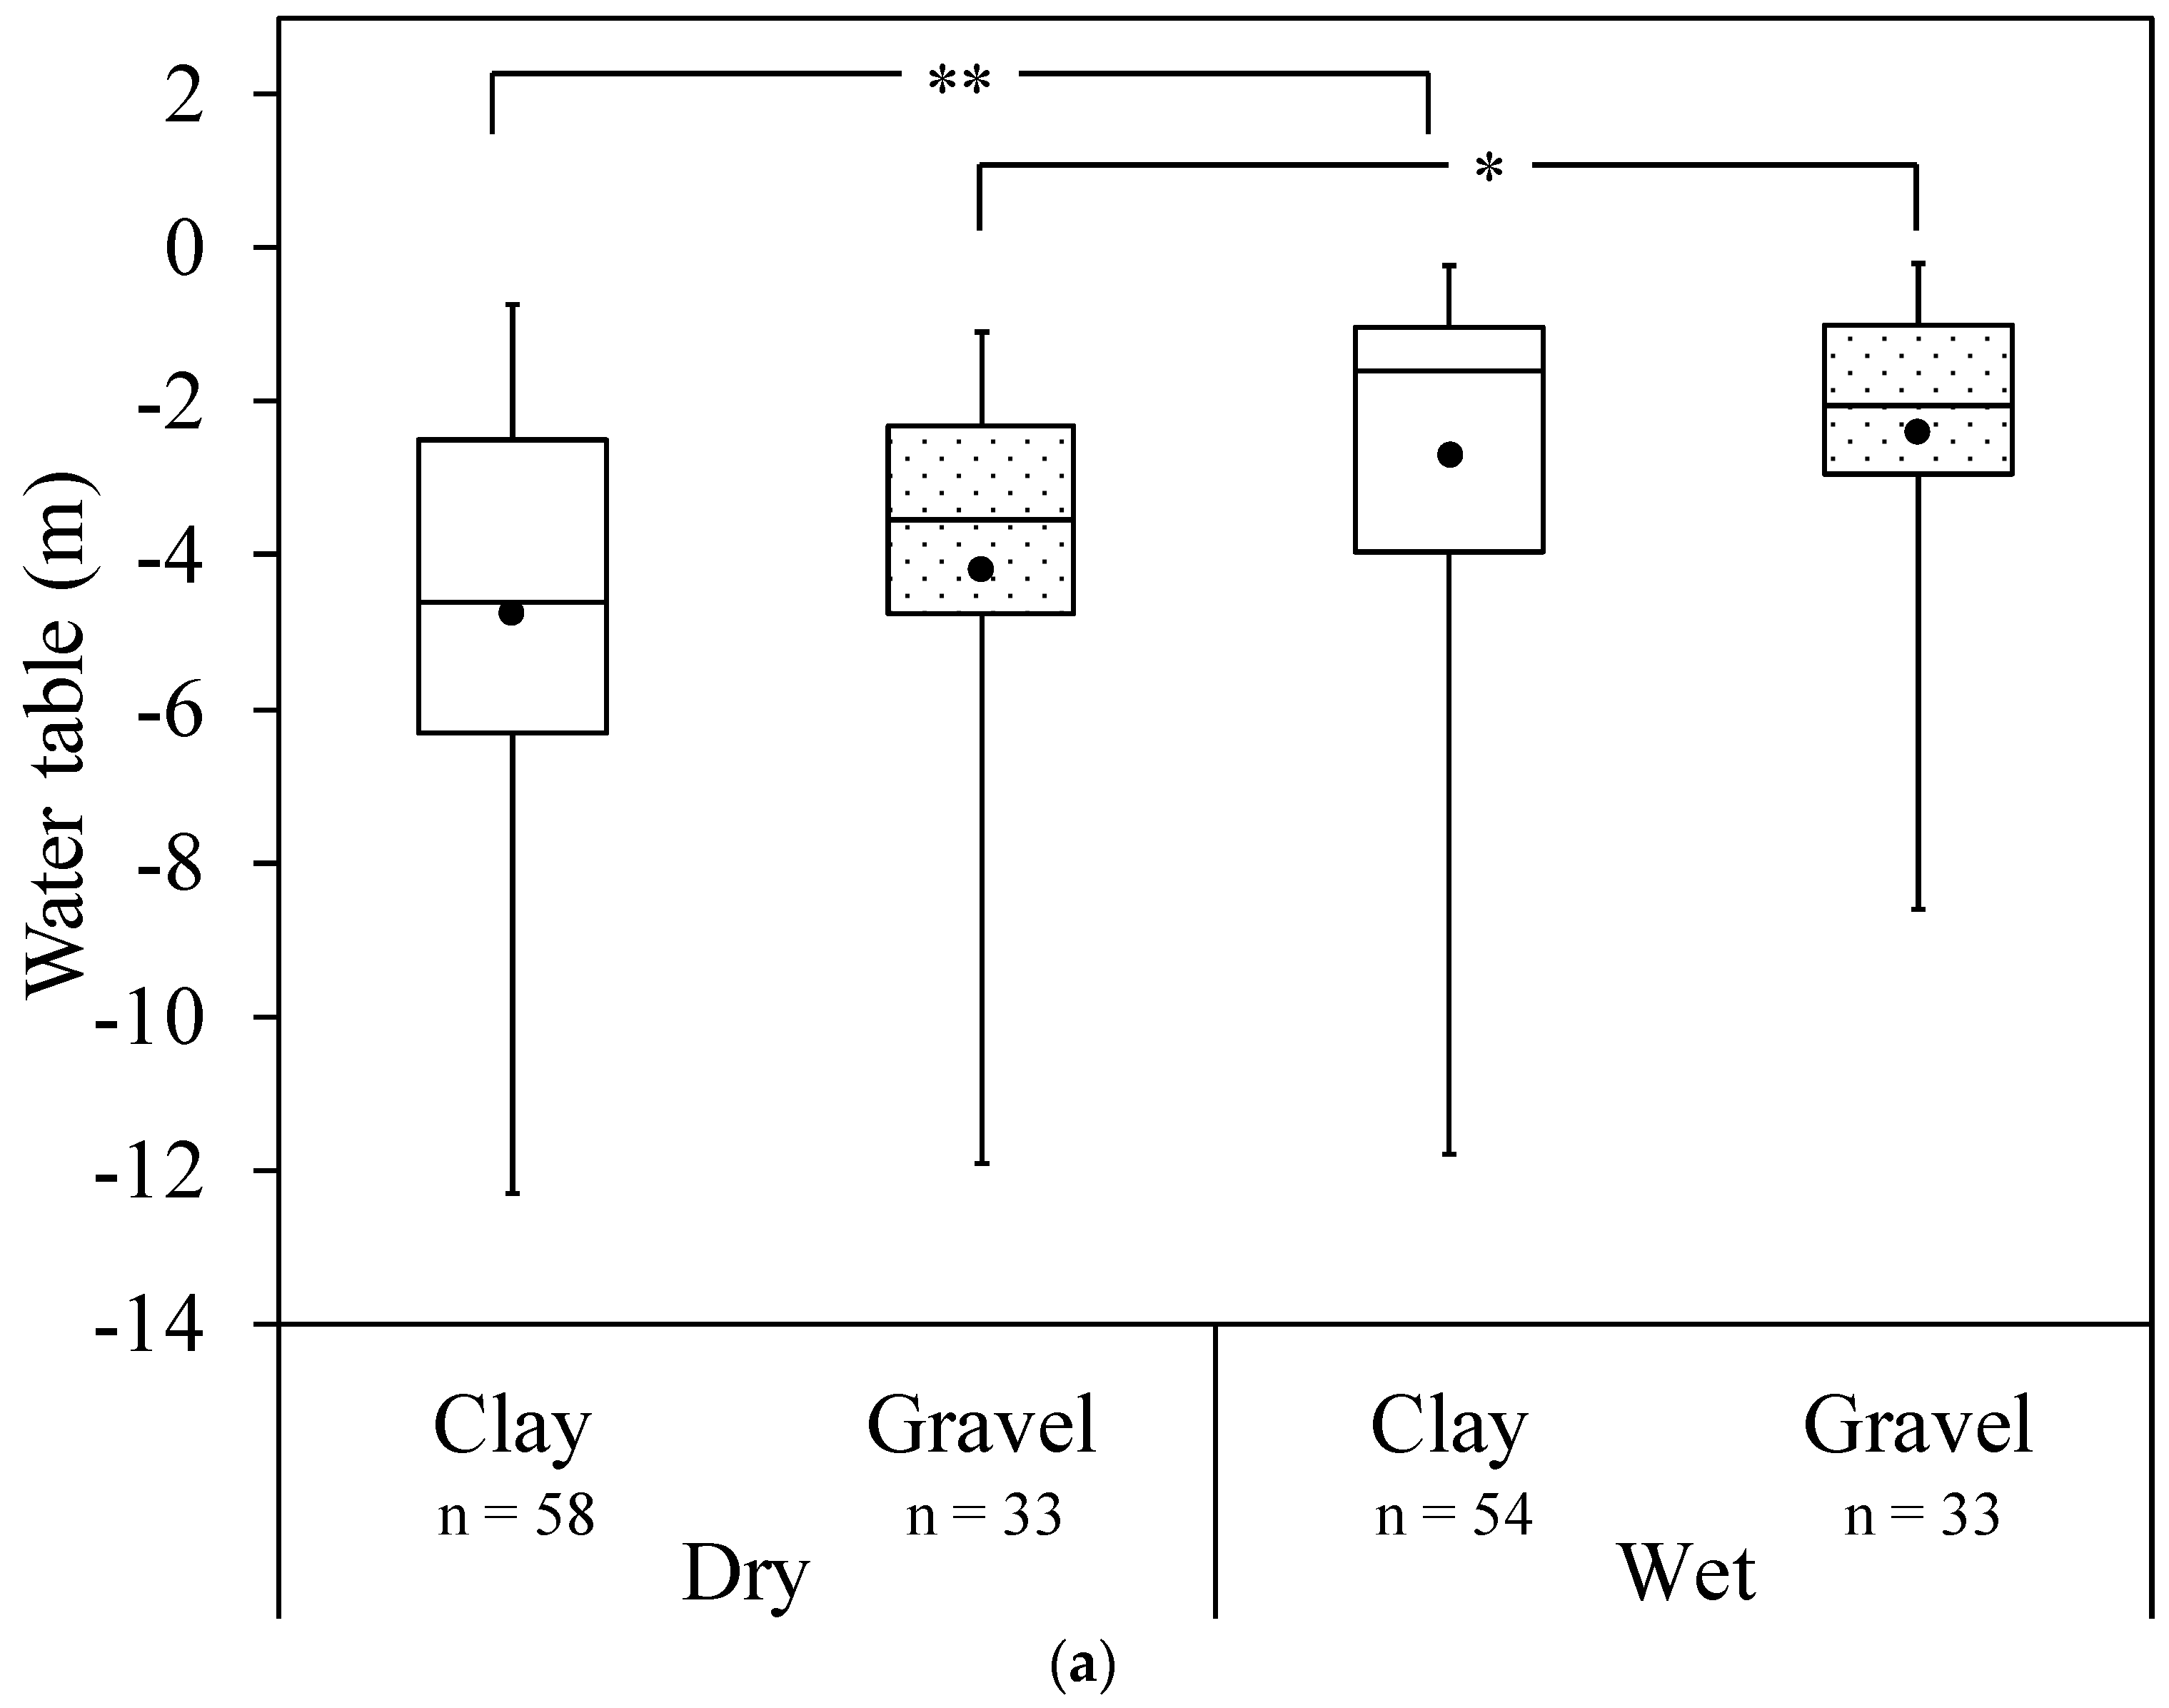
3.1. Spatial and Temporal Overview of Chemical Parameters
3.2. Site-Specific Nitrogen in Gravel and Clay-Dominated Areas
3.3. Monthly Nitrogen Isotope Variation
4. Discussion
4.1. Effects of Rainfall
4.2. Redox Environment
4.3. Chemical Contamination in Groundwater
4.4. Factors Controlling NH4-N in Shallow Groundwater
4.5. Factors Controlling NO3-N in Shallow Groundwater
4.6. Factors Controlling NH4-N and NO3-N in Deep Groundwater
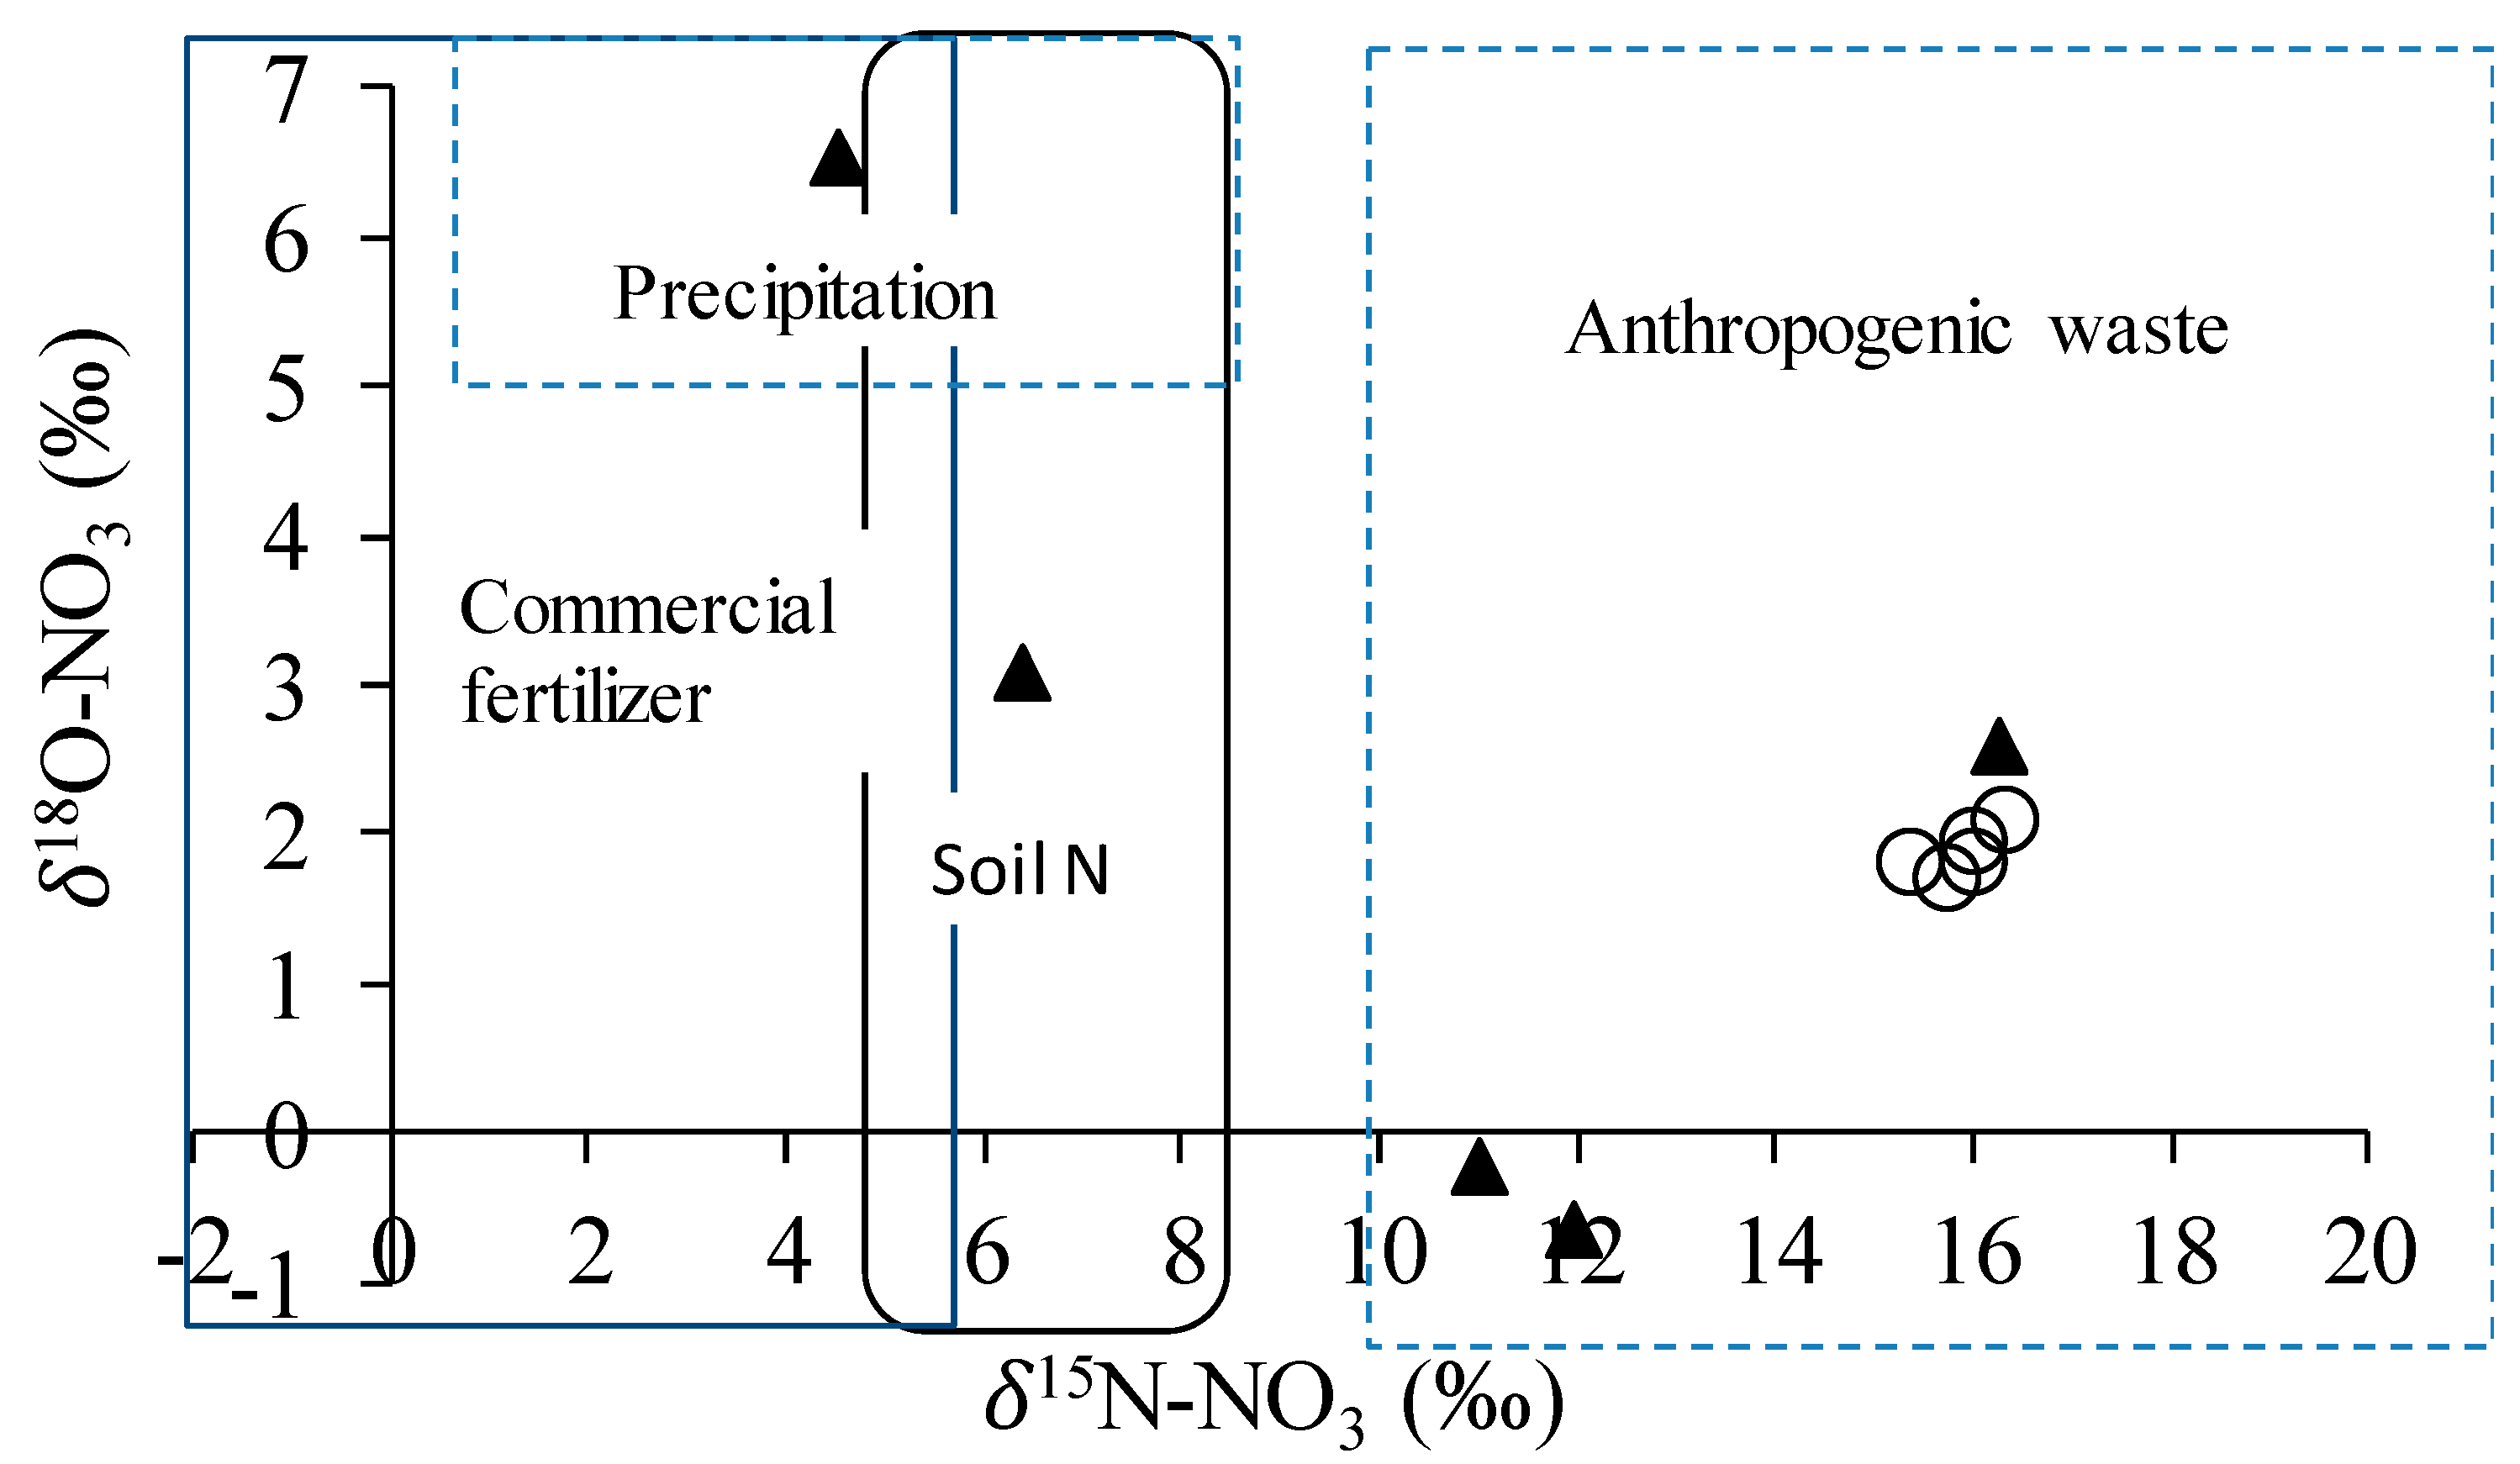
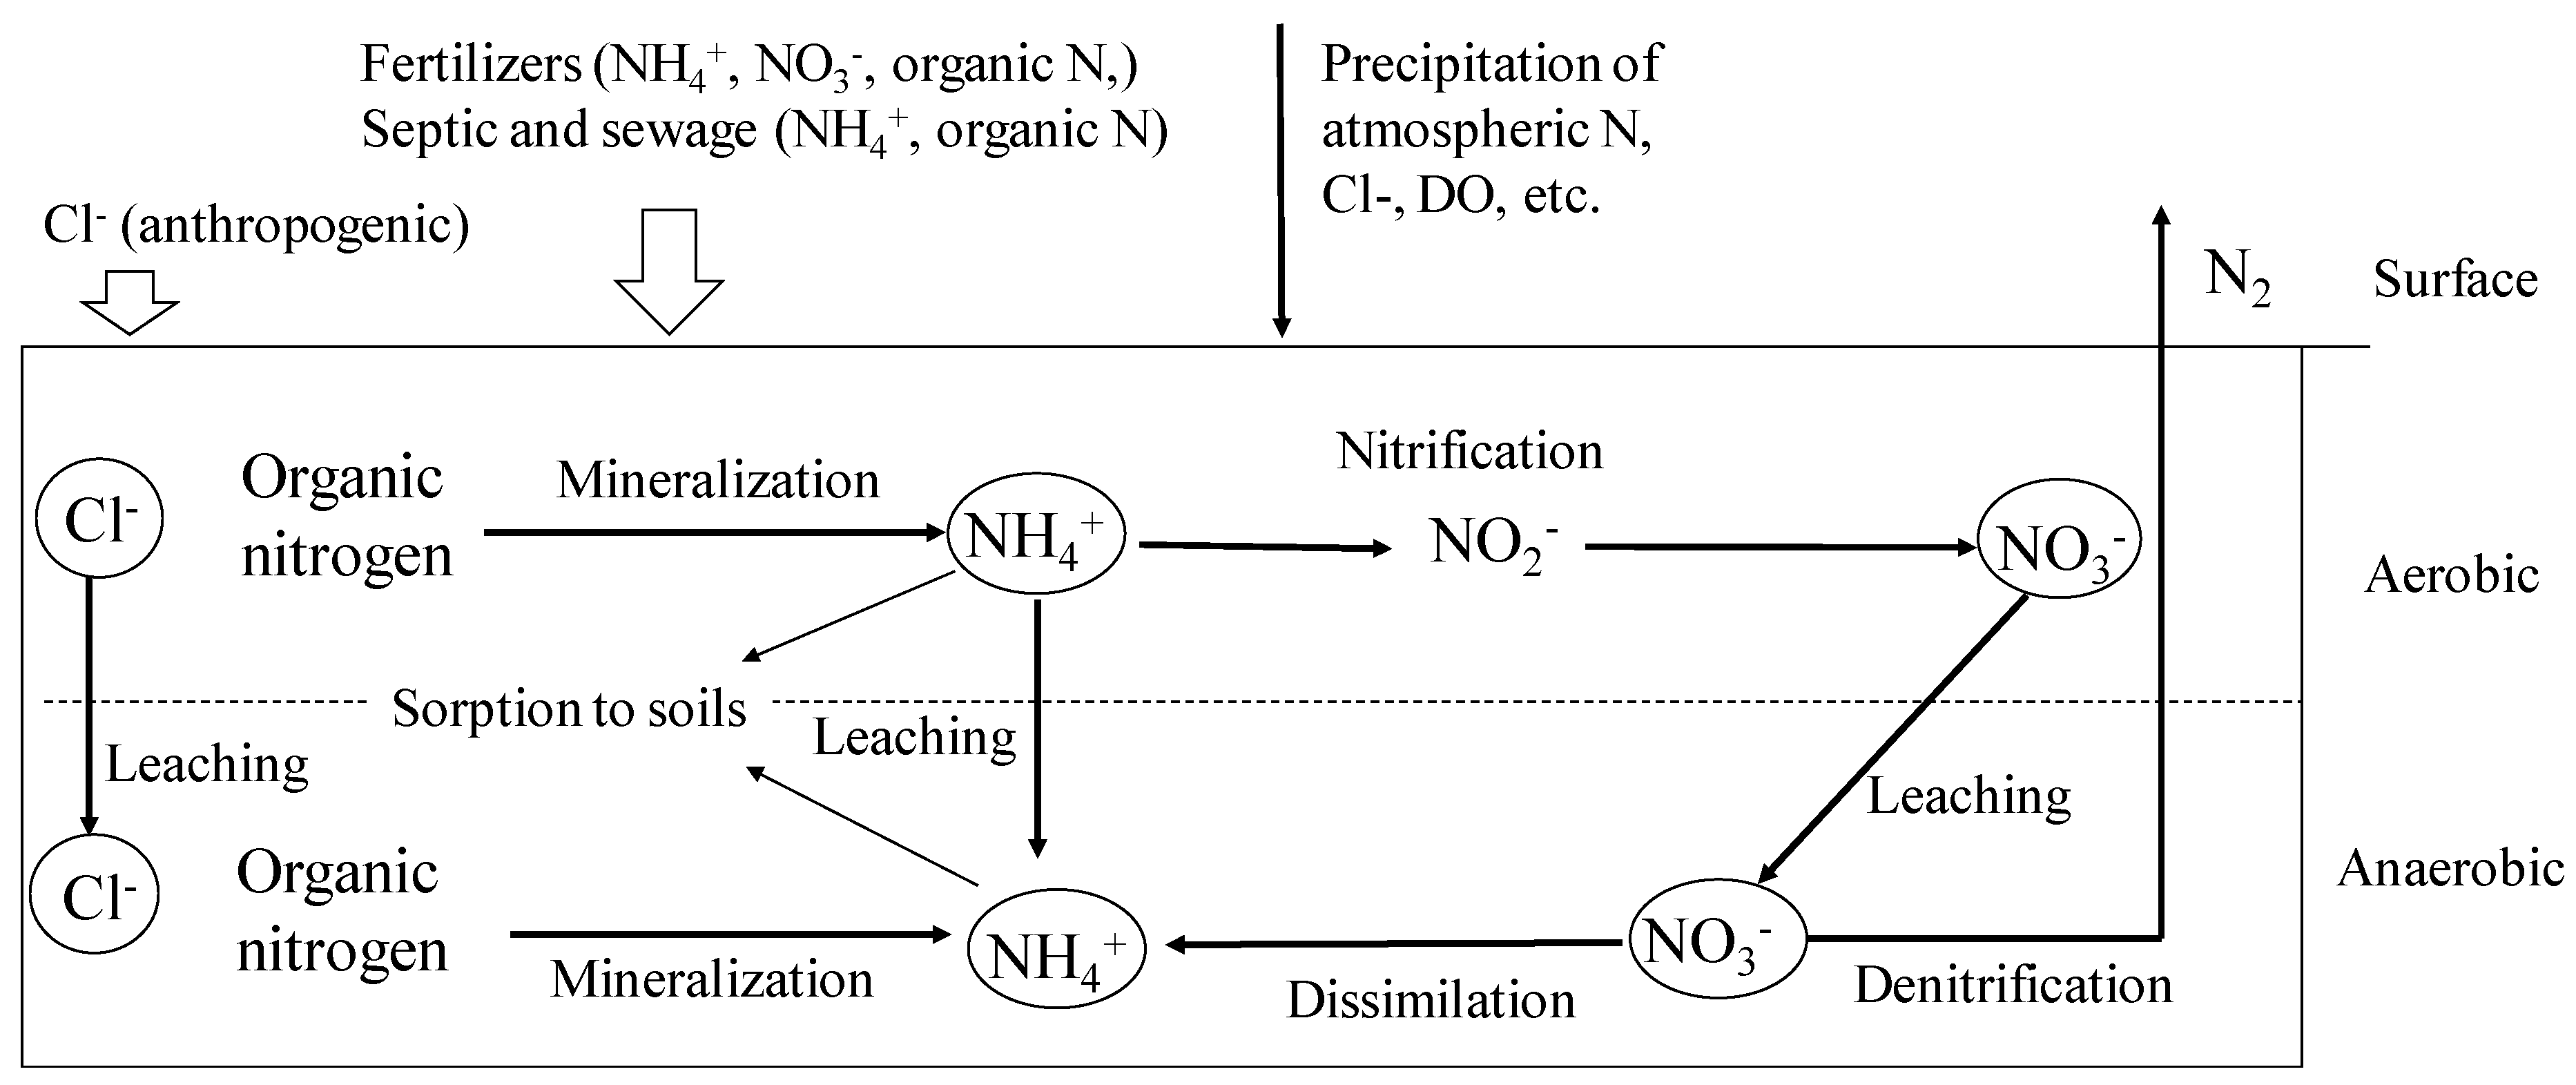
4.7. Source and Fate of Nitrogen According to Isotopes
4.8. Health Effects
5. Conclusions
6. Recommendation
Author Contributions
Funding
Acknowledgments
Conflicts of Interest
References
- Lerner, D.N. Groundwater recharge in urban areas. Atmos. Environ. Part B Urban Atmos. 1990, 24, 29–33. [Google Scholar] [CrossRef]
- Wakida, F.T.; Lerner, D.N. Non-agricultural sources of groundwater nitrate: A review and case study. Water Res. 2005, 39, 3–16. [Google Scholar] [CrossRef]
- Onodera, S.; Saito, M.; Sawano, M.; Hosono, T.; Taniguchi, M.; Shimada, J.; Umezawa, Y.; Lubis, R.F.; Buapeng, S.; Delinom, R. Erratum to “Effects of intensive urbanization on the intrusion of shallow groundwater into deep groundwater: Examples from Bangkok and Jakarta”. Sci. Total Environ. 2009, 407, 3209–3217. [Google Scholar] [CrossRef]
- Ferronato, N.; Torretta, V. Waste mismanagement in developing countries: A review of global issues. Int. J. Environ. Res. Public Health 2019, 16, 1060. [Google Scholar] [CrossRef]
- Umezawa, Y.; Hosono, T.; Onodera, S.; Siringan, F.; Buapeng, S.; Delinom, R.; Yoshimizu, C.; Tayasu, I.; Nagata, T.; Taniguchi, M. Erratum to “Sources of nitrate and ammonium contamination in groundwater under developing Asian megacities”. Sci. Total Environ. 2009, 407, 3219–3231. [Google Scholar] [CrossRef]
- Gao, Y.; Yu, G.; Luo, C.; Zhou, P. Groundwater nitrogen pollution and assessment of its health risks: A case study of a typical village in rural-urban continuum, China. PLoS ONE 2012, 7, e33982. [Google Scholar] [CrossRef]
- Nyenje, P.M.; Havik, J.C.N.; Foppen, J.W.; Muwanga, A.; Kulabako, R. Understanding the fate of sanitation-related nutrients in a shallow sandy aquifer below an urban slum area. J. Contam. Hydrol. 2014, 164, 259–274. [Google Scholar] [CrossRef]
- Grimmeisen, F.; Zemann, M.; Goeppert, N.; Goldscheider, N. Weekly variations of discharge and groundwater quality caused by intermittent water supply in an urbanized karst catchment. J. Hydrol. 2016, 537, 157–170. [Google Scholar] [CrossRef]
- Armstrong, A. Urban waste. Nat. Geosci. 2009, 2, 748. [Google Scholar] [CrossRef]
- Vidal, M.; Melgar, J.; López, A.; Santoalla, M.C. Spatial and temporal hydrochemical changes in groundwater under the contaminating effects of fertilizers and wastewater. J. Environ. Manag. 2000, 60, 215–225. [Google Scholar] [CrossRef]
- Ahmed, M.A.; Samie, S.G.A.; El-Maghrabi, H.M. Recharge and contamination sources of shallow and deep groundwater of pleistocene aquifer in El-Sadat industrial city: Isotope and hydrochemical approaches. Environ. Earth Sci. 2011, 62, 751–768. [Google Scholar] [CrossRef]
- Forman, D.; Al-Dabbagh, S.; Doll, R. Nitrates, nitrites and gastric cancer in Great Britain. Nature 1985, 313, 620–625. [Google Scholar] [CrossRef] [PubMed]
- Ward, M.; Jones, R.; Brender, J.; de Kok, T.; Weyer, P.; Nolan, B.; Villanueva, C.; van Breda, S. Drinking water nitrate and human health: An updated review. Int. J. Environ. Res. Public Health 2018, 15, 1557. [Google Scholar] [CrossRef] [PubMed]
- Desimone, L.A.; Howes, L. Nitrogen transport and transformations in a shallow aquifer receiving wastewater discharge: A mass balance approach. Water Resour. Res. 1998, 34, 271–285. [Google Scholar] [CrossRef]
- Jury, W.A.; Nielsen, D.R. Nitrate transport and leaching mechanisms. In Nitrogen Management and Groundwater Protection; Follett, R.F., Ed.; Elsevier Science Publications: Amsterdam, The Netherlands, 1989; Volume 21, pp. 139–157. ISBN 9780444873934. [Google Scholar]
- Letey, J.; Vaughan, P. Soil type, crop and irrigation technique affect nitrogen leaching to groundwater. Calif. Agric. 2013, 67, 231–241. [Google Scholar] [CrossRef]
- Hara, K. Groundwater contamination and quality management policy in Asia. Int. Rev. Environ. Strateg. 2006, 6, 291–306. [Google Scholar]
- The World Bank Managing Nepal’s Urban Transition. Available online: http://www.worldbank.org/en/news/feature/2013/04/01/managing-nepals-urban-transition (accessed on 18 June 2019).
- CBS. National Population and Housing Census 2011 (National Report); Central Bureau of Statistics, National Planning Commission, Government of Nepal: Kathmandu, Nepal, 2012; Volume 1.
- Ojha, R.; Thapa, B.; Shrestha, S.; Shindo, J.; Ishidaira, H.; Kazama, F. Water taxation and subsidy analysis based on consumer water use behavior and water sources inside the Kathmandu Valley. Water 2018, 10, 1802. [Google Scholar] [CrossRef]
- Warner, N.R.; Levy, J.; Harpp, K.; Farruggia, F. Drinking water quality in Nepal’s Kathmandu Valley: A survey and assessment of selected controlling site characteristics. Hydrogeol. J. 2008, 16, 321–334. [Google Scholar] [CrossRef]
- Kannel, P.R.; Lee, S.; Lee, Y.-S. Assessment of spatial—Temporal patterns of surface and ground water qualities and factors influencing management strategy of groundwater system in an urban river corridor of Nepal. J. Environ. Manag. 2008, 86, 595–604. [Google Scholar] [CrossRef]
- Pant, B.R. Ground water quality in the Kathmandu valley of Nepal. Environ. Monit. Assess. 2011, 178, 477–485. [Google Scholar] [CrossRef]
- Pandey, V.P.; Chapagain, S.K.; Kazama, F. Evaluation of groundwater environment of Kathmandu Valley. Environ. Earth Sci. 2010, 60, 1329–1342. [Google Scholar] [CrossRef]
- ENPHO. Monitoring of Groundwater Quality in the Kathmandu Valley, Nepal. A Report Submitted to Ministry of Population and Environment, HMG Nepal (ADB TA 2847-NEP); Environment and Public Health Organization: Kathmandu, Nepal, 1999.
- Jha, M.G.; Khadka, M.S.; Shrestha, M.P.; Regmi, S.; Bauld, J.; Jacobson, G. The Assessment of Groundwater Pollution in the Kathmandu Valley, Nepal: Report on Joint Australia (AGSO)—Nepal (GWRDB) Project 1994-96; Australian Geological Survey Organization, Deparement of Primary Industries and Energy: Canberra, Australian, 1997; ISBN 0642250405.
- Shrestha, S.; Nakamura, T.; Malla, R.; Nishida, K. Seasonal variation in the microbial quality of shallow groundwater in the Kathmandu Valley, Nepal. Water Sci. Technol. Water Supply 2014, 14, 390. [Google Scholar] [CrossRef]
- Bittner, A. Nepal Drinking Water Quality Assessment: Nitrates and Ammonia. Master’s Thesis, Massachusetts Institute of Technology, Cambridge, MA, USA, June 2000. [Google Scholar]
- Khatiwada, N.R.; Takizawa, S.; Tran, T.V.N.; Inoue, M. Groundwater contamination assessment for sustainable water supply in Kathmandu Valley, Nepal. Water Sci. Technol. 2002, 46, 147–154. [Google Scholar] [CrossRef]
- Pathak, D.R.; Hiratsuka, A. An investigation of nitrate and iron concentrations and their relationship in shallow groundwater systems of Kathmandu. Desalin. Water Treat. 2010, 19, 191–197. [Google Scholar] [CrossRef]
- BGR. Hydrological Conditions and Potential Barrier Sediments in the Kathmandu Valley: Final Report; Bundesanstalt für Geowissenschaften und Rohstoffe: Hannover, Germany, 1998.
- Sakai, H. Stratigraphic division and sedimentary facies of the Kathmandu Basin Group, Central Nepal. J. Nepal Geol. Soc. 2001, 25, 19–32. [Google Scholar]
- Gurung, J.K.; Ishiga, H.; Khadka, M.S.; Shrestha, N.R. The geochemical study of fluvio-lacustrine aquifers in the Kathmandu Basin (Nepal) and the implications for the mobilization of arsenic. Environ. Geol. 2007, 52, 503–517. [Google Scholar] [CrossRef]
- Shakya, B.M.; Nakamura, T.; Shrestha, S.D.; Nishida, K. Identifying the deep groundwater recharge processes in an intermountain basin using the hydrochemical and water isotope characteristics. Hydrol. Res. 2019, in press. [Google Scholar] [CrossRef]
- Thapa, B.R.; Ishidaira, H.; Pandey, V.P.; Shakya, N.M. A multi-model approach for analyzing water balance dynamics in Kathmandu Valley, Nepal. J. Hydrol. Reg. Stud. 2017, 9, 149–162. [Google Scholar] [CrossRef]
- Dongol, B.S.; Merz, J.; Schaffner, M.; Nakarmi, G.; Shah, P.B.; Shrestha, S.K.; Dangol, P.M.; Dhakal, M.P. Shallow groundwater in a middle mountain catchment of Nepal: Quantity and quality issues. Environ. Geol. 2005, 49, 219–229. [Google Scholar] [CrossRef]
- KUKL. Kathmandu Upatyaka Khanepani Limited: Annual Report-Tenth Anniversary, Kathmandu; Government of Nepal: Kathmandu, Nepal, 2018.
- Udmale, P.; Ishidaira, H.; Thapa, B.; Shakya, N. The status of domestic water demand: Supply deficit in the Kathmandu Valley, Nepal. Water 2016, 8, 196. [Google Scholar] [CrossRef]
- Menne, M.J.; Imke, D.; Korzeniewski, B.; McNeal, S.; Thomas, K.; Yin, X.; Anthony, S.; Ray, R.; Vose, R.S.; Gleason, B.E.; et al. Global Historical Climatology Network-Daily (GHCN-daily), Version 3.26; NOAA National Climatic Data Center: Asheville, NC, USA, 2012.
- Sigman, D.M.; Casciotti, K.L.; Andreani, M.; Barford, C.; Galanter, M.; Böhlke, J.K. A bacterial method for the nitrogen isotopic analysis of nitrate in seawater and freshwater. Anal. Chem. 2001, 73, 4145–4153. [Google Scholar] [CrossRef]
- Casciotti, K.L.; Sigman, D.M.; Galanter Hastings, M.; Böhlke, J.K.; Hilkert, A. Measurement of the oxygen isotopic compostion of nitrate in seawater and freshwater using the denitrifier method. Anal. Chem. 2002, 74, 4905–4912. [Google Scholar] [CrossRef]
- Todd, D.K.; Mays, L.W. Groundwater Hydrology, 3rd ed.; Wiley: Hoboken, NJ, USA, 2004; ISBN 978-0-471-05937-0. [Google Scholar]
- Lasagna, M.; De Luca, D.A.; Debernardi, L.; Clemente, P. Effect of the dilution process on the attenuation of contaminants in aquifers. Environ. Earth Sci. 2013, 70, 2767–2784. [Google Scholar] [CrossRef]
- Dwivedi, D.; Arora, B.; Steefel, C.I.; Dafflon, B.; Versteeg, R. Hot spots and hot moments of nitrogen in a riparian corridor. Water Resour. Res. 2018, 54, 205–222. [Google Scholar] [CrossRef]
- Bhandari, D.; Bi, P.; Sherchand, J.B.; Dhimal, M.; Hanson-Easey, S. Assessing the effect of climate factors on childhood diarrhoea burden in Kathmandu, Nepal. Int. J. Hyg. Environ. Health 2019, in press. [Google Scholar] [CrossRef]
- Shrestha, S.; Nakamura, T.; Yoneyama, Y.; Shrestha, S.; Kazama, F. Identification of nitrate sources in rainwater of Kathmandu valley: A chemical and stable isotopic approach. J. Water Environ. Technol. 2013, 11, 377–389. [Google Scholar] [CrossRef]
- Lawniczak, A.E.; Zbierska, J.; Nowak, B.; Achtenberg, K.; Grześkowiak, A.; Kanas, K. Impact of agriculture and land use on nitrate contamination in groundwater and running waters in central-west Poland. Environ. Monit. Assess. 2016, 188, 1–17. [Google Scholar] [CrossRef] [Green Version]
- Dwivedi, D.; Mohanty, B.P. Hot spots and persistence of nitrate in aquifers across scales. Entropy 2016, 18, 25. [Google Scholar] [CrossRef]
- Dwivedi, D.; Steefel, C.I.; Arora, B.; Newcomer, M.; Moulton, J.D.; Dafflon, B.; Faybishenko, B.; Fox, P.; Nico, P.; Spycher, N.; et al. Geochemical exports to river from the intrameander hyporheic zone under transient hydrologic conditions: East river mountainous watershed, Colorado. Water Resour. Res. 2018, 54, 8456–8477. [Google Scholar] [CrossRef]
- Xie, X.; Wang, Y.; Su, C.; Li, M. δD and δ18O and chloride as indicators of groundwater recharge and discharge in Datong Basin, Northern China. In Water-Rock Interaction; Birkle, P., Torres-Alvardo, I.S., Eds.; CRC Press: Boca Raton, FL, USA, 2010; pp. 115–118. [Google Scholar]
- Townsend, M.A.; Whittemore, D.O. Identification of Nitrate and Chloride Sources Affecting Municipal Well Waters of the City of McPherson, Kansas; Kansas Geoogical Survey: Lawrence, KS, USA, 2005; Volume 66047, Available online: http://www.kgs.ku.edu/Hydro/Publications/2005/OFR05_34/OFR2005_34b.pdf (accessed on 12 May 2019).
- Nakamura, T.; Nishida, K.; Kazama, F.; Osaka, K.; K. Chapagain, S. Nitrogen contamination of shallow groundwater in Katmandu Valley, Nepal. J. Jpn. Assoc. Hydrol. Sci. 2014, 44, 197–206. [Google Scholar] [CrossRef] [Green Version]
- Buss, S.R.; Rivett, M.O.; Morgan, P.; Bemment, C.D. Attenuation of Nitrate in the Sub-Surface Environment: Environmental Agency Science Report SC030155/SR2; Environment Agency: Bristol, England, 2005; ISBN 1844324265.
- Lee, M.; Lee, K.; Hyun, Y.; Clement, T.P.; Hamilton, D. Nitrogen transformation and transport modeling in groundwater aquifers. Ecol. Model. 2006, 192, 143–159. [Google Scholar] [CrossRef] [Green Version]
- Sbarbati, C.; Colombani, N.; Mastrocicco, M.; Petitta, M.; Aravena, R. Reactive and mixing processes governing ammonium and nitrate coexistence in a polluted coastal aquifer. Geoscience 2018, 8, 210. [Google Scholar] [CrossRef]
- Hammoud, A.S.; Leung, J.; Tripathi, S.; Butler, A.P.; Sule, M.N. The impact of latrine contents and emptying practices on nitrogen contamination of well water in Kathmandu Valley, Nepal. AIMS Environ. Sci. 2018, 5, 143–153. [Google Scholar] [CrossRef]
- Böhlke, J.K.; Smith, R.L.; Miller, D.N. Ammonium transport and reaction in contaminated groundwater: Application of isotope tracers and isotope fractionation studies. Water Resour. Res. 2006, 42, 1–19. [Google Scholar] [CrossRef]
- Neira, J.; Ortiz, M.; Morales, L.; Acevedo, E. Oxygen diffusion in soils: Understanding the factors and processes needed for modeling. Chil. J. Agric. Res. 2015, 75, 35–44. [Google Scholar] [CrossRef]
- Tan, K.H.; Lopez-Falcon, R.A. Effect of fulvic and humic acids on nitrification part 1: In vitro production of nitrite and nitrate. Commun. Soil Sci. Plant Anal. 1987, 18, 835–853. [Google Scholar] [CrossRef]
- Fuji, R.; Sakai, H. Palynological study on the drilled sediments from the Kathmandu Basin and its paleoclimatic significances. J. Nepal Geol. Soc. 2001, 25, 53–61. [Google Scholar]
- Prinčič, A.; Mahne, I.; Megušar, F.; Paul, E.A.; Tiedje, J.M. Effects of pH and oxygen and ammonium concentrations on the community structure of nitrifying bacteria from wastewater. Appl. Environ. Microbiol. 1998, 64, 3584–3590. [Google Scholar]
- Nemčić-Jurec, J.; Jazbec, A. Point source pollution and variability of nitrate concentrations in water from shallow aquifers. Appl. Water Sci. 2017, 7, 1337–1348. [Google Scholar] [CrossRef]
- Trudell, M.R.; Gillham, R.W.; Cherry, J.A. An in-situ study of the occurrence and rate of denitrification in a shallow unconfined sand aquifer. J. Hydrol. 1986, 83, 251–268. [Google Scholar] [CrossRef]
- Pradhan, B.B.; Shrestha, B.R.; Punjali, K.R.; Lama, C.N. Kathmandu Valley Environmental Outlook; Report; International Center for Integral Mountain Development: Kathmandu, Nepal, 2007. [Google Scholar]
- Kendall, C.; Elliott, E.M.; Wankel, S.D. Tracing anthropogenic inputs of nitrogen to ecosystems. In Stable Isotopes in Ecology and Environmental Science; Blackwell Publishing Ltd.: Oxford, UK, 2007; pp. 375–449. [Google Scholar]
- Aravena, R.; Evans, M.L.; Cherry, J.A. Stable isotopes of oxygen and nitrogen in source identification of nitrate from septic system. Groundwater 1993, 31, 180–186. [Google Scholar] [CrossRef]
- Zhang, Y.; Liu, X.J.; Fangmeier, A.; Goulding, K.T.W.; Zhang, F.S. Nitrogen inputs and isotopes in precipitation in the North China Plain. Atmos. Environ. 2008, 42, 1436–1448. [Google Scholar] [CrossRef]


| Categories | Season | Dry | Wet | |||
|---|---|---|---|---|---|---|
| Soil Type | Clay | Gravel | Clay | Gravel | ||
| Parameters | Water table (m) | Min. | −0.7 | −1.1 | −0.2 | −0.2 |
| Max. | −12.3 | −13.4 | −11.8 | −8.6 | ||
| Average | −4.8 | −4.2 | −2.7 | −2.4 | ||
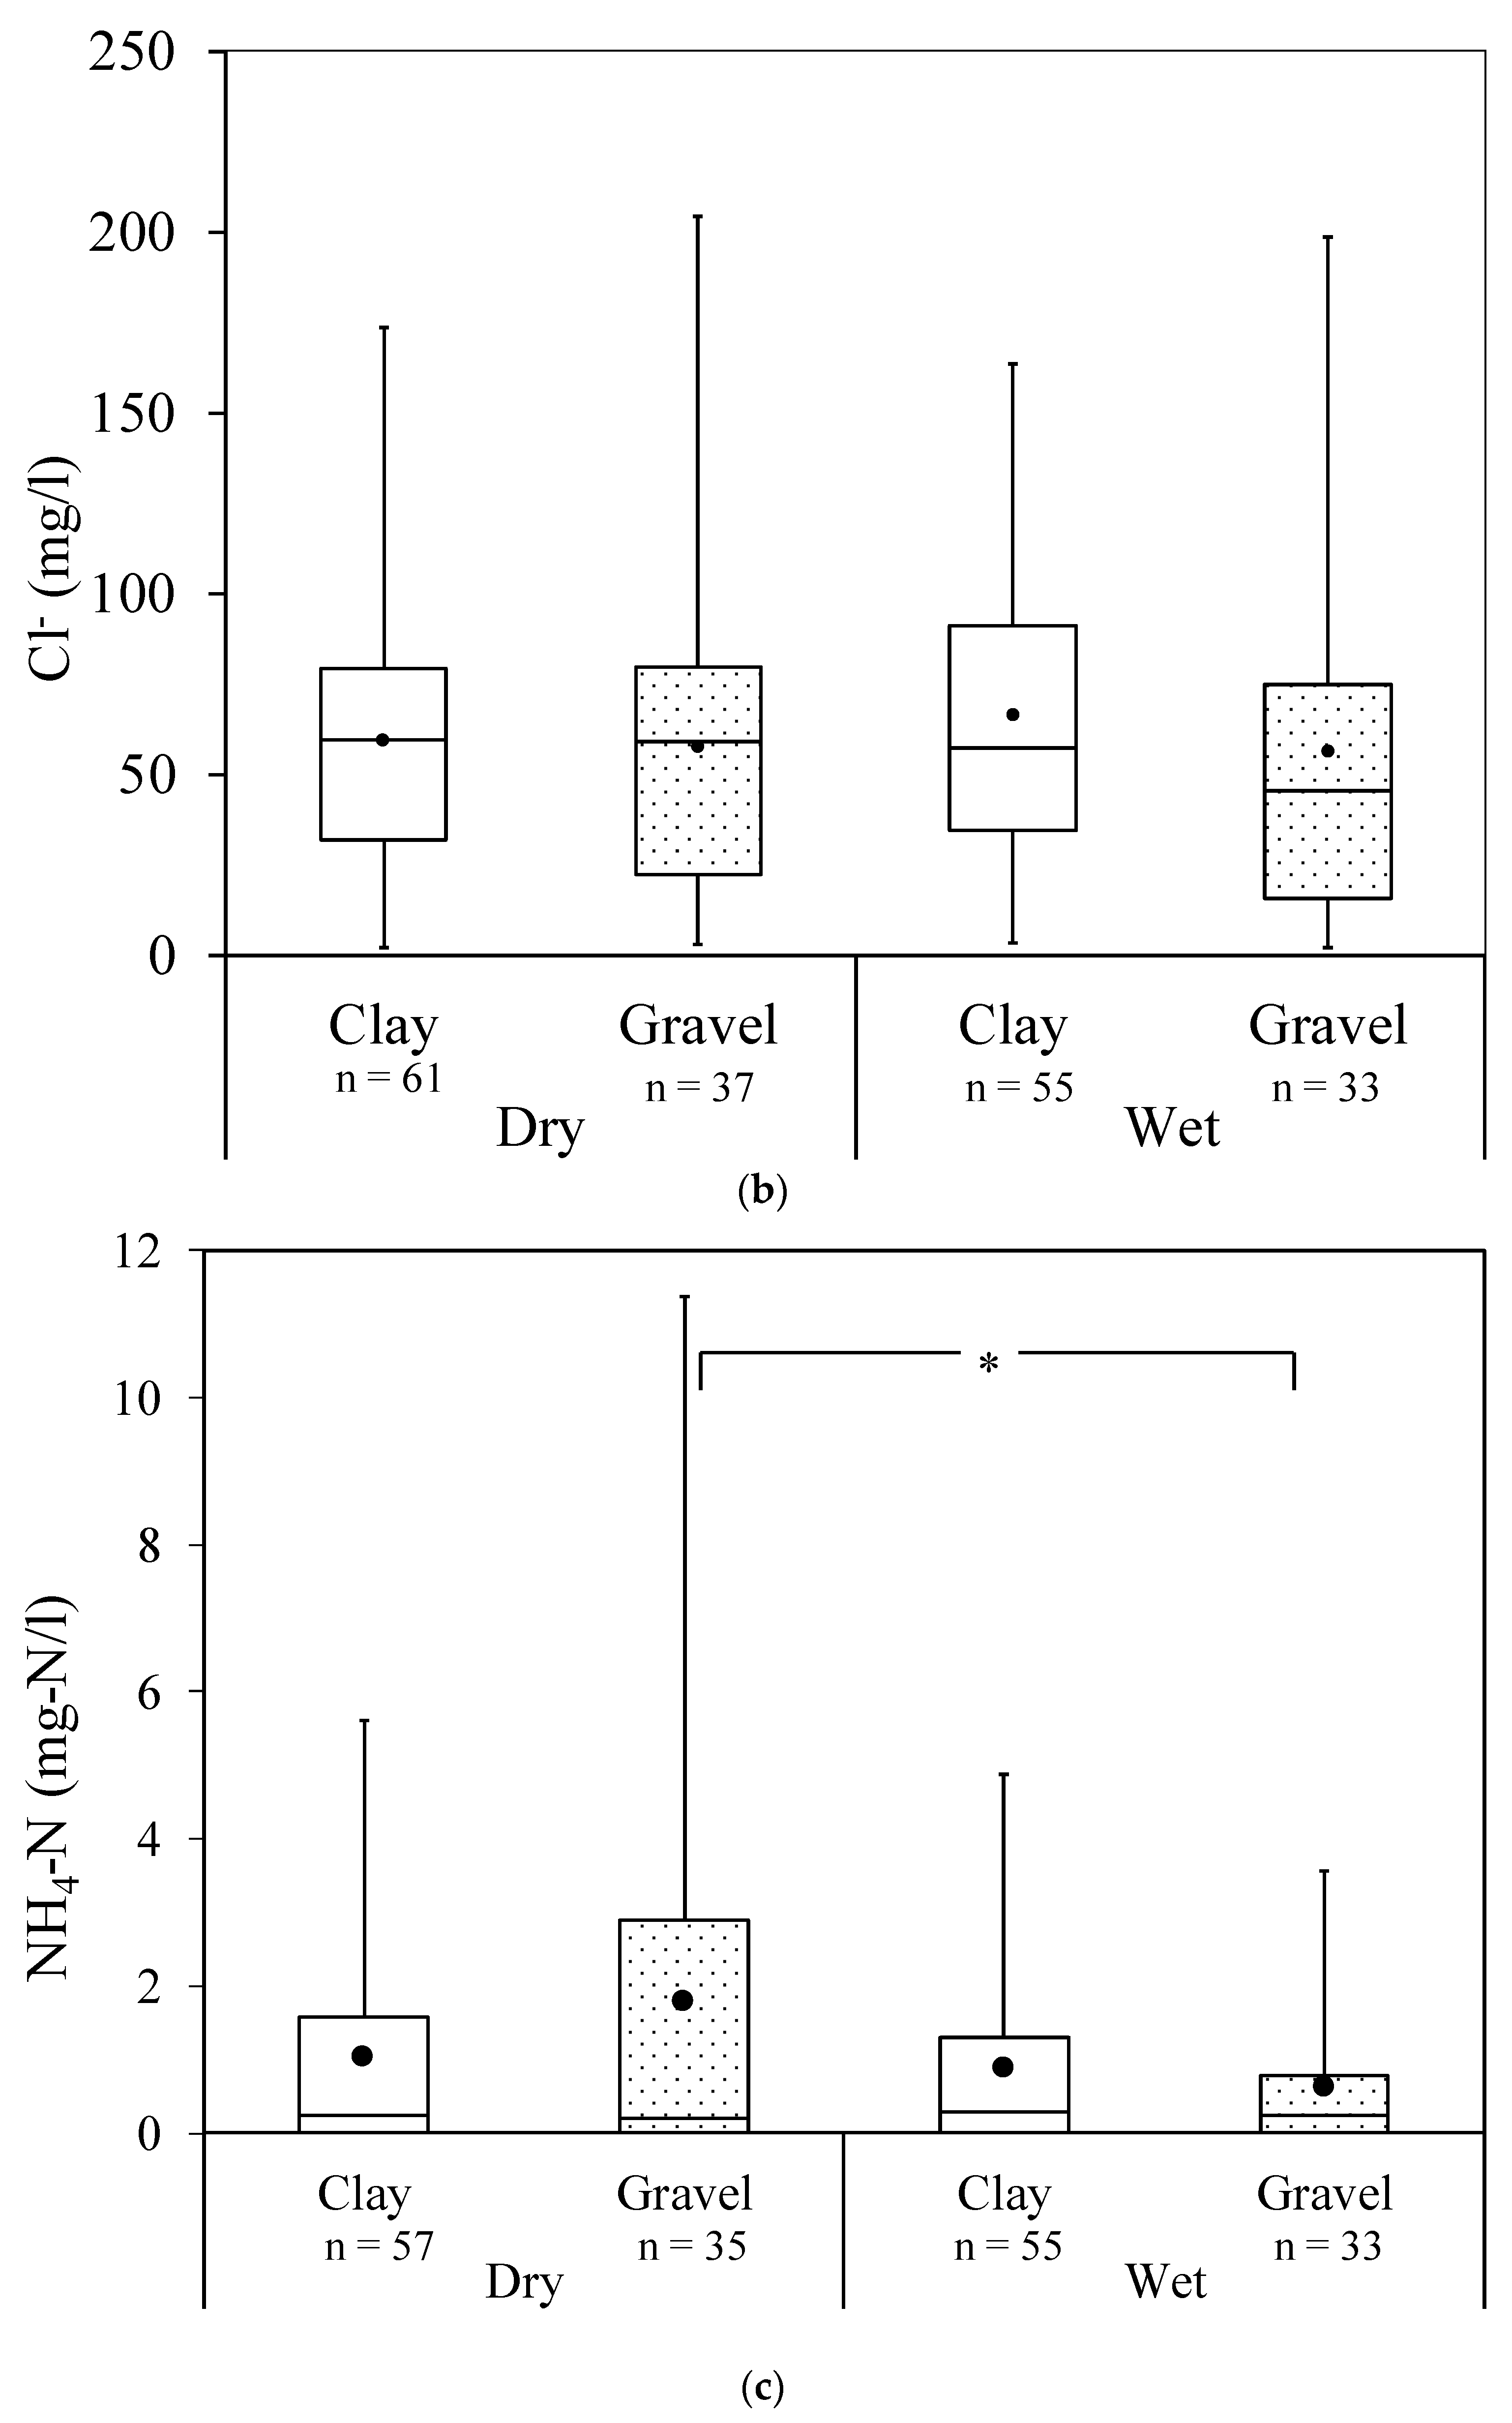
| Cl− (mg/L) | Min. | 2.3 | 3 | 3.3 | 2.2 | |
| Max. | 173.7 | 204.1 | 163.6 | 198.8 | ||
| Average | 59.5 | 57.6 | 66.5 | 56.1 | ||
| NH4-N (mg-N/L) | Min. | nd. | nd. | nd. | nd. | |
| Max. | 5.6 | 11.4 | 4.9 | 3.6 | ||
| Average | 1 | 1.8 | 0.9 | 0.6 | ||
| % Exceeding Std. (NDWQS = 1.2) | 29.8 | 40 | 27.3 | 16.1 | ||
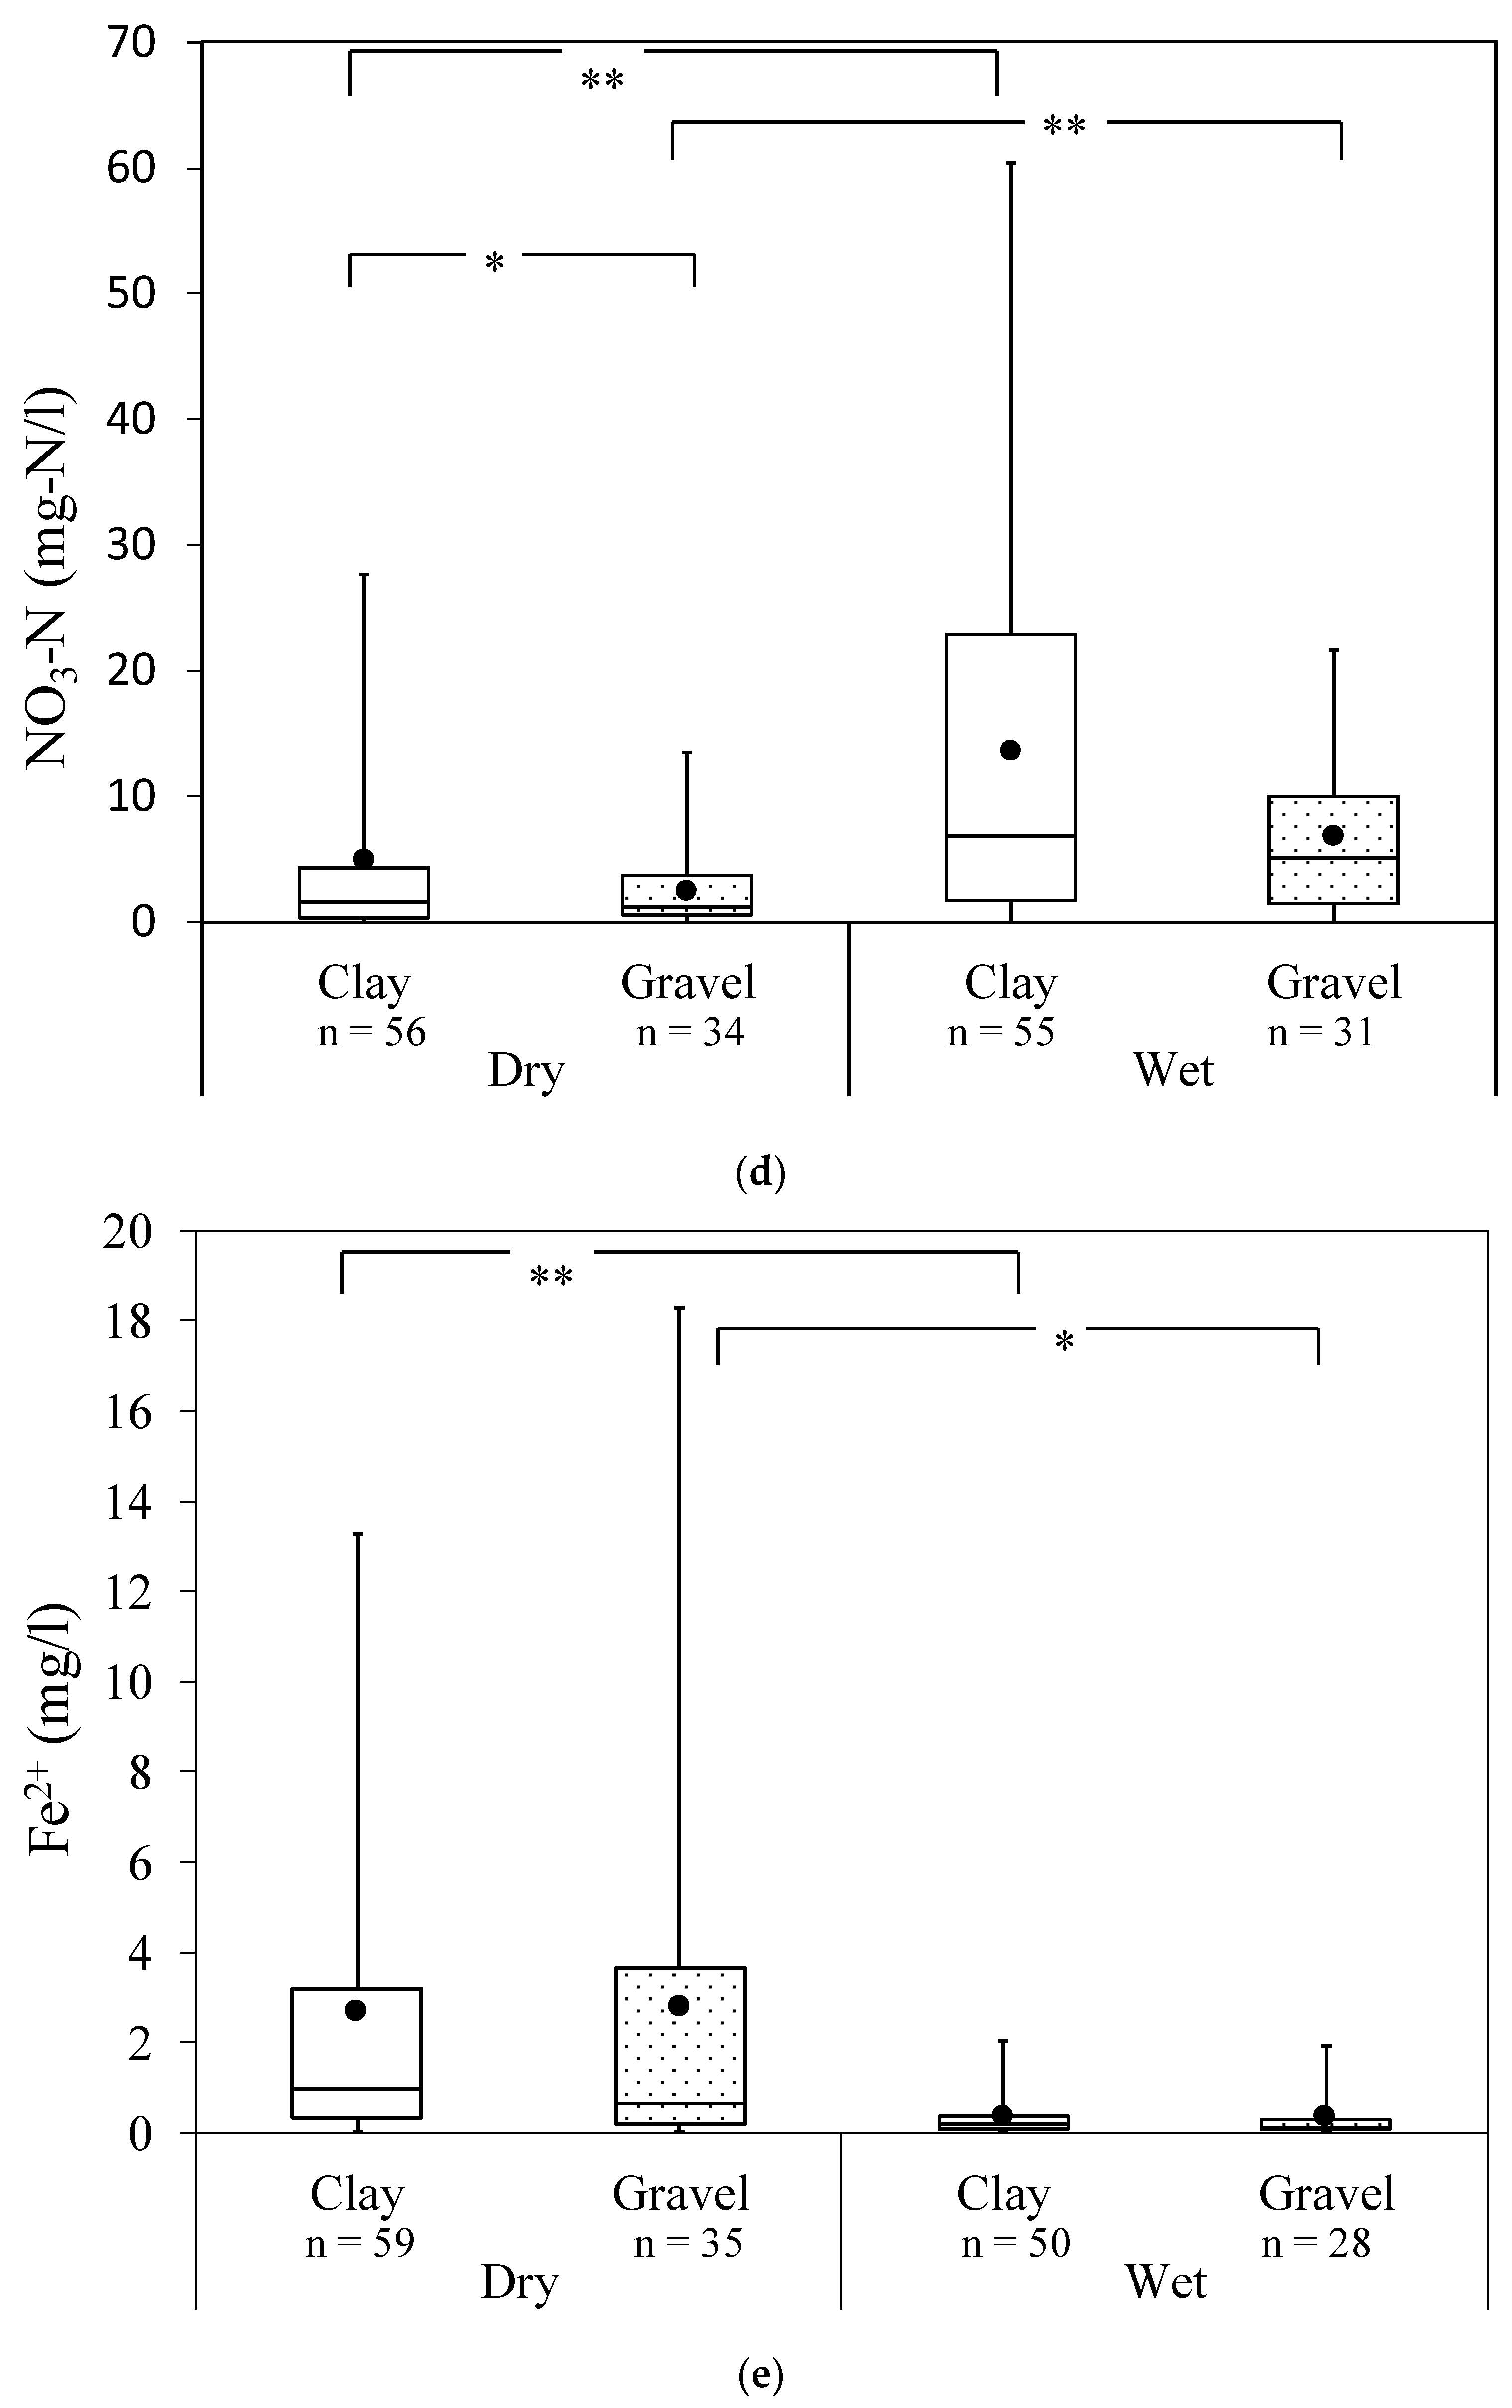
| NO3-N (mg-N/L) | Min. | nd. | nd. | nd. | nd. | |
| Max. | 27.6 | 13.4 | 60.3 | 21.6 | ||
| Average | 4.9 | 2.5 | 13.6 | 6.8 | ||
| % Exceeding Std. (NDWQS = 11.2) | 14.3 | 5.9 | 36.4 | 19.4 | ||
| Fe2+ (mg/L) | Min. | 0.02 | 0.03 | 0.02 | 0.03 | |
| Max. | 13.3 | 18.3 | 2 | 1.9 | ||
| Average | 2.7 | 2.8 | 0.4 | 0.3 | ||
| % Exceeding Std. (NDWQS = 0.3) | 76.3 | 62.9 | 34 | 25 | ||
| Location | NH4-N (mg-N/L) | NO3-N (mg-N/L) | Total Months Observed | ||
|---|---|---|---|---|---|
| Min | Max | Min | Max | ||
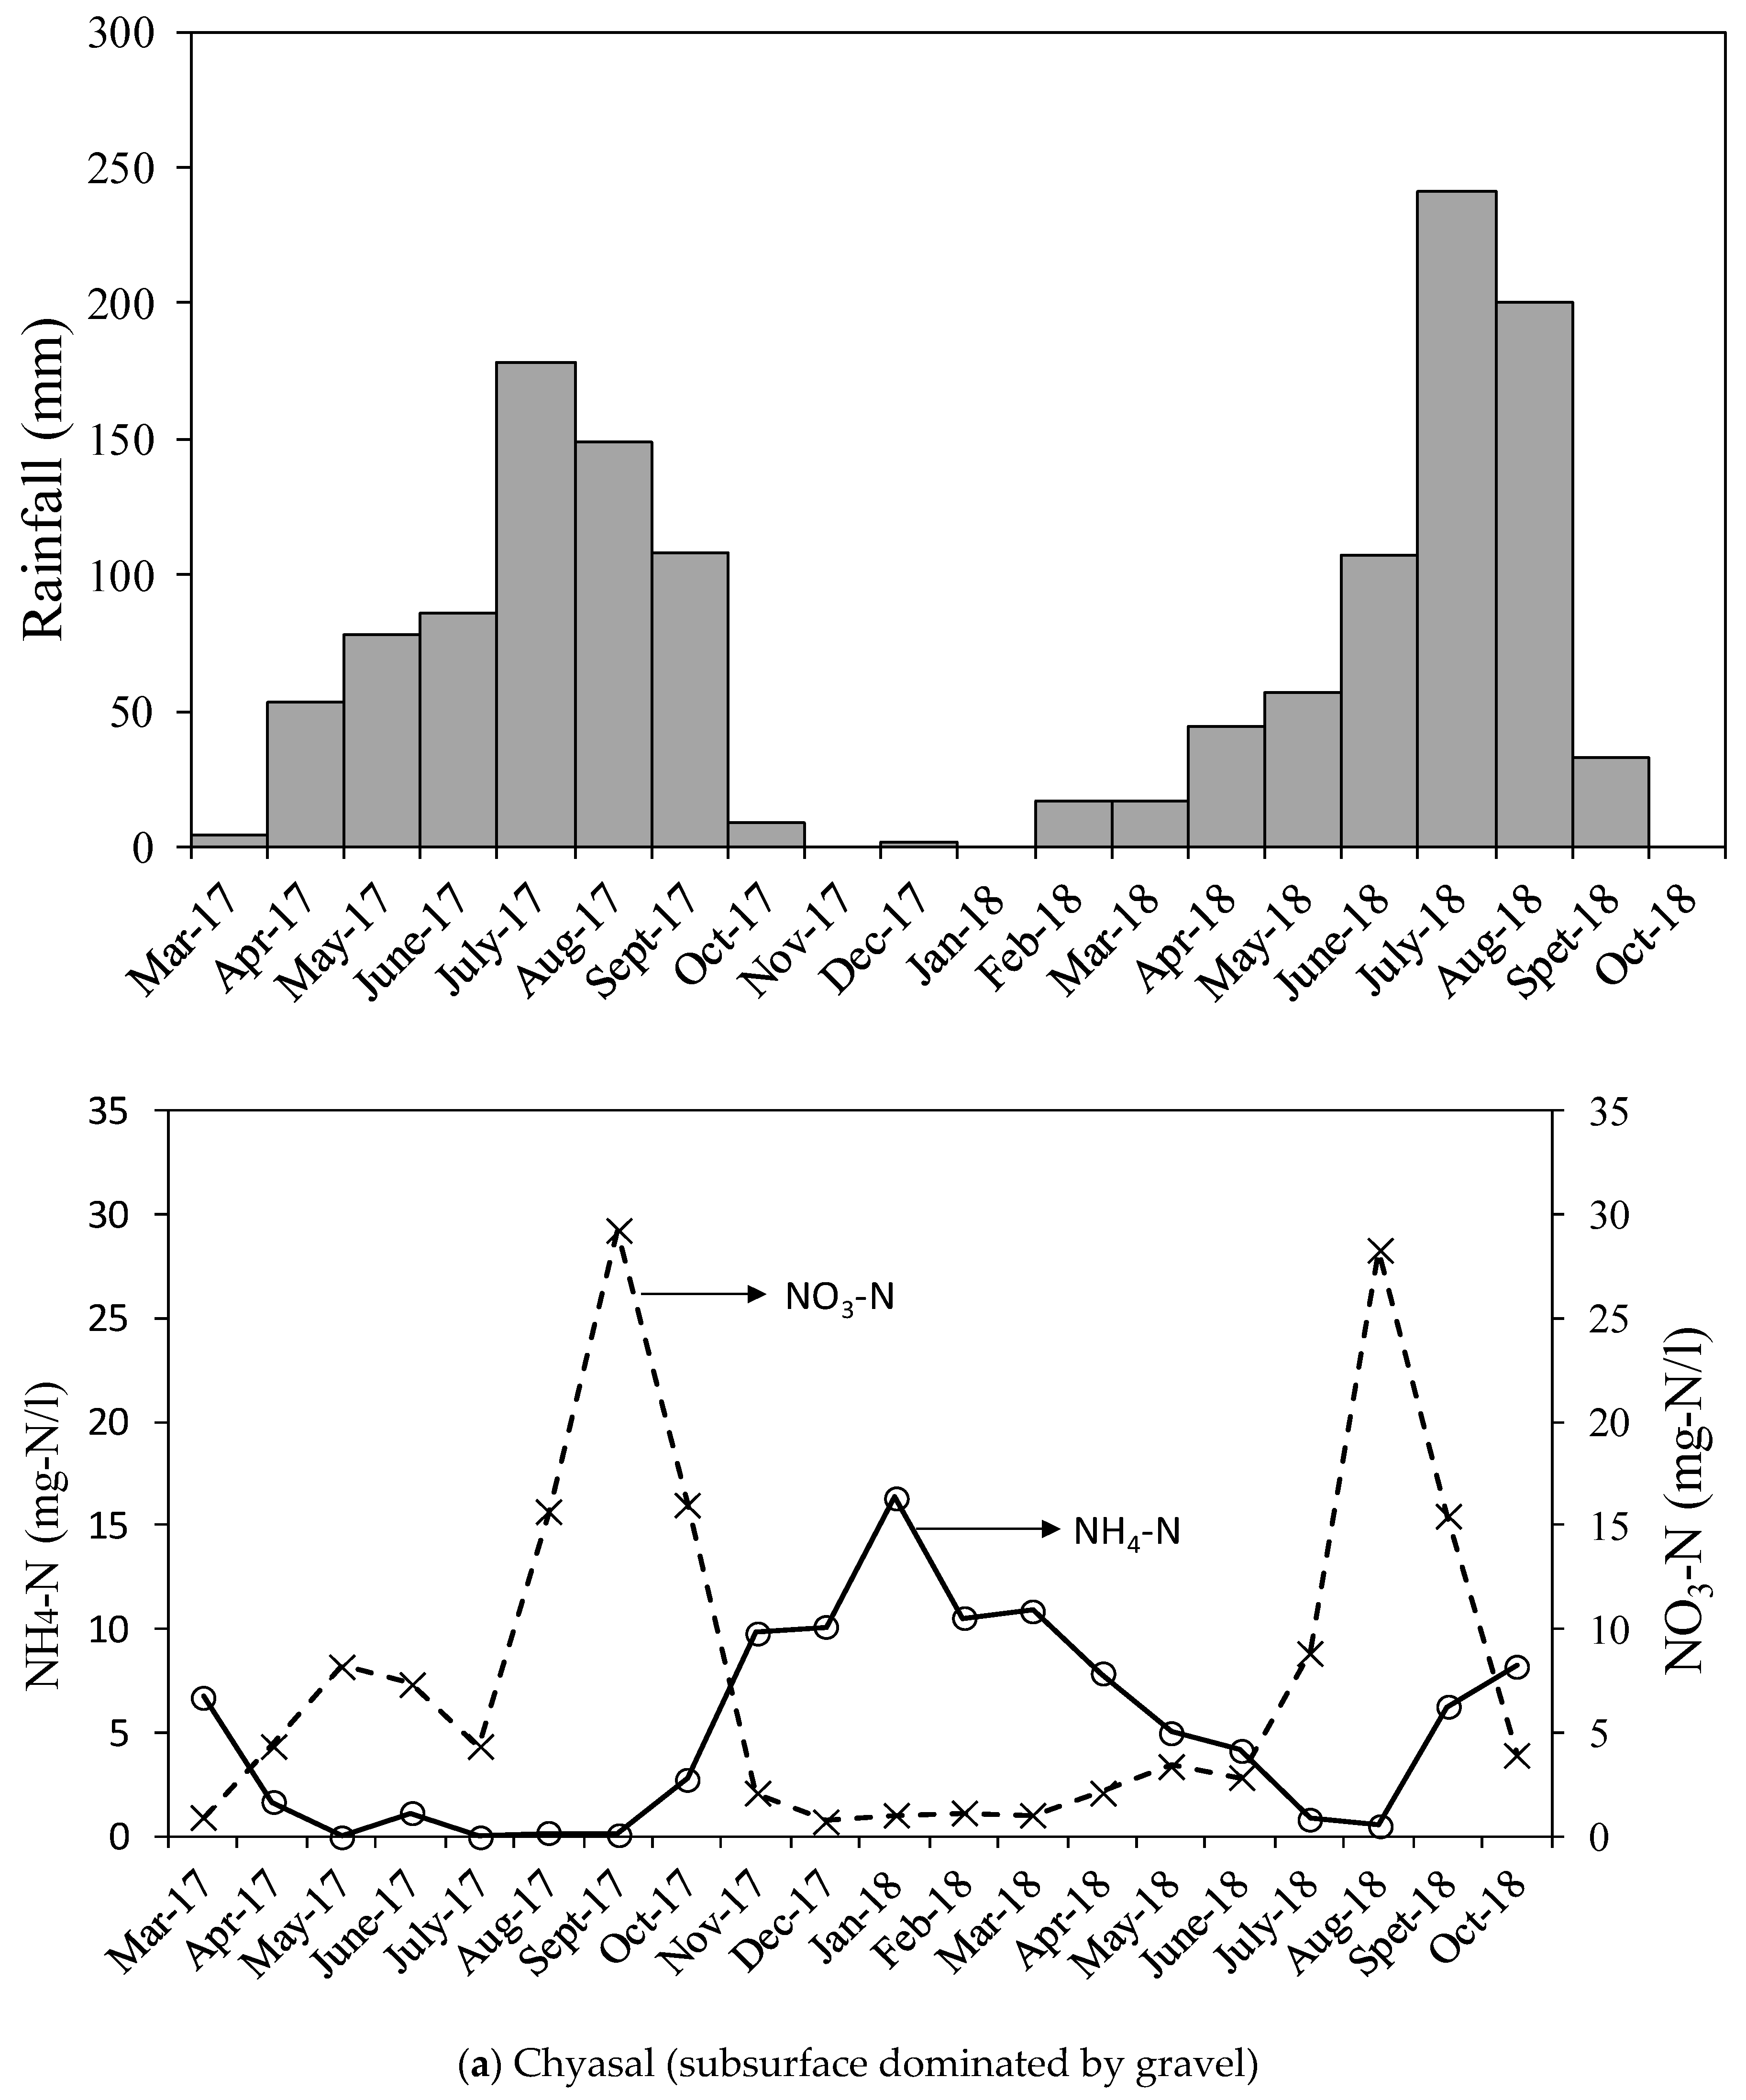
| Chyasal | nd. | 16.3 | 0.7 | 16 | 20 |
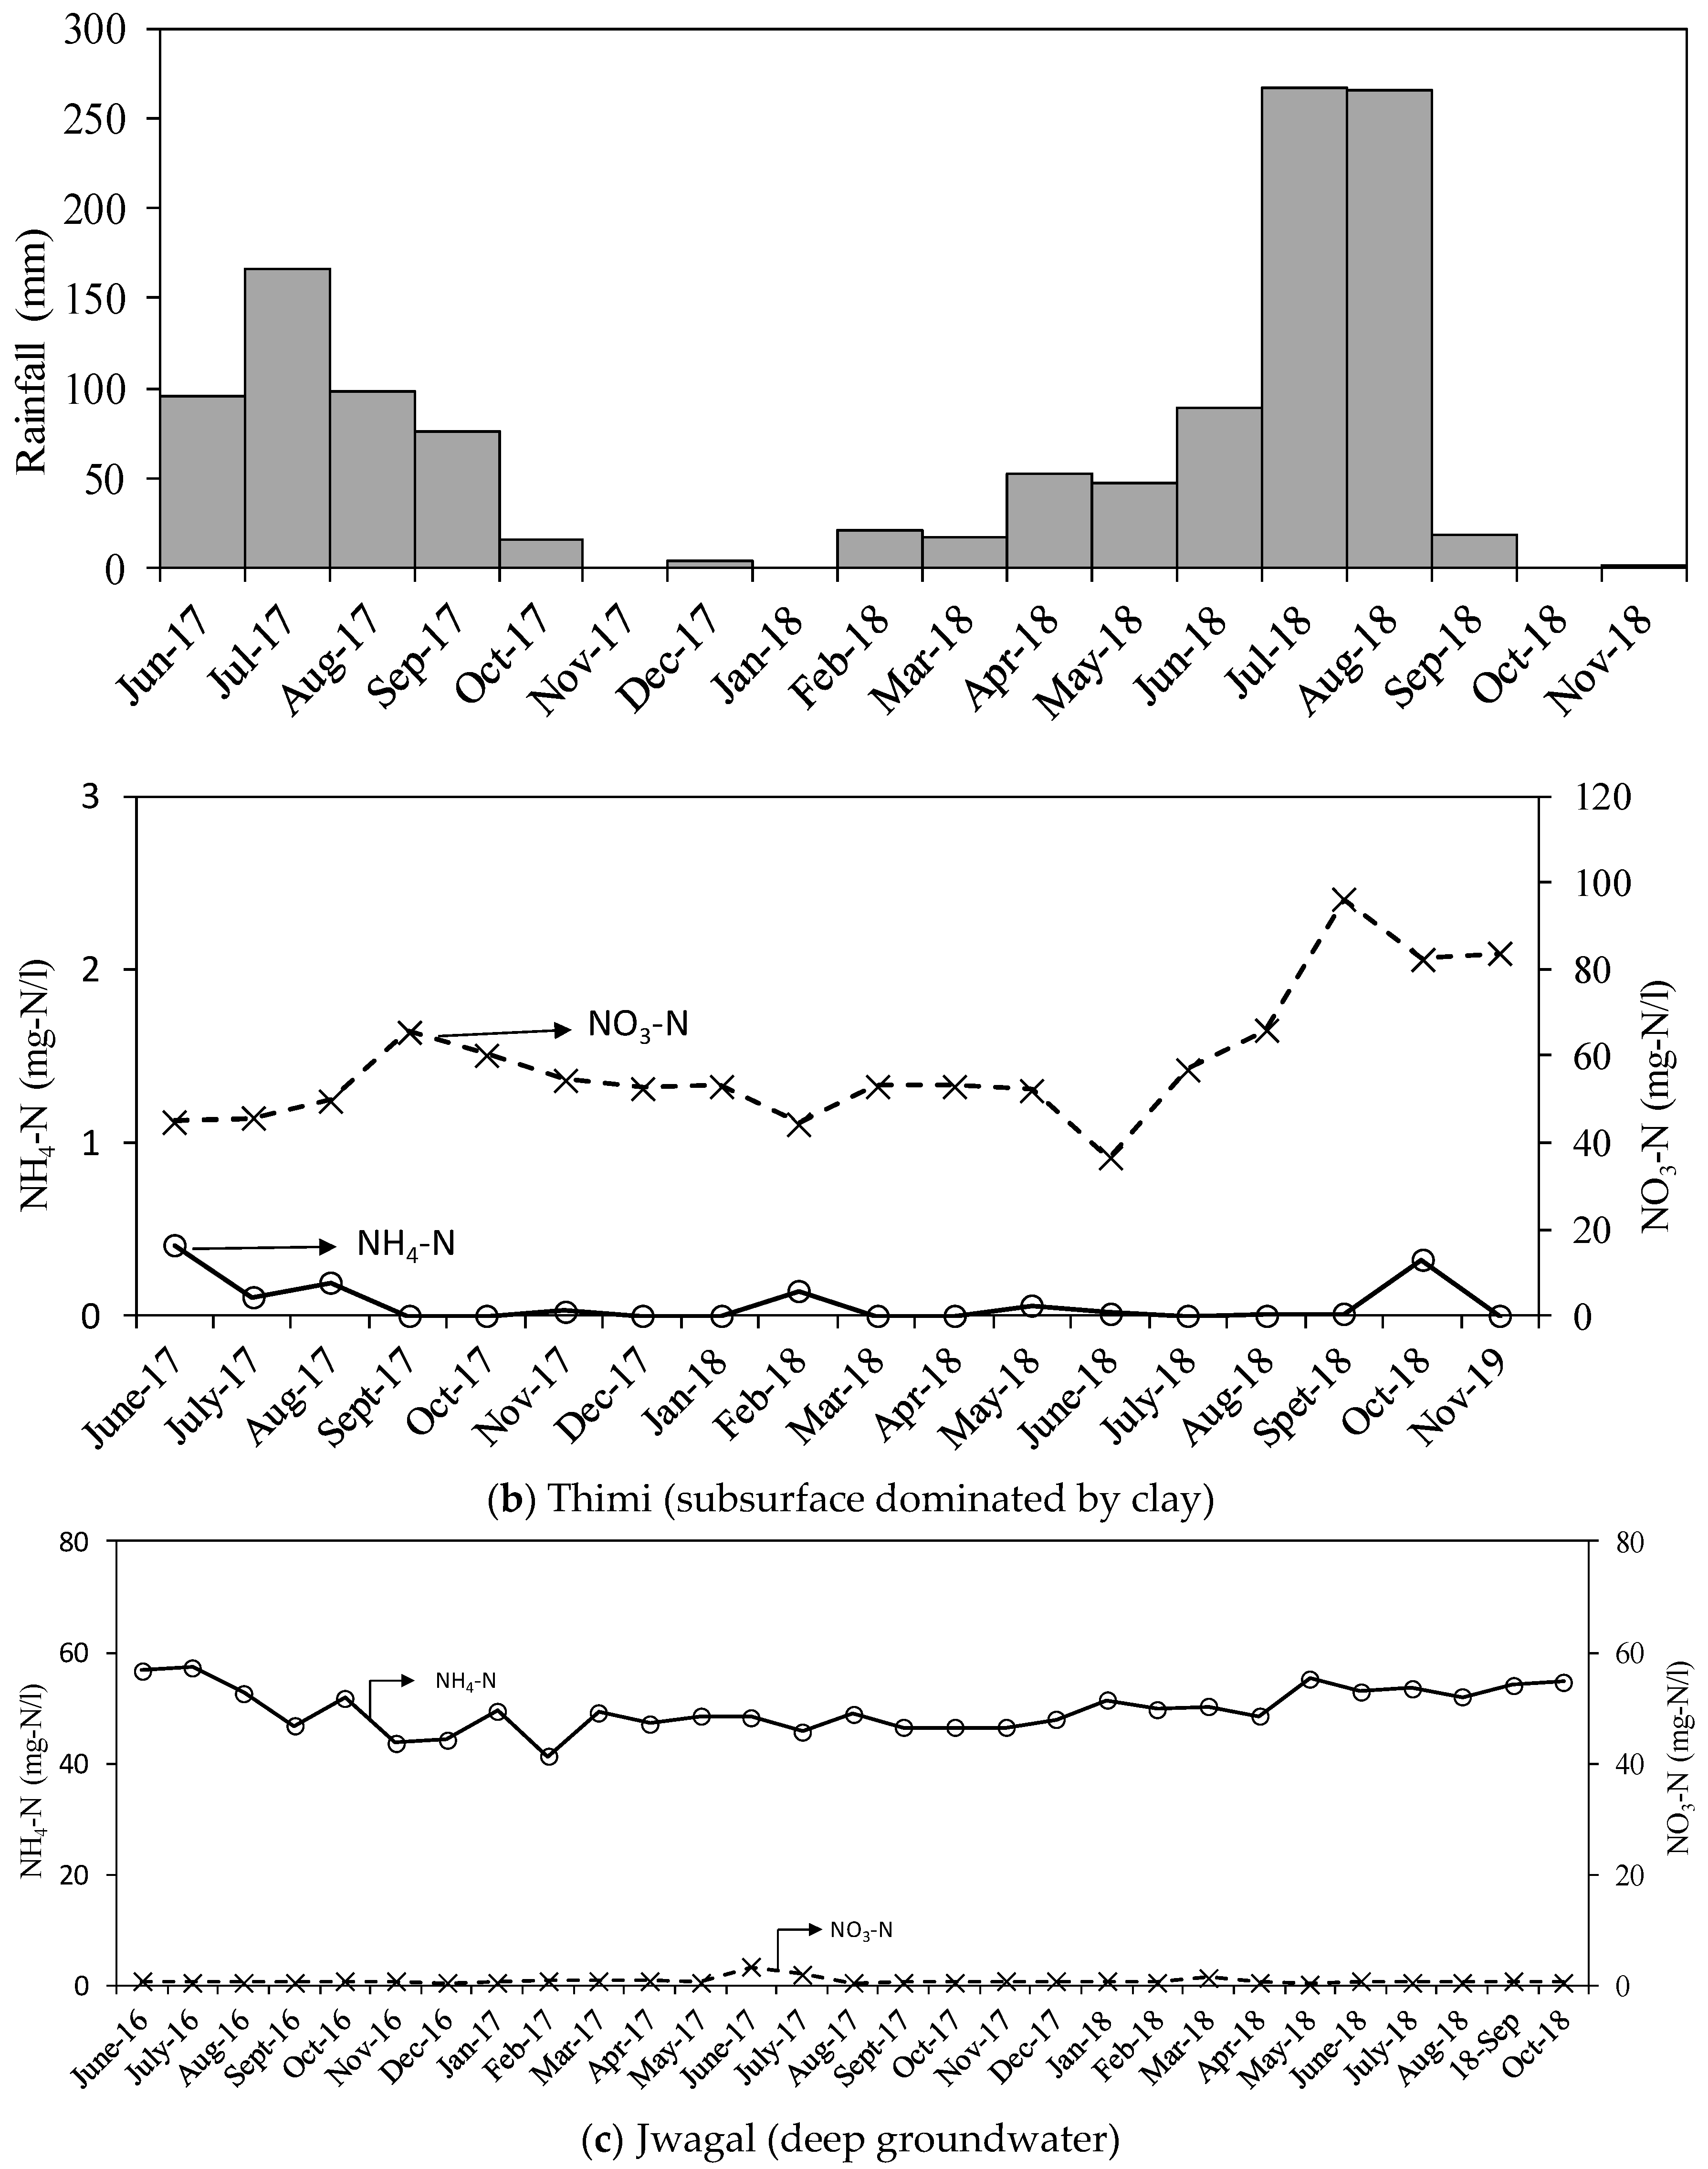
| Thimi | nd. | 0.4 | 36.5 | 96.2 | 18 |
| Jwagal | 41.2 | 57.3 | 0.4 | 3.4 | 29 |
| Location | δ15N-NO3 (‰) | δ18O-NO3 (‰) | ||
|---|---|---|---|---|
| Min | Max | Min | Max | |
| Chyasal | 4.5 | 16.3 | −0.7 | 6.52 |
| Thimi | 15.4 | 16.4 | 1.7 | 2 |
© 2019 by the authors. Licensee MDPI, Basel, Switzerland. This article is an open access article distributed under the terms and conditions of the Creative Commons Attribution (CC BY) license (http://creativecommons.org/licenses/by/4.0/).
Share and Cite
Shakya, B.M.; Nakamura, T.; Kamei, T.; Shrestha, S.D.; Nishida, K. Seasonal Groundwater Quality Status and Nitrogen Contamination in the Shallow Aquifer System of the Kathmandu Valley, Nepal. Water 2019, 11, 2184. https://doi.org/10.3390/w11102184
Shakya BM, Nakamura T, Kamei T, Shrestha SD, Nishida K. Seasonal Groundwater Quality Status and Nitrogen Contamination in the Shallow Aquifer System of the Kathmandu Valley, Nepal. Water. 2019; 11(10):2184. https://doi.org/10.3390/w11102184
Chicago/Turabian StyleShakya, Bijay Man, Takashi Nakamura, Tatsuru Kamei, Suresh Das Shrestha, and Kei Nishida. 2019. "Seasonal Groundwater Quality Status and Nitrogen Contamination in the Shallow Aquifer System of the Kathmandu Valley, Nepal" Water 11, no. 10: 2184. https://doi.org/10.3390/w11102184