Potential Benefits of Managed Aquifer Recharge MAR on the Island of Gotland, Sweden
by
 ,
,
Peter Dahlqvist
1,*, 
Karin Sjöstrand
2,3,
Andreas Lindhe
3,
Lars Rosén
3,
Jakob Nisell
1,
Eva Hellstrand
1 and
Björn Holgersson
1 1
Geological Survey of Sweden, Lund/Uppsala/Gothenburg, Sweden (SGU); Villavägen 18, 752 36 Uppsala, Sweden
2
RISE Research Institutes of Sweden, 223 70 Lund, Sweden
3
Chalmers University of Technology, 412 96 Göteborg, Sweden
*
Author to whom correspondence should be addressed.
Water 2019, 11(10), 2164; https://doi.org/10.3390/w11102164
Submission received: 6 August 2019
/
Revised: 15 October 2019
/
Accepted: 16 October 2019
/
Published: 17 October 2019
(This article belongs to the Special Issue Managed Aquifer Recharge for Water Resilience)
Abstract
:The Island of Gotland (3000 km2), east of mainland Sweden, suffers from insufficient water availability each summer. Thin soils and lack of coherent reservoirs in the sedimentary bedrock lead to limited reservoir capacity. The feasibility of Managed Aquifer Recharge (MAR) is explored by identifying suitable areas and estimating their possible contribution to an increased water availability. MAR is compared to alternative water management measures, e.g., increased groundwater abstraction, in terms of costs and water availability potential. Results from GIS analyses of infiltration areas and groundwater storage, respectively proximity to surface water sources and surface water storage were classified into three categories of MAR suitability. An area of ca 7700 ha (2.5% of Gotland) was found to have good local conditions for MAR and an area of ca 22,700 ha (7.5% of Gotland) was found to have moderate local conditions for MAR. These results reveal the MAR potential on Gotland. The water supply potential of MAR in existing well fields was estimated to be about 35% of the forecasted drinking water supply and 7% of the total water demand gap in year 2045. It is similar in costs and water supply potential to increased surface water extraction.
1. Introduction
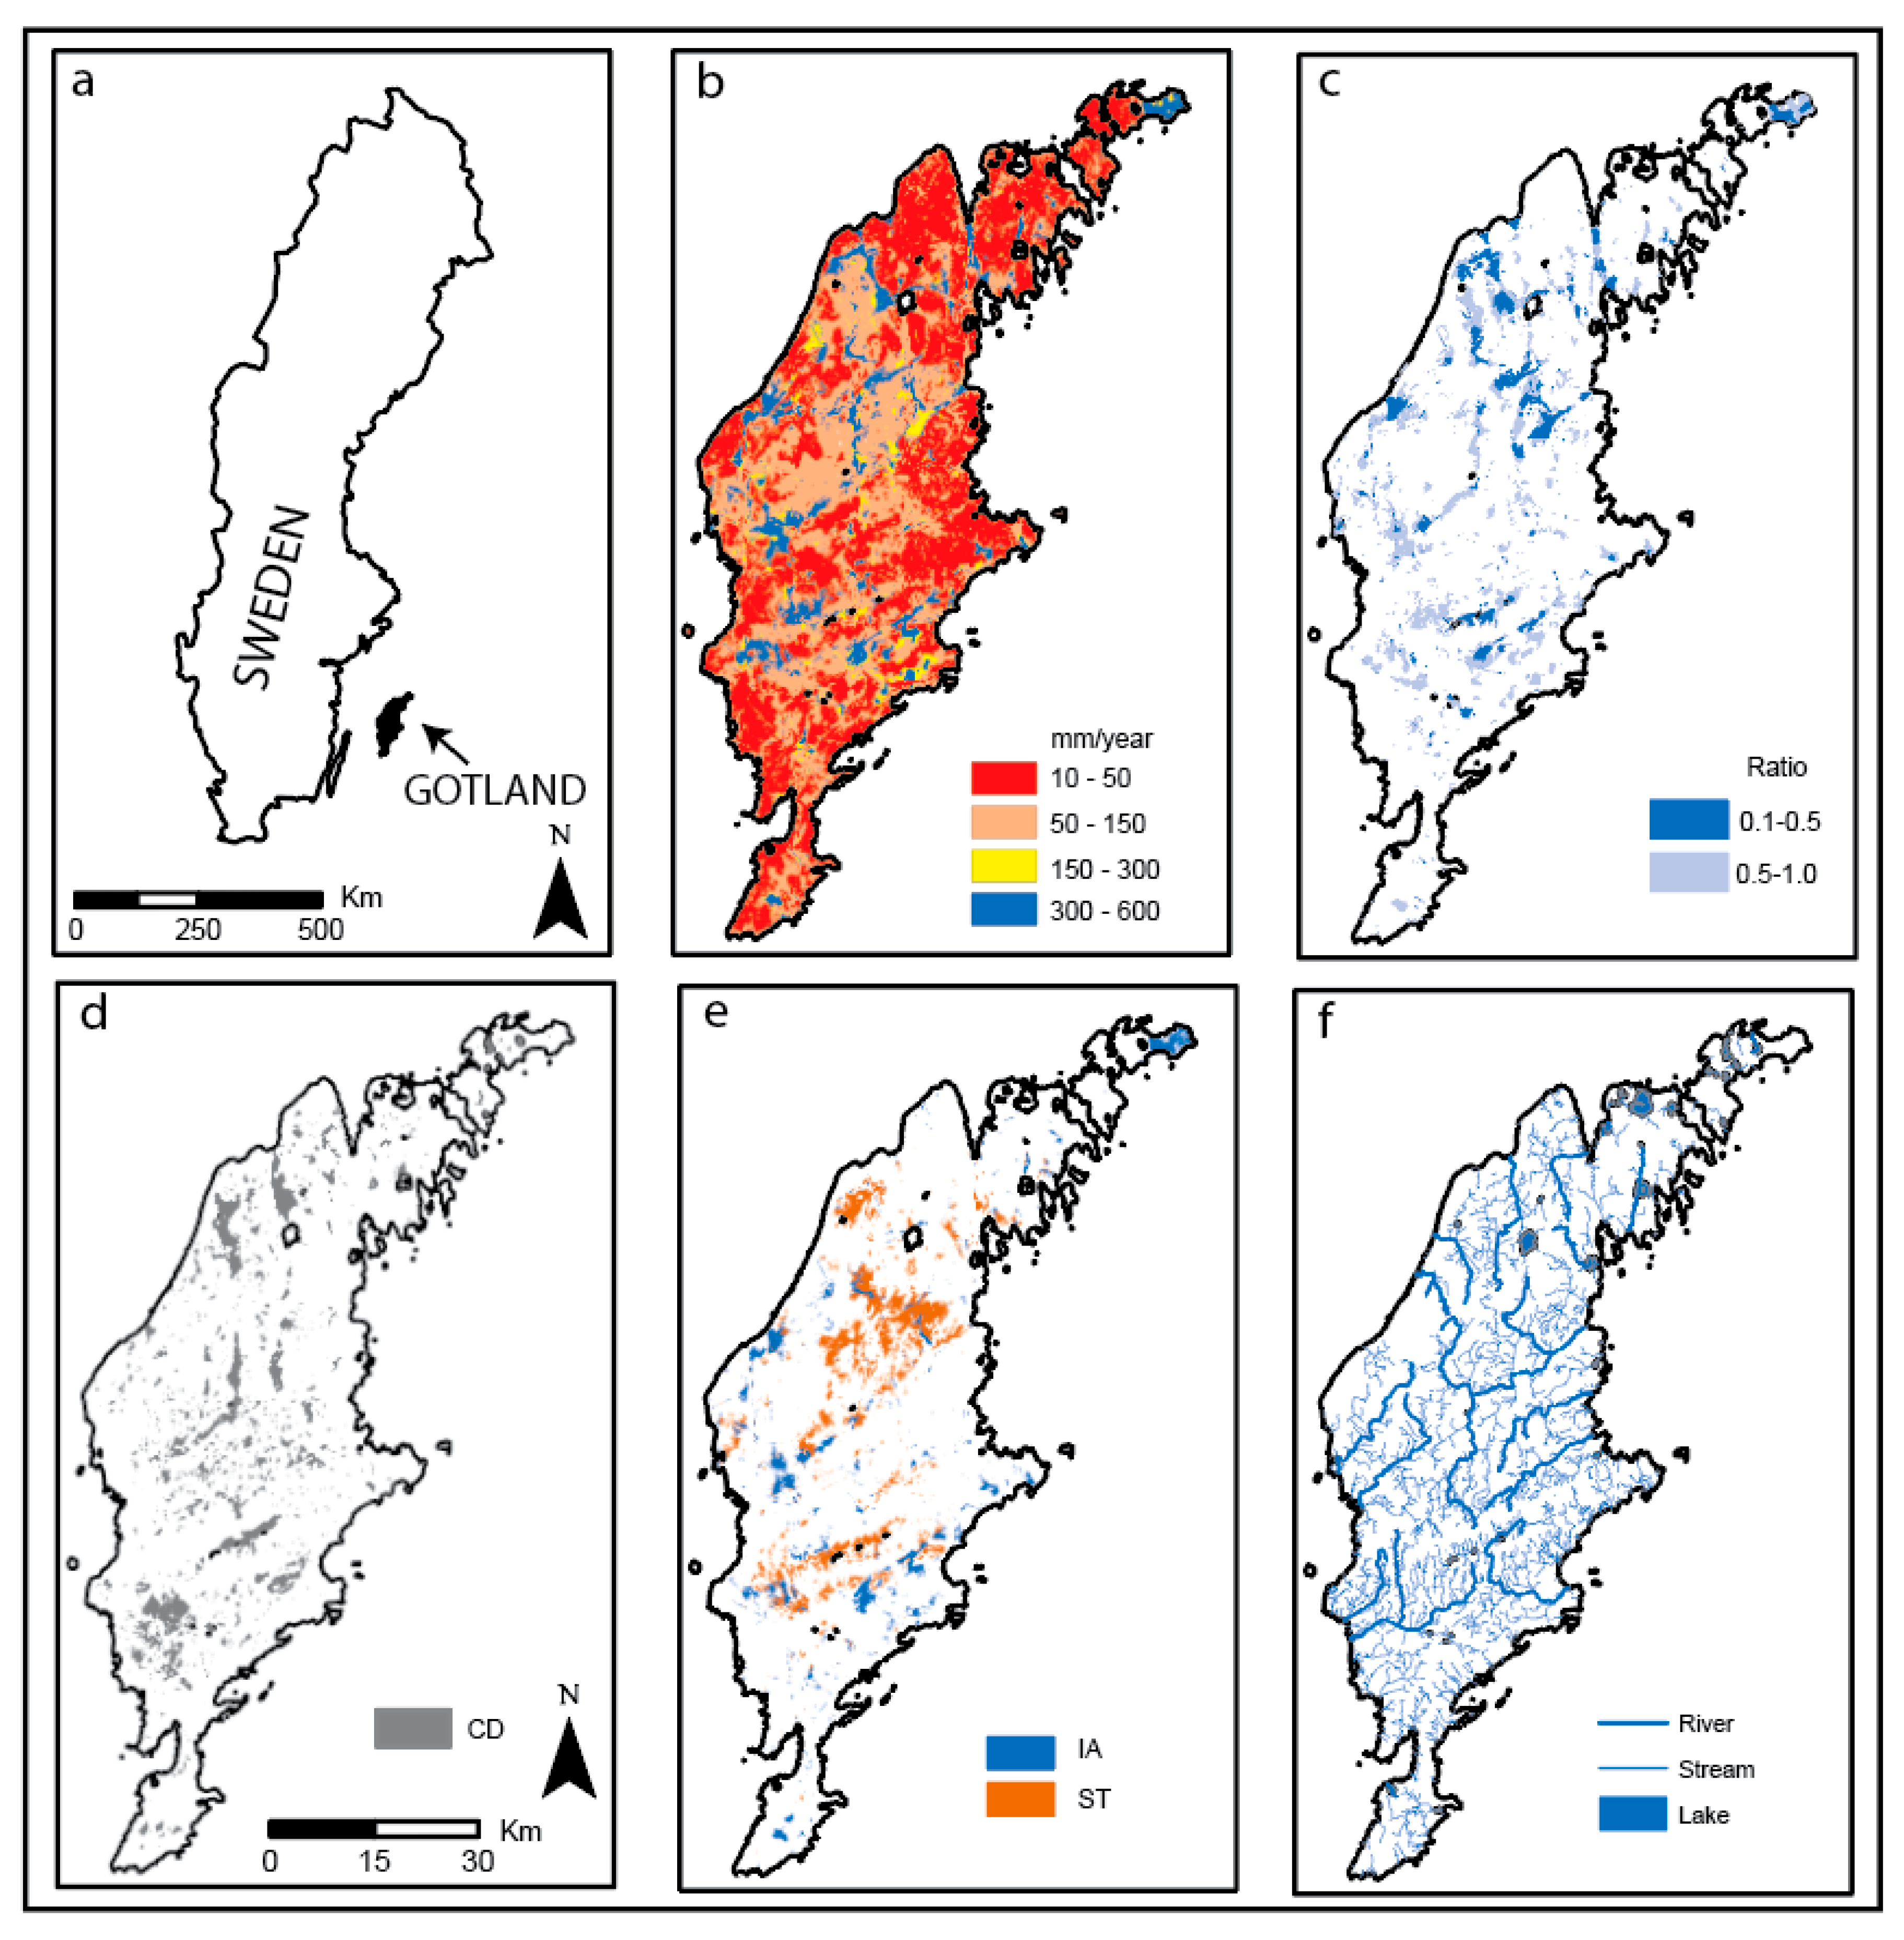
The Island of Gotland (3000 km2), situated in the Baltic Sea 100 km from the mainland of Sweden (Figure 1a), suffers from insufficient water availability to supply the ever-increasing demand from society, especially during the tourist season (June–August, [1]). The annual precipitation on the island (ca 550 mm/year) is sufficient to cover a forecasted increase in water demand. However, intensive drainage of arable land, thin soil layers, and relatively impermeable rock lead to precipitation run-off and limited reservoir capacity in both surface water and groundwater reservoirs [2]. The already constrained water supply will be further aggravated in the future because the total water demand on the island is estimated to increase by 40% by 2045 [1]. The current water resources on the island will not meet this projected increase in demand. A high availability of water during the winter and a high demand for water in the summer makes MAR a suitable way to increase the water resources. Due to these factors, it is important to investigate the potential for MAR on Gotland.
The bedrock on Gotland consists mainly of Silurian limestone and marlstone, which represents the upper part of a 250–800-m-thick sequence with Palaeozoic sedimentary rocks overlying the crystalline basement [3]. The Quaternary overburden is generally thin (less than 2 m) and is largely composed of till and postglacial sand deposits. The relief is low, and the highest point is 82 m a.s.l. The main land uses are agricultural and forestry. The main aquifers on Gotland are situated within the bedrock where cracks, fractures and dissolution cavities store and transport the groundwater. Nevertheless, the soil layers have an important role to play because areas with soil, especially sand and gravel, act as infiltration and storage systems for the bedrock aquifer. The island may be considered one large aquifer, but with groundwater divides (created by relief) producing 7 (sub)aquifers, according to the European water framework directive. Saline groundwater is a problem because relict saltwater occurs under the entire island at a depth of 20–100 m b.s.l.
The total water demand on the island is estimated to increase by more than 40% by 2045, with increases of 30% in tourism, 20% in domestic demand, 20% in animal keeping, 15% in industry, and 100% in irrigation [1]. To enhance water resource security, and close the water supply and demand gap, several alternative water management measures are being examined. Managed Aquifer Recharge (MAR) is one of them. Today, the public water supply on Gotland relies on 14 well fields, two surface water catchments and a desalinisation plant. MAR is currently not used in any public water supply on Gotland, but may play an important role in the future if suitable areas can be found. Conversely, on the Swedish mainland, MAR has been in use for over 100 years, and accounts for approximately 20% of the public water supply [1,4]. MAR can be explained as the intended recharge into and storage of water in an aquifer [5]. It may be used to increase water security for uses including drinking water supply, irrigation, preventing saltwater intrusions, as well as providing environmental benefits [6]. MAR is widely distributed and applied on various scales around the globe, as well as in Europe [7]. The water source can be of varied origin, e.g., river water, seawater or sewer water. In some cases, there is a need for pre-treatment before groundwater recharge to minimize the risk of pollution or aquifer clogging [8]. The recharge can be made by spreading methods in areas with high infiltration capacity; by deep infiltration direct into the aquifers via wells; or as induced infiltration due to withdrawal [9]. Since the different MAR types are suitable for different conditions within hydrogeological settings (e.g., confined or unconfined aquifers), treatment opportunities, and land use, the selection of suitable recharge sites is crucial [10,11]. In this study, we focus on areas suitable for recharge through infiltration basins and natural conditions for storage. Conditions for well or induced infiltration are expected to be of minor importance because of the geomorphology, geology and hydrology of the island. Hence, the suitability of those MAR types is not investigated in this study.
To prioritize between alternative measures to improve water resources security (e.g., increased groundwater abstraction and desalination), useful decision support is needed. GIS-MCDA (Geographical Information System Multi Criteria Decision Analysis) [12] is a regularly applied method in MAR suitability assessment [13]. There are several possible criteria for mapping MAR suitability, the three most common being aquifer storage capacity, geomorphology and soil [13]. There are also concerns on limitations and discussion on the uncertainties of these GIS approach made visible by e.g., [14]. Although a GIS analysis will show where MAR might be successful, field work and numerical modelling will be important tools for increasing the success of MAR [15,16,17,18,19]. The economic assessment of MAR is an important question that has been studied previously [20,21,22]. The aim of this paper is to explore the feasibility of MAR on the island of Gotland by: identifying potential areas for MAR in proximity to a fresh water source and which are available for recharge; estimate the possible increase in groundwater recharge and groundwater extraction at existing wellfields; and compare MAR to other alternative measures in terms of costs and water availability potential.
2. Materials and Methods
2.1. Materials
Mapping of potential MAR locations on Gotland is based mainly on the existing data listed as follows: Intensive hydrogeological investigations from two campaigns of airborne transient electromagnetic surveys (2013–2015, SkyTEM resistivity measurements along flight lines covering 30% of the island, with 200 m spacing and geophysical soundings every 30 m) [23,24]; a site-specific overview in 2016 of groundwater catchments of the 14 existing well fields that showed that 30% of those well fields had a favorable geology and hydrology for spreading and induced infiltration-based MAR types [2]; 3D geological and hydrogeological models (Geoscene 3D by I-GIS) of the entire island (2015–2019, available online in 2020) based on resistivity models from the SkyTEM survey; existing geological information such as bedrock and soil maps (regional scale); seismic profiles and information from water wells; and national scale mapping (2018) of groundwater recharge and storage capacity [25] provide comprehensive additional data for assessing the potential of MAR on Gotland.
2.2. Methods
A GIS-based (Boolean logic) approach was used to find suitable locations for MAR systems (in this study focusing on areas suitable for recharge through infiltration on the surface) on Gotland. No parameter weighting was included. Several mapping projects assessing suitability for MAR have been made globally [13]. GIS was used for analysis of 5 surface and subsurface datasets, which are presented below. Three of these (1–3) concern the MAR location, and two (4 and 5) further explore the MAR location to determine if there are local sources of water supply for the MAR site.
- The aquifer storage capacity of the soil and bedrock were previously estimated by the Geological Survey of Sweden (SGU) on a national scale (Figure 1b) and should be used with caution on scales below 1:100,000 on Gotland. The groundwater storage capacity is based on assessments of porosity of soil and bedrock types, soil thickness, groundwater surface and possible drawdown caused by groundwater withdrawal [25]. A modeled annual groundwater recharge map for Sweden (national scale, coarse resolution) was made in 2006 [26]. Values of natural groundwater recharge on Gotland used in this analysis were either 200 or 260 mm/year, depending on location. A raster containing the ratio between groundwater recharge and groundwater storage capacity was created, and values below 1.0 indicate areas with potential to store more groundwater than the natural recharge, i.e., they might be suitable for MAR. This raster is abbreviated as GS and is shown in Figure 1c.
- The geological 3D model for Gotland includes a bedrock surface. A GIS analysis identified depressions in the bedrock surface, assuming that these areas are generally favorable for storage of groundwater. Some of these areas coincide with lakes, whereas others are “hidden” depressions with little or no surface expression because they have been infilled by soils. A selection was made to show only closed depressions larger than 1 hectare and with no contact with the Baltic Sea. Water has a higher potential in these areas for storage without being lost as a shallow groundwater outflow through the permeable soil (Figure 1d). The resulting raster is named Closed Depressions (CD).
- Through selection from the lithological 3D model of Gotland, areas with >4 m thickness of sand and/or gravel (Figure 1e) were identified. This geological environment is important on both local and regional scales because these high permeability deposits increase infiltration to the bedrock aquifer. The resulting raster is abbreviated as IA.
- To assess the possibility of storing surface water in dams, areas with over 4 m thickness of till and or clay were selected from the lithological 3D model of Gotland (Figure 1e). In these areas the construction of sufficiently large storage dams will be a relatively easy and cheap operation since the construction material can be sourced on site. The resulting raster is abbreviated as ST (Surface water storage).
- Because of arable land drainage, thin soil cover and relatively impermeable bedrock, most streams and rivers on Gotland have high flow rates during the winter (November–March; [1]). Even small streams can serve as good sources of water supply if the water can be stored (e.g., in man-made dams or wetlands) until the spring and summer. Lakes are rare on the island and mostly very shallow. Lakes and streams may both be regulated to increase the available source but that is not discussed in this paper. A GIS-based analysis of proximity to surface waters was made with a buffer of 0.2 km on smaller streams (sometimes intermittent) and 0.5 km for perennial rivers and lakes (Figure 1f, raster abbreviation S). This difference in distance reflects a variation in the estimation of cost effectiveness and can be further explored.
In addition to the above analyses, two further GIS analyses were completed with a combination (overlap with no priority weight) of data on favorable areas for infiltration (Figure 2a) and surface water source and storage (Figure 2b).
To make estimations of possible increases in groundwater recharge and groundwater extraction through MAR, in relation to current well fields, favorable groundwater catchments were identified [5]. This was done using a GIS-aided and analytical approach. The values presented here for potential infiltration rate and increased withdrawal volumes are estimations with an inherent uncertainty. The estimates are based on access to surface waters of adequate size, presence and sufficient thickness of permeable sediments, the possibility of creating dams with local material, and current withdrawal capacity.
MAR was compared to other alternative measures (i.e., increased groundwater abstraction, enhanced water reuse for irrigation, increased surface water extraction, metered leak detection and desalination) in terms of annual water availability potential and economic viability. The measures were selected for inclusion in the analysis based on the outcome of a multidisciplinary stakeholder workshop, in which the participants were asked to identify measures with potential to improve the water resource security on the island. The comparative method was based on marginal abatement cost curves [27,28], including cost–benefit and cost-effectiveness analyses. The costs of the measures included investment costs, operating costs and cost savings. The measure costs were described by present values (PVs) [29], analyzed with a 3.5% discount rate over the 27-year time horizon from year 2019 to 2045 (corresponding to the current water plan period applied at Gotland) and based on 2018 prices. The NPVs were then expressed as equivalent annual costs (EACs) in SEK (Swedish krona) per year [30]. A theoretical maximum level of implementation was assumed for each measure category, except for desalination, which instead was based on estimates of one new desalination plant. The estimated cost and water availability input variables were based on a combination of literature data, expert judgements and GIS-based analyses. The unit cost of each measure was calculated as the ratio of the measure’s EAC and annual water availability potential.
3. Results
3.1. Mapping of Suitable MAR and Source Areas
Results are described in three parts; areas where the geology is favorable for infiltration and/or groundwater storage (IA (Infiltration Areas) + GS (Groundwater Storage) + CD (Closed Depressions)); areas with proximity to a surface water source and/or suitable for surface water storage (S (Source) + ST Surface water storage)); and areas where these overlap (IA + GS + CD + S + ST).
3.1.1. Infiltration Areas and Areas for Groundwater Storage (IA + GS + CD)
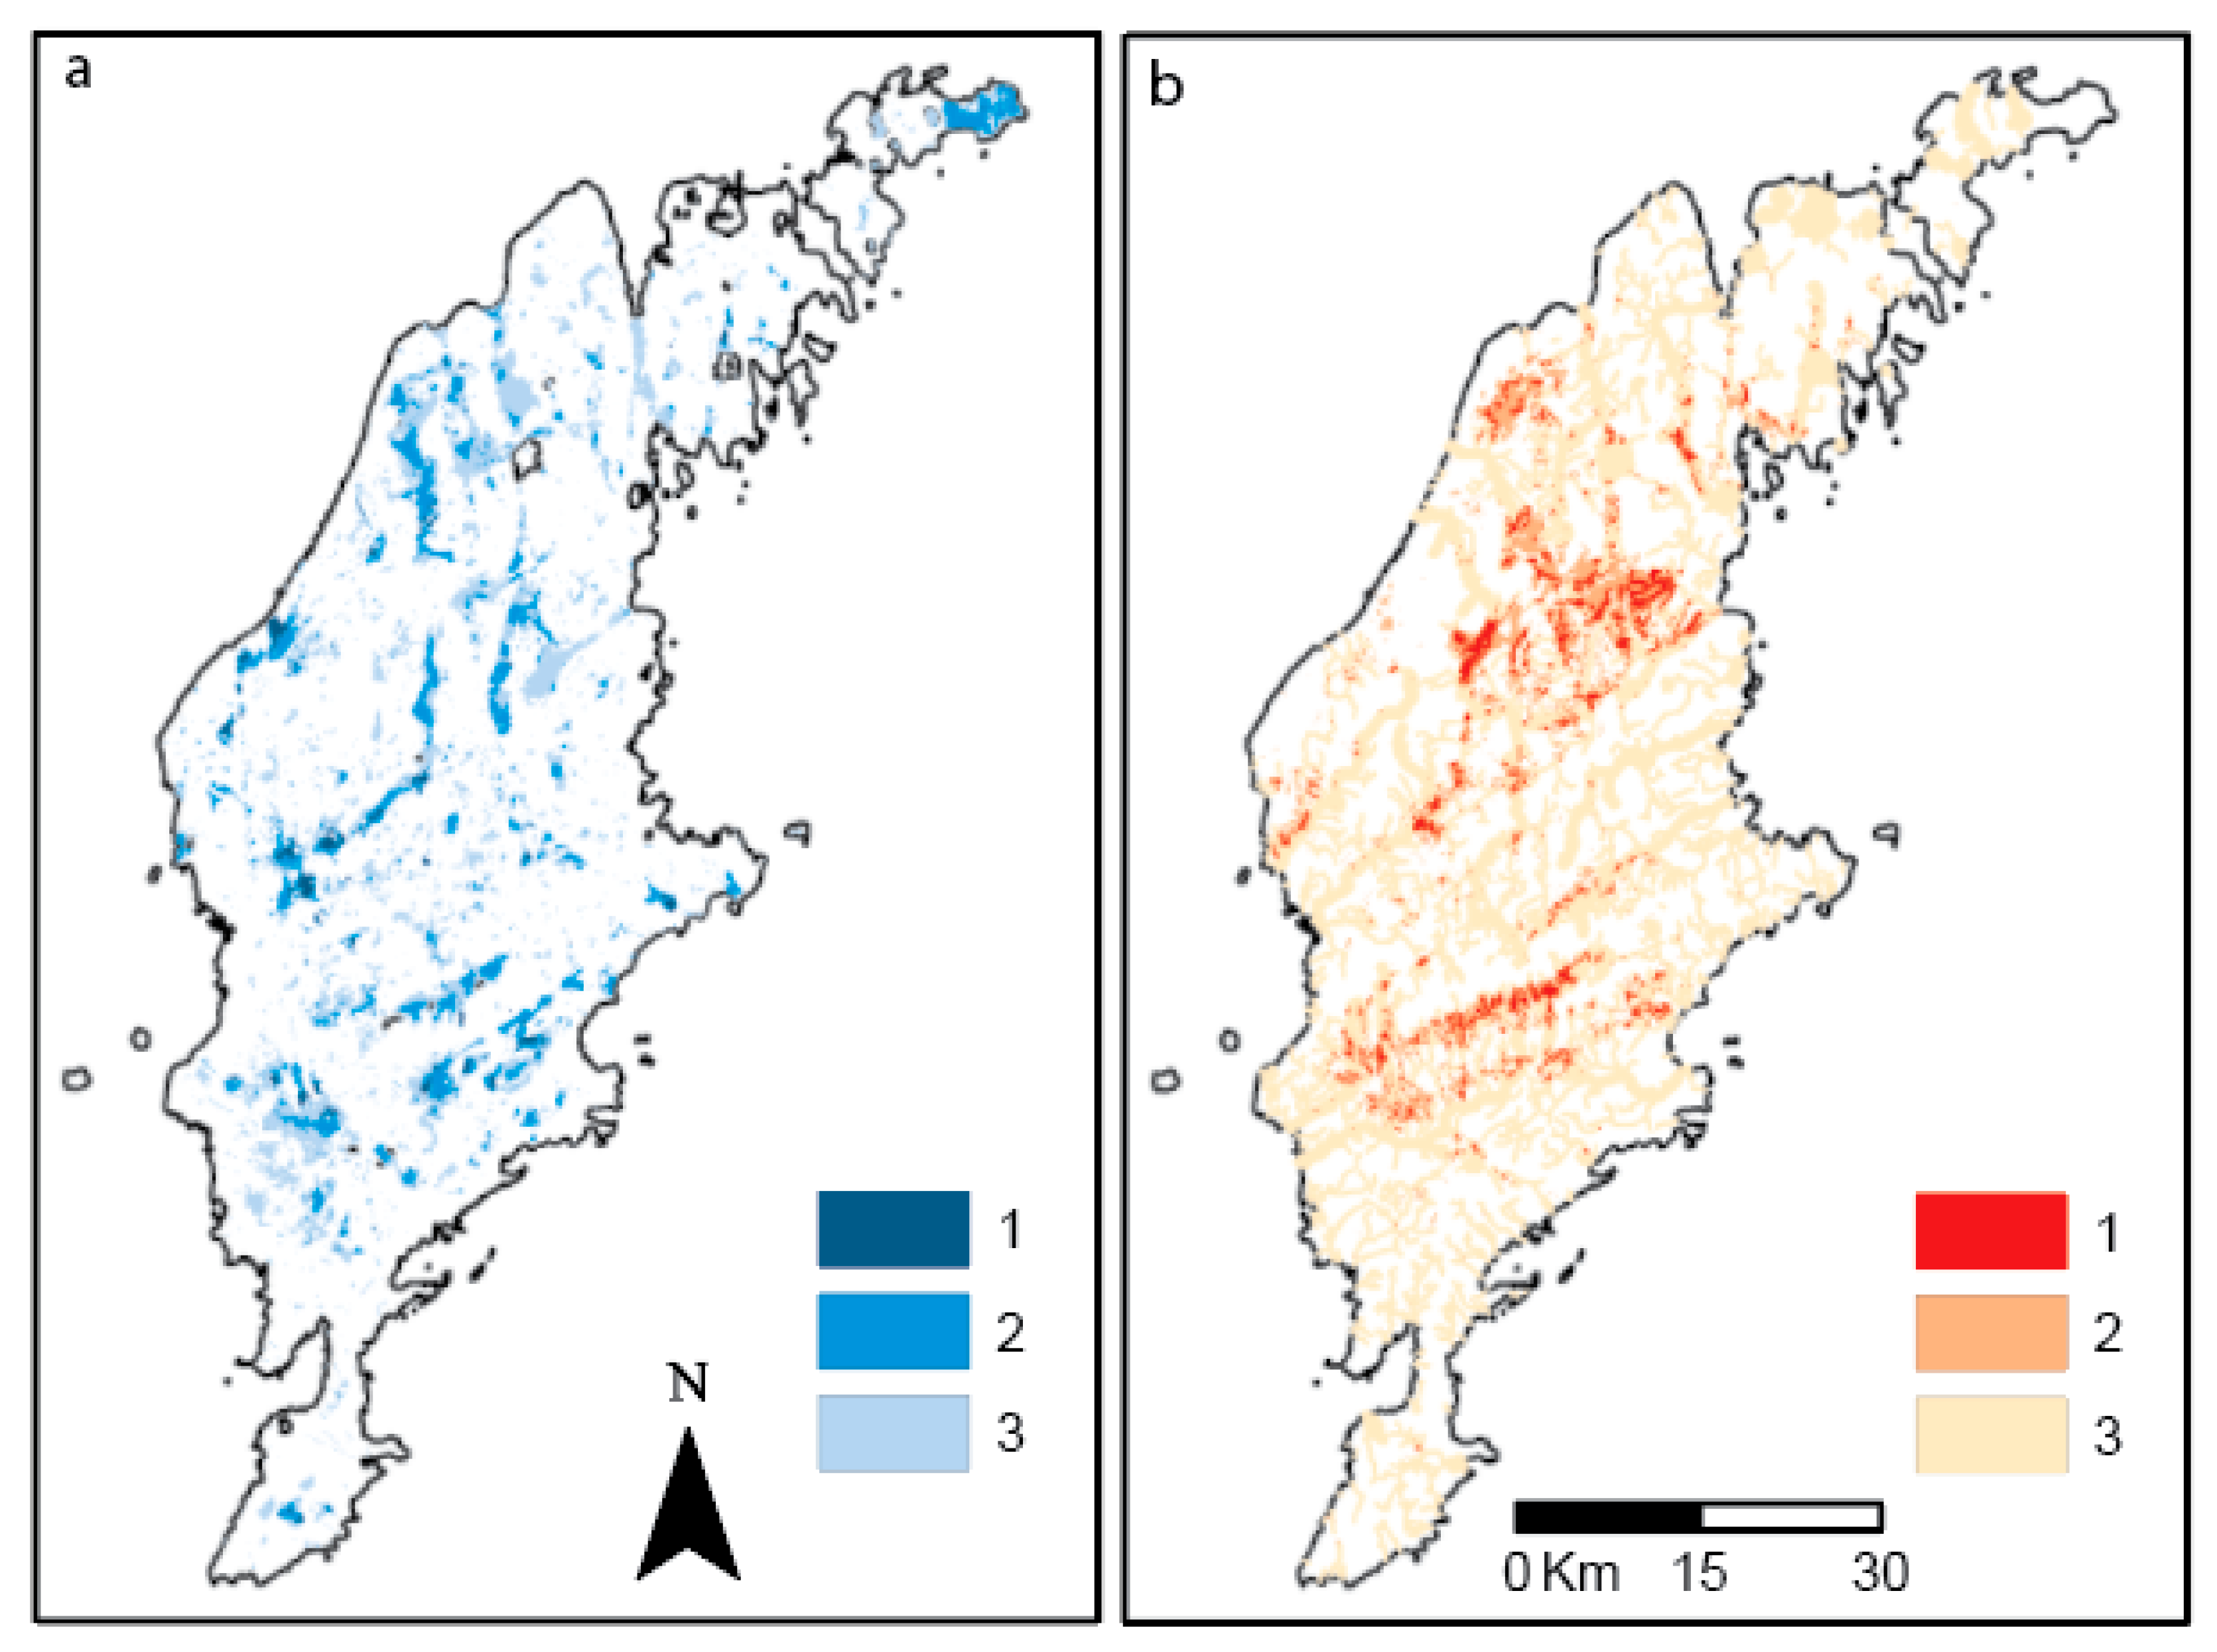
Three data sets regarding the possibility for an area to be suitable for artificial groundwater recharge were combined into a raster set (Figure 2a). The resulting raster was divided into three classes: areas with three (class 1), two (class 2) or one (class 3) of the included favorable attributes. A raster with class 1 has a good potential for both infiltration and groundwater storage. Areas with class 2 or 3 are less suitable because one or two of the included raster sets (IA, GS, CD) is absent. Class 1 is present in 2068 ha (0.7% of Gotland), class 2 in 14,437 ha (4.8% of Gotland), and class 3 in 43,453 ha (14.4% of Gotland).
3.1.2. Source and Suitable Areas for Surface Water Storage (S + ST)
The source for artificial groundwater recharge in this investigation is natural surface waters from streams, rivers and lakes. To regulate and decide where there are favorable infiltration conditions there is also a need for a seasonal surface storage, in this investigation in the form of man-made dams. In this study, we do not discuss present land use and slope—two factors that might influence outcomes—but we regard them as having a minor influence (see Discussion) on Gotland. The combination of these sources with possibilities of constructing storage capacity is shown in Figure 2b. The resulting dataset is divided into three classes: (1) areas with both a nearby raw water source and good conditions for storage in surface dams (10,271 ha, 3.4% of Gotland); (2) areas with good conditions for dams, but more than 0.2 km (smaller intermittent streams) or 0.5 km (perennial rivers and lakes) from a source (10,345 ha, 3.5% of Gotland); and (3) areas with a source but the distance to a suitable storage area (dam) is more than 0.2 km (smaller intermittent streams) or 0.5 km (perennial rivers and lakes, 112,468 ha, 37% of Gotland).
3.1.3. Areas with Combination of Infiltration, Groundwater Storage, Source and Surface Water Storage (IA + GS + CD + S + ST)
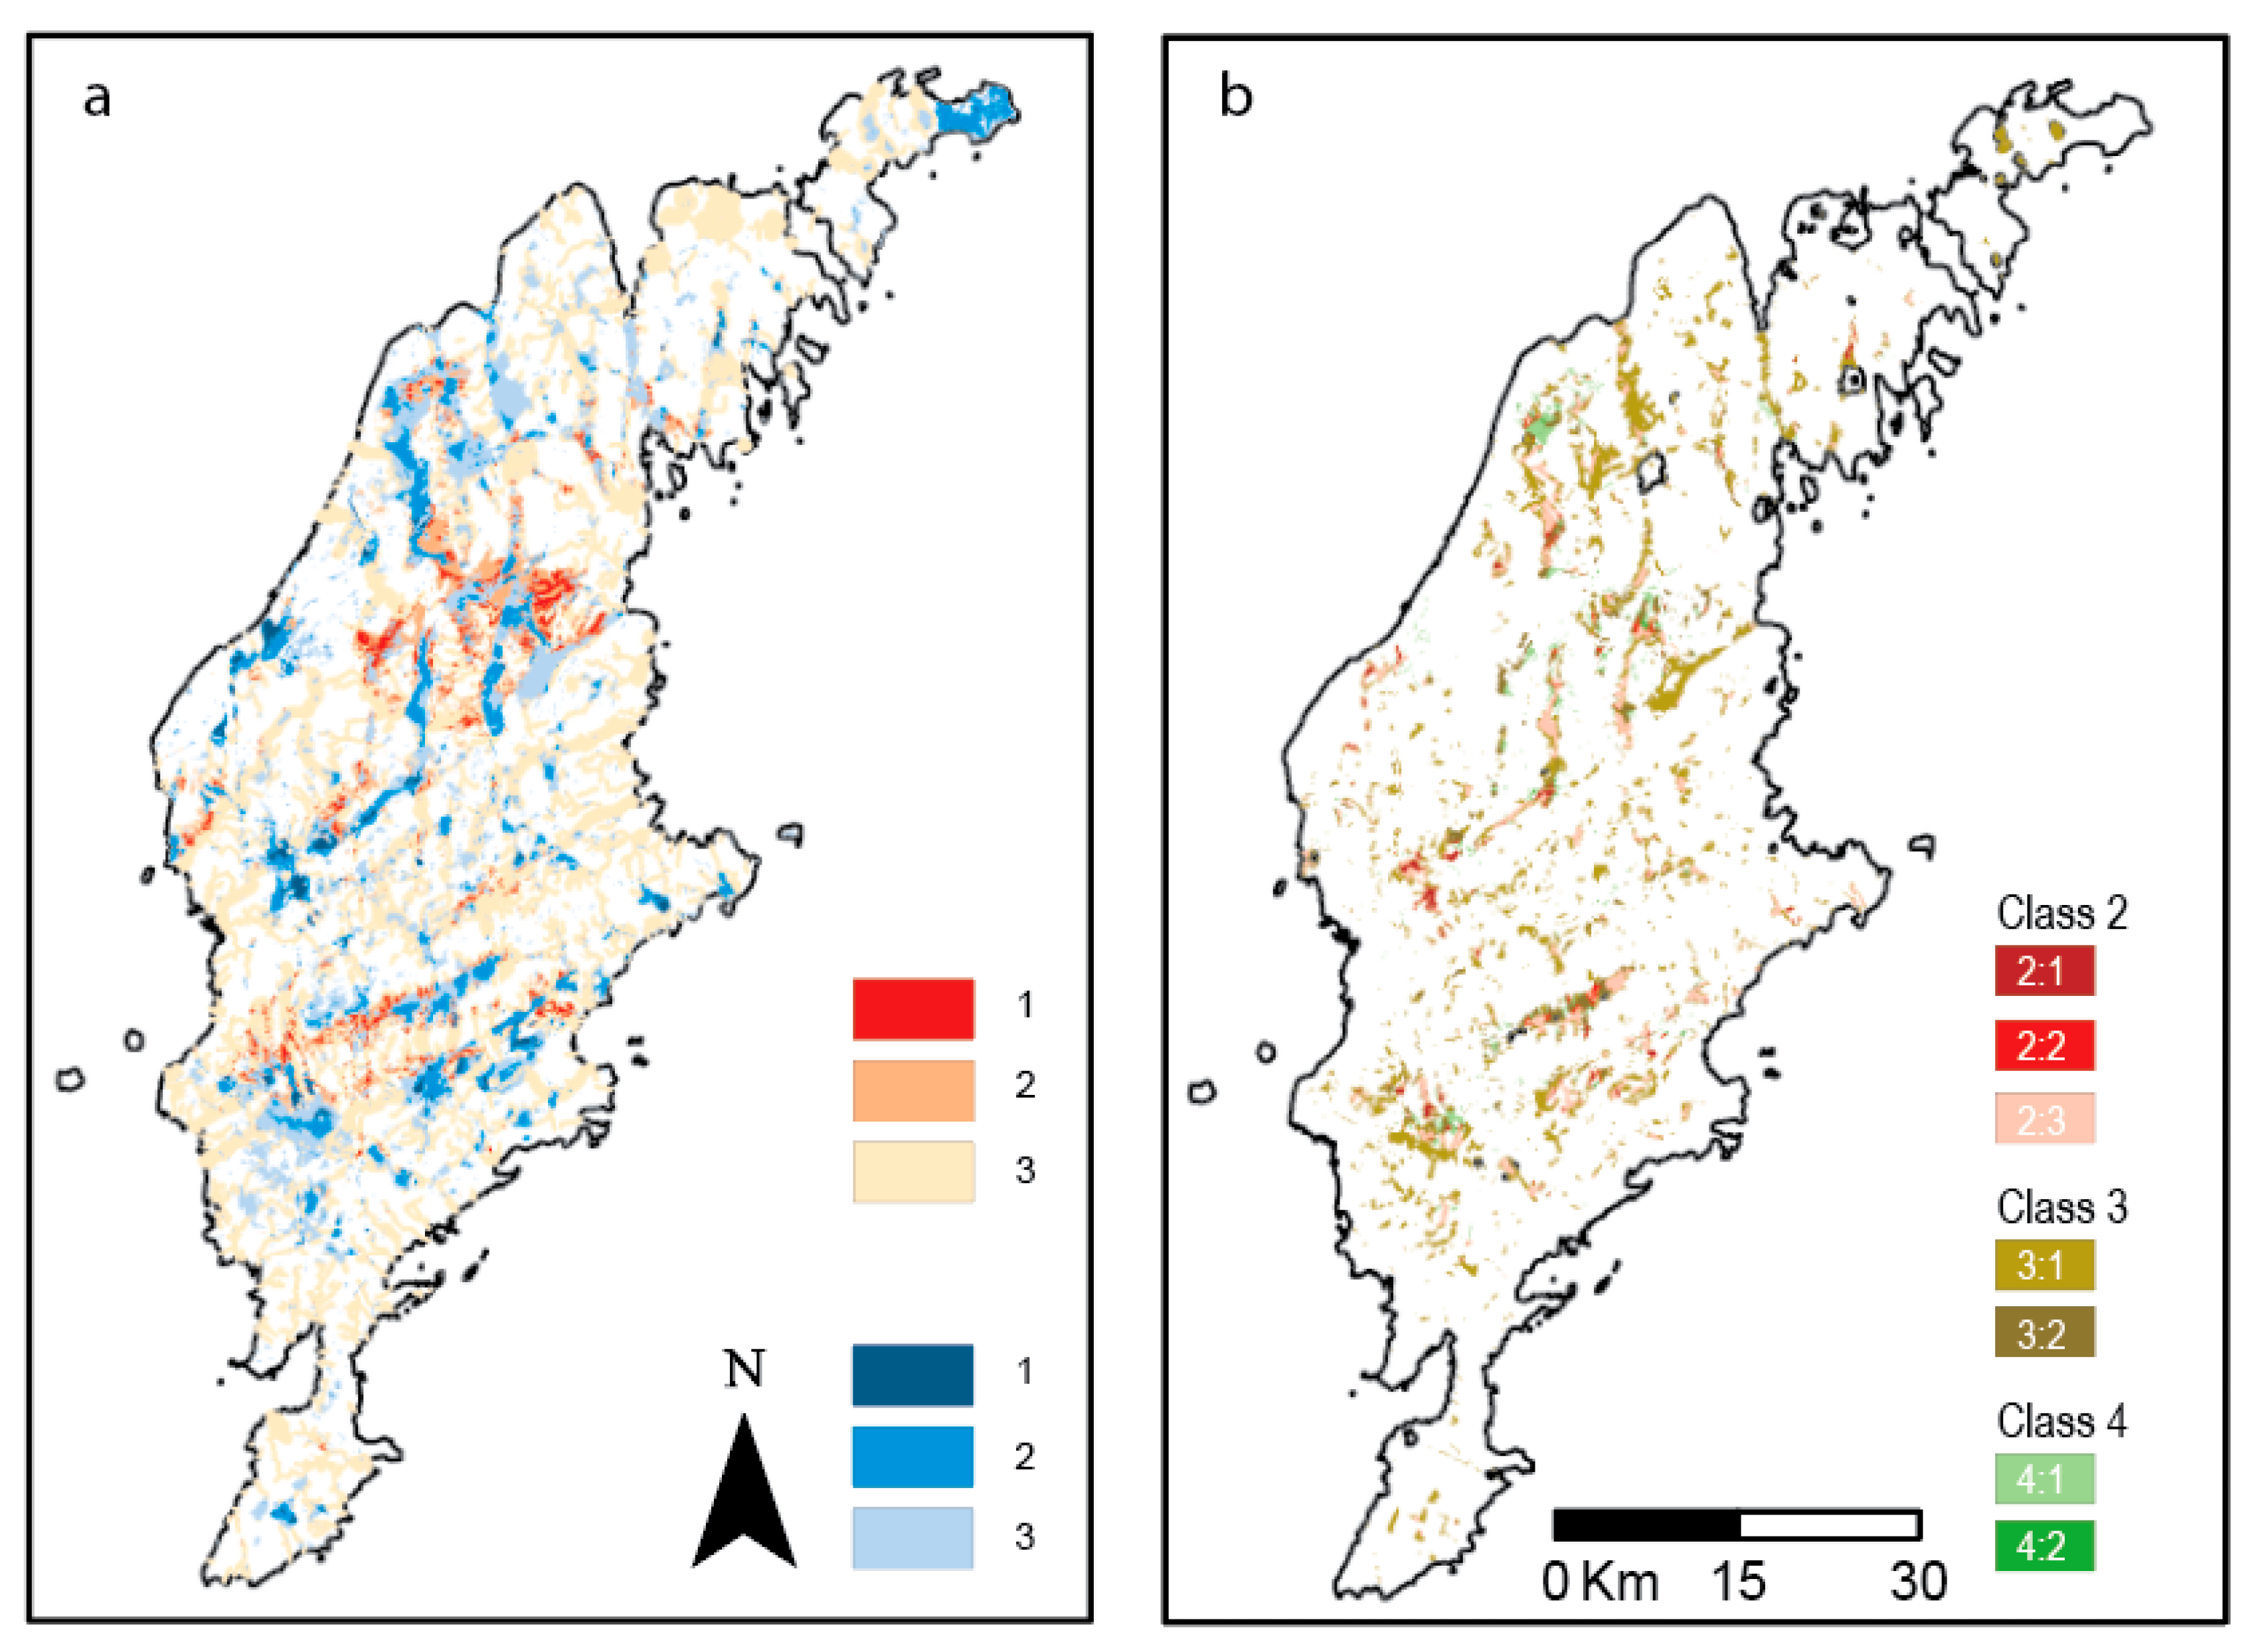
To narrow down the selection of promising areas for MAR a raster set with different combinations of IA + GS + CD + S + ST is shown in Table 1 and Figure 3b. These are the best-adapted areas for MAR construction (recharge through infiltration) based on this study. There are a few stream catchment areas that appear more promising to work in. Please note that because the raster set with surface water source/storage is made with a buffer there will be areas with overlapping datasets (Figure 3a).
Class 1 (Table 1) is not present on Gotland in this analysis. The reason is in the construction of the analysis these conditions cannot exist in the same raster (ha scale). Class 2 is present in ca 7719 ha (2.5% of Gotland). Areas in this class have good conditions for successful MAR. Class 3 is present in 22,710 ha (7.6% of Gotland). In these areas, there are probably moderate conditions for successful MAR. Class 4 is present in 2765 ha (0.9% of Gotland). In these areas, there is no surface water source within the chosen distance.
3.2. Estimation of Increased Groundwater Recharge and Groundwater Extraction at MAR Favorable Groundwater Catchments in Use Today
The presented values for potential infiltration rate and increased withdrawal volumes are estimations with considerable inherent uncertainty. Furthermore, there are large differences between the well fields. Site-specific conditions at existing abstraction areas differ due to, e.g., hydrogeology, number of wells, local water supply demand, quality, abstraction volume, etc. The abstraction volume in different well fields varies between 25 and 3300 m3/day. There are also differences in estimation of infiltration capacity between 50–660 m3/day (mostly based on local infiltration capacity) and the estimated increase in abstraction volume between 25–330 m3/day (also includes the possibility of adding new wells). The percentage of predicted increased abstraction volume versus mean abstraction volume varies between 20–300% for estimated infiltration volume, and 10–150% of increased abstraction volume, in comparison to numbers for each well field, respectively.
3.3. Comparative Study of Alternative Measures
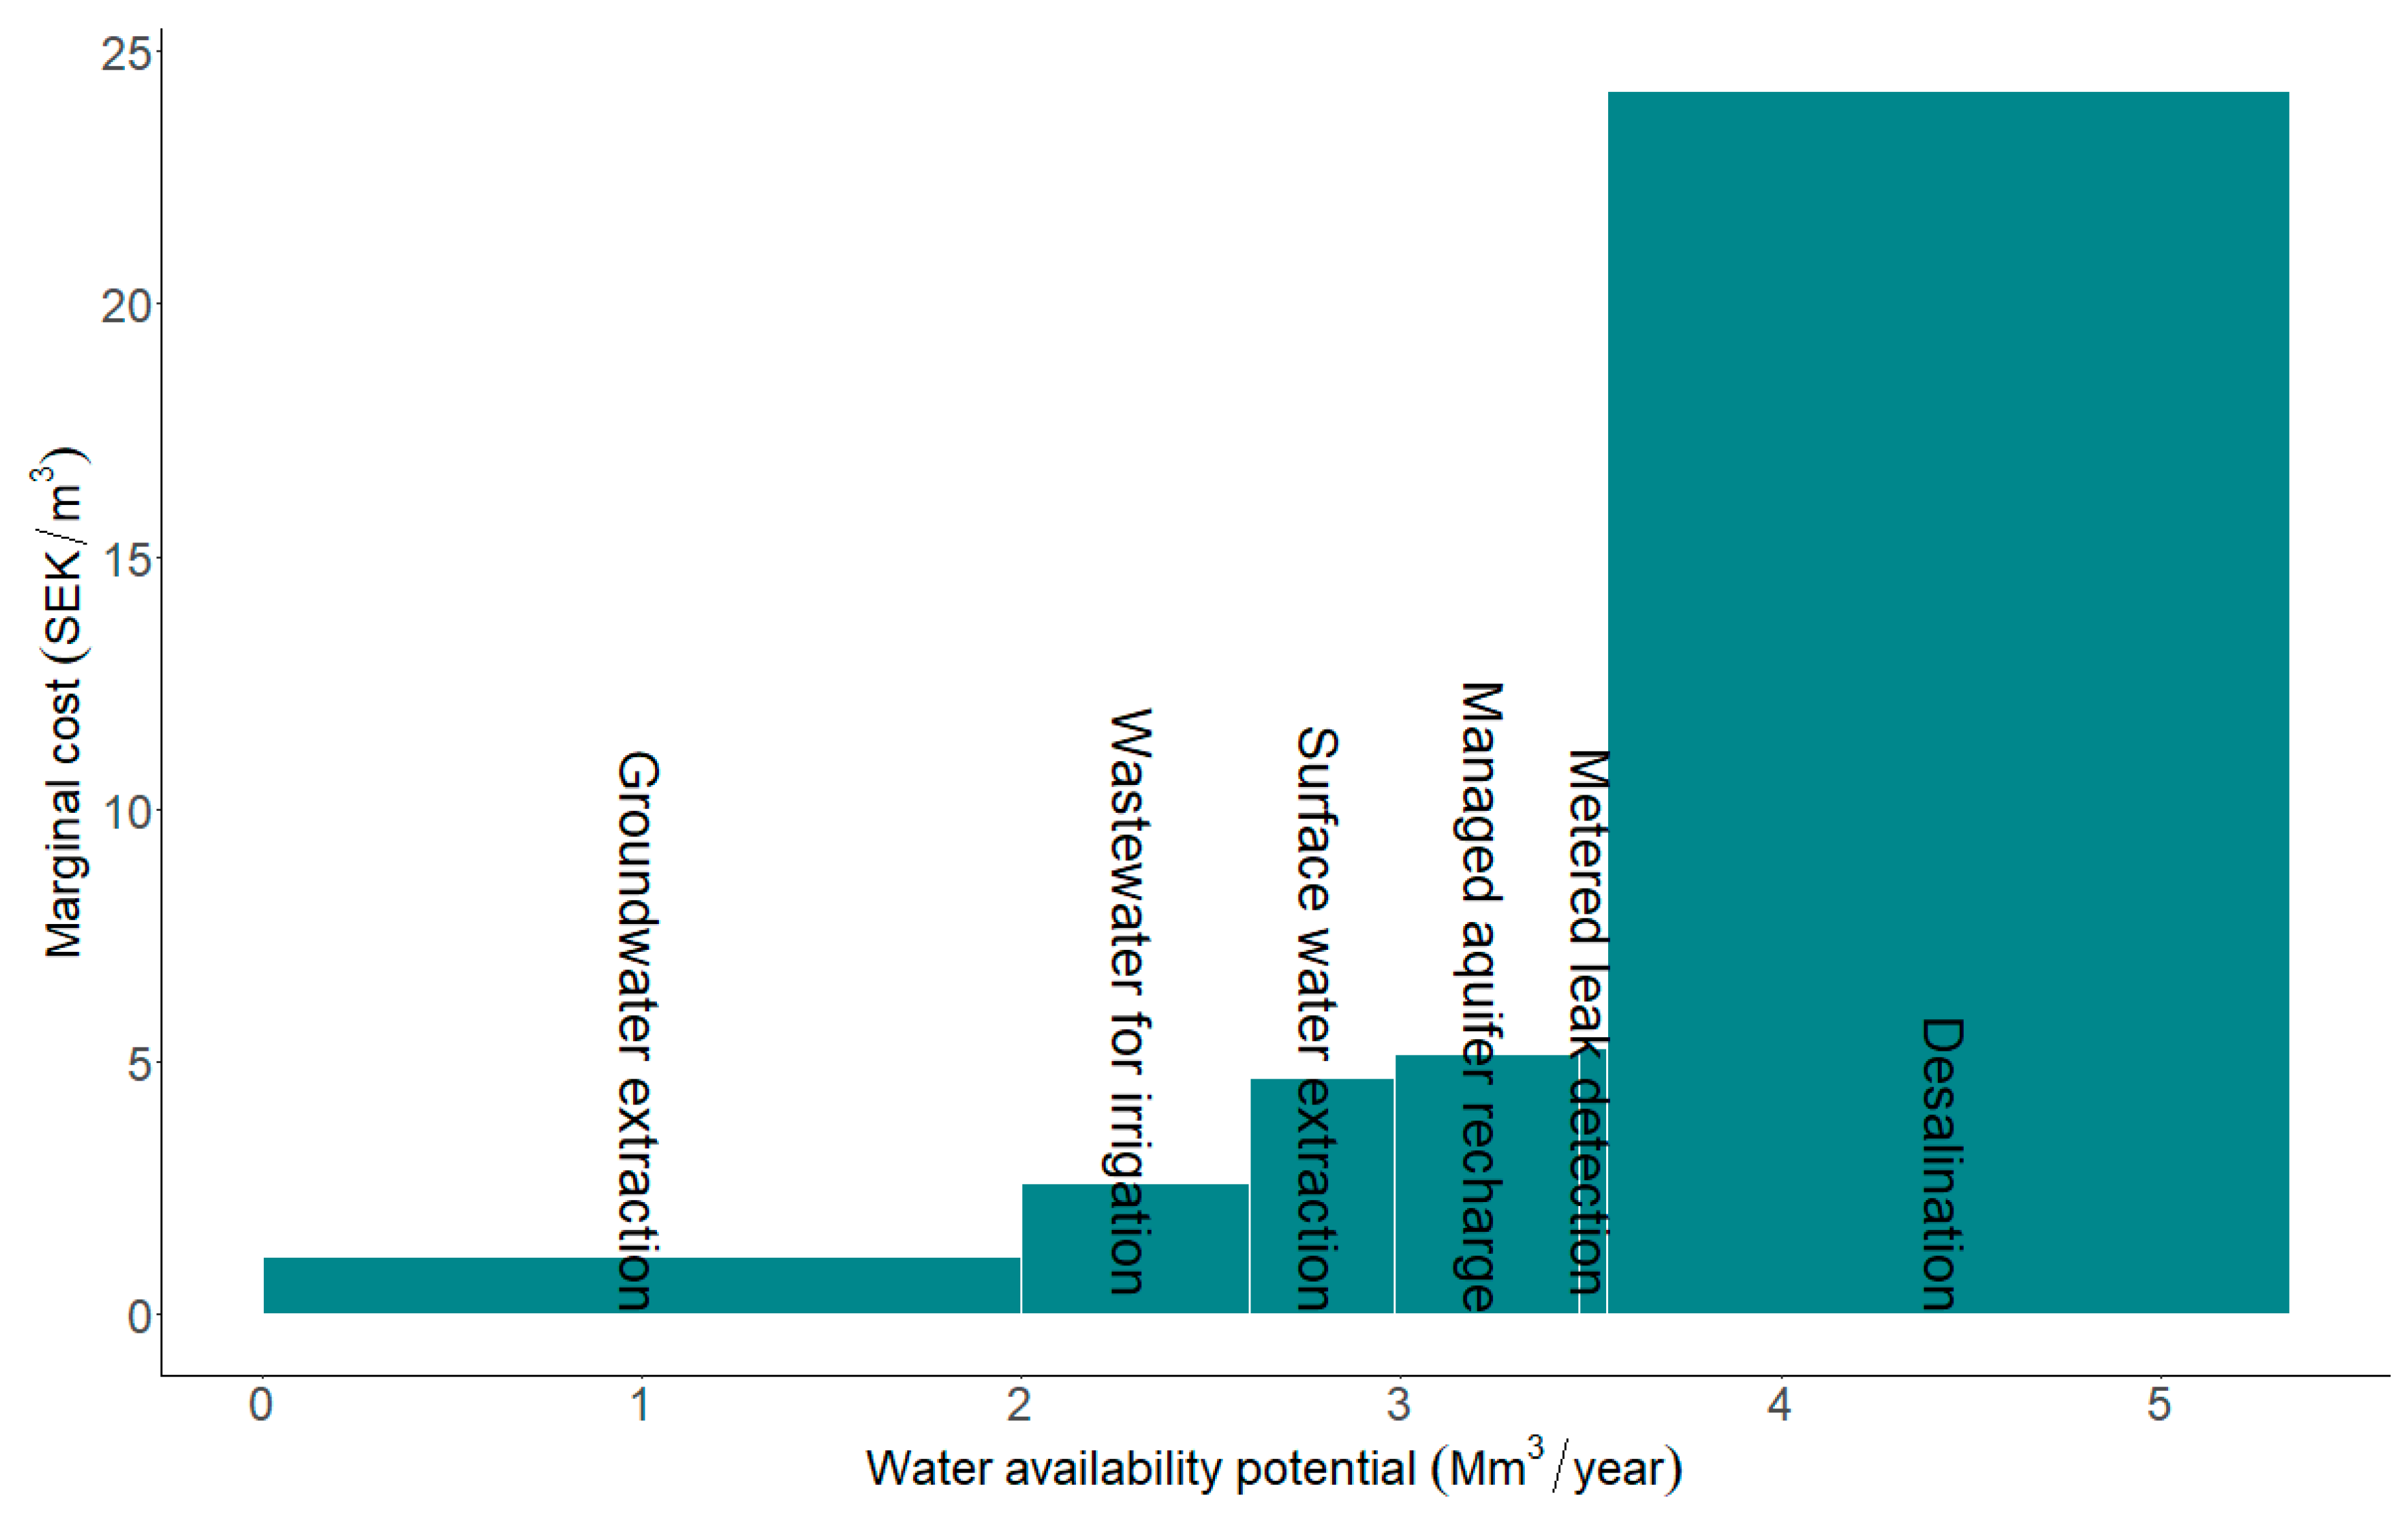
Figure 4 shows a marginal abatement cost curve for the analyzed measures, in which each measure is represented by a bar showing its unit cost (bar height) and annual water availability potential (bar width). As displayed, increased groundwater extraction and desalination had the largest potentials to improve water availability on Gotland. The water availability potential of desalination can be much larger, but the calculations here were based on assumptions of one new desalination plant. Increased groundwater extraction was associated with the lowest costs per cubic meter water provided, whereas desalination was associated with the highest unit costs. One reason for the high unit cost of desalination was the long pipelines needed to reach demand centers. In this comparative analysis, MAR was limited to groundwater recharge in the municipality’s existing well fields. Hence, the water availability potential of MAR on Gotland may be significantly higher when not constraining the analysis to those areas. The unit cost of MAR in existing well fields on Gotland was in the same range as that for increased surface water extraction.
4. Discussion
The presented data and analysis represent an early stage of mapping of MAR areas (focused on spreading methods in areas with high infiltration capacity) and estimates of potential and feasibility of this type of MAR on Gotland. Our project also includes mapping of good local conditions for a local source, e.g., water supply, which we believe further increases the utility of these study results for water management on the island. Mapping of suitable MAR areas with GIS is a widely used method [13]. There are uncertainties in both data and accuracy in the analysis, but within these limitations there is now a detailed picture on possible MAR and source areas which can be used by the municipality, farmers, and other stakeholders. Concerns regarding the limitations of these GIS analyses have been raised by, e.g., [14], who suggested that the use of sensitivity analyses of the factors used for MAR feasibility studies. In 2016, SGU made a first attempt to apply an overall assessment of the possibilities of MAR at existing abstraction areas [2]. Results from the present study can now improve the prior prioritization between MAR and alternative water measures for the island. The results should also be addressed on more than the water quantity. Increased groundwater recharge by MAR may influence the quality of the groundwater, e.g., by dilution effects, but also change the salinity levels in the bedrock aquifers. The municipality can analyze the results and compare with areas that are not used today but where the presented method shows good potential for MAR. There will be need for validation with numerical modelling and field tests to increase the strength and substance of the results, as shown in, e.g., [15,16,17,18,19].
This paper does not use any restrictions on unsuitable areas due to land use, a criterion that has been used in several analyses [13]. This can preferably be made by water management authorities, who are more suited to deciding between conflicting interests. Mainly because of the low relief of Gotland, the often-used parameter “slope” [13] is also not used here. A potentially much more important criterion is “closed depressions”. This criterion uses the bedrock surface and the slope to calculate where there are bedrock depressions where water has more time to infiltrate and be stored as groundwater.
Even though there is a clear picture of the best areas from the perspective of infiltration/groundwater storage and source/dam, other areas can also take advantage of the presented data. Local conditions—for example, where the distance to the public water network is long—can make MAR solutions profitable in those more remote areas. The outcome of favorable areas (from 2000 ha (20 km2) up to at most 43,000 ha (430 km2)) in the analysis of infiltration areas, source areas and the combination of these should be compared to the area of the island (3000 km2). The designated areas constitute only a small part of the island, and therefore care must be taken so that these are not destroyed by over-exploitation.
The degree of detail in the results is determined by the available data sets. SGU is working on an update on a few of the data sets, which will improve the certainty of the result. There are also several ongoing and future investigations associated with some of the data sets. For example, a few of the designated areas with a closed depression may be particularly suitable areas for groundwater dams. This is also the case with depressions that are not completely closed, not used in our investigation, and hence an interesting subject for future analysis for the viability of this MAR technique on Gotland. A groundwater dam is a man-made structure that obstructs the natural flow of groundwater and thereby can store larger quantities of water in the aquifer [31]. The results from this study are not validated by field studies. The data sets are; however, delivered to the local authorities for water resources and water management, and for analyses. Once the data sets are updated, the results may be integrated into the hydrogeological 3D model and calibration of parameters from field studies may improve future work with MAR on Gotland. The presented data sets may be tested in the newly developed online tools for suitability mapping, e.g., https://dss.inowas.com/tools [32,33]. The resulting suitability maps will be shared at the international MAR portal (https://apps.geodan.nl/igrac/ggis-viewer/viewer/globalmar/public/default).
The economic aspect of implementing MAR systems to improve potable and agricultural water supply has previously been investigated in different parts of the world (e.g., [21,22,34]). The associated capital costs are highly system specific, influenced by, e.g., hydrogeological, socioeconomic and legal factors [35]. As the economic analysis of MAR in this paper was based on rather small-scale complimentary infiltration of surface water at existing municipal well fields, no additional costs for new wells, treatment plants or pre-treatment were considered. The economic analysis was based on cost estimates associated with infiltration basins, raw water intake and new piping, resulting in a unit cost of approximately 5 SEK/m3. This can be compared to cost estimates for MAR in Spain ranging between €0.08–0.58 per m3 [20] (approximately 0.8–6 SEK/m3).
The total water demand on Gotland is forecasted to increase by more than 40% by the year 2045 [1]. This will require water currently not available on the island. To make well-founded decisions on how to meet this forecasted demand and concurrently increase the preparedness for water scarcity situations, thorough decision support is needed. The presented data and analyses can be used to inform decision-making on measures to increase the amount of water that can be recharged on the island. Considering the entire island as a single groundwater aquifer would permit a holistic approach to groundwater management, and the water situation more robust. This is particularly important for the forecasted increase in public water demand but also for individuals, industry and farmers relying on private wells. By comparing MAR to alternative measures, in terms of costs and water availability potential, this paper also provides support in assessments of the measures’ economic viability, usually an important decision criterion for municipalities, corporations and individuals alike.
5. Conclusions
This paper contributes results from analyses of possible MAR areas and their potential to increase water availability on the island of Gotland, Sweden. The method can be used to evaluate the MAR potential in similar areas with the same data sets. The results can be used on different scales, by authorities, the public water producer, farmers, industry and by people with private wells, for improved water resource security and further validated with field tests and more detailed models such as the afore mentioned hydrogeological model. Comprehensive field tests are probably the best for better understanding the problems in general. However, they are time consuming, and only a limited number of sites are available to accommodate the tests. In contrast, the GIS analysis allows us to explore and assess multiple sites with relative ease, yet the validity needs to be carefully checked. The main results are listed below.
- The best conditions for infiltration and groundwater storage occur in a total area of ca 2000 ha (0.7% of Gotland), second best in 14,400 ha (4.8% of Gotland), and third best in 43,000 ha (14% of Gotland).
- Areas with both proximity to a raw water source and conditions for storage in dams occur in a total area of ca 10,000 ha (3.3% of Gotland).
- An area of ca 7700 ha (2.5% of Gotland) has good local conditions for MAR and an area of ca 22,700 ha (7.5% of Gotland) has moderate local conditions for MAR.
- Decision support is provided by comparing MAR with other measures in a marginal abatement cost curve, contributing to informed prioritizations and decisions on water resource improvement on Gotland.
- MAR is not the alternative with the largest water availability potential, but it has significantly lower marginal costs compared, for example, with desalination, and the potential will increase if also considering new well fields and in preventing adverse consequences of increased abstraction.
- The water supply potential of MAR in existing well fields (public water supply) was estimated to be about 35% of the forecasted drinking water supply and 7% of the total water demand gap in year 2045. The total water supply potential of MAR on Gotland is much larger and is expected to exceed the demand.
Author Contributions
Conceptualization, P.D., K.S., A.L., E.H. and B.H.; Data curation, J.N.; Formal analysis, P.D., K.S., J.N. and E.H.; Funding acquisition, K.S.; Investigation, P.D., K.S., A.L. and B.H.; Methodology, P.D., K.S., A.L. and J.N.; Project administration, P.D.; Supervision, L.R.; Visualization, P.D. and K.S.; Writing—original draft, P.D. and K.S.; Writing—review & editing, P.D. and K.S.
Funding
The work was funded by the European Union’s Horizon 2020 research and innovation program under the Marie Skłodowska-Curie grant agreement No 754412; Region Västra Götaland; Region Gotland; The Swedish Agency for Economic and Regional Growth; and the Swedish Research Council Formas contract no 942-2015-130.
Acknowledgments
The authors would like to thank Mikael Tiouls and Lars Westerlund at Region Gotland for contribution with local expertise in the comparative study.
Conflicts of Interest
The authors declare no conflict of interest.
References
- Länsstyrelsen. Regional Water Supply Plan of Gotland; County Administrative Board of Gotland: Gotland, Sweden, 2018. (In Swedish) [Google Scholar]
- Dahlqvist, P.; Thorsbrink, M.; Holgersson, B.; Nisell, J.; Maxe, L.; Gustafsson, M. Wet Lands and Groundwater Recharge—Possibilities for Increased Capacity at Groundwater Catchments in Gotland; SGU-Rapport 2017:01; Sveriges Geologiska Undersökning: Uppsala, Sweden, 2017; 73p. (In Swedish) [Google Scholar]
- Erlström, M.; Persson, L.; Sivhed, U.; Wickström, L. Description of the Bedrock on Gotland; Sveriges Geologiska Undersökning K221; Sveriges Geologiska Undersökning: Uppsala, Sweden, 2009; 60p. (In Swedish) [Google Scholar]
- Hansson, G. Artificial groundwater recharge—A method used in Swedish drinking water supply for 100 years. VA Forsk 2000, 5, 96–106, (In Swedish with English Summary). [Google Scholar]
- Dillon, P. Future management of aquifer recharge. Hydrogeol. J. 2005, 13, 313–316. [Google Scholar] [CrossRef]
- Stefan, C.; Ansems, N. Web-based global inventory of managed aquifer recharge applications. Sustain. Water Resour. Manag. 2017, 4, 153–162. [Google Scholar] [CrossRef] [Green Version]
- Sprenger, C.; Hartog, N.; Hernández, M.; Vilanova, E.; Grützmacher, G.; Scheibler, F.; Hannappel, S. Inventory of managed aquifer recharge sites in Europe: Historical development, current situation and perspectives. Hydrogeol. J. 2017, 6, 1909–1922. [Google Scholar] [CrossRef]
- National Water Quality Management Strategy. Australian Guidelines for Water Recycling; Water Quality Australia: Canberra, Australia, 2009; Volume 24, 251p.
- IGRAC (International Groundwater Resource Assessment Centre). Global Inventory of Managed Aquifer Recharge (MAR) Schemes. 2015. Available online: https://ggis.un-igrac.org/ggis-viewer/viewer/globalmar/public/default (accessed on 22 June 2018).
- Rahman, M.A.; Rusteberg, B.; Gogu, R.C.; Lobo Ferreira, J.P.; Sauter, M. A new spatial multi-criteria decision support tool for site selection for implementation of managed aquifer recharge. J. Environ. Manag. 2012, 99, 61–75. [Google Scholar] [CrossRef]
- Russo, T.A.; Fisher, A.T.; Lockwood, B.S. Assessment of managed aquifer recharge site suitability using a GIS and modeling. Groundwater 2015, 53, 389–400. [Google Scholar] [CrossRef]
- Malczewski, J. GIS and Multicriteria Decision Analysis; John Wiley & Sons: Hoboken, NJ, USA, 1999. [Google Scholar]
- Sallwey, J.; Bonilla Valverde, J.P.; Vásquez López, F.; Junghanns, R.; Stefan, C. Suitability maps for managed aquifer recharge: A review of multi-criteria decision analysis studies. Environ. Rev. 2018, 27, 138–150. [Google Scholar] [CrossRef]
- Maples, S.R.; Foglia, L.; Fogg, G.E.; Maxwell, R.M. Sensitivity of hydrologic and geologic parameters on recharge processes in a highly-heterogeneous, semi-confined aquifer system. Hydrol. Earth Syst. Sci. Discuss. 2019. [Google Scholar] [CrossRef]
- Asano, T.; Cotruvo, J.A. Groundwater recharge with reclaimed municipal wastewater: Health and regulatory considerations. Water Res. 2004, 38, 1941–1951. [Google Scholar] [CrossRef] [PubMed]
- Bekele, E.; Pattersson, B.; Toze, S.; Furness, A.; Higginson, S.; Shackelton, M. Aquifer residence times for recycled water estimated using chemical tracers and the propagation of temperature signals at a managed aquifer recharge site in Australia. Hydrogeol. J. 2014, 22, 1383–1401. [Google Scholar] [CrossRef]
- Greskowiak, J.; Prommer, H.; Massmann, G.; Johnston, C.D.; Nützmann, G.; Pekdeger, A. The impact of variably saturated conditions on hydrogeochemical changes during artificial recharge of groundwater. Appl. Geochem. 2005, 20, 1409–1426. [Google Scholar] [CrossRef]
- Moeck, C.; Radny, D.; Auckenthaler, A.; Berg, M.; Hollender, J.; Schirmer, M. Estimating the spatial distribution of artificial groundwater recharge using multiple tracers. Isot. Environ. Health Stud. 2017, 53, 484–499. [Google Scholar] [CrossRef] [PubMed]
- Franssen, H.J.H.; Kaiser, H.P.; Kuhlmann, U.; Bauser, G.; Stauffer, F.; Muller, R.; Kinzelbach, W. Operational real-time modelling with ensemble Kalman filter of variably saturated subsurface flow including stream-aquifer interaction and parameter updating. Water Resour. Res. 2011, 47. [Google Scholar] [CrossRef]
- Fernández Escalante, E.; Calero Gil, R.; San Miguel Fraile, M.Á.; Sánchez Serrano, F. Economic assessment of opportunities for managed aquifer recharge techniques in Spain using an advanced geographic information system (GIS). Water 2014, 6, 2021–2040. [Google Scholar] [CrossRef]
- Megdal, S.B.; Dillon, P. Policy and economics of managed aquifer recharge and water banking. Water 2015, 7, 592–598. [Google Scholar] [CrossRef]
- Ross, A.; Hasnain, S. Factors affecting the cost of managed aquifer recharge (MAR) schemes. Sustain. Water Resour. Manag. 2018, 4, 179–190. [Google Scholar] [CrossRef]
- Dahlqvist, P.; Triumf, C.-A.; Persson, L.; Bastani, M.; Erlström, M.; Jørgensen, F.; Thulin Olander, H.; Gustafsson, M.; Thorsbrink, M.; Schoning, K.; et al. SkyTEM-Survey on Gotland; Rapporter och Meddelanden 136; Sveriges Geologiska Undersökning: Uppsala, Sweden, 2015; 108p. (In Swedish) [Google Scholar]
- Dahlqvist, P.; Triumf, C.-A.; Persson, L.; Bastani, M.; Erlström, M.; Schoning, K. SkyTEM-Survey on Gotland, Part 2; Rapporter och Meddelanden 140; Sveriges Geologiska Undersökning: Uppsala, Sweden, 2017; 135p. (In Swedish) [Google Scholar]
- Geological Survey of Sweden. Report of Government Mandate: Groundwater Recharge and Resources in Sweden; SGU-Rapport 2017:09; Geological Survey of Sweden: Uppsala, Sweden, 2017; 45p. (In Swedish) [Google Scholar]
- Rodhe, A.; Lindström, G.; Rosberg, J.; Pers, C. Groundwater Recharge in Swedish Soils—A General Calculation with a Water Balance Model; Institutionen för Geovetenskaper, Luft-och Vattenlära, Uppsala Universitet, Rapport, Serie A; Uppsala Universitet: Uppsala, Sweden, 2006; Volume 66, 35p. (In Swedish) [Google Scholar]
- Addams, L.; Boccaletti, G.; Kerlin, M.; Stuchtey, M. Charting Our Water Future—Economic Frameworks to Inform Decision-Making; 2030 Water Resources Group: Washington, DC, USA, 2009. [Google Scholar]
- Eory, V.; Pellerin, S.; Carmona Garcia, G.; Lehtonen, H.; Licite, I.; Mattila, H.; Lund-Sørensen, T.; Muldowney, J.; Popluga, D.; Strandmark, L.; et al. Marginal abatement cost curves for agricultural climate policy: State-of-the art, lessons learnt and future potential. J. Clean. Prod. 2018, 182, 705–716. [Google Scholar] [CrossRef]
- Hastings, N.A.J. Physical Asset Management: With an Introduction to ISO55000; Springer International Publishing: Cham, Switzerland, 2015. [Google Scholar]
- Brealey, R.A.; Myers, S.C.; Allen, F. Principles of Corporate Finance, 10th ed.; McGraw-Hill/Irwin: New York, NY, USA, 2010. [Google Scholar]
- Onder, H.; Yilmaz, M. Underground dams. A tool of sustainable development and management of groundwater resources. Eur. Water 2005, 11, 35–45. [Google Scholar]
- Sallwey, J.; Schlick, R.; Bonilla Valverde, J.P.; Junghanns, R.; Vásquez López, F.; Stefan, C. Suitability maps for managed aquifer recharge: Review and tool development. Abstract 33. In Proceedings of the 10th International Symposium on Managed Aquifer Recharge, Madrid, Spain, 20–24 May 2019. [Google Scholar]
- Gorski, G.; van der Valk, M. Producing more interpretable maps of managed aquifer recharge suitability by visualizing sensitivity to subjective choices during mapmaking. Abstract 133. In Proceedings of the 10th International Symposium on Managed Aquifer Recharge, Madrid, Spain, 20–24 May 2019. [Google Scholar]
- Gao, L.; Connor, J.; Dillon, P. The economics of groundwater replenishment for reliable urban water supply. Water 2014, 6, 1662–1670. [Google Scholar] [CrossRef]
- Maliva, R. Economics of managed aquifer recharge. Water 2014, 6, 1257–1279. [Google Scholar] [CrossRef]
Figure 1.
GIS maps and results from GIS analysis to identify areas with potential for MAR. (a) Map of Sweden and location of Island of Gotland. (b) Groundwater storage capacity (mm/year) [25]; (c) Ratio of groundwater recharge/storage capacity; only values below 1.0 are shown (GS); (d) Closed depressions (>1 ha) in the bedrock with no contact with the Baltic Sea (CD); (e) Areas from the lithological 3D model, blue: areas >4 m sand and/or gravel (IA) suitable for infiltration, red areas >4 m till and/or clay (ST) suitable for construction of surface storage dams; (f) Surface waters, i.e., raw water source (S).

Figure 2.
Maps of the combined GIS analysis. (a) Areas suitable as infiltration areas and for groundwater storage; (b) Areas close to a natural source (intermittent stream, perennial river, lake) and for construction of surface storage areas (dams). Data has been reclassified into classes; lower numbers more suitable.

Figure 3.
Maps from combined GIS analysis. (a) Combination of overlapping datasets from Figure 2a,b. Please note that since the raster set with surface water source/storage is made with a buffer there will be areas with overlapping datasets. (b) Map with the best areas for infiltration/groundwater storage and source/surface water storage. Classes are defined in the text and summarized in Table 1.

Figure 4.
Marginal abatement cost curve for alternative measures to improve water resource security on the island of Gotland (100 SEK ≈ 11 USD).
Figure 4.
Marginal abatement cost curve for alternative measures to improve water resource security on the island of Gotland (100 SEK ≈ 11 USD).


Table 1.
Synthesis from final step in GIS analyses. GS = Ratio >1.0 groundwater recharge/storage capacity; CD = Closed depression; IA = sand/gravel >4m; S = Raw water Source; ST = Storage. Location of mapped classes see Figure 3b.
Table 1.
Synthesis from final step in GIS analyses. GS = Ratio >1.0 groundwater recharge/storage capacity; CD = Closed depression; IA = sand/gravel >4m; S = Raw water Source; ST = Storage. Location of mapped classes see Figure 3b.
| Class | Groundwater | Surface Water | Area (ha) | |
|---|---|---|---|---|
| 1 | IA + GS + CD | S + ST | Not present due to construction of analysis | 0 |
| 2:1 | IA + GS + CD | S | Good local conditions for MAR | 980 |
| 1 | IA + GS + CD | ST | Not present, due to construction of analysis | 0 |
| 2:2 | Two of IA, GS, CD | S + ST | Good local conditions for MAR | 512 |
| 2:3 | Two of IA, GS, CD | S | Good local conditions for MAR | 7207 |
| 4:1 | Two of IA, GS, CD | ST | No source within chosen distance | 209 |
| 3:1 | One of IA, GS, CD | S + ST | Probable local conditions for MAR | 3579 |
| 3:2 | One of IA, GS, CD | S | Probable local conditions for MAR | 19,131 |
| 4:2 | One of IA, GS, CD | ST | No source within chosen distance | 2556 |
© 2019 by the authors. Licensee MDPI, Basel, Switzerland. This article is an open access article distributed under the terms and conditions of the Creative Commons Attribution (CC BY) license (http://creativecommons.org/licenses/by/4.0/).
Share and Cite
MDPI and ACS Style
Dahlqvist, P.; Sjöstrand, K.; Lindhe, A.; Rosén, L.; Nisell, J.; Hellstrand, E.; Holgersson, B. Potential Benefits of Managed Aquifer Recharge MAR on the Island of Gotland, Sweden. Water 2019, 11, 2164. https://doi.org/10.3390/w11102164
AMA Style
Dahlqvist P, Sjöstrand K, Lindhe A, Rosén L, Nisell J, Hellstrand E, Holgersson B. Potential Benefits of Managed Aquifer Recharge MAR on the Island of Gotland, Sweden. Water. 2019; 11(10):2164. https://doi.org/10.3390/w11102164
Chicago/Turabian StyleDahlqvist, Peter, Karin Sjöstrand, Andreas Lindhe, Lars Rosén, Jakob Nisell, Eva Hellstrand, and Björn Holgersson. 2019. "Potential Benefits of Managed Aquifer Recharge MAR on the Island of Gotland, Sweden" Water 11, no. 10: 2164. https://doi.org/10.3390/w11102164
Note that from the first issue of 2016, this journal uses article numbers instead of page numbers. See further details here.