The Mechanism of Chlorine Damage Using Enhanced Green Fluorescent Protein-Expressing Escherichia coli


1
Department of Human Centered Engineering, Ochanomizu University, Tokyo 112-8610, Japan
2
Faculty of Core Research, Natural Science Division, Ochanomizu University, Tokyo 112-8610, Japan
*
Author to whom correspondence should be addressed.
Water 2019, 11(10), 2156; https://doi.org/10.3390/w11102156
Submission received: 12 September 2019
/
Revised: 12 October 2019
/
Accepted: 14 October 2019
/
Published: 16 October 2019
(This article belongs to the Section Wastewater Treatment and Reuse)
Abstract
:This study investigated how chlorine inactivates and damages Escherichia coli cells. E. coli that had transformed to express enhanced green fluorescent protein (EGFP) at the cytoplasm was treated with chlorine. Damage to the cell membrane and cell wall was analyzed by measuring the fluorescence intensity of the leaked EGFP, then accounting for the fluorescence deterioration. At pH 7, E. coli was lethally damaged after treatment with chlorine, but significant leakage of EGFP was not observed. In contrast, significant leakage of EGFP was observed at pH 9, even though E. coli was not as inactivated as it was at pH 7. Flow cytometry was used to confirm the fluorescence intensity of the remaining EGFP inside the cells. No significant fluorescence loss was observed in the cells at pH 7. However, at pH 9, the fluorescence intensity in the cells decreased, indicating leakage of EGFP. These results suggest that hypochlorous acid inactivates E. coli without damaging its cell membrane and cell wall, whereas the hypochlorite ion inactivates E. coli by damaging its cell membrane and cell wall. It was possible to confirm the chlorine damage mechanism on E. coli by measuring the fluorescence intensity of the leaked EGFP.
1. Introduction
During water treatment, disinfectants are used to inactivate or sufficiently suppress the proliferation of pathogenic microorganisms. For example, chlorination, one of the most widely used disinfection methods, employs the powerful oxidizing capacity of chlorine to kill pathogenic microorganisms. This technique is relatively inexpensive; moreover, a small amount of chlorine can disinfect a large amount of water. Furthermore, the disinfection effect of chlorination persists even in the water distribution system. In solution, chlorine exists in several main forms, the relative contents of which depend on solution pH. Specifically, the redox potential of sodium hypochlorite, a substance widely used for chlorination, is a straight line with an inflection point at a specific pH corresponding to the pKa of hypochlorous acid (7.537). In this case, hypochlorous acid is the main species at pH ≤ 7.5, and the hypochlorite ion is the main species at pH ≥ 7.5 [1].
Escherichia coli has been used as a model bacterium to prove the disinfection effects of chlorine. However, it is not clear whether chlorine affects other pathogenic microorganisms in the same manner as E. coli. To clarify this, it is necessary to first understand where in the cell chlorine acts and how much damage it inflicts on E. coli. The mechanism of chlorine damage to pathogenic microorganisms may be determined by clarifying the mechanism of chlorine damage on E. coli. Various studies have been conducted with this aim. By measuring oxygen uptake, Albrich and Hurst [2] showed that chlorine decreases E. coli cell viability before the onset of appreciable respiratory loss. Dukan and Touati [3] investigated mechanisms of killing E. coli via un-ionized hypochlorous acid (HOCl), by identifying which genes are involved in disinfection resistance. The effects of chlorination have also been evaluated by measuring enzyme activity. For example, Tryland et al. [4] investigated the effect of chlorine on the β-D-galactosidase activity of E. coli using the β-D-galactosidase assay.
While elucidating the mechanisms of damage by disinfection on microorganisms, it is important to evaluate the damage to specific sites of the microorganisms. In some cases, pathogenicity of microorganisms is associated with specific sites on the microorganisms. Characterization of the damage on specific sites leads not only to understanding of damage mechanisms, but also greater certainty in the efficacy of disinfection, and two methods have been used to characterize the damage to specific sites. The first method evaluates leakage of cell components. For example, chlorine changes the E. coli cell membrane in a manner that leads to the leakage of proteins and RNA from cells [5]. Diao et al. [6] showed that when the cellular material released after disinfection accumulates on the filter, it is hardly noticeable in the chlorinated sample. The second method evaluates the permeability of certain substances after disinfection treatment. Using 2-nitrophenyl-β-D-galactopyranoside (ONPG), Sips and Hamers [7] evaluated the cell wall permeability of E. coli after treatments with myeloperoxidase, hydrogen peroxide, and chloride ions. Their results show that the bacteria are killed through an increase in the permeability of the bacterial cell wall. Certain procedures, such as LIVE/DEAD and SYBR Green I (SGI)/propidium iodide (PI) staining evaluate membrane damage by staining the nucleic acids [8,9,10]. Ramseier et al. [10] investigated membrane damage in bacteria in drinking water using SGI/PI and flow cytometry, and reported that chlorine is responsible for such membrane damage. Some mechanisms of damage are characterized by measuring the concentration of bacteria grown simultaneously on non-selective and selective agars, then considering the function of inhibiting substances in the selective agars [11,12,13,14]. Using this agar method combined with propidium monoazide (PMA) treatment that detects DNA only from live cells, Kazama and Otaki [14] showed that chlorination causes outer membrane damage. Another approach is to combine the assessments of leakage of internal components and permeability to external substances. For example, Tsuchido and Katsui [15] investigated how heat damages E. coli by measuring the leakage of lipopolysaccharide (LPS) and alkaline phosphatase (ALP) from the bacteria and its permeability to crystal violet. They showed that heat treatment induces the release of cell constituents and the penetration of crystal violet through part of the outer membrane. Virto et al. [16] investigated how chlorine induces E. coli damage by measuring the leakage of intracellular substances and staining with PI. It is noteworthy that PI is relatively small (MW: 668.4 Da) compared to RNA, proteins, and nucleic acids. However, the results of leakage and permeability had the same profile. Cho et al. [17] evaluated the damage of several disinfectants on E. coli by measuring the protein leakage and penetration of ONPG. They reported that free chlorine induces much less protein leakage than ozone, and that it results in very little surface damage to E. coli. Aside from proteins and nucleic acids, the leakage of ATP has also been studied, and a relationship between membrane damage (using SGI/PI) and leakage of ATP has been shown [18,19].
In evaluating the leakage of cell components, it is necessary to clearly prove that leakage comes from a specific substance inside cells and to show which part of the cell the substance is leaking from. Furthermore, it is necessary to examine the influence of external factors after leakage. In evaluating the permeability of cells to certain substances after disinfection treatment, the methods used have typically evaluated membrane damage; however, it has been difficult to confirm which part of the membrane is damaged.
In this research, we constructed E. coli expressing enhanced green fluorescent protein (EGFP). Microorganisms do not have the capability of expressing EGFP unless they are transformed. Therefore, EGFP is an excellent indicator of leakage from an internally produced substance. In addition, it is possible to express EGFP site-specifically in E. coli via recombination. Thus, it is an excellent means of localization [20,21]. Although green fluorescent protein (GFP) is stable [22], fading may occur, owing to various factors such as buffer, pH, and disinfectant [23,24,25,26]. In this study, we used EGFP to clarify the mechanism of damage by chlorine on E. coli. First, we confirmed the influence of the experimental conditions on the leaked fluorescence intensity of EGFP. Next, we determined the degree of damage by chlorine to the cell membrane and cell wall of E. coli by expressing EGFP in the cytoplasm, treating the bacterium with chlorine, and measuring the fluorescence intensity of EGFP released from the cell. We validated the results of this experiment by confirming the fluorescence intensity inside the cell using a flow cytometer. The speciation of chlorine forms (hypochlorous acid and hypochlorite ion) was controlled by varying the solution pH, and the effect of this speciation on E. coli cells was evaluated.
2. Materials and Methods
2.1. Competent Cells
In this study, E. coli DH5α (Takara Bio Inc., Japan), a strain with high transformation efficiency, was used. A single colony was incubated in Luria-Bertani (LB) medium (LB Broth, Difco Co., USA) at 37 °C overnight with shaking. An aliquot (1 mL) of the culture suspension was added to the LB medium (40 mL) and incubated at 37 °C for 2.5 h with shaking. After 5 min of cooling on ice, the culture was centrifuged at 1472 g for 5 min. The supernatant was discarded and 20 mL of ice-cold transformation buffer (TFB) (10 mmol L−1 MES-KOH (pH 6.2), 100 mmol L−1 KCl, 45 mmol L−1 MnCl2, 50 mmol L−1 CaCl2, 15% glycerol) was added. After 30 min of cooling on ice, the suspension was centrifuged at 1472 g for 5 min. The supernatant was discarded and 4 mL ice-cold TFB was added. An aliquot (100 μL) was transferred into a sterilized tube and, after freezing at −20 °C for 2 h, the cells were stored at −80 °C.
2.2. Transformation
E. coli DH5α was transformed with pEGFP (Takara Bio Inc., Japan) to express EGFP (MW: ca. 30,000) at the cytoplasm. A stock solution of pEGFP (10 μL) was added to competent cells (100 μL) of E. coli. After 6 min of cooling on ice, the mixture was placed in a 42 °C water bath for 3 min, then LB medium (1 mL) was added. An aliquot was applied onto LB agar medium (LB Broth and Bacto Agar, Difco., USA) containing ampicillin (Wako Co., Japan) (final concentration: 10 ng μL−1) and incubated at 37 °C for 20 h. As a control, pure water was added instead of pEGFP and treated as described above. E. coli of the control sample failed to grow on LB agar medium containing ampicillin. On the other hand, bacteria transformed with pEGFP (further referred to as transformed E. coli) formed multiple colonies, which was indicative of the selective culturing of ampicillin-resistant E. coli. An aliquot of the control sample was applied onto LB agar medium without ampicillin and incubated to afford untransformed E. coli.
2.3. E. coli Suspension
A colony of transformed E. coli was inoculated into LB medium (15 mL) containing ampicillin and incubated at 37 °C for 16–17 h with shaking. After centrifugation at 11,302 g for 5 min, the supernatant was discarded and the same amount of sterilized phosphate buffered saline (PBS) (pH 7.4, Nissui Pharmaceutical Co., Ltd.; Japan) was added and mixed. The untransformed E. coli suspension was made as described above using untransformed E. coli and LB medium without ampicillin.
2.4. Sensitivity of EGFP to Chlorine and pH
As the damage suffered by E. coli because of chlorination was assessed by monitoring the fluorescence intensity of EGFP leaked outside the cells, it was necessary to determine the effect of experimental conditions on the fluorescence intensity of leaked EGFP after chlorination. For this purpose, we prepared EGFP lysate and chlorinated it to probe the accompanying changes in fluorescence intensity.
2.4.1. Fluorescent Protein Lysate
The transformed E. coli suspension was centrifuged at 11,302 g for 5 min. The supernatant was discarded, replaced with sterilized PBS, and mixed. After freezing the E. coli suspension at −80 °C for 2 h, it was thawed at room temperature. The supernatant was collected by centrifugation at 11,302 g for 5 min and filtered through a 0.20-μm sterilized membrane filter (DISMIC-25AS, Toyo Roshi Kaisha, Ltd.; Japan) to obtain a fluorescent protein lysate. The pH 9 lysate was prepared as described above using PBS adjusted to pH 9 with sodium hydroxide (Wako Co., Japan), and pH 7 lysate was prepared in a similar way.
2.4.2. Initial Samples
To closely simulate experimental chlorination conditions, the initial sample was prepared by mixing fluorescent protein lysate with untransformed E. coli suspension so as not to affect fluorescence intensity. The untransformed E. coli suspension was diluted with sterilized PBS until the absorbance at 600 nm was approximately 0.3. A fluorescent protein lysate (see Section 2.4.1) and the suspension were mixed for 5 min. The pH 9 initial sample was prepared as described above using pH 9 PBS, and the pH 7 initial sample was prepared in a similar way.
2.4.3. Chlorine Disinfection
Initial samples (see Section 2.4.2) were collected for treatment with sodium hypochlorite. The sodium hypochlorite solution (5.0%, Wako Co., Japan) was diluted in pure water to make a stock solution (approximately 0.03%). A volume of the stock solution was added to the samples while mixing to achieve a final free chlorine concentration of between 0.15 and 0.63 mg L−1. The concentration of free chlorine was analyzed by the dialkyl-p-phenylenediamine (DPD) colorimetric method [27] after the chlorine stock solution was added. It was measured immediately after addition and immediately after the treatment, and the average value was the final free chlorine concentration. In the control, pure water was added instead of the chlorine stock solution. After a predetermined contact time (0–20 min), 5-mL sample aliquots were dechlorinated through the addition of a solution of sodium thiosulfate (Na2S2O3·5H2O; Kishida Chemical Co., Ltd.; Japan) in pure water (50 μL, 3 wt %).
2.4.4. Fluorescence Intensity of EGFP
Aliquots (500 μL) were collected before and after chlorine treatment and placed in 0.22-μm filtration tubes (Ultrafree-MC centrifugal filter unit, Merck Millipore Ltd., USA). The samples were centrifuged at 1472 g for 5 min and the filtered samples were collected. After mixing, the samples were divided into four aliquots (100 μL) and transferred into a 96-well plate (Thermo Scientific Nunc Microwell polymer bottom 96-well optical bottom plate, Thermo Fisher Scientific Co., USA) and the fluorescence intensity (482/516 nm) was measured using a BioTek Cytation 3 Cell Imaging Multi-Mode Reader (Bio Tek Inc., USA). Fluorescence intensity retention efficiency was calculated using Equation (1):
where I0 is the value obtained by subtracting the empty cell value (288) from the fluorescence intensity before chlorination, and I is the value obtained by subtracting the empty cell value from the fluorescence intensity after chlorination.
Fluorescence intensity retention efficiency (%) = 100 × I/I0
2.5. E. coli Damage Due to Chlorine Disinfection
2.5.1. Initial Samples of E. coli Suspension
The transformed E. coli suspension was diluted with sterilized PBS until the absorbance at 600 nm was approximately 0.3. The pH 9 initial sample was made using pH 9 PBS, and the pH 7 sample was prepared similarly.
2.5.2. EGFP Expression Level
Initially, we determined how much EGFP was expressed in transformed E. coli. A 600-μL aliquot of the initial sample (see Section 2.5.1) was collected and lysed using lysozyme (5.0 mg mL−1; Wako Co., Japan) in TBS (100 mmol L−1 Tris, 1.5 mol L−1 NaCl, HCl, Reverse Osmosis (RO) water). pH 9 TBS was prepared using sodium hydroxide. The E. coli suspension was centrifuged at 3537–9201 g for 5 min and the supernatant was discarded. Then, a 300-μL volume of lysozyme solution was added and the mixture was mixed. An equal volume of TBS was then added and the mixture was placed at −80 °C for 10 min. After thawing at room temperature, the lysate was transferred into a 0.22-μm filtration tube and centrifuged at 1472 g for 5 min. The filtered sample was mixed and divided into four parts and the fluorescence intensity (482/516 nm) from each 100 μL aliquot was measured.
2.5.3. Chlorine Disinfection
The initial sample (Section 2.5.1) was placed in a bottle and treated as described above up to the chlorine disinfection step (Section 2.4.3).
2.5.4. Survival Ratio of E. coli
For E. coli cell counting, samples collected before and after chlorination were diluted with sterilized PBS and plated on the nonselective LB agar medium to quantify viable E. coli cells. The plates were incubated at 37 °C for 20–24 h, and the number of colonies that grew on LB agar after chlorination (N) divided by the number of colonies that grew on LB agar before chlorination (N0) (i.e., N/N0) was defined as the survival ratio. Log inactivation was defined using Equation (2):
Log inactivation = −log (N/N0)
2.5.5. Leakage of EGFP
Aliquots (500 μL) were collected before and after chlorine treatment, and the fluorescence intensity of EGFP leaked out of the cell was measured as described above (Section 2.4.4). To compare the amount of leaked EGFP to the level expressed in cells, the EGFP leakage rate was calculated using Equation (3):
where I is the value obtained by subtracting the empty cell value from the fluorescence intensity after chlorination, I0 is the value obtained by subtracting the empty cell value from the fluorescence intensity before chlorination, and IL is the value obtained by subtracting the empty cell value from the fluorescence intensity after lysozyme treatment (Section 2.5.1).
Leakage rate of EGFP (%) = 100 × (I − I0)/IL
Based on previous experimental results (Section 2.4), the fluorescence intensity retention efficiency could be determined from the CT (concentration of free chlorine × contact time; mg min L−1) value. Therefore, maximum leakage was calculated by correcting the measured value using Equation (4):
Maximum leakage = 100 × (measured value − 288)/(fluorescence intensity retention efficiency)
2.5.6. Remaining EGFP in Cells
Samples (1 mL) that were collected before and after treatment were analyzed by flow cytometry to measure the fluorescence intensity inside E. coli cells. Flow cytometer measurements were conducted in a CytoFLEX (Beckman Coulter, Inc. USA) equipped with a 50-mW laser emitting at a wavelength of 488 nm. Fluorescence intensity was collected at the Fluorescein isothiocyanate (FITC) channel (525/40-nm). Measurements were performed at a flow rate of 10 μL min−1. All data were processed with the software CytExpert (Beckman Coulter, Inc. USA).
3. Results
3.1. Sensitivity of EGFP to Chlorine and pH
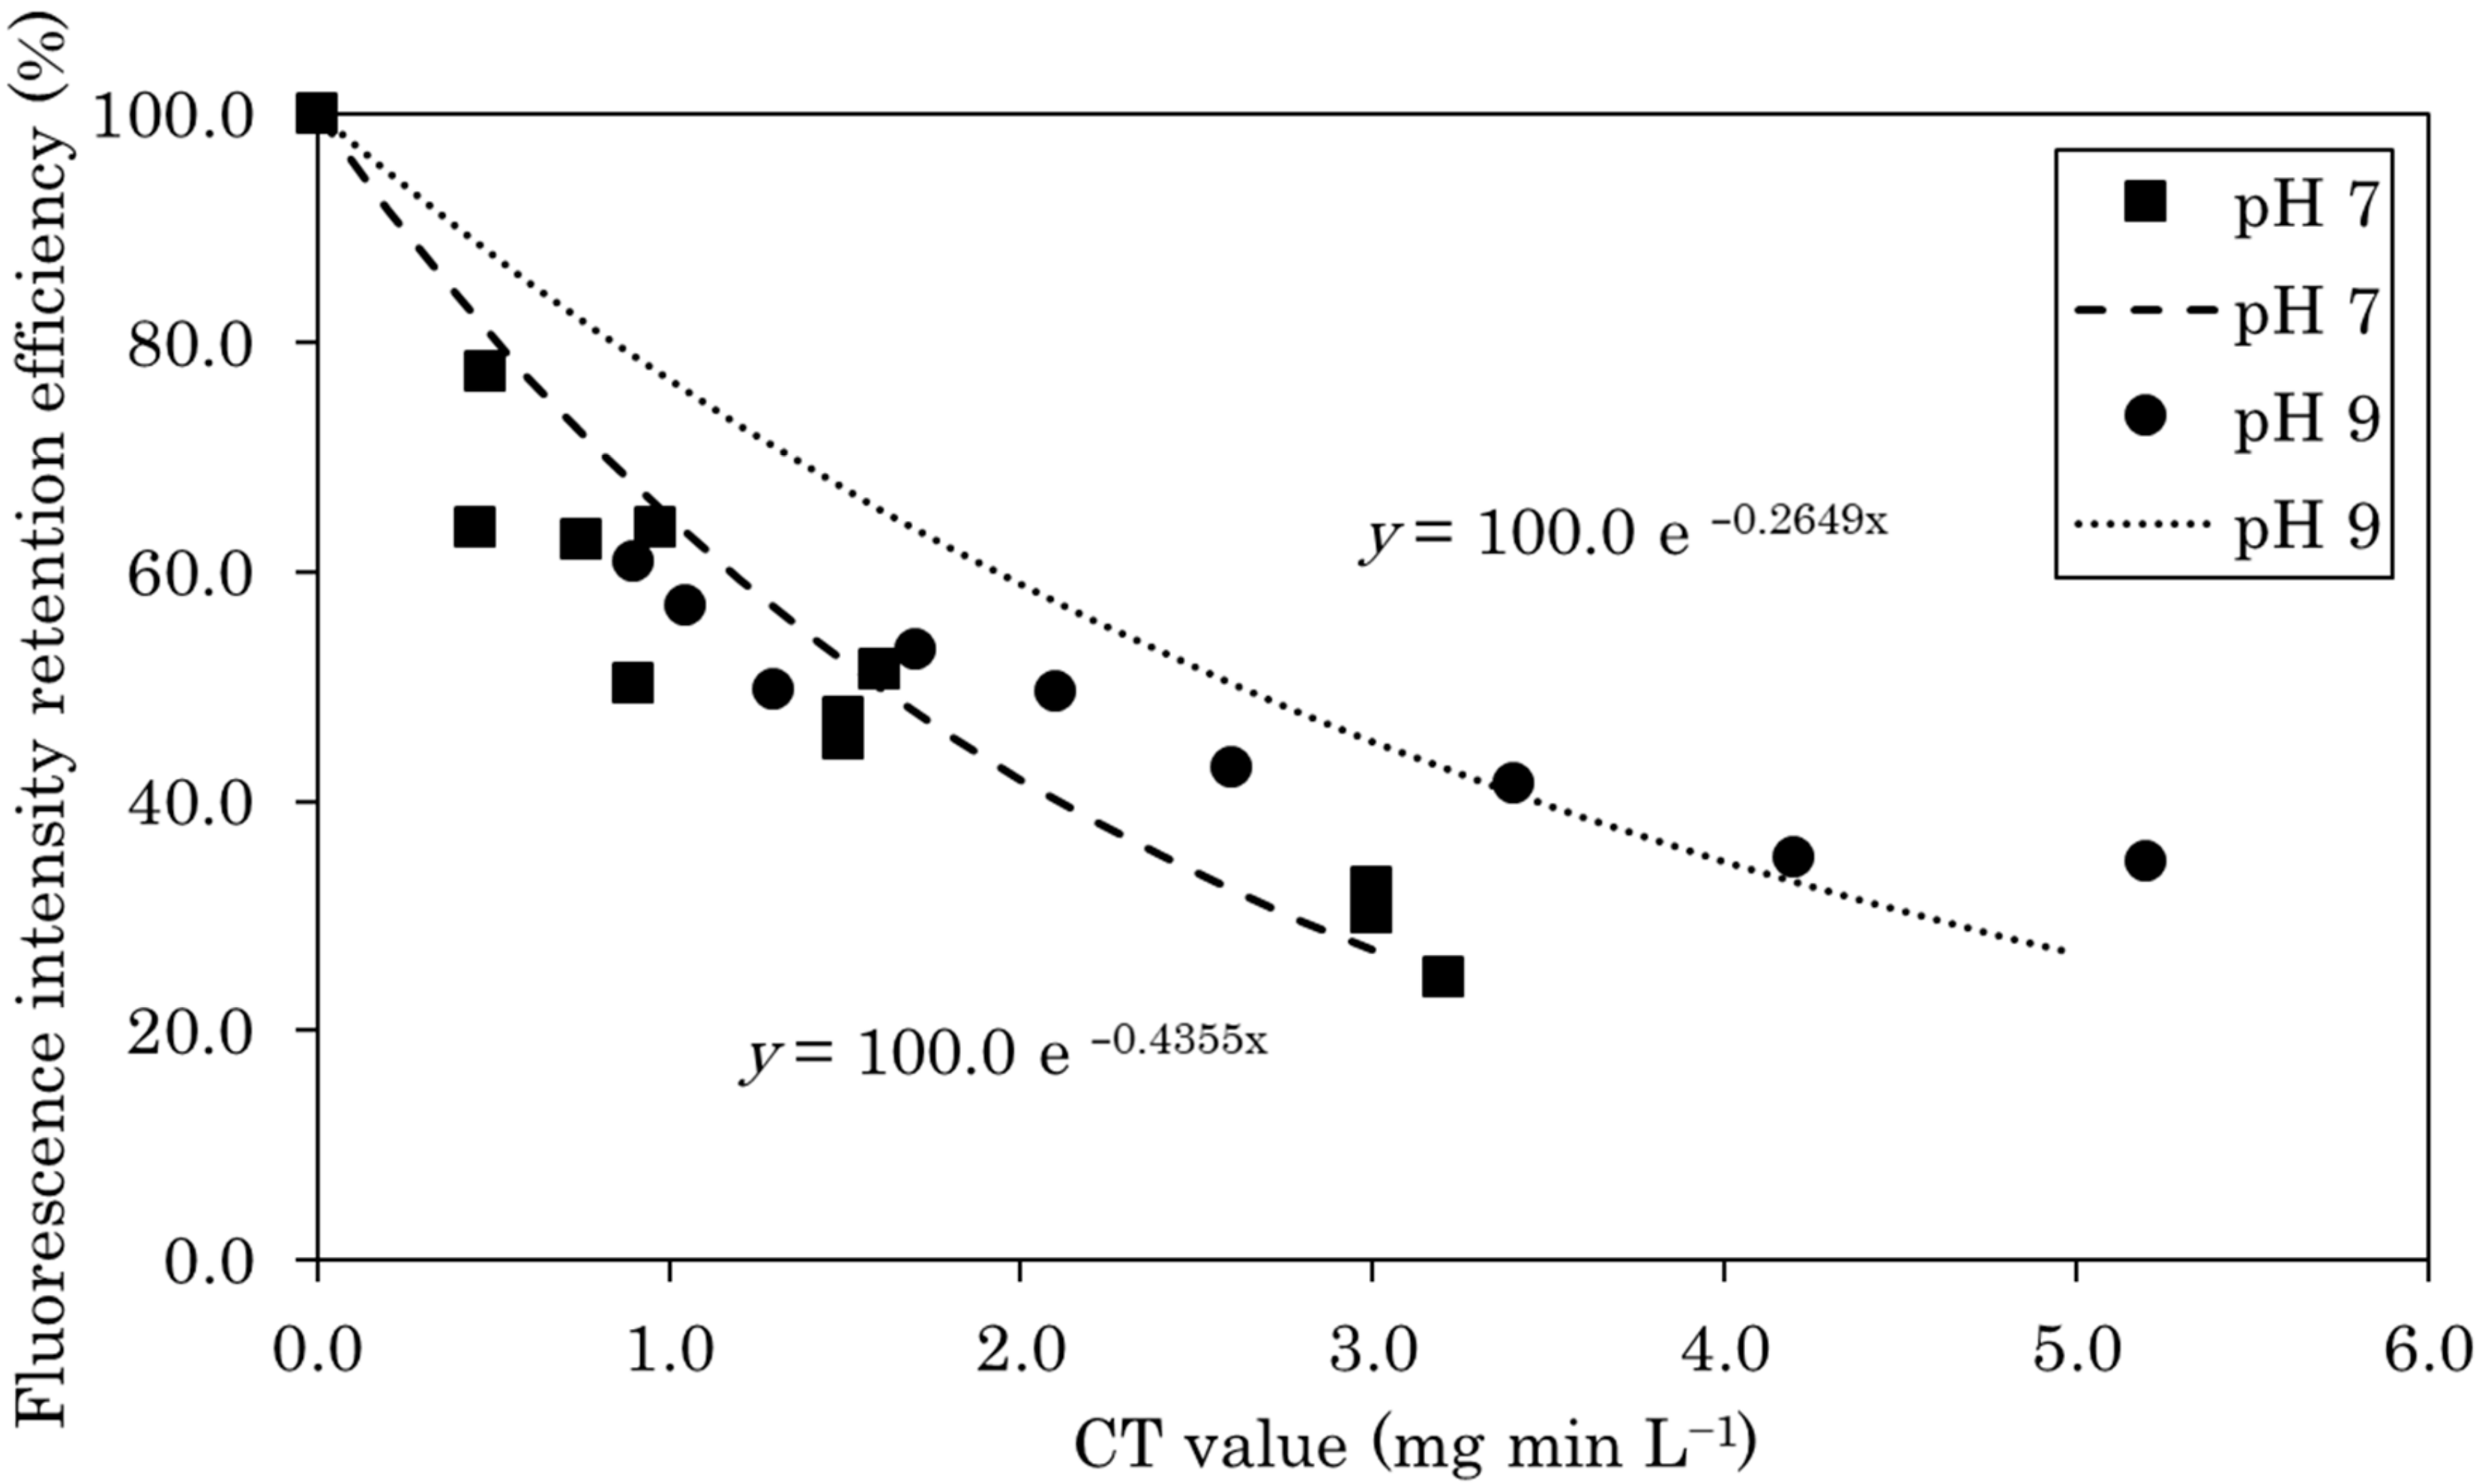
The fluorescence intensities of EGFP were measured during chlorination at pH 7 and 9. Figure 1 shows the CT values and the corresponding fluorescence intensities of EGFP. The fluorescence intensity of EGFP, both at pH 7 and 9, decreased significantly after chlorination (Figure 1). The data were processed and fitted by a straight line assuming an intercept of zero as follows:
where I0 is the value obtained by subtracting the empty cell value from the fluorescence intensity before chlorination, I is the value obtained by subtracting the empty cell value from the fluorescence intensity after chlorination, and k is the first-order decay constant.
Log (I/I0) = −k × CT value
The fluorescence intensity reduction curve, calculated from the first-order decay constant obtained by Equation (5) and shown in Figure 1, allowed the fluorescence intensity retention efficiency to be calculated based on the CT value during leaked EGFP quantitation in disinfection experiments. The calculated fluorescence intensity retention efficiency based on the CT value was applied to Equation (4), and calculated the maximum leakage in disinfection experiments.
3.2. Log Inactivation
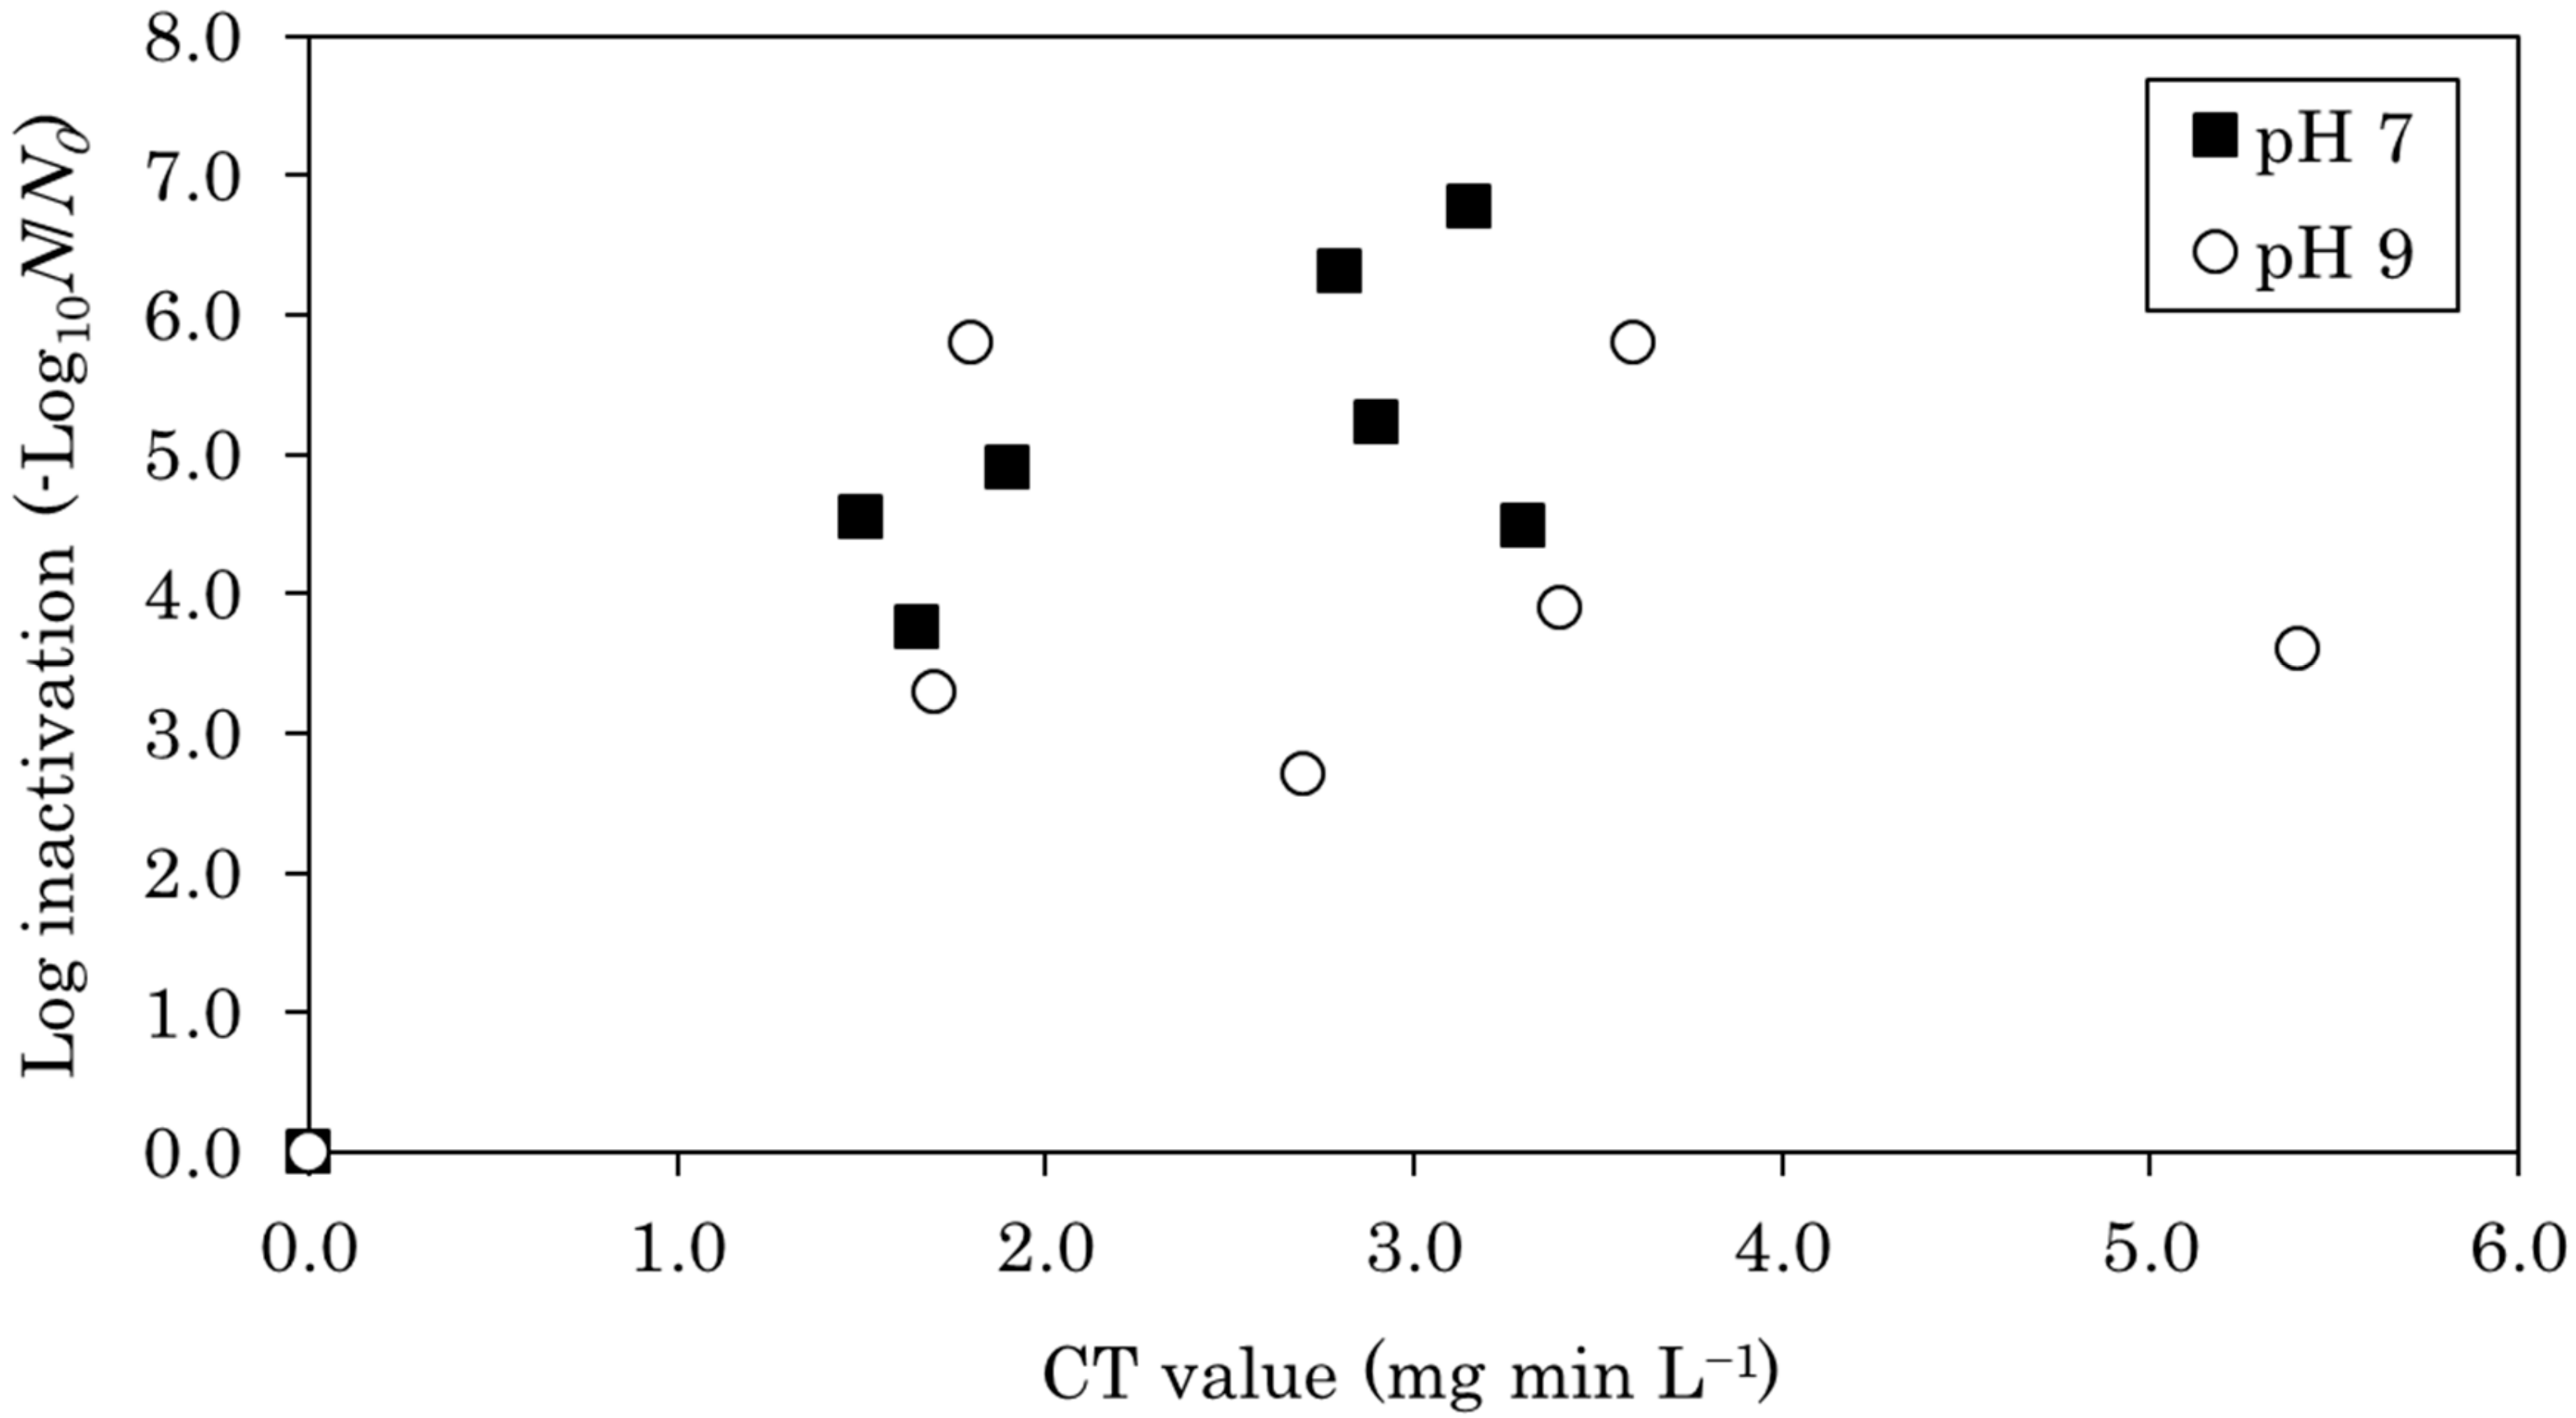
Figure 2 describes E. coli inactivation during chlorination, revealing that inactivation was more significant at pH 7 than at pH 9. At pH 7, it was inactivated by approximately 6 log when the CT value was 3, whereas at pH 9 it was inactivated by approximately 3 to 5 log. It has been shown that the hypochlorite ion has a lower disinfection effect than hypochlorous acid [28], which agrees with the results of this study.
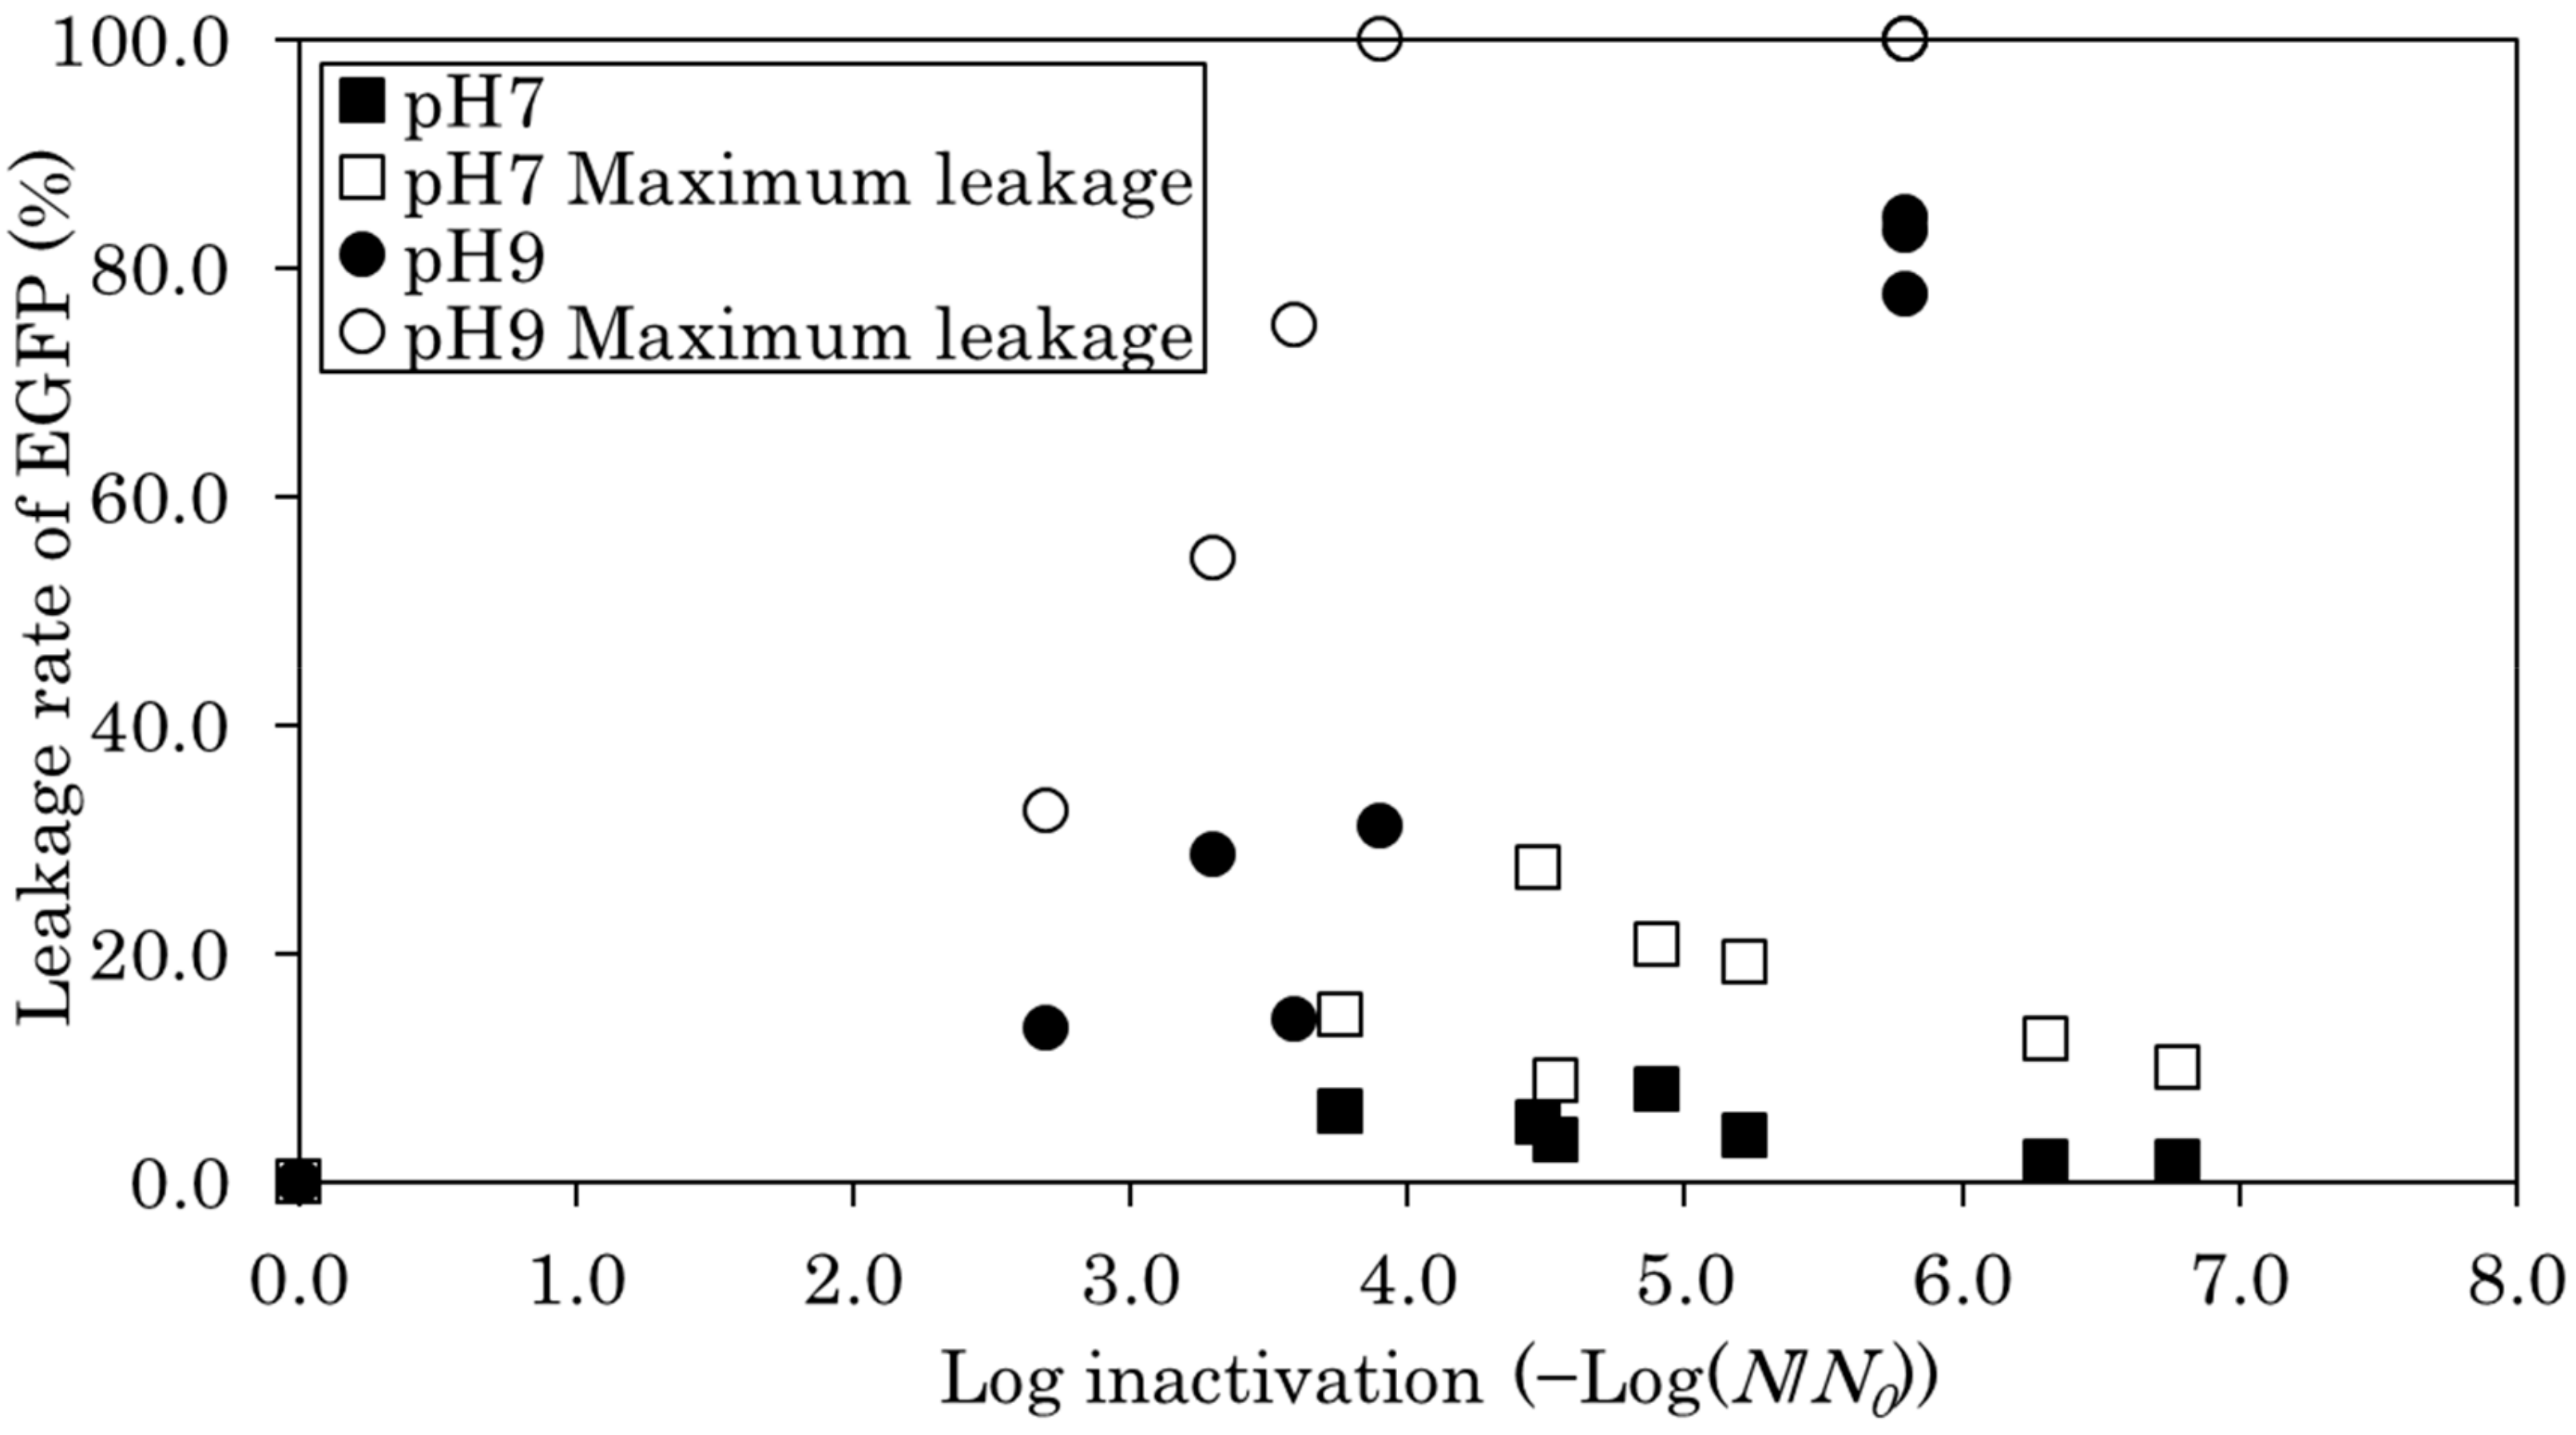
3.3. Log Inactivation and Leakage Rate of EGFP
After lysozyme-induced cell lysis, the resulting fluorescence intensity of EGFP that leaked from the E. coli cytoplasm was assumed to be the total amount of EGFP inside the cell. The fluorescence intensity of leaked EGFP from E. coli cells after chlorination was compared with that of the total amount of EGFP. The leakage rate of EGFP is expressed in Figure 3. Figure 3 shows the change in the leakage rate of EGFP as the log inactivation increased. At pH 7, there was almost no leakage of EGFP from the cytoplasm regardless of the E. coli log inactivation (Figure 3). The measured leakage rate of EGFP remained at approximately 5%; however, considering the decrease of fluorescence intensity, the actual leakage rate may have been approximately 25%. This result suggests that chlorine did not significantly destroy the outside of E. coli, although it penetrated into the cell. At pH 9, the higher the E. coli log inactivation, the more EGFP leaked (Figure 3). The leakage rate of EGFP in 4 log inactivation was approximately 20%, based on the measured fluorescence value; however, considering the decrease of fluorescence intensity, the actual leakage rate may have been approximately 100%. The leakage rate of EGFP at 6 log inactivation was approximately 80% based on measured fluorescence value, and approximately 100% after correcting for the decrease of fluorescence intensity. These results suggest that chlorine damages the outside of E. coli. However, the leakage rate of EGFP before treatment was also higher at pH 9 than at pH 7. It is possible that the external surface of E. coli was destabilized when the pH was changed from pH 7 to 9. At pH 9, the hypochlorite ion reacted mainly with the outer surface of E. coli. The survival ratio was higher at pH 9 than that at pH 7, as described above. Therefore, we propose that, internally, E. coli was not as seriously damaged at pH 9 as it was at pH 7. It has been shown that the hypochlorite ion permeates the phospholipid bilayer of the cell membrane of gram-negative bacteria such as E. coli with difficulty [28]. This also makes it difficult to cause fatal damage. The results of this study also show that the hypochlorite ion is less lethal than hypochlorous acid. However, hypochlorite ions may act on the outer surface of the E. coli cell, which may also lead to fatal damage.
3.4. Fluorescence Intensity inside Cells
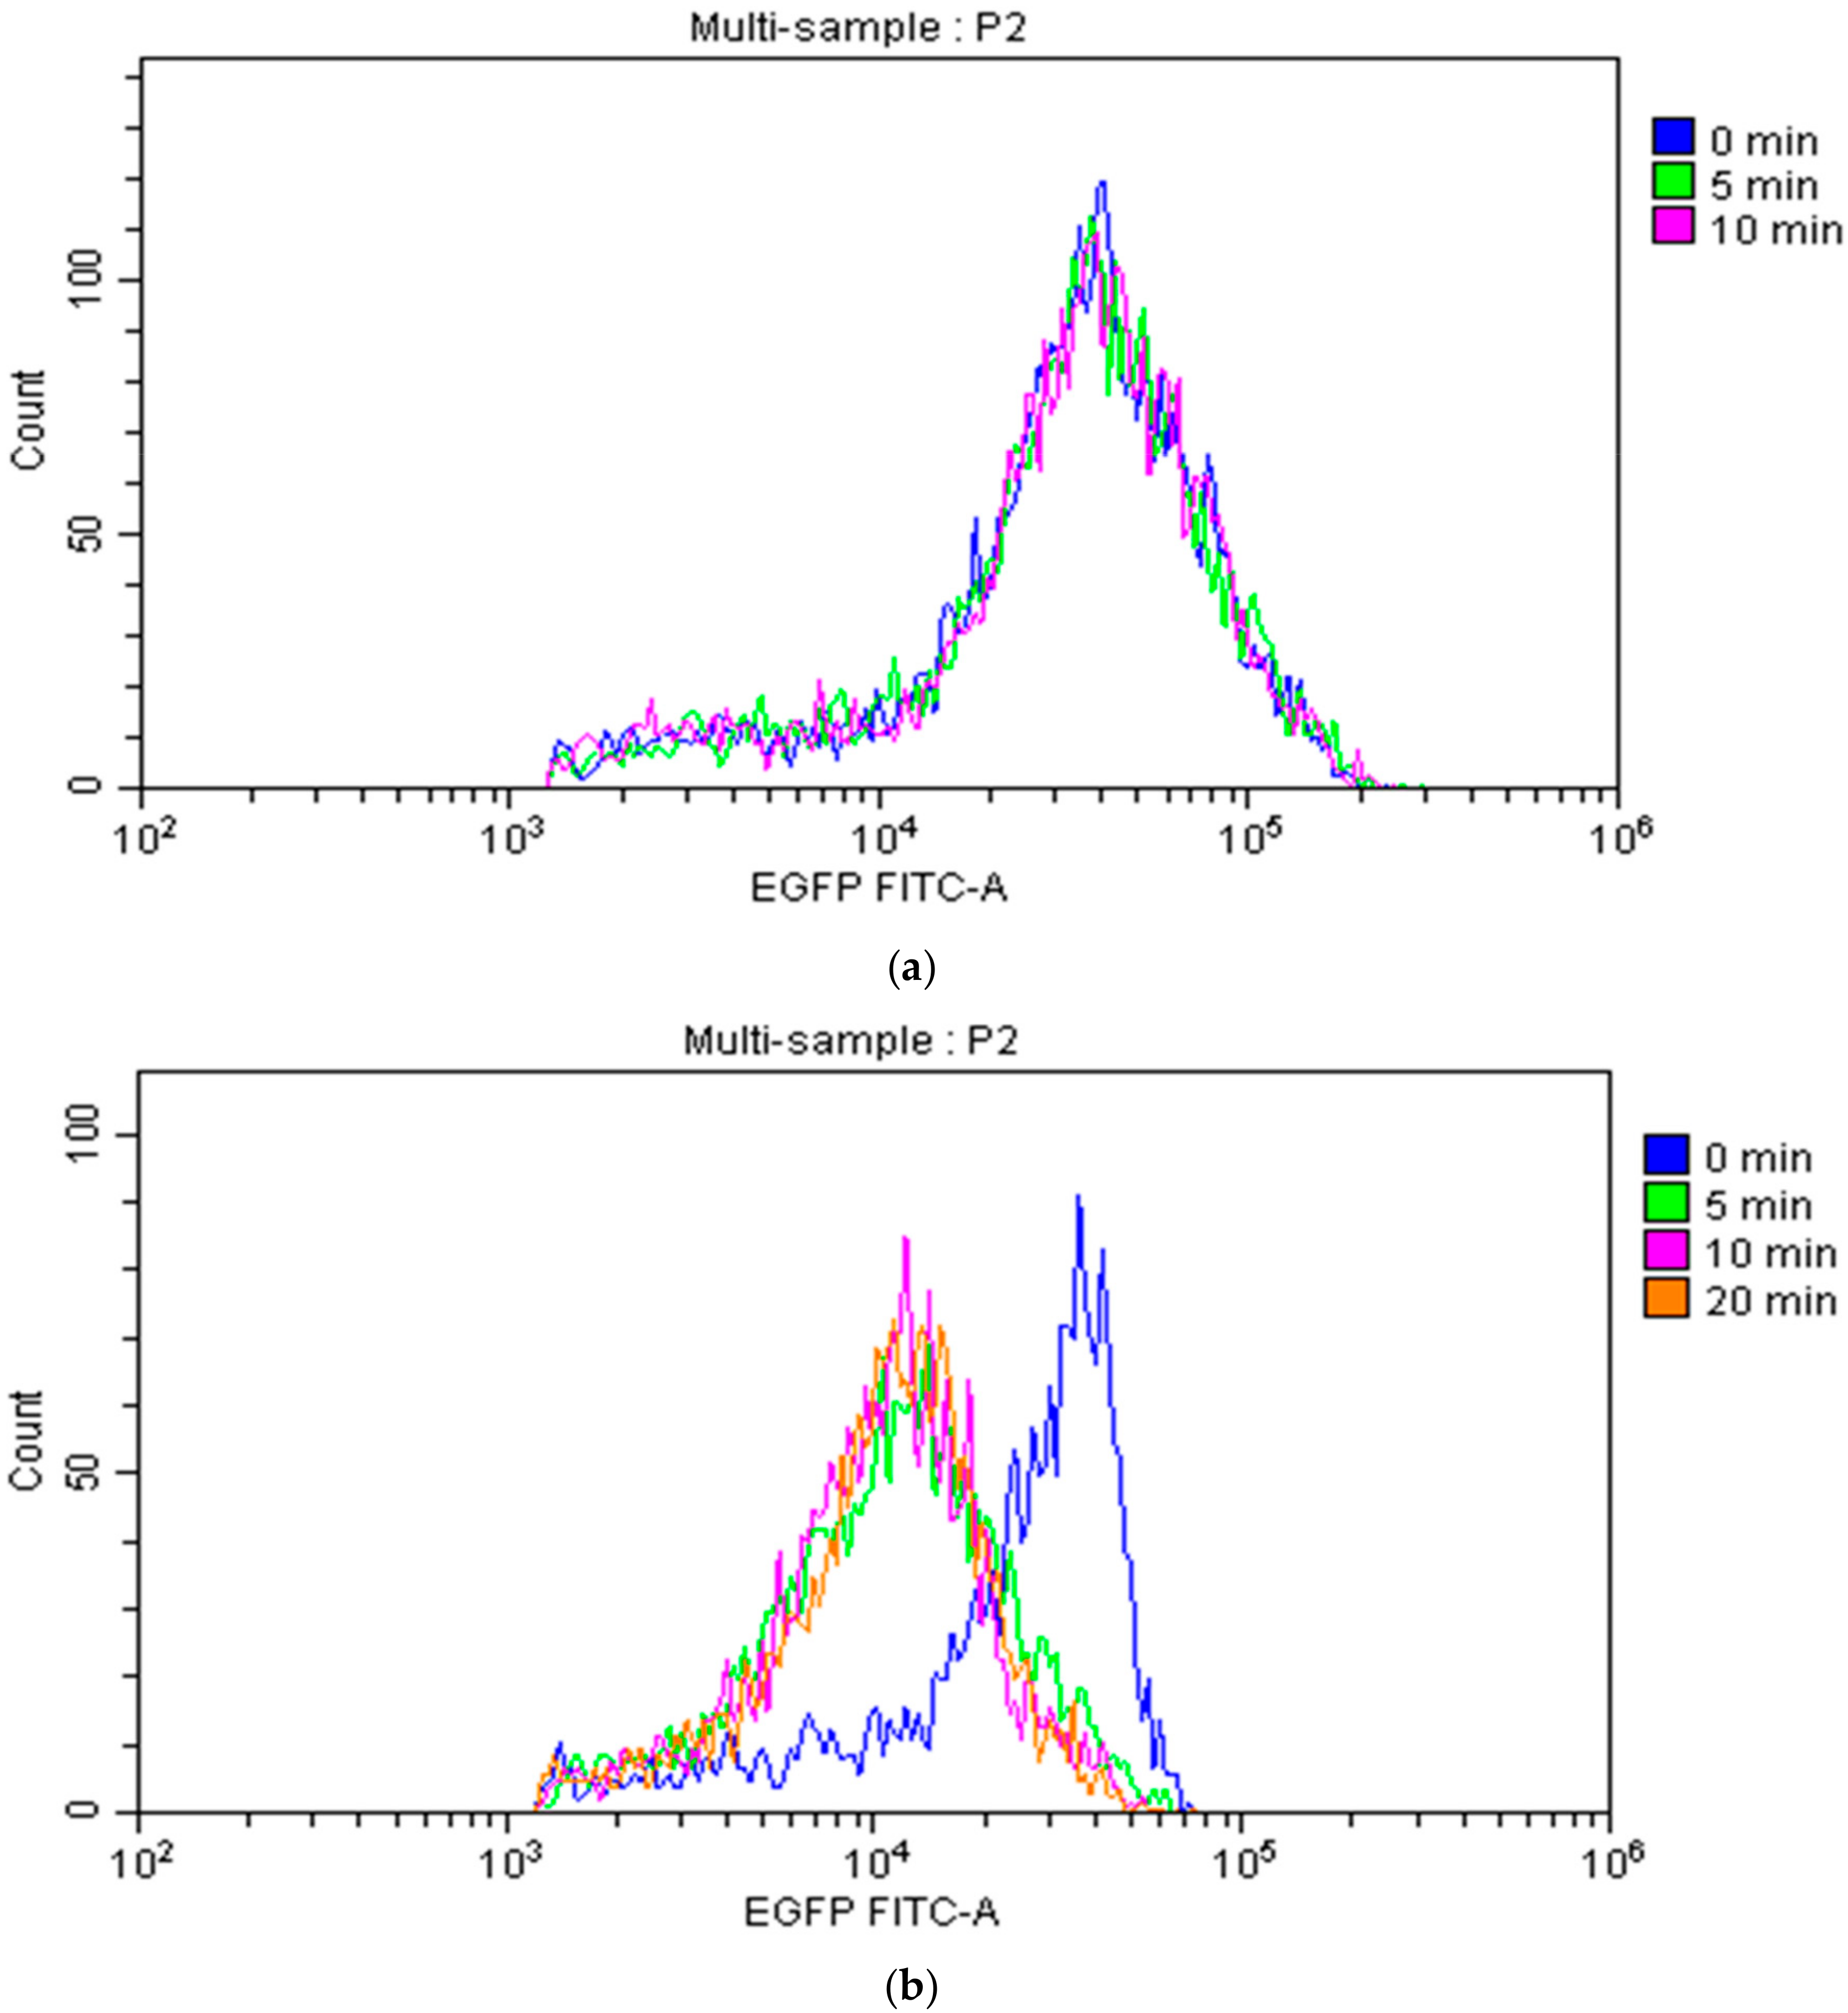
The internal fluorescence intensity was analyzed by flow cytometry. At pH 7, there was little change in the fluorescence intensity inside the cell during chlorination (Figure 4a). At pH 9, however, the change in internal fluorescence intensity due to chlorination was remarkable (Figure 4b). The maximum value of fluorescence intensity was lowered by chlorination, suggesting the leakage of EGFP from inside cells; this is supported by our results on the leakage rate of EGFP (Figure 3). However, fluorescence intensity did not change with chlorination time, a result that is also seen when the leakage rate of EGFP is plotted with the CT value on the horizontal axis (data not shown). Therefore, within the conditions of our experiments, much EGFP leaked at the timing of chlorine addition, with leakage proceeding slowly. This interpretation is consistent with the results of the leakage rate of EGFP (Figure 3).
4. Discussion
In this study, we investigated whether the degree of damage to E. coli by chlorine can be measured by expressing EGFP in the cytoplasm then calculating the leakage in response to chlorine treatment. EGFP leakage was also confirmed by measuring the fluorescent intensity inside cells after chlorination. We investigated whether the degree of damage to E. coli depends on the form of chlorine and were able to confirm the leakage of EGFP in response to chlorine and measure the degree of damage to the cell membrane and cell wall of E. coli. Previous studies have also confirmed that fluorescence intensity is influenced by high concentrations of chlorine in solution, buffer, and various other external factors [23,24,25,26]. Here, we confirmed the effect of experimental conditions such as pH, chlorine concentration, and treatment time on the fluorescence intensity of EGFP. We confirmed that the degree of damage by chlorine depends on its pH-dependent form. When chlorine was predominantly present as hypochlorous acid, it gained entry to E. coli and inactivated cells with little destruction of the cell membrane and cell wall. As a certain amount of hypochlorite ions were present at pH 7, outer cell surface damage under these conditions was ascribed to these ions. In contrast, when the major form of chlorine was the hypochlorite ion, EGFP leaked, suggesting the destruction of the cell membrane and cell wall of E. coli. E. coli log inactivation was higher when the major form of chlorine was hypochlorous acid. Previous research suggests that hypochlorous acid can easily permeate the phospholipid bilayer comprising the cell membrane of E. coli, while the hypochlorite ion does not permeate as easily, making it difficult for the hypochlorite ion to fatally damage E. coli [28]. Our results show that hypochlorite ions do not cause fatal damage to E. coli, as does hypochlorous acid. However, these ions acted on the outer surface of E. coli to a greater extent than hypochlorous acid, thus killing E. coli by destroying the cell’s outer layer. Compared to the various methods that have been used to evaluate disinfection, the method we used provides a better means to localize cell damage. It is possible to control where E. coli expresses the fluorescent protein through transformation with plasmid DNA. Therefore, the damage mechanism can be further elucidated by performing expression in other parts of E. coli. Moreover, fluorescence is a clear indicator that makes it possible to examine the amount of fluorescing material released outside the cell, as well as the amount remaining inside. However, fluorescence does not necessarily indicate the amount of leaked EGFP, and measurements depend on the fluorescence intensity of the leaked EGFP. Therefore, this method is a weak tool for quantitative work. Here, we compensated by calculating the reduction ratio of fluorescence corresponding to each CT value. For such a task, more efficient methods need to be investigated. Nevertheless, it was possible to analyze the mechanism of damage by chlorination on E. coli by expressing a fluorescent protein in the E. coli cytoplasm, treating it with chlorination, and measuring the amount of EGFP leaked. It is still necessary to clarify the details of the disinfection mechanism of chlorine through further applications of this method.
Author Contributions
Conceptualization, M.M., M.O., and K.A.; methodology, M.M., M.O., and K.A.; validation, M.O. and K.A.; formal analysis, M.M.; investigation, M.M.; resources, M.O. and K.A.; data curation, M.M.; writing—original draft preparation, M.M.; writing—review and editing, M.O. and K.A.; visualization, M.M.; supervision, M.O. and K.A; project administration, M.O.; funding acquisition, M.O. and K.A.
Funding
This research was funded by the Japan Society for the Promotion of Science (JSPS; Grant-in-Aid for Scientific Research (B), grant no. JP17H033311).
Conflicts of Interest
The authors declare no conflict of interest.
References
- Ohura, R.; Yoshikawa, S. Effect of bleaching by peroxide bleaching agent. J. Home Econ. Jpn. 1989, 40, 207–212. [Google Scholar]
- Albrich, J.M.; Hurst, J.K. Oxidative inactivation of Escherichia coli by hypochlorous acid. FEBS Lett. 1982, 144, 157–161. [Google Scholar] [CrossRef]
- Dukan, S.; Touati, D. Hypochlorous acid stress in Escherichia coli: Resistance, DNA damage, and comparison with hydrogen peroxide stress. J. Bacteriol. 1996, 178, 6145–6150. [Google Scholar] [CrossRef] [PubMed]
- Tryland, I.; Pommepuy, M.; Fiksdal, L. Effect of chlorination on β-D-galactosidase activity of sewage bacteria and Escherichia coli. J. Appl. Microbiol. 1998, 85, 51–60. [Google Scholar] [CrossRef] [PubMed]
- Venkobachar, C.; Iyengar, L.; Prabhakara Rao, A.V.S. Mechanism of disinfection: Effect of chlorine on cell membrane functions. Water Res. 1977, 11, 727–729. [Google Scholar] [CrossRef]
- Diao, H.F.; Li, X.Y.; Gu, J.D.; Shi, H.C.; Xie, Z.M. Electron microscopic investigation of the bactericidal action of electrochemical disinfection in comparison with chlorination, ozonation and Fenton reaction. Process Biochem. 2004, 39, 1421–1426. [Google Scholar] [CrossRef]
- Sips, H.J.; Hamers, M.N. Mechanism of the bactericidal action of myeloperoxidase: Increased permeability of the Escherichia coli cell envelope. Infect. Immun. 1981, 31, 11–16. [Google Scholar]
- Arana, I.; Santorum, P.; Muela, A.; Barcina, I. Chlorination and ozonation of waste-water: Comparative analysis of efficacy through the effect on Escherichia coli membranes. J. Appl. Microbiol. 1999, 86, 883–888. [Google Scholar] [CrossRef]
- Lisle, J.T.; Pyle, B.H.; McFeters, G.A. The use of multiple indices of physiological activity to access viability in chlorine disinfected Escherichia coli O157:H7. Lett. Appl. Microbiol. 1999, 29, 42–47. [Google Scholar] [CrossRef]
- Ramseier, M.K.; von Gunten, U.; Freihofer, P.; Hammes, F. Kinetics of membrane damage to high (HNA) and low (LNA) nucleic acid bacterial clusters in drinking water by ozone, chlorine, chlorine dioxide, monochloramine, ferrate(VI), and permanganate. Water Res. 2011, 45, 1490–1500. [Google Scholar] [CrossRef]
- Lisle, J.T.; Broadaway, S.C.; Prescott, A.M.; Pyle, B.H.; Fricker, C.; Feters, G.A.M.C. Effects of starvation on physiological activity and chlorine disinfection resistance in Escherichia coli O157:H7. Appl. Environ. Microbiol. 1998, 64, 4658–4662. [Google Scholar] [PubMed]
- Kazama, S.; Otaki, M. Mechanisms for the inactivation of bacteria and viruses in sawdust used in composting toilet. J. Water Environ. Technol. 2011, 9, 53–66. [Google Scholar] [CrossRef]
- Kazama, S.; Otaki, M. Inactivation mechanisms of E. coli in the sawdust used in composting toilet. J. Water Environ. Technol. 2012, 10, 363–374. [Google Scholar] [CrossRef]
- Kazama, S.; Otaki, M. Quantitative analysis of the inactivation mechanisms of Escherichia coli by a newly developed method using propidium monoazide. J. Water Environ. Technol. 2013, 11, 507–517. [Google Scholar] [CrossRef]
- Tsuchido, T.; Katsui, N. Destruction of the outer membrane permeability barrier of Escherichia coli by heat treatment. Appl. Environ. Microbiol. 1985, 50, 298–303. [Google Scholar]
- Virto, R.; Mañas, P.; Álvarez, I.; Condon, S.; Raso, J. Membrane damage and microbial inactivation by chlorine in the absence and presence of a chlorine-demanding substrate. Appl. Environ. Microbiol. 2005, 71, 5022–5028. [Google Scholar] [CrossRef]
- Cho, M.; Kim, J.; Kim, J.Y.; Yoon, J.; Kim, J.H. Mechanisms of Escherichia coli inactivation by several disinfectants. Water Res. 2010, 44, 3410–3418. [Google Scholar] [CrossRef] [PubMed]
- Nescerecka, A.; Juhna, T.; Hammes, F. Behavior and stability of adenosine triphosphate (ATP) during chlorine disinfection. Water Res. 2016, 101, 490–497. [Google Scholar] [CrossRef]
- Xu, L.; Zhang, C.; Xu, P.; Wang, X.C. Mechanisms of ultraviolet disinfection and chlorination of Escherichia coli: Culturability, membrane permeability, metabolism, and genetic damage. J. Environ. Sci. 2018, 65, 356–366. [Google Scholar] [CrossRef]
- Thomas, J.D.; Daniel, R.A.; Errington, J.; Robinson, C. Export of active green fluorescent protein to the periplasm by the twin-arginine translocase (Tat) pathway in Escherichia coli. Mol. Microbiol. 2001, 39, 47–53. [Google Scholar] [CrossRef]
- Dammeyer, T.; Tinnefeld, P. Engineered fluorescent proteins illuminate the bacterial periplasm. Comput. Struct. Biotechnol. J. 2012, 3, e201210013. [Google Scholar] [CrossRef] [PubMed]
- Chalfie, M.; Tu, Y.; Euskirchen, G.; Ward, W.; Prasher, D. Green fluorescent protein as a marker for gene expression. Science 1994, 263, 802–805. [Google Scholar] [CrossRef] [PubMed]
- Mazzola, P.G.; Ishii, M.; Chau, E.; Cholewa, O.; Penna, T.C.V. Stability of green fluorescent protein (GFP) in chlorine solutions of varying pH. Biotechnol. Prog. 2006, 22, 1702–1707. [Google Scholar] [CrossRef] [PubMed]
- Alnuami, A.A.; Zeedi, B.; Qadri, S.M.; Ashraf, S.S. Oxyradical-induced GFP damage and loss of fluorescence. Int. J. Biol. Macromol. 2008, 43, 182–186. [Google Scholar] [CrossRef] [PubMed]
- Lin, T.; Chen, W.; Cai, B. Inactivation mechanism of chlorination in Escherichia coli internalized in Limnoithona sinensis and Daphnia magna. Water Res. 2016, 89, 20–27. [Google Scholar] [CrossRef] [PubMed]
- Tomasek, K.; Bergmiller, T.; Guet, C.C. Lack of cations in flow cytometry buffers affect fluorescence signals by reducing membrane stability and viability of Escherichia coli strains. J. Biotechnol. 2018, 268, 40–52. [Google Scholar] [CrossRef]
- Clesceri, L.S.; Greenberg, A.E.; Eaton, A.D. Standard Methods for the Examination of Water and Wastewater, 20th ed.; American Public Health Association: Washington, DC, USA, 1998. [Google Scholar]
- Fukuzaki, S. Mechanisms of actions of sodium hypochlorite in cleaning and disinfection processes. Biocontrol Sci. 2006, 11, 147–157. [Google Scholar] [CrossRef]
Figure 1.
Fluorescence intensity retention efficiencies during chlorination at pH 7 and 9 plotted as functions of CT value. The fluorescence intensity reduction curve was calculated from the first-order decay constant.
Figure 1.
Fluorescence intensity retention efficiencies during chlorination at pH 7 and 9 plotted as functions of CT value. The fluorescence intensity reduction curve was calculated from the first-order decay constant.

Figure 2.
E. coli log inactivation during chlorination at pH 7 and 9, plotted as a function of the CT value.
Figure 2.
E. coli log inactivation during chlorination at pH 7 and 9, plotted as a function of the CT value.

Figure 3.
E. coli log inactivation and leakage rate of enhanced green fluorescent protein (EGFP) during chlorine treatment at pH 7 and 9. The leakage rate of EGFP that was calculated using measured values is plotted as a function of E. coli log inactivation. To consider the decrease in the fluorescence intensity of leaked EGFP, the maximum leakage rate was calculated from the CT value based on the results of Figure 1 and plotted.

Figure 4.
Changes in the fluorescence intensity of E. coli cells by chlorine at (a) pH 7 and (b) pH 9. Each histogram of 5000 gated events is shown as counts versus the log of fluorescence intensity. The color before chlorination is shown in blue and the colors after chlorination are shown in other colors for each treatment time.

© 2019 by the authors. Licensee MDPI, Basel, Switzerland. This article is an open access article distributed under the terms and conditions of the Creative Commons Attribution (CC BY) license (http://creativecommons.org/licenses/by/4.0/).
Share and Cite
MDPI and ACS Style
Mizozoe, M.; Otaki, M.; Aikawa, K. The Mechanism of Chlorine Damage Using Enhanced Green Fluorescent Protein-Expressing Escherichia coli. Water 2019, 11, 2156. https://doi.org/10.3390/w11102156
AMA Style
Mizozoe M, Otaki M, Aikawa K. The Mechanism of Chlorine Damage Using Enhanced Green Fluorescent Protein-Expressing Escherichia coli. Water. 2019; 11(10):2156. https://doi.org/10.3390/w11102156
Chicago/Turabian StyleMizozoe, Michiko, Masahiro Otaki, and Kyoko Aikawa. 2019. "The Mechanism of Chlorine Damage Using Enhanced Green Fluorescent Protein-Expressing Escherichia coli" Water 11, no. 10: 2156. https://doi.org/10.3390/w11102156
Note that from the first issue of 2016, this journal uses article numbers instead of page numbers. See further details here.