Techno-Economic Assessment of Air and Water Gap Membrane Distillation for Seawater Desalination under Different Heat Source Scenarios


Departamento de Tecnologías del Medio Ambiente, Faculty of Marine and Environmental Sciences, Instituto Universitario de Investigación Marina (INMAR), Campus de Excelencia Internacional del Mar (CEIMAR), University of Cadiz, Av. República Saharaui, Puerto Real, 11510 Cádiz, Spain
*
Author to whom correspondence should be addressed.
Water 2019, 11(10), 2117; https://doi.org/10.3390/w11102117
Submission received: 5 September 2019
/
Revised: 7 October 2019
/
Accepted: 9 October 2019
/
Published: 12 October 2019
(This article belongs to the Special Issue Membrane Technologies and Water Treatment)
Abstract
:Membrane distillation (MD) has a great deal of potential and this is currently being explored by the scientific community. However, this technology has not yet been implemented by industry, and an estimation of final product costs is key to its commercial success. In this study a techno-economic assessment of air gap MD (AGMD) and water gap MD (WGMD) for seawater desalination under different capacities and heat source scenarios was developed. The simplified cost of water (SCOW) method, which estimates investment costs, fixed and variable costs, as well as amortization factors and price influence over time was applied. In addition, experimental data from a laboratory-scale MD desalination plant were also used. The results showed water costs in the range of 1.56 to 7.53 €/m3 for WGMD and 2.38 to 9.60 €/m3 for AGMD. Specifically, the most feasible scenario was obtained for WGMD with a capacity of 1000 m3 daily using waste and solar heat. Finally, the costs obtained for MD were similar to those of conventional desalination technologies at the same scale factor. Therefore, although large-scale pilot studies and optimization of manufacturing processes are needed, MD shows very promising results that should be considered further.
1. Introduction
Water is essential to human well-being and for the good condition of ecosystems. It is widely known that water shortage and the loss of water quality are major global socio-economic and environmental issues [1,2,3]. The combined effect of exponential population growth, changes in lifestyles, climate change, and thus the progressive depletion of freshwater resources are further exacerbating the problem [3,4]. Likewise, arid zones, droughts and the mere fact that more than 70% of the world’s population lives close to the coast means that desalination and water reuse technologies play a key role in providing a reliable source of freshwater [5,6]. In fact, many countries and regions have already considered desalination as the most viable and economical solution for freshwater production [3,6,7,8,9].
Desalination technologies are witnessing significant growth as a consequence of lower material and energy costs and greater process efficiency, and thus desalinated water is getting cheaper [10,11,12]. Among conventional industrial-scale desalination technologies, the most widespread are membrane processes such as reverse osmosis (RO), followed by thermal processes such as multi-stage flash distillation (MSF) and multi-effect distillation (MED) [13,14]. Nowadays, the high maturity and implementation level of these processes is demonstrated by huge operating desalination plants. For example, Shoaiba II (MED) with a capacity of more than 90,000 m3/day; Soreq (RO) with a capacity of 540,000 m3/day and the largest desalination plant in the world, and Ras Al-Khair (MSF-RO), with a total capacity of over 1 million m3 daily [10,11,13,14,15,16].
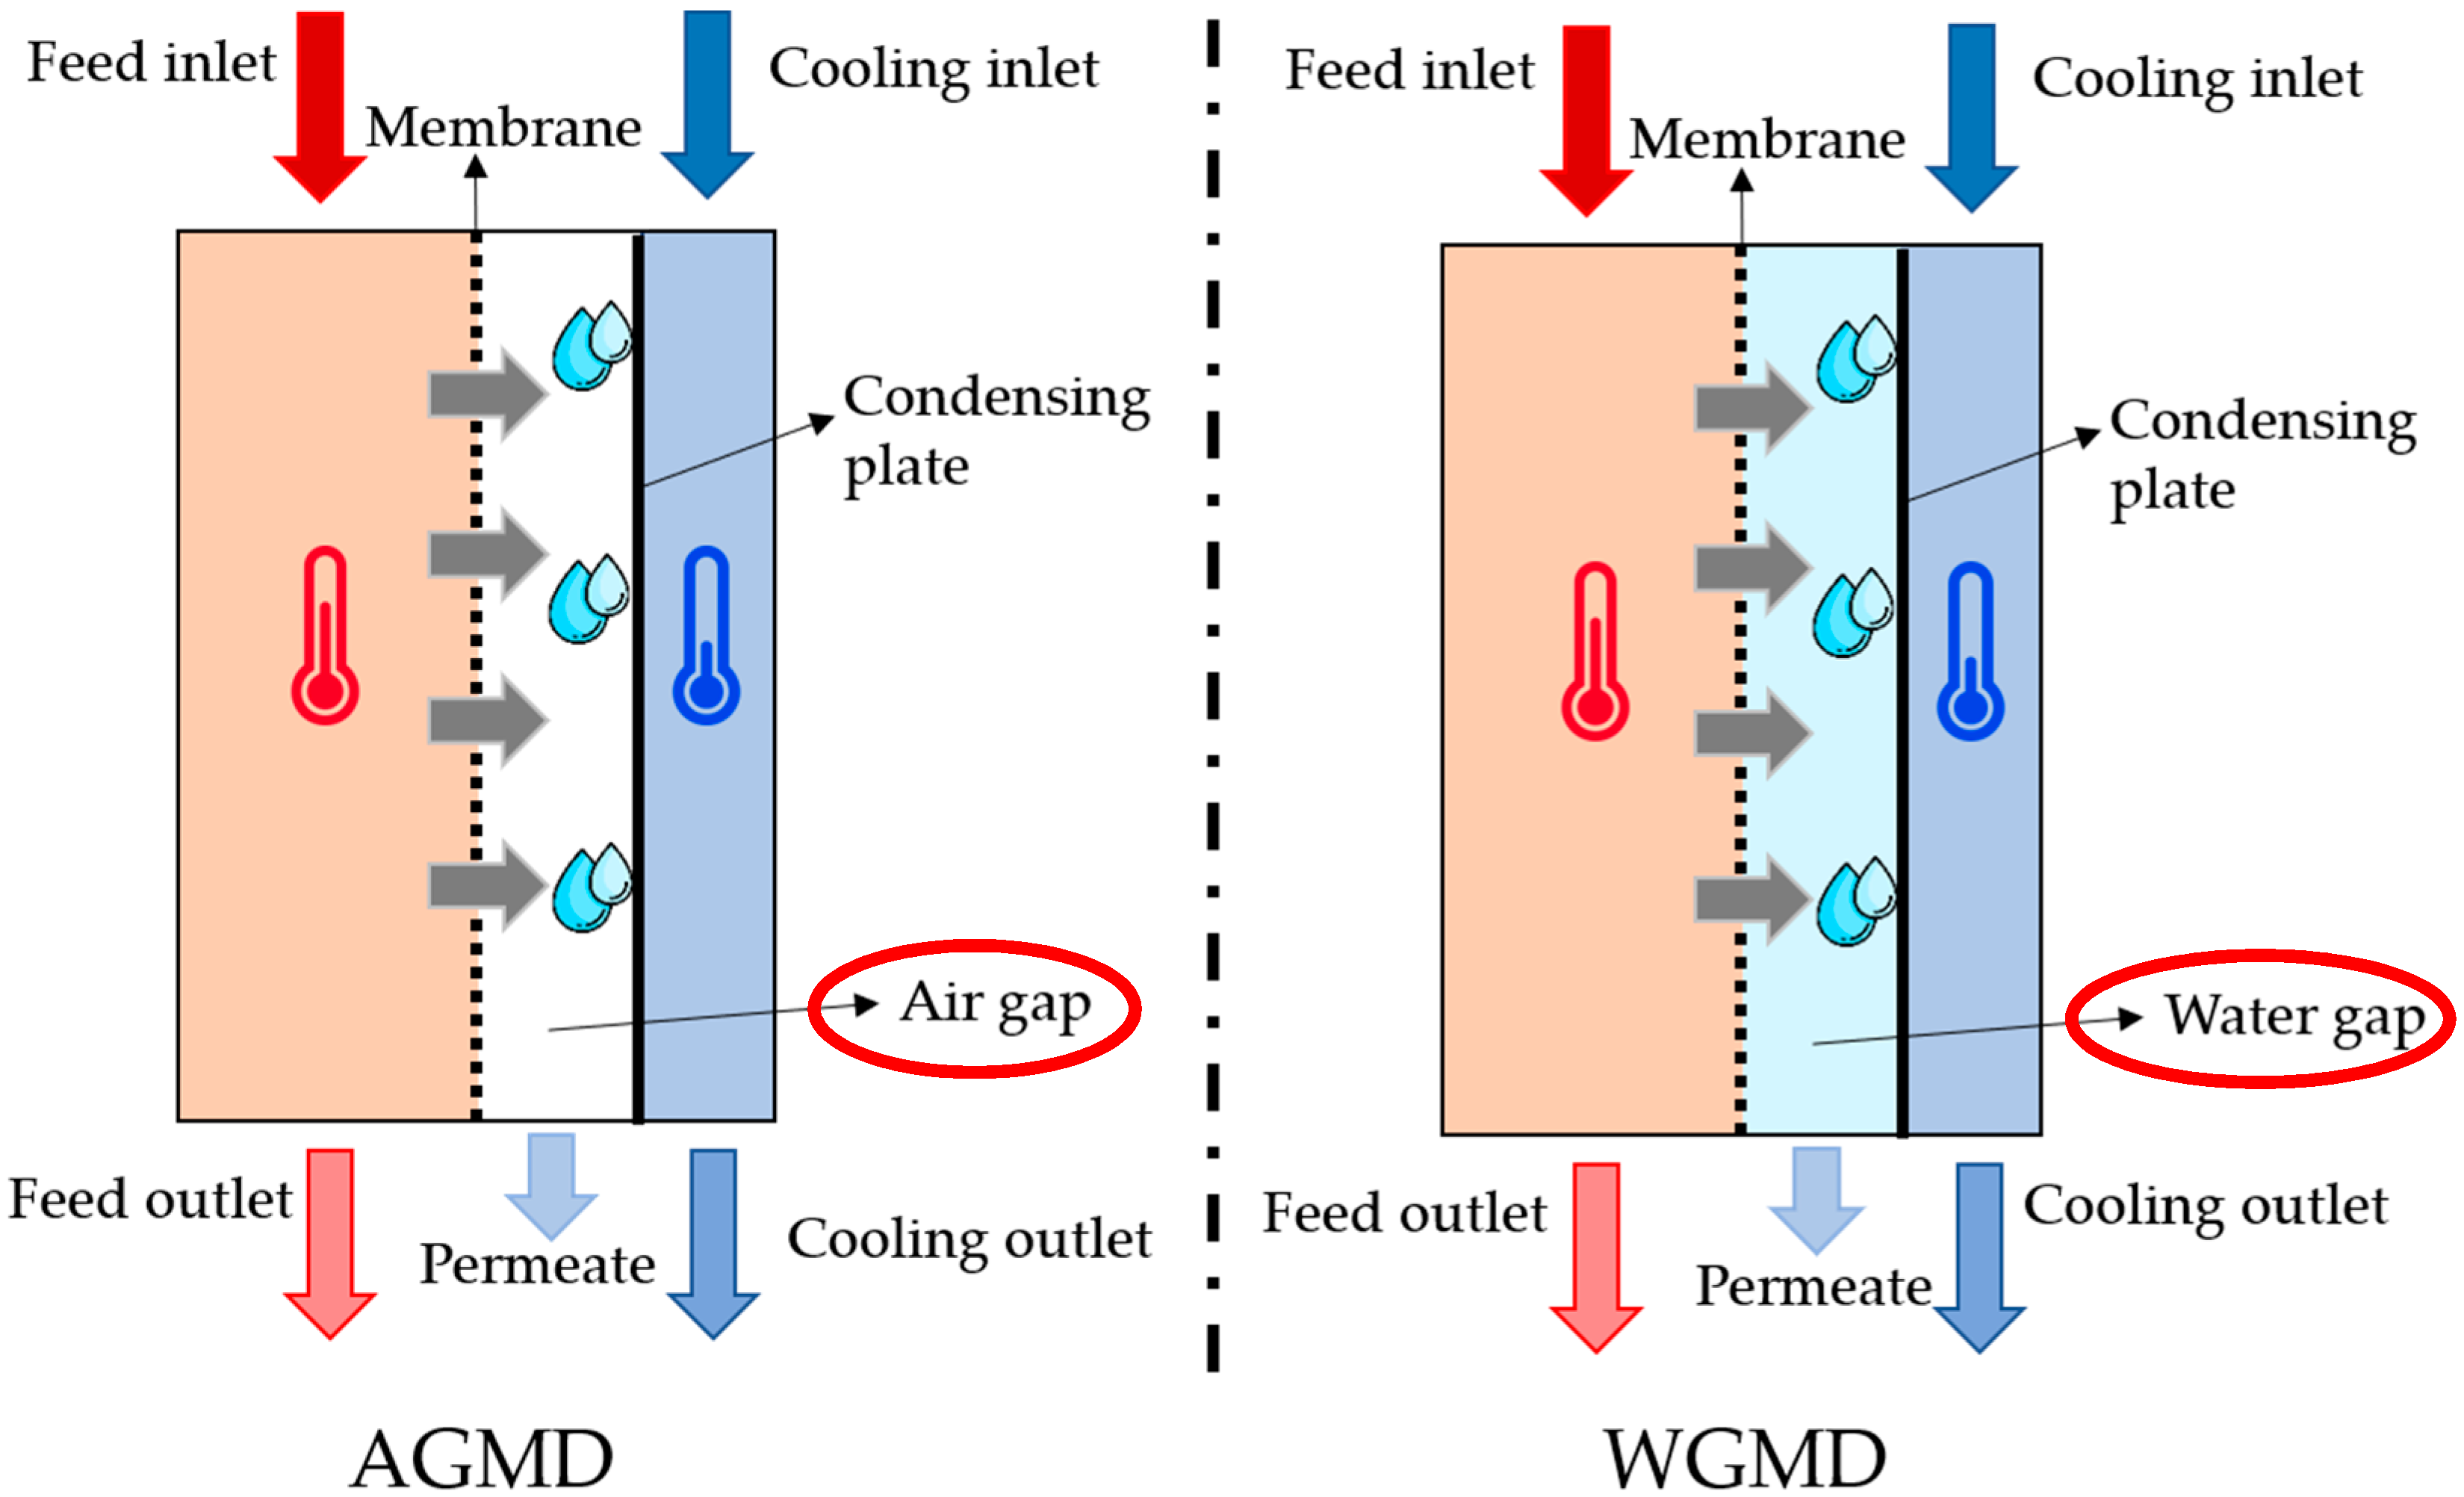
Nonetheless, emerging desalination technologies are still being developed, including membrane distillation (MD), which presents attractive and advantageous features compared to conventional technologies [2,9,16,17]. MD is a thermally driven separation process, combining membrane separation and phase-change thermal distillation. Thus, the vapor pressure between both sides of a microporous and hydrophobic membrane is the driving force in this separation process [18,19,20]. As a result, MD equipment is smaller and more compact than conventional technologies such as MSF or MED, as only the existing vapor space in the membrane pores is needed. Furthermore, operating pressures are very low, which means lower equipment costs and increased process safety compared to RO [21]. Likewise, the treatment of concentrated hypersaline brines is feasible with MD, which allows for greater synergy between desalination technologies [9,22,23,24,25]. Additionally, MD can use low-grade and waste heat, as well as alternative and renewable energy sources like solar and geothermal energy. The latter leads to increased process energy efficiency, while allowing better portability for applications in remote locations [26]. In terms of membrane performance, very high-quality water is produced, rejecting up to 100% of non-volatile compound [27]. Equally important, MD membranes fouling is lower than in other membrane processes [28]. Among MD configurations, commonly investigated modes include direct contact MD (DCMD), air gap MD (AGMD) and water gap MD (WGMD). In DCMD, feed and cooling water are in contact with the membrane surface, so pure distillate cannot be obtained because it is mixed with the coolant. In this way, high transmembrane fluxes are obtained but there are also high heat losses by conduction through the membrane [29]. In AGMD (Figure 1), while the hot feed water is in contact with the membrane surface, an airtight layer a few millimeters thick separates the membrane surface from a heat-conducting condensing surface such as a metal plate. In this way, the cooling stream flow is insulated behind the condensing plate. This allows any type of liquid cooling stream to be used, including the cold feed water itself [30,31,32]. During the operation, the vapor flows through the air gap and condenses on the cold plate surface, obtaining a pure permeate. This feature turns AGMD into one of the most versatile configurations, with applications both in desalination and in those where volatile compounds are removed from the feed water. Compared to DCMD, in AGMD, there is less heat loss by conduction. However, the air layer generates additional resistance to mass transfer, which results in less permeate flux [29,33,34]. WGMD emerged as an improvement of the two previous configurations. In WGMD, as it shown in Figure 1, the gap is filled with distilled or permeated water, therefore, the transmembrane flows are improved due to lower mass transfer resistance with respect to AGMD [28,35,36].
One of the most critical features of the MD is the heat requirement to produce the phase change of the feed. As seen above, the heat sources used in MD may include low-grade heat, waste heat, and alternative sources. Although low-grade heat is sufficient to drive the MD process, the demand for thermal energy is high, and this, coupled with a need to improve module and membrane designs, creates challenges for the technology. Therefore, suitable and available heat sources are a key factor to improve the efficiency and competitiveness of MD compared to other conventional desalination processes. The high heat demand is largely related to the substantial amount of heat transferred through the membrane, primarily in the form of latent heat. Nonetheless, high quality permeate and the potential to drive the MD process with waste heat are opportunities that are gaining acceptance in large-scale industrial applications [2,20,24,37].
These features of MD make it a promising alternative to conventional desalination and water reuse technologies for many environmental and industrial applications [19,38,39]. Examples of some of these applications include water treatment of food [40,41,42] and textile industries [43,44,45], wastewater [46], acid mine drainage [47] or even radioactive wastewater [48], among others [22,49]. Nevertheless, despite being of great interest to scientist and engineers, MD is still at medium (4–5) technology readiness levels (TRLs) [50] and therefore, MD has not yet been fully commercialized and implemented by industry [51,52]. According to Kujawa et al. [24], the difficulties in large-scale implementation of MD are related to the lack of adequate and effective module design, suitable membranes, and its energy-intensive consumption (where waste heat, solar energy or different alternative energy sources are not used). The technological viability of MD is not only defined by its technical performance, but it must also be economically and energetically feasible [1,6,17]. As in other industries, in desalination, the cost of the final product is one of the main criteria to be taken into account for the commercial success of a specific technology [6,53,54]. For this reason, although MD has shown considerable technical achievements, economic feasibility analyses should be carried out with a view to its future industrial application [17,49,55,56].
Despite the abundance of studies focused on the cost estimation of conventional thermal and membrane desalination processes, only a few cost estimation studies are available for MD, and most of these are based on a pilot scale and simulated forecasts [34,57]. The cost estimation depends on a wide variety of factors, such as: type and size (capacity) of the MD system, operating conditions, energy source, recovery systems, feedwater and, of course, the cost-estimation approaches performed. As a result, MD production costs range widely from 0.24 to 118 €/m3 [17,34,58,59]. Table 1 shows the main techno-economic studies for MD, according to simulated capacities, configuration, feedwater and other aforementioned factors.
This study is based on the hypothesis that MD is a technically and economically feasible desalination technology. To be precise, AGMD and WGMD configurations are expected to be competitive against other conventional desalination processes when using waste heat and/or renewable energies. WGMD is a configuration that has not been studied in economic terms and we intended to compare it with more common configurations like AGMD, and to compare these with conventional processes. In order to ensure, the reliability of these comparisons and estimates as much as possible, the same methodology was used in all cases, and the boundary conditions and assumptions were clearly defined to simulate different energy scenarios and the effects of the scale factor. Several questions arose that are related to the initial hypothesis. What are the impacts of using different configurations on the process total cost? Which configuration is the most cost-effective? Under what conditions? What is the difference in total costs and their order of magnitude with respect to the use of a more and less favorable type of heat source? Which element studied has the greatest influence on process costs? Could actions be taken on these elements? Could MD really be a feasible desalination process in the future?
This work is therefore dedicated to the techno-economic assessment of MD for its use in desalination using AGMD and WGMD configurations. Thus, several heat source scenarios were taken into account in order to assess energy efficiency and economic viability, and estimate the cost of the water produced. In this regard, sensitivity analyses were performed, ranging from more favorable heat sources such as low-grade heat or solar energy, to clearly unfavorable scenarios such as burning fossil fuels or the use of grid electricity. Additionally, various capacities of MD plants were simulated to represent isolated, community and industrial uses. The techno-economic simulations and models conducted in this study were based on the experimental results and performances obtained in a laboratory-scale desalination MD plant as well as on the methods and estimates widely used in the literature.
2. Materials and Methods
First of all, as suggested by Towler et al. [64] and Papapetrou et al. [53], it is extremely important to define the scope and purpose of a techno-economic assessment. Depending on this target, a deeper level of details may be required, and consequently, greater complexity. In this paper, the purpose was to perform a MD cost estimate analysis that allows broad comparisons between different MD configurations and desalination technologies. In order to make the analysis as realistic as possible, boundary conditions were validated through various experiments using a laboratory MD setup (Figure 2) reported elsewhere [65]. Based on these boundary conditions and the suggested assumptions, simulations were performed using validated cost calculation methods, which are described in the following sections and supported extensively by literature.
2.1. Assumptions and Boundary Conditions
The different operating conditions and MD laboratory system design used in this work are shown in Table 2. These conditions were used as a reference for the calculation of investment and operating costs. In this work, continuous feed and cooling flows are assumed for all scenarios, simulating industrial-type effluent or energy supply facilities. This boundary condition must be taken into account for cost estimates as it may affect some elements of an MD process, such as storage tanks.
Depending on the source of heat used, four scenarios were proposed: use of free waste heat from an industry, burning of fossil fuels, electricity and use of alternative energies such as solar heat. For fossil fuels, fuel oil was selected for its widespread use by industry. In this way, the most economically favorable scenarios for different MD configurations can be assessed. Additionally, 10, 100 and 1000 m3 daily permeate production capacities were proposed for each scenario and MD configuration. Thus, desalination costs for isolated, community and industrial uses are estimated. All costs are indicated in Euro (€) currency.
2.2. Cost Calculation Methods
For the objectives and purposes stated in this work, the simplified cost of water (SCOW) modified method proposed in [53,66] was used to determine the final cost of the water produced (€ m−3) for each scenario, capacity and MD configuration aforementioned. As stated previously, there is great variability in MD cost estimations, which is caused, among other factors, by the methodology used. Therefore, the SCOW method was used, since this methodology or its modified versions has been applied in most of the existing economic assessments for desalination processes [5,49,53,61,64,66,67,68,69,70,71,72,73,74,75,76,77,78,79,80,81,82,83]. Furthermore, this approach is also applied to calculate energy costs for several technological processes [84,85,86,87].
The SCOW method takes into account price variation over time (λ), which can be calculated using Equation (1), where (CI) is the total investment costs and (CF) and (CV) are fixed operational costs and variable operational costs, respectively.
Total investment costs were annualized by using the amortization factor (α) that is defined by Equation (2), assuming an amortization time, also named plant lifetime (n) and a fixed interest rate or discount rate (i). In this work, a lifetime for recent plants of 30 years and a discount rate of 7% were chosen, as suggested in [5,53,81,88,89].
The multiplier (λ) is defined by Equation (3) and parameter (K) is given by Equation (4), where (r) is a nominal escalation rate. In this work, r was fixed at 4%, as suggest A.N. Mabrouk et al. [81].
The SCOW approach assumed that an MD desalination plant produces exactly the same amount of water annually (MP) throughout its lifetime.
For a better understanding of the methodology used in this work, the following sections develop in detail the calculations for the determination of each element shown in Equation (1).
2.2.1. Preliminary Estimations
According to D. Winter [55], any cost estimate is based on annual hours of operation (ta) and the operational availability of the MD plant (Г), which is given by Equation (5). As reported in the literature [53,75], a common operational availability of 0.83 was fixed, which means a daily operating time of 20 h.
Subsequently, the annual production rate of permeate (MP) and the annual raw water demand (MR) are defined according to Equations (6) and (7), respectively. The hourly permeate production (mp) and hourly raw water demand (mr) were calculated taking into account the predefined MD production capacities for each use and scenario. A water recovery factor (WRF) of 50% was chosen for MD plants, according to Al-Obaidani [17].
In order to estimate the costs of the components involved in the MD plant, a capacity method was used. This method is based on the assumption of a reduction of specific costs by increasing capacity. According to Equation (8), if reference costs (Cref) are known for a reference capacity (Kref), then the absolute costs (C) for any given capacity (K) would be estimated by a degression coefficient (m) [49,55,56]. This degression coefficient was set at 0.80 [55,61].
2.2.2. Total Investment Costs
The investment costs, also called capital costs (CI) were calculated from Equation (9), where (Ceng) are the costs associated with engineering, construction and project management and (Ceq) is the equipment costs. (Ceng) was estimated at 20% of equipment costs by Equation (10) [53]. Meanwhile, (Ceq) is represented in Equation (11) as the sum of the MD module costs (CMD), the heat exchanger costs (CHX) and the costs of the rest of the MD plant (CrMD) [55].
To determine the costs of the MD module (CMD), the sum of the costs of the membranes (Cmemb) and the costs of the module materials (CmatMD) must be taken into account. Thus, the effective membrane area required for each MD configuration and scenario is estimated, based on the experimental permeate flux data and the hourly permeate production. This membrane area is used in the capacity method as a capacity (K). In order to obtain the cost of the MD membranes, the reference cost provided by the company Aquastill for a reference capacity of 1 m2 was applied. Similarly, the capacity method was applied for the costs of materials in the MD module. In this case, the effective membrane area was also used as capacity K, while Kref (0.025 m2) and Cref (from local suppliers) were obtained from the actual MD module. The main materials of a standard MD module were considered, such as the main body plates, condenser plates, frames, gaskets and spacers.
With regard to the rest of the MD plant costs (CrMD), the following items were considered: instrumentation and control, piping, electrical system and pumps. These pumps were selected from an updated vendor catalogue (2019) and based on the hourly raw water demand (mr). For all other components, the capacity method was applied, taking into account the maximum capacity of experimental MD plant (0.6 m3 h−1), mr and the actual costs provided by the vendor company APRIA systems. In cases where feed and cooling flows are not continuous, storage tanks’ associated costs should be estimated and taken into account.
For each treatment capacity simulation, the estimated cost of the heat exchangers (CHX) was obtained from the published work by Schwantes et al. [49]. Under the scenarios in which solar energy was considered, CHX was replaced by the investment costs of solar heat (Csolar). In this way, the solar power required in the MD plant was calculated, starting from the annual production of permeate (MP) and calculating the specific consumption of thermal energy (STEC). The capacity method was applied using data provided by the International Renewable Energy Agency (IRENA). In this work, an investment cost of 744 € per kWth (thermal kW) and flat plate collectors (FPC) were used as a reference for Spain [90].
2.2.3. Operational Costs
As suggested in [53,55,66], operational costs were broken down into fixed operational costs (CF) and variable operational costs (CV), in accordance with Equations (12) and (13), respectively.
Service and maintenance costs (CSM) and insurance costs (CIN) were estimated at 2.5% [7] and 0.5% [55] of investment costs (CI). Similarly, the labor costs (CL) and replacement costs for MD modules (CRMD) were calculated as reported by Kesieme et al. [61] and Schwantes et al. [49], respectively.
Chemical costs (CCH) were estimated based on the annual raw water demand and a cost of 0.038 € per cubic meter as reported by B. Rahimi et al. [83]. In order to evaluate the costs related to electricity consumption (CEL), the annual hours of operation (ta), the specific pumps power and the price of electricity were taken into account. According to Eurostat, the unit price of electricity is defined as 0.1032 € per kWh [91].
The cost of thermal energy (Cthermal), one of the most important in the MD process, is given by Equation (14).
where STEC (kWh m−3) and PkWhthermal are the specific thermal energy consumption of the MD process and the price of thermal energy (€ kWh−1), respectively. STEC was calculated as reported by Amaya-Vías et al. [47] using experimental fluxes for both MD configurations as well as a temperature difference according to Winter [55]. Also, the price of thermal energy change was calculated according to the proposed scenario, as is shown in Table 3.
3. Results and Discussion
3.1. Comprehensive Cost of Water Assessment for Each MD Configuration, Capacities and Heat Source Scenarios
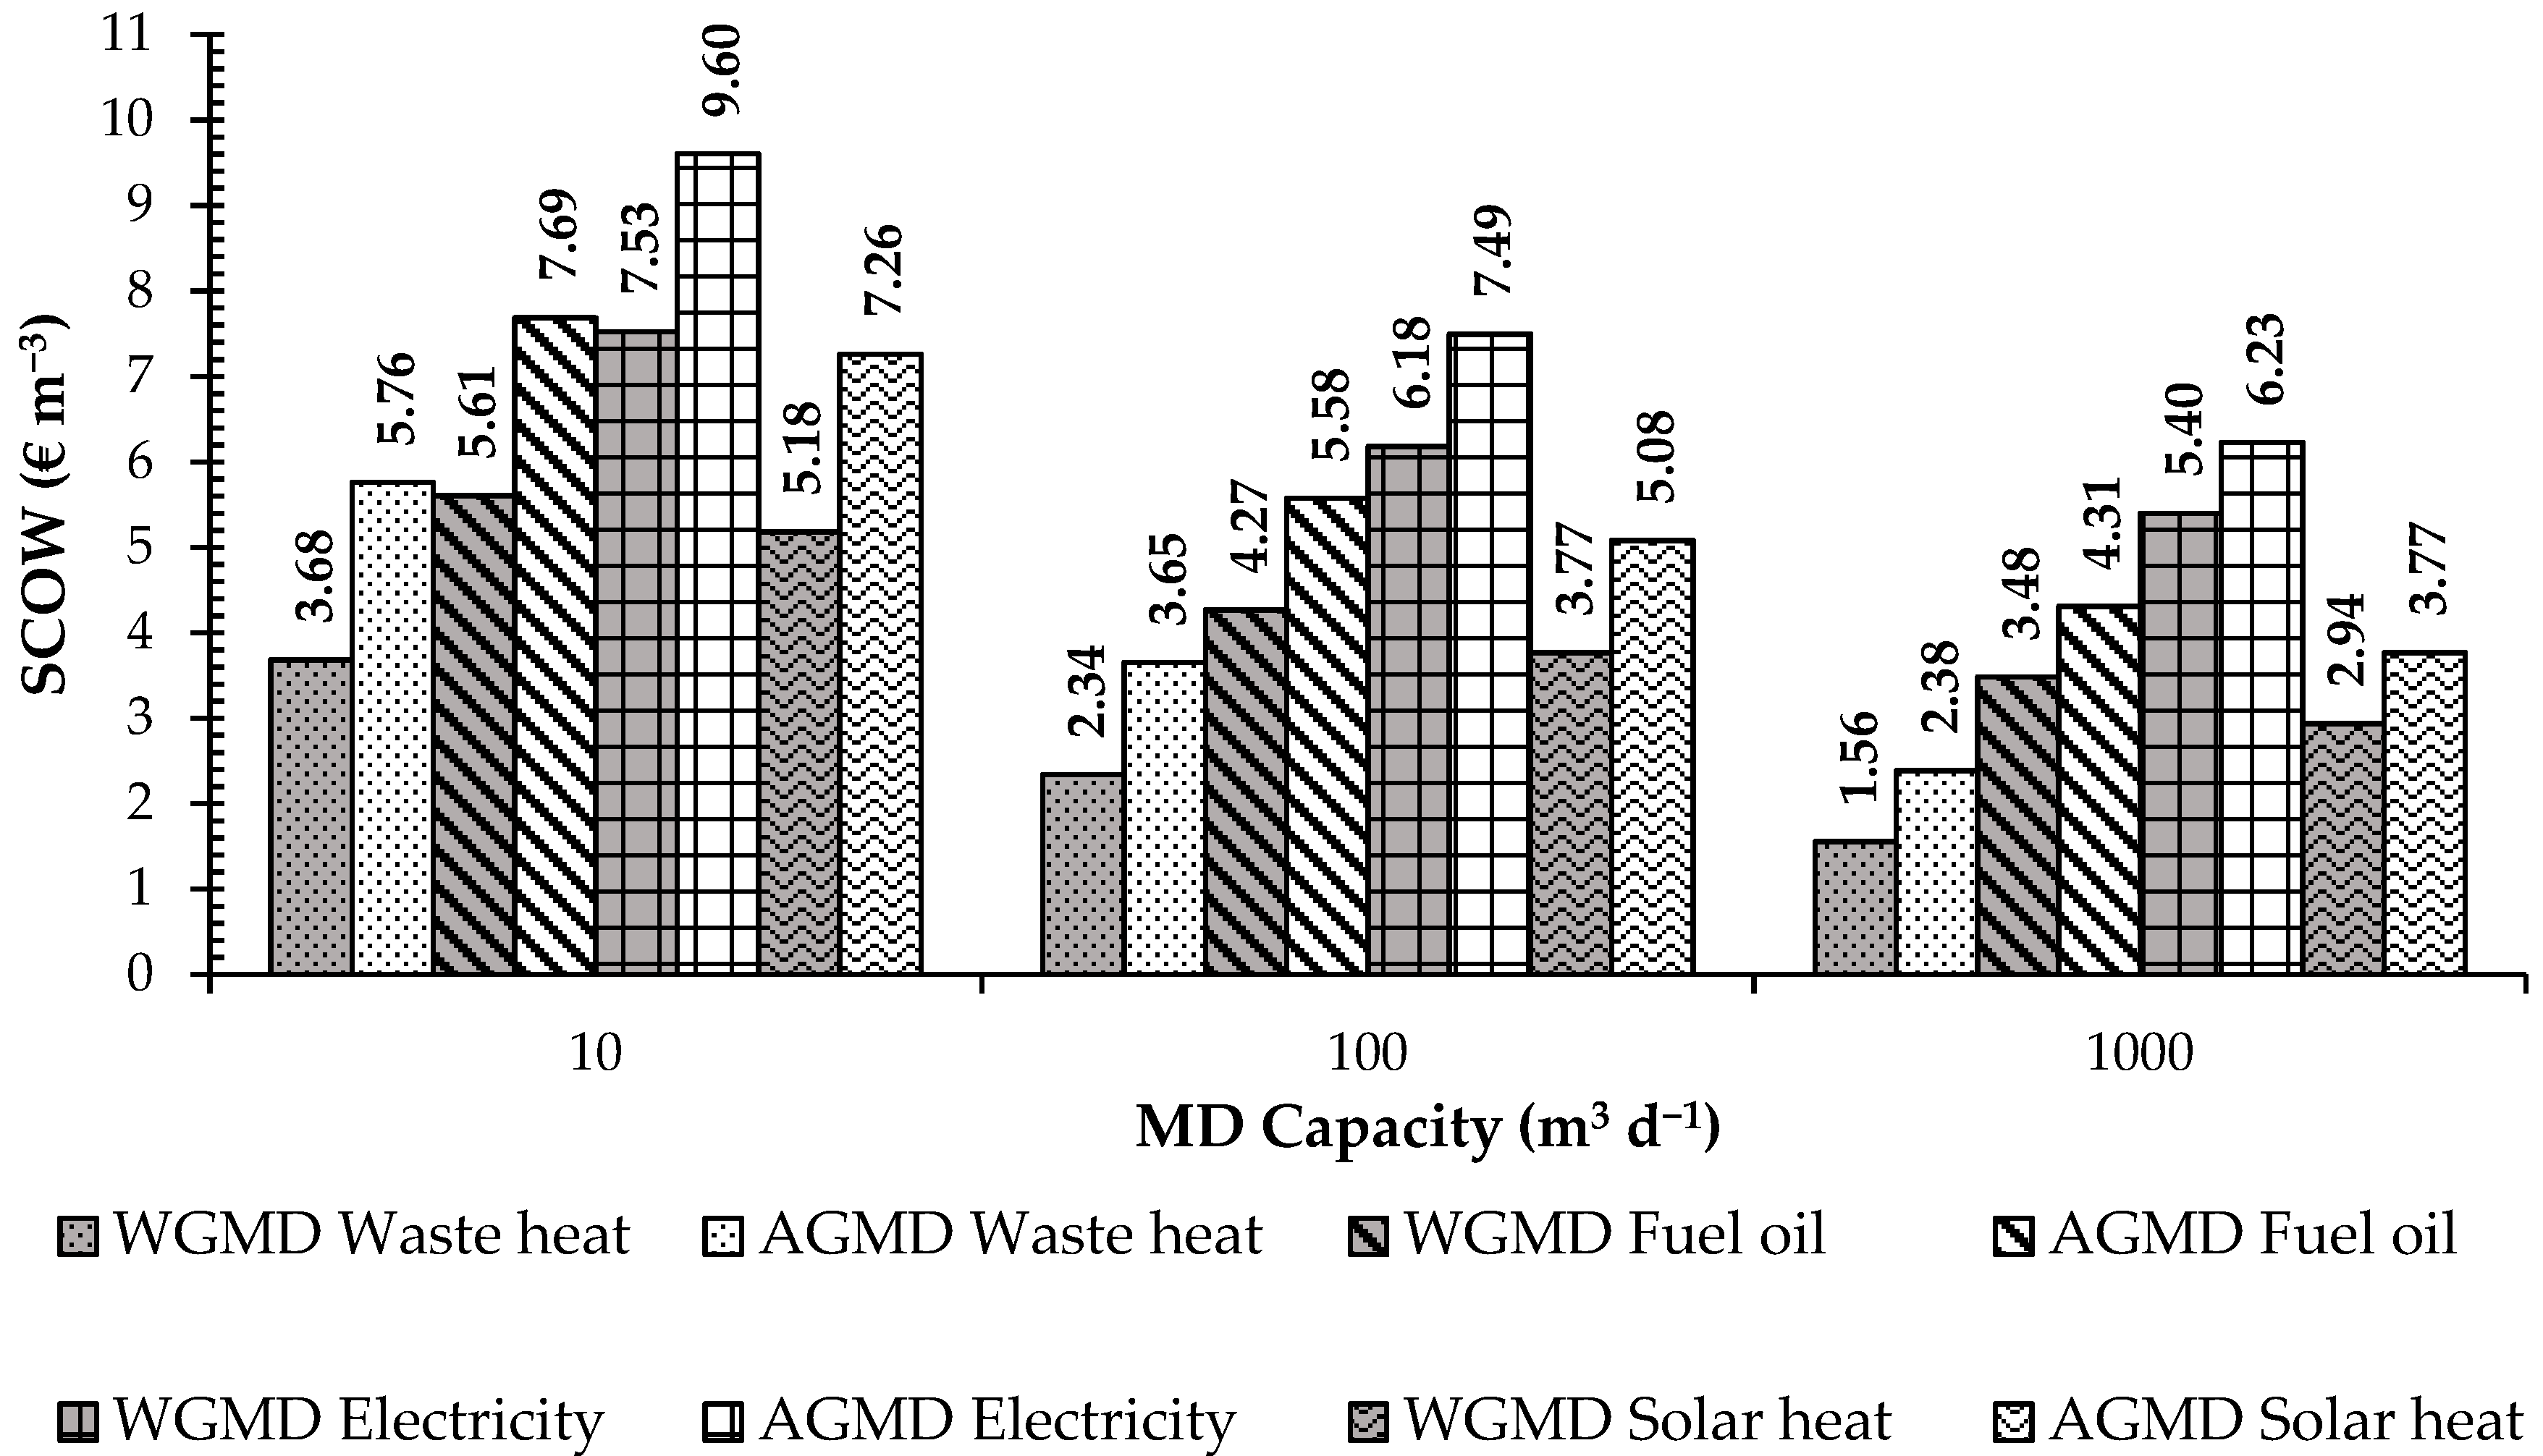
Figure 3 shows the results obtained for the cost of water in both MD configurations, as well as for all proposed capacities and heat source scenarios. Overall, costs for WGMD oscillated between 1.56 and 7.53 € m−3, while for AGMD, these ranged between 2.38 and 9.60 € m−3. In addition, due to the scale factor, water costs were reduced with an increase in MD capacity, showing the minimum cost corresponding to a MD capacity of 1000 m3 d−1.
On the basis of heat source scenarios, the most suitable were waste heat followed by solar heat. On the contrary, the use of electrical energy was the most unfavorable scenario in economic terms, followed by fuel oil burning. The results obtained for the waste heat scenario are also interesting and promising from an environmental point of view. In addition, regulatory policies on thermal pollution are becoming increasingly restrictive all over the world. In this sense, a waste heat of around 50–90 °C that is discharged into the environment by an industry can be exploited by a MD desalination process. As a result, both the economic cost of the technology and the environmental profile of the affected industry are improved. Furthermore, thermal pollution of a natural water body is thereby avoided. An example of industrial applications of this MD scenario include water treatment of the petrochemical and gas industry, power plants or desalination related to maritime navigation, as in the case of desalination on board cruise ships, see, for example, [65].
Equally important is the solar heat scenario. This sustainable alternative heat source is currently being developed for MD, as shown in several studies [28,93,94,95]. This source of heat has great potential in countries where this resource is available [96]. In addition to the abundance of the solar resource, which determines energy availability and quality, the type of solar collector installed should also be taken into account. In this study, flat-plate collectors were chosen as the most widespread in low-temperature commercial solar heating systems. However, other types of collectors have been used in other economic assessments, such as parabolic or tubular collectors, which have different efficiencies, technological maturity and investment costs. This factor, among others, could have an impact on the estimated higher costs of around 13–17 €/m3 for AGMD and DCMD, as shown in Table 1.
WGMD was more profitable than AGMD in all cases. Indeed, for a capacity of 10 m3 d−1, using WGMD with fuel oil or electricity is slightly more cost-effective than using AGMD with waste heat or fuel oil, respectively. This result can be explained by the lower permeate flux for AGMD. Thus, a larger membrane area and module is required. In this way, the investment costs as well as the replacement and maintenance costs are higher for AGMD, with smaller MD capacities being further penalized in comparison with WGMD, as can be seen in Table 4 and Table 5. From a general point of view, the factor of geographical location should not be forgotten [53]. The results obtained in this assessment are based on market prices in Europe, specifically Spain. Thus, electricity and fossil fuel prices may change drastically from one country to another, as is the case in the Middle East, where thermal desalination technologies such as MSF and MED are predominant. Thus, the use of MD with fossil fuels in these resource-rich countries could be more cost-beneficial than solar heating and even comparable waste heat values.
The breakdown of the costs of water is shown in Table 4 and Table 5 for WGMD and AGMD, respectively. This breakdown is given in € m−3 and as a percentage of the SCOW, for a better understanding of the data presented in this paper. Likewise, the effect of the individual costs according to capacities and heat sources can be compared and analyzed. When comparing both MD configurations, major differences are found in investment costs and fixed costs. While the variable costs are identical for AGMD and WGMD, CI and CF are appreciably higher in the case of AGMD. This is mainly explained by the higher membrane and module area requirements for AGMD, and the subsequent increase in the cost of module maintenance and replacement, as previously discussed. By comparing the different capacities, it can be observed that by increasing the scale factor, the variable costs acquired a more relevant role. This is particularly noteworthy in terms of MD use strategies. That is, if the purpose is to design a MD plant for industrial applications, efforts should be focused on reducing variable costs, i.e., electricity, chemical and thermal energy consumption. Nonetheless, a more practical approach to reduce investment costs and fixed costs for isolated or community use of MD should be explored.
In this regard a reduction in variable costs may be simpler, by searching more cost-effective heating sources, more efficient pumps or optimizing the chemical dose. However, a reduction in investment costs for MD may be more challenging at the present time. The reason for this is that a high proportion of all costs (up to almost 50% in some cases) are related to the MD module. Currently, research into the improvement and development of new MD membranes that increase permeate flow, with less fouling and less heat loss through conduction is underway. Similarly, new and more efficient modules (membrane area/volume ratio) are being developed, as is the case of spiral wound modules, which are very common in other processes such as RO [34]. Therefore, the reduction of fixed and investment costs in MD are closely linked with the state of the technology and not with the operational or design aspects. In other words, the implementation of MD for industrial uses could be carried out in a shorter timeframe than for isolated or community uses, as suggested by the results obtained in this work.
As mentioned above, the final cost of the water produced is strongly dependent on the capacity or scale factor for a given scenario. Therefore, to compare the costs of MD and conventional desalination technologies, this scale factor must be taken into account. For example, if MD is compared with a real industrial desalination plant (for example, large RO, MED or MSF plants with capacities above 100,000 m3 daily), MD will never be feasible. Another factor to consider for cost and feasibility analyses in MD is the absence of real large-scale examples of this technology [9,34,55]. For this reason, techno-economic assessment methods are mainly based on literature data and models from MD laboratory-scale studies [17,49], with accuracies ranging from 30 to 50 % depending on the level of detail obtained [64]. So, these results should be taken into account as an approach.
Nonetheless, in this study the results obtained were compared with other techno-economic assessments of MD (Table 1) and other conventional technologies, taking into account the aforementioned scale factor (Table 6). Thus, results of 1.17 and 1.23 € m−3 were reported by Al-Obaidani et al. for DCMD and seawater treatment [17]. Similarly, costs for AGMD and vacuum AGMD of 9–9.8 € m−3 and 4.4–4.8 € m−3 were reported by Schwantes et al. for hypersaline water treatment and capacities of 10 and 1000 m3 daily, respectively [49]. Thus, the MD costs obtained in this work are in line with previous studies, and considering the lower costs for DCMD as a result of a theoretically higher permeate flux compared to WGMD and AGMD. On the other hand, as it can be seen in Table 6, the results obtained for MD are in the cost range of other conventional desalination technologies for the scale factors studied.
3.2. Sensitivity Analysis for Heat Source Scenarios
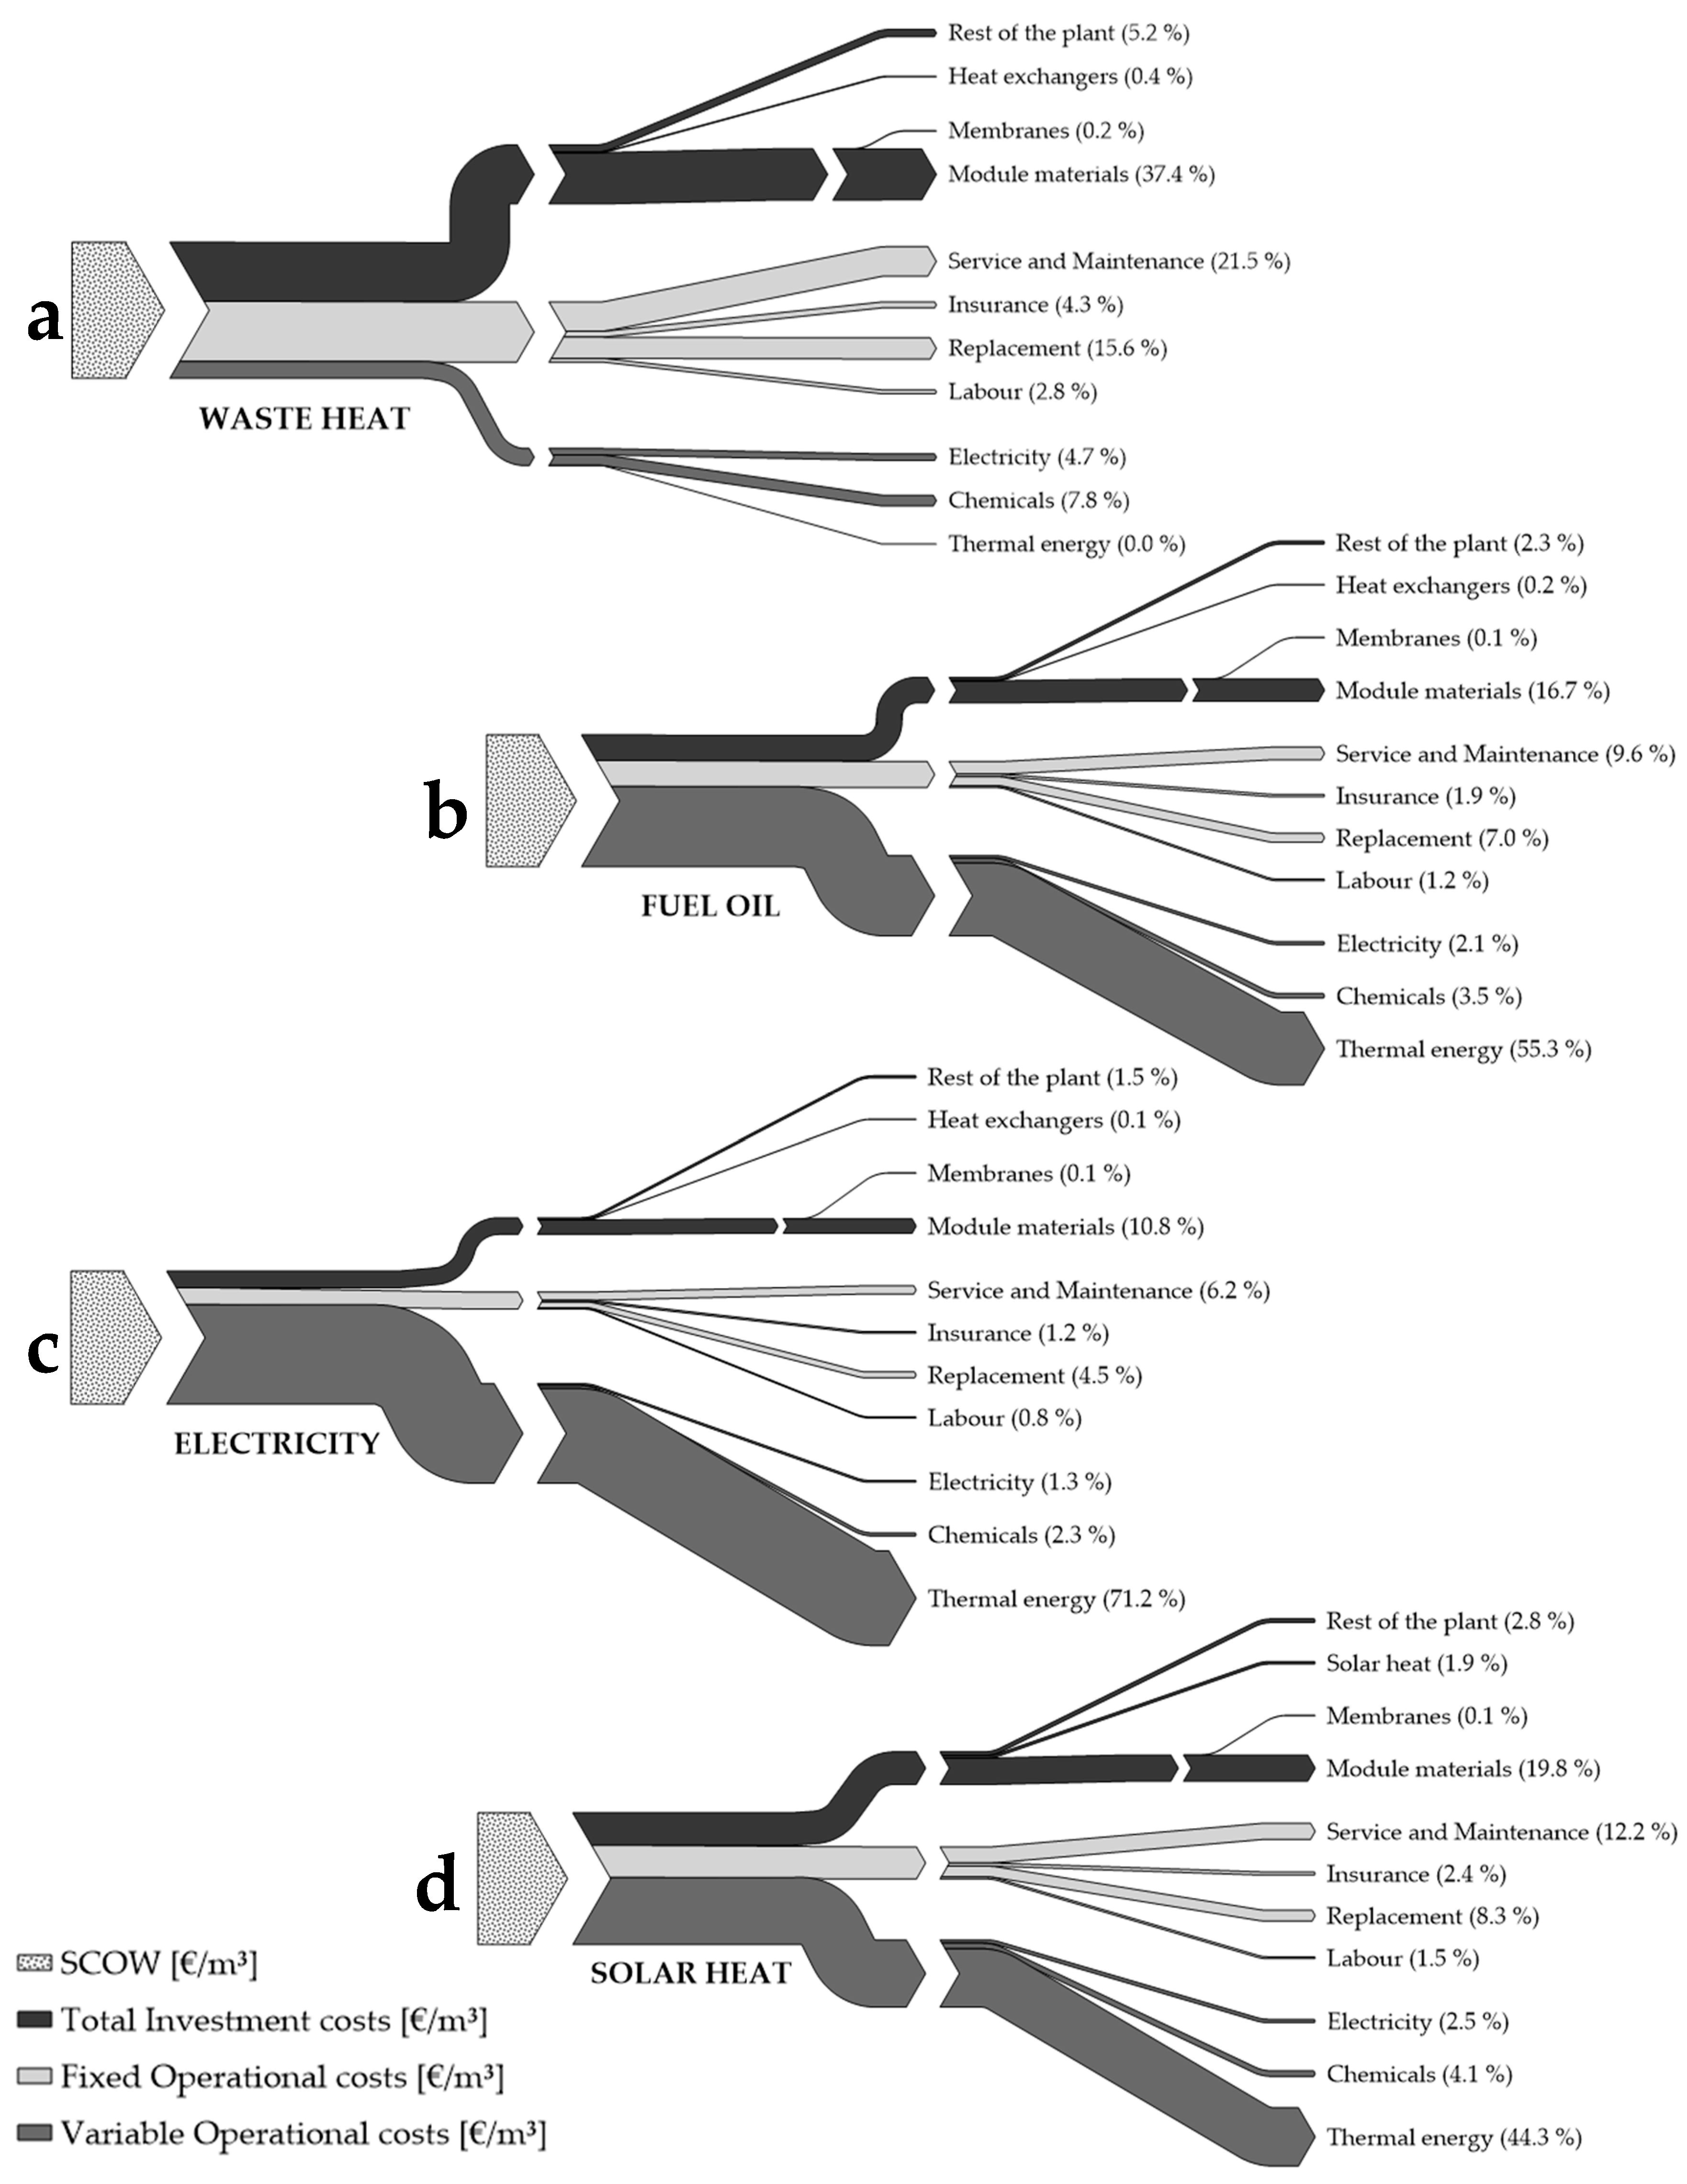
In Figure 4, a sensitivity analysis for the most favorable configuration (WGMD) and capacity (1000 m3 d−1) is shown. This analysis explores the effect of the heat sources selected, and therefore, the cost of thermal energy on the SCOW.
Thus, when a heat source is assumed to be free as is waste heat use, the highest costs belong to the MD module followed by maintenance and replacement costs. In this scenario, improvement and development of the MD technology is mandatory in order to reduce SCOW. However, these cost saving actions could be difficult to carry out in the short term, as discussed when comparing different capacities. On the contrary, considering future forecasts regarding optimization in MD manufacturing, large-scale testing and improvement of design and materials, cost-efficiency improvements and gains are expected [49]. In comparison, when other heat sources are used, the costs of thermal energy are clearly predominant over the other costs. For example, the use of electricity was responsible for up to 71.2% of total costs in this study. In the case of burning fuel oil and solar heat, the costs of thermal energy represented 55.3% and 44.3% of the costs, respectively. As a result, it is suggested that for defined conditions, the key factor in MD is the heat source used. The current search for alternative and more cost-effective heat sources gives MD an advantage over other technologies. In addition, the investigation of synergies of MD with other desalination processes and the development of new MD configurations and heat recovery systems based on the multi-stage concept should be viewed positively [34]. Furthermore, for solar energy, forecasts point towards a reduction in investment and operational thermal energy costs of up to 43% in the upcoming years [90]. This further reinforces the attractiveness and potential of this alternative heat source as well as the application of MD in locations where solar resources are available.
4. Conclusions
A techno-economic assessment of MD desalination was performed in this work. The SCOW method was applied to evaluate the total costs of water for WGMD and AGMD, with capacities of 10, 100 and 1000 m3 per day and under different heat sources, including waste heat, fuel oil burning, electricity and solar heat.
Lower water costs were obtained for WGMD (1.56–7.53 € m−3) compared to AGMD (2.38–9.60 € m−3) in all scenarios. The cost of water is reduced by a larger scale factor for MD, or in other words, it has greater production capacity. For isolated uses, fixed and investment costs were more important, while variable costs became more important for industrial uses. Thus, the most relevant individual costs in MD were those related to the cost of thermal energy, module manufacturing, and maintenance and replacement costs.
The results suggest that the most feasible heat sources for MD are waste heat and solar heat. Forecasts also point to a reduction in MD manufacturing costs and solar heat investment costs. On the other hand, the water costs of conventional desalination technologies (SWRO, MSF and MED) were compared at the same scale with the costs of MD. It was observed that the costs obtained in MD are in the same range as conventional technologies. Thus, the implementation of MD by industry should be considered in the near future.
In summary, the results derived from this research suggest that MD is a potentially feasible alternative for desalination. Specifically, in theory, the WGMD configuration using waste or solar heat shows strong potential to be implemented on a large scale by industry in the near future.
Author Contributions
Conceptualization, D.A.-V. and J.A.L.-R.; Investigation, D.A.-V. and J.A.L.-R.; Writing—original draft, D.A.-V.; Writing—review and editing, J.A.L.-R.
Funding
This research was funded by University of Cadiz supporting a predoctoral contract within the Researcher Personnel Training Program (ref. 2015-036/PU/EPIF-FPI-CT/CP).
Acknowledgments
Pedro Manuel Gomez of APRIA system and Paul Reijmers of Aquastill B.V. are acknowledged for providing data related to different real MD process costs.
Conflicts of Interest
The authors declare no conflict of interest. The funders had no role in the design of the study; in the collection, analyses, or interpretation of data; in the writing of the manuscript, or in the decision to publish the results.
References
- Mezher, T.; Fath, H.; Abbas, Z.; Khaled, A. Techno-economic assessment and environmental impacts of desalination technologies. Desalination 2011, 266, 263–273. [Google Scholar] [CrossRef]
- Mat Nawi, N.I.; Bilad, M.R.; Zolkhiflee, N.; Nordin, N.A.H.; Lau, W.J.; Narkkun, T.; Faungnawakij, K.; Arahman, N.; Mahlia, T.M.I. Development of a novel corrugated polyvinylidene difluoride membrane via improved imprinting technique for membrane distillation. Polymers 2019, 11, 865. [Google Scholar] [CrossRef] [PubMed]
- Yang, Z.; Zhou, Y.; Feng, Z.; Rui, X.; Zhang, T.; Zhang, Z. A review on reverse osmosis and nanofiltration membranes for water purification. Polymers 2019, 11, 1252. [Google Scholar] [CrossRef] [PubMed]
- Qasim, M.; Badrelzaman, M.; Darwish, N.N.; Darwish, N.A.; Hilal, N. Reverse osmosis desalination: A state-of-the-art review. Desalination 2019, 459, 59–104. [Google Scholar] [CrossRef] [Green Version]
- El-Dessouky, H.T.; Ettouney, H.M. Fundamentals of Salt Water Desalination; Elsevier: Amsterdam, The Netherlands, 2002. [Google Scholar] [CrossRef]
- Baaqeel, H.; El-Halwagi, M. Optimal multiscale capacity planning in seawater desalination systems. Processes 2018, 6, 68. [Google Scholar] [CrossRef]
- Medina, J.A. 20 years evolution of desalination costs in Spain. In Proceedings of the International Conference on Desalination Costing; 2004; pp. 293–309. Available online: http://132.68.226.240/english/pdf/IDS/85.pdf (accessed on 8 July 2019).
- Filippini, G.; Al-Obaidi, M.A.; Manenti, F.; Mujtaba, I.M. Design and economic evaluation of solar-powered hybrid multi effect and reverse osmosis system for seawater desalination. Desalination 2019, 465, 114–125. [Google Scholar] [CrossRef]
- Ruiz-Aguirre, A.; Andrés-Mañas, J.A.; Zaragoza, G. Evaluation of permeate quality in pilot scale membrane distillation systems. Membranes 2019, 9, 69. [Google Scholar] [CrossRef]
- Bennett, A. Developments in desalination and water reuse. Filtr. Sep. 2015, 52, 28–33. [Google Scholar] [CrossRef]
- Zotalis, K.; Dialynas, E.; Mamassis, N.; Angelakis, A.; Zotalis, K.; Dialynas, E.G.; Mamassis, N.; Angelakis, A.N. Desalination technologies: Hellenic experience. Water 2014, 6, 1134–1150. [Google Scholar] [CrossRef]
- Jones, E.; Qadir, M.; van Vliet, M.T.H.; Smakhtin, V.; Kang, S. The state of desalination and brine production: A global outlook. Sci. Total Environ. 2019, 657, 1343–1356. [Google Scholar] [CrossRef]
- Alkaisi, A.; Mossad, R.; Sharifian-Barforoush, A. A Review of the Water Desalination Systems Integrated with Renewable Energy. In Energy Procedia; Elsevier: Amsterdam, The Netherlands, 2017; pp. 268–274. [Google Scholar] [CrossRef]
- Kurihara, M.; Takeuchi, H.; Ito, Y. A Reliable seawater desalination system based on membrane technology and biotechnology considering reduction of the environmental impact. Environments 2018, 5, 127. [Google Scholar] [CrossRef]
- Ziolkowska, J.R. Is desalination affordable?—Regional cost and price analysis. Water Resour. Manag. 2015, 29, 1385–1397. [Google Scholar] [CrossRef]
- Drioli, E.; Tocci, E.; Macedonio, F.; Drioli, E.; Tocci, E.; Macedonio, F. Membrane science and membrane engineering: A successful story. Gen. Chem. 2019, 5, 180027. [Google Scholar] [CrossRef]
- Al-Obaidani, S.; Curcio, E.; Macedonio, F.; Di Profio, G.; Al-Hinai, H.; Drioli, E. Potential of membrane distillation in seawater desalination: Thermal efficiency, sensitivity study and cost estimation. J. Memb. Sci. 2008, 323, 85–98. [Google Scholar] [CrossRef]
- Alkhudhiri, A.; Darwish, N.; Hilal, N. Membrane distillation: A comprehensive review. Desalination 2012, 287, 2–18. [Google Scholar] [CrossRef]
- Karanasiou, A.; Kostoglou, M.; Karabelas, A. An experimental and theoretical study on separations by vacuum membrane distillation employing hollow-fiber modules. Water 2018, 10, 947. [Google Scholar] [CrossRef]
- Gryta, M. Effectiveness of water desalination by membrane distillation process. Membranes 2012, 2, 415–429. [Google Scholar] [CrossRef]
- Duong, H.C.; Duke, M.; Gray, S.; Cooper, P.; Nghiem, L.D. Membrane scaling and prevention techniques during seawater desalination by air gap membrane distillation. Desalination 2016, 397, 92–100. [Google Scholar] [CrossRef]
- Guan, G.; Yao, C.; Lu, S.; Jiang, Y.; Yu, H.; Yang, X. Sustainable operation of membrane distillation for hypersaline applications: Roles of brine salinity, membrane permeability and hydrodynamics. Desalination 2018, 445, 123–137. [Google Scholar] [CrossRef]
- Schwantes, R.; Bauer, L.; Chavan, K.; Dücker, D.; Felsmann, C.; Pfafferott, J. Air gap membrane distillation for hypersaline brine concentration: Operational analysis of a full-scale module—New strategies for wetting mitigation. Desalination 2018, 444, 13–25. [Google Scholar] [CrossRef]
- Kujawa, J.; Cerneaux, S.; Kujawski, W.; Knozowska, K. Hydrophobic ceramic membranes for water desalination. Appl. Sci. 2017, 7, 402. [Google Scholar] [CrossRef]
- Al-Furaiji, M.; Arena, J.T.; Ren, J.; Benes, N.; Nijmeijer, A.; McCutcheon, J.R. Triple-layer nanofiber membranes for treating high salinity brines using direct contact membrane distillation. Membranes 2019, 9, 60. [Google Scholar] [CrossRef] [PubMed]
- Lawson, K.W.; Lloyd, D.R. Membrane distillation. J. Memb. Sci. 1997, 124, 1–25. [Google Scholar] [CrossRef]
- Alkhudhiri, A.; Hilal, N. Air gap membrane distillation: A detailed study of high saline solution. Desalination 2017, 403, 179–186. [Google Scholar] [CrossRef] [Green Version]
- Guillen-Burrieza, E.; Ruiz-Aguirre, A.; Zaragoza, G.; Arafat, H.A. Membrane fouling and cleaning in long term plant-scale membrane distillation operations. J. Memb. Sci. 2014, 468, 360–372. [Google Scholar] [CrossRef]
- Essalhi, M.; Khayet, M. Fundamentals of membrane distillation. In Pervaporation, Vapour Permeation and Membrane Distillation; Elsevier: Amsterdam, The Netherlands, 2015; pp. 277–316. [Google Scholar] [CrossRef]
- Wang, P.; Chung, T.-S.S. Recent advances in membrane distillation processes: Membrane development, configuration design and application exploring. J. Memb. Sci. 2015, 474, 39–56. [Google Scholar] [CrossRef]
- González, D.; Amigo, J.; Suárez, F. Membrane distillation: Perspectives for sustainable and improved desalination. Renew. Sustain. Energy Rev. 2017, 80, 238–259. [Google Scholar] [CrossRef]
- Ruiz-Aguirre, A. Evaluación de Sistemas Comerciales en Espiral de Destilación por Membranas y su Aplicación al Tratamiento de Aguas. Ph.D. Thesis, Universidad de Almería, Almería, Spain, 2017. [Google Scholar]
- Macedonio, F.; Drioli, E. Membrane distillation development. In Sustainable Water and Wastewater Processing; Elsevier: Amsterdam, The Netherlands, 2019; pp. 133–159. [Google Scholar] [CrossRef]
- Alkhudhiri, A.; Hilal, N. Membrane Distillation-Principles, Applications, Configurations, Design, and Implementation; Elsevier Inc.: Amsterdam, The Netherlands, 2018. [Google Scholar] [CrossRef]
- Amaya-Vías, D.; López-Ramírez, J.A.; Gray, S.; Zhang, J.; Duke, M. Diffusion behavior of humic acid during desalination with air gap and water gap membrane distillation. Water Res. 2019, 158, 182–192. [Google Scholar] [CrossRef]
- Francis, L.; Ghaffour, N.; Alsaadi, A.A.; Amy, G.L. Material gap membrane distillation: A new design for water vapor flux enhancement. J. Memb. Sci. 2013, 448, 240–247. [Google Scholar] [CrossRef] [Green Version]
- Woldemariam, D.; Martin, A.; Santarelli, M. Exergy analysis of air-gap membrane distillation systems for water purification applications. Appl. Sci. 2017, 7, 301. [Google Scholar] [CrossRef]
- Cui, Z.; Zhang, Y.; Li, X.; Wang, X.; Wang, Z.; Zhao, S. Optimization of novel composite membranes for water and mineral recovery by vacuum membrane distillation. Desalination 2018, 440, 39–47. [Google Scholar] [CrossRef]
- Silva, T.L.S.; Morales-Torres, S.; Esteves, C.M.P.; Ribeiro, A.R.; Nunes, O.C.; Figueiredo, J.L.; Silva, A.M.T. Desalination and removal of organic micropollutants and microorganisms by membrane distillation. Desalination 2018, 437, 121–132. [Google Scholar] [CrossRef]
- Criscuoli, A.; Drioli, E. Vacuum membrane distillation for the treatment of coffee products. Sep. Purif. Technol. 2019, 209, 990–996. [Google Scholar] [CrossRef]
- Mostafa, M.G.; Zhu, B.; Cran, M.; Dow, N.; Milne, N.; Desai, D.; Duke, M. Membrane distillation of meat industry effluent with hydrophilic polyurethane coated polytetrafluoroethylene membranes. Membranes 2017, 7, 55. [Google Scholar] [CrossRef] [PubMed]
- Hausmann, A.; Sanciolo, P.; Vasiljevic, T.; Ponnampalam, E.; Quispe-Chavez, N.; Weeks, M.; Duke, M. Direct contact membrane distillation of dairy process streams. Membranes 2011, 1, 48–58. [Google Scholar] [CrossRef]
- Laqbaqbi, M.; García-Payo, M.C.; Khayet, M.; El Kharraz, J.; Chaouch, M. Application of direct contact membrane distillation for textile wastewater treatment and fouling study. Sep. Purif. Technol. 2019, 209, 815–825. [Google Scholar] [CrossRef]
- Leaper, S.; Abdel-Karim, A.; Gad-Allah, T.A.; Gorgojo, P. Air-gap membrane distillation as a one-step process for textile wastewater treatment. Chem. Eng. J. 2019, 360, 1330–1340. [Google Scholar] [CrossRef]
- Villalobos García, J.; Dow, N.; Milne, N.; Zhang, J.; Naidoo, L.; Gray, S.; Duke, M. Membrane distillation trial on textile wastewater containing surfactants using hydrophobic and hydrophilic-coated polytetrafluoroethylene (PTFE) membranes. Membranes 2018, 8, 31. [Google Scholar] [CrossRef]
- Yang, X.; Duke, M.; Zhang, J.; Li, J.-D. Modeling of heat and mass transfer in vacuum membrane distillation for ammonia separation. Sep. Purif. Technol. 2019, 224, 121–131. [Google Scholar] [CrossRef]
- Amaya-Vías, D.; Tataru, L.; Herce-Sesa, B.; López-López, J.A.; López-Ramírez, J.A. Metals removal from acid mine drainage (Tinto River, SW Spain) by water gap and air gap membrane distillation. J. Memb. Sci. 2019, 582, 20–29. [Google Scholar] [CrossRef]
- Jia, F.; Yin, Y.; Wang, J. Removal of cobalt ions from simulated radioactive wastewater by vacuum membrane distillation. Prog. Nucl. Energy 2018, 103, 20–27. [Google Scholar] [CrossRef]
- Schwantes, R.; Chavan, K.; Winter, D.; Felsmann, C.; Pfafferott, J. Techno-economic comparison of membrane distillation and MVC in a zero liquid discharge application. Desalination 2018, 428, 50–68. [Google Scholar] [CrossRef] [Green Version]
- The National Academies of Sciences Engineering and Medicine. The Power of Change: Innovation for Development and Deployment of Increasingly Clean Electric Power Technologies; National Academies Press: Washington, DC, USA, 2016. [Google Scholar] [CrossRef]
- Camacho, L.M.; Dumée, L.; Zhang, J.; Li, J.-d.; Duke, M.; Gomez, J.; Gray, S. Advances in membrane distillation for water desalination and purification applications. Water 2013, 5, 94–196. [Google Scholar] [CrossRef]
- Khayet, M. Membranes and theoretical modeling of membrane distillation: A review. Adv. Colloid Interface Sci. 2011, 164, 56–88. [Google Scholar] [CrossRef] [PubMed]
- Papapetrou, M.; Cipollina, A.; La Commare, U.; Micale, G.; Zaragoza, G.; Kosmadakis, G. Assessment of methodologies and data used to calculate desalination costs. Desalination 2017, 419, 8–19. [Google Scholar] [CrossRef]
- Pinto, F.S.; Marques, R.C. Desalination projects economic feasibility: A standardization of cost determinants. Renew. Sustain. Energy Rev. 2017, 78, 904–915. [Google Scholar] [CrossRef]
- Winter, D. Membrane Distillation—A Thermodynamic, Technological and Economic Analysis. Ph.D. Thesis, University of Kaiserslautern, Kaiserslautern, Germany, 2015. Available online: https://www.reiner-lemoine-stiftung.de/pdf/dissertationen/Dissertation-Daniel_Winter.pdf (accessed on 3 July 2019).
- Noor, I.E.; Coenen, J.; Martin, A.; Dahl, O.; Åslin, M. Experimental investigation and techno-economic analysis of tetramethylammonium hydroxide removal from wastewater in nano-electronics manufacturing via membrane distillation. J. Memb. Sci. 2019, 579, 283–293. [Google Scholar] [CrossRef]
- Zare, S.; Kargari, A. Membrane Properties in Membrane Distillation; Elsevier Inc.: Amsterdam, The Netherlands, 2018. [Google Scholar] [CrossRef]
- Yang, X.; Fane, A.G.; Wang, R. Membrane distillation: Now and future. Desalination 2014, 373–424. [Google Scholar] [CrossRef]
- Kress, N. Desalination technologies. In Marine Impacts of Seawater Desalination; Elsevier: Amsterdam, The Netherlands, 2019; pp. 11–34. [Google Scholar] [CrossRef]
- Susanto, H. Towards practical implementations of membrane distillation. Chem. Eng. Process. Process Intensif. 2011, 50, 139–150. [Google Scholar] [CrossRef]
- Kesieme, U.K.; Milne, N.; Aral, H.; Cheng, C.Y.; Duke, M. Economic analysis of desalination technologies in the context of carbon pricing, and opportunities for membrane distillation. Desalination 2013, 323, 66–74. [Google Scholar] [CrossRef] [Green Version]
- Burn, S.; Hoang, M.; Zarzo, D.; Olewniak, F.; Campos, E.; Bolto, B.; Barron, O. Desalination techniques—A review of the opportunities for desalination in agriculture. Desalination 2015, 364, 2–16. [Google Scholar] [CrossRef]
- Shahzad, M.W.; Burhan, M.; Ang, L.; Ng, K.C. Energy-water-environment nexus underpinning future desalination sustainability. Desalination 2017, 413, 52–64. [Google Scholar] [CrossRef]
- Towler, G.; Sinnott, R. Chemical Engineering Design Principles, Practice and Economics of Plant and Process Design, 2nd ed.; Elsevier Ltd.: Amsterdam, The Netherlands, 2013. [Google Scholar] [CrossRef]
- Amaya-Vías, D.; Nebot, E.; López-Ramírez, J.A. Comparative studies of different membrane distillation configurations and membranes for potential use on board cruise vessels. Desalination 2018, 429, 44–51. [Google Scholar] [CrossRef]
- Micari, M.; Moser, M.; Cipollina, A.; Fuchs, B.; Ortega-Delgado, B.; Tamburini, A.; Micale, G. Techno-economic assessment of multi-effect distillation process for the treatment and recycling of ion exchange resin spent brines. Desalination 2019, 456, 38–52. [Google Scholar] [CrossRef]
- Agashichev, S.P. Analysis of integrated co-generative schemes including MSF, RO and power generating systems (present value of expenses and “levelised” cost of water). Desalination 2004, 164, 281–302. [Google Scholar] [CrossRef]
- Kaldellis, J.K.; Kavadias, K.A.; Kondili, E. Renewable energy desalination plants for the Greek islands—Technical and economic considerations. Desalination 2004, 170, 187–203. [Google Scholar] [CrossRef]
- Moser, M.; Trieb, F.; Fichter, T.; Kern, J.; Hess, D. A flexible techno-economic model for the assessment of desalination plants driven by renewable energies. Desalin. Water Treat. 2014, 1–15. [Google Scholar] [CrossRef]
- Shahabi, M.P.; McHugh, A.; Anda, M.; Ho, G. Comparative economic and environmental assessments of centralised and decentralised seawater desalination options. Desalination 2015, 376, 25–34. [Google Scholar] [CrossRef]
- Loutatidou, S.; Arafat, H.A. Techno-economic analysis of MED and RO desalination powered by low-enthalpy geothermal energy. Desalination 2015, 365, 277–292. [Google Scholar] [CrossRef]
- Suárez, A.; Fernández, P.; Ramón Iglesias, J.; Iglesias, E.; Riera, F.A. Cost assessment of membrane processes: A practical example in the dairy wastewater reclamation by reverse osmosis. J. Memb. Sci. 2015, 493, 389–402. [Google Scholar] [CrossRef]
- Abraham, T.; Luthra, A. Socio-economic & technical assessment of photovoltaic powered membrane desalination processes for India. Desalination 2011, 268, 238–248. [Google Scholar]
- Bilton, A.M.; Wiesman, R.; Arif, A.F.M.; Zubair, S.M.; Dubowsky, S. On the feasibility of community-scale photovoltaic-powered reverse osmosis desalination systems for remote locations. Renew. Energy 2011, 36, 3246–3256. [Google Scholar] [CrossRef]
- Hossam-Eldin, A.; El-Nashar, A.M.; Ismaiel, A. Investigation into economical desalination using optimized hybrid renewable energy system. Int. J. Electr. Power Energy Syst. 2012, 43, 1393–1400. [Google Scholar] [CrossRef]
- Choi, Y.; Cho, H.; Shin, Y.; Jang, Y.; Lee, S. Economic evaluation of a hybrid desalination system combining forward and reverse osmosis. Membranes 2016, 6, 3. [Google Scholar] [CrossRef] [PubMed]
- Mokhtari, H.; Ahmadisedigh, H.; Ebrahimi, I. Comparative 4E analysis for solar desalinated water production by utilizing organic fluid and water. Desalination 2016, 377, 108–122. [Google Scholar] [CrossRef]
- Palenzuela, P.; Alarcón-Padilla, D.-C.; Zaragoza, G. Large-scale solar desalination by combination with CSP: Techno-economic analysis of different options for the Mediterranean Sea and the Arabian Gulf. Desalination 2015, 366, 130–138. [Google Scholar] [CrossRef]
- Valladares Linares, R.; Li, Z.; Yangali-Quintanilla, V.; Ghaffour, N.; Amy, G.; Leiknes, T.; Vrouwenvelder, J.S. Life cycle cost of a hybrid forward osmosis—Low pressure reverse osmosis system for seawater desalination and wastewater recovery. Water Res. 2016, 88, 225–234. [Google Scholar] [CrossRef]
- Osipi, S.R.; Secchi, A.R.; Borges, C.P. Cost assessment and retro-techno-economic analysis of desalination technologies in onshore produced water treatment. Desalination 2018, 430, 107–119. [Google Scholar] [CrossRef]
- Mabrouk, A.N.; Fath, H.E.S. Technoeconomic study of a novel integrated thermal MSF–MED desalination technology. Desalination 2015, 371, 115–125. [Google Scholar] [CrossRef]
- Leiva-Illanes, R.; Escobar, R.; Cardemil, J.M.; Alarcón-Padilla, D.-C. Comparison of the levelized cost and thermoeconomic methodologies—Cost allocation in a solar polygeneration plant to produce power, desalted water, cooling and process heat. Energy Convers. Manag. 2018, 168, 215–229. [Google Scholar] [CrossRef]
- Rahimi, B.; May, J.; Christ, A.; Regenauer-Lieb, K.; Chua, H.T. Thermo-economic analysis of two novel low grade sensible heat driven desalination processes. Desalination 2015, 365, 316–328. [Google Scholar] [CrossRef]
- Killingtveit, Å. Hydropower. Manag. Glob. Warm. 2019, 265–315. [Google Scholar]
- de Vos, R.; Sawin, J. READy: Renewable Energy Action on Deployment. Policies for Accelerated Deployment of Renewable Energy; Elsevier: Amsterdam, The Netherlands, 2013. [Google Scholar] [CrossRef]
- Rand, D.A.J.; Moseley, P.T. Electrochemical Energy Storage for Renewable Sources and Grid Balancing; Elsevier: Amsterdam, The Netherlands, 2015. [Google Scholar] [CrossRef]
- Berrada, A.; Loudiyi, K. Gravity Energy Storage; Elsevier: Amsterdam, The Netherlands, 2019. [Google Scholar] [CrossRef]
- Wittholz, M.K.; O’Neill, B.K.; Colby, C.B.; Lewis, D. Estimating the cost of desalination plants using a cost database. Desalination 2008, 229, 10–20. [Google Scholar] [CrossRef]
- Sommariva, C.; Hogg, H.; Callister, K. Forty-year design life: The next target Material selection and operating conditions in thermal desalination plants. Desalination 2001, 136, 169–176. [Google Scholar] [CrossRef]
- I. Renewable Energy Agency, Solar Heat for Industrial Processes. 2015. Available online: http://www.irena.org (accessed on 12 July 2019).
- Eurostat, Electricity Price Statistics. 2018. Available online: https://ec.europa.eu/eurostat/statisticsexplained/ (accessed on 12 July 2019).
- E.C.M. IDEA. Regulated Energy Price Report. 2019. Available online: https://www.idae.es/sites/default/files/estudios_informes_y_estadisticas/combustibles_y_carburantes_mayo_2019.pdf (accessed on 12 July 2019).
- Saffarini, R.B.; Summers, E.K.; Arafat, H.A.; Lienhard V, J.H. Technical evaluation of stand-alone solar powered membrane distillation systems. Desalination 2012, 286, 332–341. [Google Scholar] [CrossRef]
- Zaragoza, G.; Ruiz-Aguirre, A.; Guillén-Burrieza, E. Efficiency in the use of solar thermal energy of small membrane desalination systems for decentralized water production. Appl. Energy 2014, 130, 491–499. [Google Scholar] [CrossRef]
- Gopi, G.; Arthanareeswaran, G.; Ismail, A.F. Perspective of renewable desalination by using membrane distillation. Chem. Eng. Res. Des. 2019, 144, 520–537. [Google Scholar]
- Vannoni, C.; Battisti, R.; Drigo, S. Potencial for Solar Heat in Industrial Processes. 2008. Available online: http://www.aee-intec.at/0uploads/dateien561.pdf (accessed on 12 July 2019).
- Karagiannis, I.C.; Soldatos, P.G. Water desalination cost literature: Review and assessment. Desalination 2008, 223, 448–456. [Google Scholar] [CrossRef]
- Al-Karaghouli, A.; Kazmerski, L.L. Energy consumption and water production cost of conventional and renewable-energy-powered desalination processes. Renew. Sustain. Energy Rev. 2013, 24, 343–356. [Google Scholar] [CrossRef]
- Rabiee, H.; Khalilpour, K.R.; Betts, J.M.; Tapper, N. Energy-water nexus: Renewable-integrated hybridized desalination systems. In Polygeneration with Polystorage for Chemical and Energy Hubs; Academic Press: Cambridge, MA, USA, 2019; pp. 409–458. [Google Scholar] [CrossRef]
- Cipollina, A.; Micale, G.; Rizzuti, L. Seawater Desalination. Conventional and Renewable Energy Processes; Springer: Heidelberg, Germany, 2009. [Google Scholar] [CrossRef]
Figure 1.
Scheme of air gap membrane distillation (AGMD) and water gap membrane distillation (WGMD) configurations in co-current mode.
Figure 1.
Scheme of air gap membrane distillation (AGMD) and water gap membrane distillation (WGMD) configurations in co-current mode.

Figure 2.
Schematic and photography of the MD pilot system, as well as details of WGMD/AGMD module used in this work.
Figure 2.
Schematic and photography of the MD pilot system, as well as details of WGMD/AGMD module used in this work.

Figure 3.
Simplified cost of water (SCOW) for each proposed heat source, capacities and MD configurations.
Figure 3.
Simplified cost of water (SCOW) for each proposed heat source, capacities and MD configurations.

Figure 4.
Influence of heat source on the cost of water for a capacity of 1000 m3 per day and WGMD configuration. (a) Waste heat scenario; (b) Fuel oil burning scenario; (c) Electricity scenario; (d) Solar heat scenario.
Figure 4.
Influence of heat source on the cost of water for a capacity of 1000 m3 per day and WGMD configuration. (a) Waste heat scenario; (b) Fuel oil burning scenario; (c) Electricity scenario; (d) Solar heat scenario.


Table 1.
Economic evaluation studies of membrane distillation (MD) and water costs. As far as possible, factors such as feed capacity and characteristics (type of water, MD configuration, heat recovery mechanisms and energy source) have been added.
Table 1.
Economic evaluation studies of membrane distillation (MD) and water costs. As far as possible, factors such as feed capacity and characteristics (type of water, MD configuration, heat recovery mechanisms and energy source) have been added.
| Capacity a | Feedwater | Configuration | Energy factors | Costs b | References |
|---|---|---|---|---|---|
| 20 | Seawater | AGMD | Solar powered | 16.42 | [34,60] |
| 24,000 | Seawater | DCMD | Heat recovery | 1.07 | [34] |
| 24,000 | Seawater | DCMD | No heat recovery | 1.12 | [34] |
| 30,000 | Seawater | n.a | n.a | 0.56–1.57 | [57,61] |
| n.a | Seawater | DCMD | Solar powered | 13.68–16.42 | [62] |
| n.a | Seawater | DCMD | Geothermal | 11.86 | [62] |
| n.a | Seawater | DCMD | Waste heat | 1–1.37 | [62] |
| n.a | Seawater | AGMD | Solar powered | 16.70 | [62] |
| n.a | Seawater | AGMD | Waste heat | 4.84 | [62] |
| n.a | Seawater | VMD | Solar powered | 14.6 | [62] |
| n.a | Seawater | VMD | Waste heat | 1.82 | [62] |
| 10 | Wastewater | AGMD | Waste heat | 8.21–8.94 | [49] |
| 1000 | Wastewater | AGMD | Waste heat | 4.01–4.38 | [49] |
| 30,000 | n.a | n.a | n.a | 2.01 | [34] |
| 30,000 | n.a | n.a | Waste heat | 0.6 | [34,57] |
| 24,000 | n.a | DCMD | Heat recovery | 1.07 | [34] |
| n.a | n.a | DCMD | Waste heat | 0.58 | [34] |
| 0.1 | Brackish water | AGMD | Solar powered | 13.68 | [34,60] |
| n.a | n.a | DCMD | Solar powered/Heat recovery | 11.59 | [34] |
| n.a | n.a | AGMD | Solar powered/Heat recovery | 17 | [34] |
| n.a | n.a | VMD | Solar powered/Heat recovery | 14.6 | [34] |
| 0.017 | n.a | n.a | Geothermal | 11.86 | [34,62] |
| n.a | n.a | DCMD | No heat recovery | 1.12 | [34] |
| 24,000 | n.a | n.a | n.a | 1.07–1.82 | [63] |
| n.a | n.a | n.a | n.a | 0.24–118 | [17,34,58,59] |
Note: a (m3/day); b (€/m3); n.a: not available.
Table 2.
MD laboratory system design and main operating conditions for seawater desalination [65].
Table 2.
MD laboratory system design and main operating conditions for seawater desalination [65].
| Membrane type | Flat hydrophobic PTFE membranes with 0.45 µm pore size. |
| MD module | Flat MD module with an effective area of 0.025 m2. |
| MD plant capacity | Raw water maximum capacity treatment of 0.6 m3 per hour. |
| MD configurations | WGMD and AGMD. |
| Permeate fluxes | 13.08 L h−1 m−2 and 6.73 L h−1 m−2 for WGMD and AGMD, respectively. |
| Feed water characteristics | Seawater from Bay of Cadiz (Spain) without any pretreatment. Conductivity of 47,000 µS cm−1 and pH 8.10 |
| Operating temperatures | 70 °C for feed inlet temperature and 18°C for cooling water cycle. |
Table 3.
Thermal energy prices according to the proposed heat source.
| MD Heat Source Scenario | Price of Thermal Energy (€ kWh−1) |
|---|---|
| 1. Waste heat | 0 * |
| 2. Fuel oil burning | 0.052 [92] |
| 3. Electricity grid | 0.103 [91] |
| 4. Solar Heat | 0.035 [90] |
* A free waste heat source is assumed.
Table 4.
Influence of the different WGMD costs on the SCOW. Costs are expressed in € m−3 and % for each capacity and scenario considered.
Table 4.
Influence of the different WGMD costs on the SCOW. Costs are expressed in € m−3 and % for each capacity and scenario considered.
| WGMD | 1. WASTE HEAT | 2. FUEL OIL BURNING | 3. ELECTRICITY GRID | 4. SOLAR HEAT | ||||||||||||||||||||
|---|---|---|---|---|---|---|---|---|---|---|---|---|---|---|---|---|---|---|---|---|---|---|---|---|
| Capacity (m3 d−1) | Capacity (m3 d−1) | Capacity (m3 d−1) | Capacity (m3 d−1) | |||||||||||||||||||||
| 10 | 100 | 1000 | 10 | 100 | 1000 | 10 | 100 | 1000 | 10 | 100 | 1000 | |||||||||||||
| € m−3 | % | € m−3 | % | € m−3 | % | € m−3 | % | € m−3 | % | € m−3 | % | € m−3 | % | € m−3 | % | € m−3 | % | € m−3 | % | € m−3 | % | € m−3 | % | |
| CF | 1.67 | 45.2 | 1.07 | 45.5 | 0.69 | 44.2 | 1.67 | 29.7 | 1.07 | 25.0 | 0.69 | 19.8 | 1.67 | 22.1 | 1.07 | 17.2 | 0.69 | 12.8 | 1.74 | 33.6 | 1.11 | 29.5 | 0.72 | 24.4 |
| CSM | 0.84 | 22.9 | 0.53 | 22.7 | 0.34 | 21.5 | 0.84 | 15.0 | 0.53 | 12.4 | 0.34 | 9.6 | 0.84 | 11.2 | 0.53 | 8.6 | 0.34 | 6.2 | 0.90 | 17.5 | 0.57 | 15.1 | 0.36 | 12.2 |
| CI | 0.17 | 4.6 | 0.11 | 4.5 | 0.07 | 4.3 | 0.17 | 3.0 | 0.11 | 2.5 | 0.07 | 1.9 | 0.17 | 2.2 | 0.11 | 1.7 | 0.07 | 1.2 | 0.18 | 3.5 | 0.11 | 3.0 | 0.07 | 2.4 |
| CRM | 0.61 | 16.6 | 0.39 | 16.5 | 0.24 | 15.6 | 0.61 | 10.9 | 0.39 | 9.0 | 0.24 | 7.0 | 0.61 | 8.1 | 0.39 | 6.2 | 0.24 | 4.5 | 0.61 | 11.8 | 0.39 | 10.2 | 0.24 | 8.3 |
| CL | 0.04 | 1.2 | 0.04 | 1.8 | 0.04 | 2.8 | 0.04 | 0.8 | 0.04 | 1.0 | 0.04 | 1.2 | 0.04 | 0.6 | 0.04 | 0.7 | 0.04 | 0.8 | 0.04 | 0.8 | 0.04 | 1.1 | 0.04 | 1.5 |
| CV | 0.32 | 8.7 | 0.21 | 8.9 | 0.19 | 12.5 | 2.25 | 40.0 | 2.13 | 50.0 | 2.12 | 60.9 | 4.16 | 55.3 | 4.05 | 65.5 | 4.04 | 74.8 | 1.62 | 31.3 | 1.51 | 40.1 | 1.50 | 51.0 |
| CCH | 0.12 | 3.3 | 0.12 | 5.2 | 0.12 | 7.8 | 0.12 | 2.2 | 0.12 | 2.9 | 0.12 | 3.5 | 0.12 | 1.6 | 0.12 | 2.0 | 0.12 | 2.3 | 0.12 | 2.4 | 0.12 | 3.2 | 0.12 | 4.1 |
| CThermal | 0.00 | 0.0 | 0.00 | 0.0 | 0.00 | 0.0 | 1.92 | 34.3 | 1.92 | 45.1 | 1.92 | 55.3 | 3.84 | 51.1 | 3.84 | 62.1 | 3.84 | 71.2 | 1.30 | 25.1 | 1.30 | 34.6 | 1.30 | 44.3 |
| CEL | 0.20 | 5.4 | 0.09 | 3.7 | 0.07 | 4.7 | 0.20 | 3.5 | 0.09 | 2.0 | 0.07 | 2.1 | 0.20 | 2.6 | 0.09 | 1.4 | 0.07 | 1.3 | 0.20 | 3.8 | 0.09 | 2.3 | 0.07 | 2.5 |
| aI | 1.70 | 46.1 | 1.07 | 45.6 | 0.67 | 43.3 | 1.70 | 30.2 | 1.07 | 25.0 | 0.67 | 19.4 | 1.70 | 22.5 | 1.07 | 17.3 | 0.67 | 12.5 | 1.82 | 35.1 | 1.14 | 30.4 | 0.72 | 24.6 |
| CrMD | 0.21 | 5.6 | 0.13 | 5.4 | 0.08 | 5.2 | 0.21 | 3.7 | 0.13 | 3.0 | 0.08 | 2.3 | 0.21 | 2.7 | 0.13 | 2.1 | 0.08 | 1.5 | 0.21 | 4.0 | 0.13 | 3.4 | 0.08 | 2.8 |
| CHX | 0.02 | 0.5 | 0.01 | 0.5 | 0.01 | 0.4 | 0.02 | 0.3 | 0.01 | 0.3 | 0.01 | 0.2 | 0.02 | 0.2 | 0.01 | 0.2 | 0.01 | 0.1 | 0.14 | 2.7 | 0.09 | 2.3 | 0.06 | 1.9 |
| Cmemb | 0.01 | 0.2 | 0.01 | 0.2 | 0.00 | 0.2 | 0.01 | 0.2 | 0.01 | 0.1 | 0.00 | 0.1 | 0.01 | 0.1 | 0.01 | 0.1 | 0.00 | 0.1 | 0.01 | 0.2 | 0.01 | 0.1 | 0.00 | 0.1 |
| CmatMD | 1.46 | 39.7 | 0.92 | 39.5 | 0.58 | 37.4 | 1.46 | 26.1 | 0.92 | 21.7 | 0.58 | 16.7 | 1.46 | 19.5 | 0.92 | 14.9 | 0.58 | 10.8 | 1.46 | 28.2 | 0.92 | 24.5 | 0.58 | 19.8 |
| TOTAL | 3.68 | 100 | 2.34 | 100 | 1.56 | 100 | 5.61 | 100 | 4.27 | 100 | 3.48 | 100 | 7.53 | 100 | 6.18 | 100 | 5.40 | 100 | 5.18 | 100 | 3.77 | 100 | 2.94 | 100 |
Table 5.
Influence of the different AGMD costs on the SCOW. Costs are expressed in € m−3 and % for each capacity and scenario considered.
Table 5.
Influence of the different AGMD costs on the SCOW. Costs are expressed in € m−3 and % for each capacity and scenario considered.
| AGMD | 1. WASTE HEAT | 2. FUEL OIL BURNING | 3. ELECTRICITY GRID | 4. SOLAR HEAT | ||||||||||||||||||||
|---|---|---|---|---|---|---|---|---|---|---|---|---|---|---|---|---|---|---|---|---|---|---|---|---|
| Capacity (m3 d−1) | Capacity (m3 d−1) | Capacity (m3 d−1) | Capacity (m3 d−1) | |||||||||||||||||||||
| 10 | 100 | 1000 | 10 | 100 | 1000 | 10 | 100 | 1000 | 10 | 100 | 1000 | |||||||||||||
| € m−3 | % | € m−3 | % | € m−3 | % | € m−3 | % | € m−3 | % | € m−3 | % | € m−3 | % | € m−3 | % | € m−3 | % | € m−3 | % | € m−3 | % | € m−3 | % | |
| CF | 2.71 | 47.1 | 1.72 | 47.2 | 1.10 | 46.3 | 2.71 | 35.3 | 1.72 | 30.9 | 1.10 | 25.6 | 2.71 | 28.2 | 1.72 | 23.0 | 1.10 | 17.7 | 2.78 | 38.4 | 1.77 | 34.9 | 1.13 | 30.1 |
| CSM | 1.36 | 23.6 | 0.86 | 23.4 | 0.54 | 22.6 | 1.36 | 17.7 | 0.86 | 15.3 | 0.54 | 12.5 | 1.36 | 14.1 | 0.86 | 11.4 | 0.54 | 8.7 | 1.42 | 19.5 | 0.89 | 17.6 | 0.56 | 15.0 |
| CI | 0.27 | 4.7 | 0.17 | 4.7 | 0.11 | 4.5 | 0.27 | 3.5 | 0.17 | 3.1 | 0.11 | 2.5 | 0.27 | 2.8 | 0.17 | 2.3 | 0.11 | 1.7 | 0.28 | 3.9 | 0.18 | 3.5 | 0.11 | 3.0 |
| CRM | 1.04 | 18.0 | 0.66 | 17.9 | 0.41 | 17.3 | 1.04 | 13.5 | 0.66 | 11.8 | 0.41 | 9.6 | 1.04 | 10.8 | 0.66 | 8.7 | 0.41 | 6.6 | 1.04 | 14.3 | 0.66 | 12.9 | 0.41 | 11.0 |
| CL | 0.04 | 0.8 | 0.04 | 1.2 | 0.04 | 1.8 | 0.04 | 0.6 | 0.04 | 0.8 | 0.04 | 1.0 | 0.04 | 0.5 | 0.04 | 0.6 | 0.04 | 0.7 | 0.04 | 0.6 | 0.04 | 0.9 | 0.04 | 1.1 |
| CV | 0.32 | 5.6 | 0.21 | 5.7 | 0.19 | 8.2 | 2.25 | 29.2 | 2.13 | 38.2 | 2.12 | 49.2 | 4.16 | 43.3 | 4.05 | 54.0 | 4.04 | 64.8 | 1.62 | 22.4 | 1.51 | 29.8 | 1.50 | 39.8 |
| CCH | 0.12 | 2.1 | 0.12 | 3.3 | 0.12 | 5.1 | 0.12 | 1.6 | 0.12 | 2.2 | 0.12 | 2.8 | 0.12 | 1.3 | 0.12 | 1.6 | 0.12 | 2.0 | 0.12 | 1.7 | 0.12 | 2.4 | 0.12 | 3.2 |
| CThermal | 0.00 | 0.0 | 0.00 | 0.0 | 0.00 | 0.0 | 1.92 | 25.0 | 1.92 | 34.5 | 1.92 | 44.7 | 3.84 | 40.0 | 3.84 | 51.3 | 3.84 | 61.7 | 1.30 | 17.9 | 1.30 | 25.7 | 1.30 | 34.6 |
| CEL | 0.20 | 3.4 | 0.09 | 2.4 | 0.07 | 3.1 | 0.20 | 2.6 | 0.09 | 1.5 | 0.07 | 1.7 | 0.20 | 2.1 | 0.09 | 1.1 | 0.07 | 1.2 | 0.20 | 2.7 | 0.09 | 1.7 | 0.07 | 1.9 |
| aI | 2.73 | 47.4 | 1.72 | 47.1 | 1.09 | 45.5 | 2.73 | 35.5 | 1.72 | 30.8 | 1.09 | 25.2 | 2.73 | 28.4 | 1.72 | 22.9 | 1.09 | 17.4 | 2.85 | 39.3 | 1.80 | 35.4 | 1.13 | 30.1 |
| CrMD | 0.21 | 3.6 | 0.13 | 3.5 | 0.08 | 3.4 | 0.21 | 2.7 | 0.13 | 2.3 | 0.08 | 1.9 | 0.21 | 2.2 | 0.13 | 1.7 | 0.08 | 1.3 | 0.21 | 2.8 | 0.13 | 2.5 | 0.08 | 2.2 |
| CHX | 0.02 | 0.3 | 0.01 | 0.3 | 0.01 | 0.3 | 0.02 | 0.2 | 0.01 | 0.2 | 0.01 | 0.2 | 0.02 | 0.2 | 0.01 | 0.1 | 0.01 | 0.1 | 0.14 | 1.9 | 0.09 | 1.7 | 0.06 | 1.5 |
| Cmemb | 0.01 | 0.3 | 0.01 | 0.3 | 0.01 | 0.2 | 0.01 | 0.2 | 0.01 | 0.2 | 0.01 | 0.1 | 0.01 | 0.2 | 0.01 | 0.1 | 0.01 | 0.1 | 0.01 | 0.2 | 0.01 | 0.2 | 0.01 | 0.2 |
| CmatMD | 2.49 | 43.2 | 1.57 | 43.0 | 0.99 | 41.6 | 2.49 | 32.4 | 1.57 | 28.2 | 0.99 | 23.0 | 2.49 | 25.9 | 1.57 | 21.0 | 0.99 | 15.9 | 2.49 | 34.3 | 1.57 | 30.9 | 0.99 | 26.3 |
| TOTAL | 5.76 | 100 | 3.65 | 100 | 2.38 | 100 | 7.69 | 100 | 5.58 | 100 | 4.31 | 100 | 9.60 | 100 | 7.49 | 100 | 6.23 | 100 | 7.26 | 100 | 5.08 | 100 | 3.77 | 100 |
Table 6.
Costs of water for different desalination technologies according to treatment capacity and feedwater.
Table 6.
Costs of water for different desalination technologies according to treatment capacity and feedwater.
| Desalination Technology | Feedwater | Capacity (m3 d−1) | Costs (€ m−3) | References |
|---|---|---|---|---|
| RO | Seawater | <100 | 1.20–15 | [11,97] |
| Seawater | 250–1000 | 1.00–3.14 | [11,97] | |
| Seawater | 1000–4800 | 0.56–1.32 | [11,97,98,99] | |
| Seawater | 128,000 | 0.24–0.49 | [63] | |
| Brackish water | <20 | 4.50–10.32 | [11,97,98,99] | |
| Brackish water | 20–1200 | 0.62–1.06 | [11,97,98,99] | |
| Brackish water | 40,000–46,000 | 0.21–0.43 | [11,97,98,99] | |
| - | 1000 | 1.64 | [100] | |
| MED | Seawater | <100 | 2.00–8.00 | [11,97,98,99] |
| Seawater | 12,000–55,000 | 0.76–1.20 | [11,97,98,99,100] | |
| - | 1000 | 1.26–1.32 | [100] | |
| Seawater | 91,000–320,000 | 0.38–0.74 | [11,97,98,99] | |
| MSF | SW | 23,000–528,000 | 0.42–1.40 | [11,97,98,99,100] |
| - | 1000 | 1.09–1.22 | [100] | |
| - | 50,000–70,000 | 0.51–1.60 | [59,63] |
© 2019 by the authors. Licensee MDPI, Basel, Switzerland. This article is an open access article distributed under the terms and conditions of the Creative Commons Attribution (CC BY) license (http://creativecommons.org/licenses/by/4.0/).
Share and Cite
MDPI and ACS Style
Amaya-Vías, D.; López-Ramírez, J.A. Techno-Economic Assessment of Air and Water Gap Membrane Distillation for Seawater Desalination under Different Heat Source Scenarios. Water 2019, 11, 2117. https://doi.org/10.3390/w11102117
AMA Style
Amaya-Vías D, López-Ramírez JA. Techno-Economic Assessment of Air and Water Gap Membrane Distillation for Seawater Desalination under Different Heat Source Scenarios. Water. 2019; 11(10):2117. https://doi.org/10.3390/w11102117
Chicago/Turabian StyleAmaya-Vías, David, and Juan Antonio López-Ramírez. 2019. "Techno-Economic Assessment of Air and Water Gap Membrane Distillation for Seawater Desalination under Different Heat Source Scenarios" Water 11, no. 10: 2117. https://doi.org/10.3390/w11102117
Note that from the first issue of 2016, this journal uses article numbers instead of page numbers. See further details here.