Article

Long-Term Study of Soluble Reactive Phosphorus Concentration in Fall Creek and Comparison to Northeastern Tributaries of Cayuga Lake, NY: Implications for Watershed Monitoring and Management

by
Niamh O’Leary
1,*,
Roxanna Johnston
2,
Erica L. Gardner
3,
Stephen M. Penningroth
4 and
David R. Bouldin
5
1
Environmental Science, Wells College, Aurora, NY 13026, USA
2
City of Ithaca Water Treatment Plant, Ithaca, NY 14850, USA
3
Dual Degree Program in Engineering Sustainable Systems, University of Michigan, Ann Arbor, MI 48109, USA
4
Community Science Institute, Ithaca, NY 14850, USA
5
Soil and Crop Sciences, Cornell University, Ithaca, NY 14850, USA
*
Author to whom correspondence should be addressed.
Water 2019, 11(10), 2075; https://doi.org/10.3390/w11102075
Submission received: 5 August 2019 / Revised: 18 September 2019 / Accepted: 23 September 2019 / Published: 4 October 2019
(This article belongs to the Section Water Quality and Contamination)

Abstract

:
This study focuses on soluble reactive phosphorus (SRP), a key driver of eutrophication worldwide and a potential contributor to the emerging global environmental problem of harmful algal blooms (HABs). Two studies of tributary SRP concentrations were undertaken in sub-watersheds of Cayuga Lake, NY, the subject of a total maximum daily load (TMDL) development process, due to phosphorus impairment of its southern shelf. The long-term study compared SRP concentration in Fall Creek in the 1970s with that in the first decade of the 2000s, thus spanning a period of change in phosphorus sources, as well as in regional climate. The spatial study used data collected between 2009 and 2018 and compared SRP concentrations in Fall Creek to levels in northeastern tributaries that flow into the lake close to areas where HABs have been problematic. SRP was measured using standard procedures. Flow-weighted mean SRP concentration ranged between 15.0 µg/L and 30.0 µg/L in all years studied in both the 1970s and 2000s, with the exception of 2010. Annual discharge in Fall Creek showed no trend between 1970 and 2018, but a higher proportion of high streamflow samples was captured in the 2000s compared to the 1970s, which resulted in proportionally increased SRP concentration in the latter time period. There was no significant difference in the SRP concentration—flow rate relationship between the two time periods. Adjusted for flow rate, SRP concentrations in Fall Creek have not changed over many decades. Increasing phosphorus contributions from growing population and urbanization since the 1970s may have been counterbalanced by improvements in wastewater treatment and agricultural practices. Mean SRP concentration in northeastern tributaries was significantly (p < 0.001) higher than in Fall Creek, likely reflecting more intense agricultural use and higher septic system density in the watersheds of the former. This finding justifies continued monitoring of minor northern tributaries. Future monitoring must emphasize the capture of high flow conditions. Historical stability and highly variable hydrology will slow the watershed response to management and confound the ability to detect changes attributable to decreased phosphorus inputs. Large scale monitoring on decadal timescales will be necessary to facilitate watershed management.

1. Introduction

Worldwide focus on the widespread problem of eutrophication has led to examination of the movement of nutrients from terrestrial to aquatic systems. Various forms of phosphorus play a role in limiting algal growth in water bodies around the world, including in Asia, Africa, Europe, and North and South America [1,2,3,4,5,6,7,8,9,10,11]. Recent global concern about the increased frequency of harmful algal blooms (HABs) has brought more urgency to the study of the relationship between sources of bioavailable forms of phosphorus and their effects on aquatic systems [3,7,12,13]. Soluble reactive phosphorus (SRP) is a fully bioavailable form of phosphorus, and study of its potential sources and pathways through watersheds is receiving global attention [5,7,8,9,10,11]. In efforts to assess its prevalence SRP monitoring has been conducted in South America [9], Africa [10], Asia [11] North America [4,5,6,7], and Europe [2,3]; these efforts are vital as the basis for sound decision-making about watershed management strategies. Long-term analyses enhance the study of SRP in inherently complex systems that can be highly variable over time and space [5,14,15,16,17].
A long-term study was undertaken to determine if there has been any change over a four decade period in SRP concentration in Fall Creek, which drains the largest sub-watershed of the Cayuga Lake watershed in the Finger Lakes region of New York State. Fall Creek flows into the southern end of Cayuga Lake and exerts a large influence on it, ranking as one of its most significant contributors of water inflow [18], and phosphorus load [19]. Cayuga Lake is the subject of a total maximum daily load (TMDL) development process resulting from phosphorus impairment to its southern shelf [20]. Movement of phosphorus in the watershed is runoff-driven, and approximately 95% percent of the bioavailable phosphorus load entering Cayuga Lake is nonpoint in origin [21]. High discharge periods produce most of the bioavailable phosphorus loading in the Fall Creek and Cayuga watersheds [22,23,24]. Source apportionment indicates that 50%, 10%, and 21% of Fall Creek’s total phosphorus load originates in agricultural land, urban areas, and groundwater, respectively [19].
Water quality sampling for the long-term study took place in two time periods: The 1970s and the first decade of the 2000s. Thus the study includes two divergent time periods between which significant changes have occurred in the Fall Creek and Cayuga Lake watersheds. Dairy farming and associated crop production for feed has remained the dominant agricultural enterprise throughout the decades, but both dairy management practices and agricultural regulation have changed significantly over time [25,26]. Concentrated animal feeding operations in the area were first regulated in the 1970s pursuant to the Clean Water Act of 1972 [26]. Changes in point sources in the Fall Creek watershed in the form of additional and upgraded wastewater treatment have also been implemented since the 1970s [22,27]. It is estimated that only 6–9% of Fall Creek’s total phosphorus load originates in point sources [19,23]. A phosphate detergent ban aimed at curbing eutrophication came into effect in New York State in 1973 [28]. One of the notable climatic shifts in New York State since the 1970s has been an increased frequency of heavy rain events [29]. Between 1979 and 2014 the northeast U.S. region experienced a 19% per decade increase in extreme precipitation events [30], and the frequency of both extreme precipitation events and extreme streamflow events has increased in the 2000s compared to the 1970s [31]. Our study aims to determine the extent to which the cumulative impact of these and any other changes is reflected in stream SRP concentration and to interpret our findings in the context of changes in the watershed.
Historic monitoring has examined a diversity of Cayuga Lake’s tributaries [32], but has largely focused on bigger tributaries that drain into the southern portion of the lake [21,22,23,24,25]. The motivation for major studies has included large scale undertakings, such as the Cornell lake source cooling project [33], and the ongoing TMDL development process that began in 2013 [20]. In recent years additional studies have been motivated by the appearance of cyanobacterial HABs, which were first confirmed in Cayuga Lake in 2014 [34]. The occurrence of HABs may be related to phosphorus inputs [14,35]. In 2018 a systematic shoreline monitoring program determined that toxic HAB outbreaks were more prevalent in the northern half of the Cayuga Lake watershed [36]. More informal study in 2017 documented eastern shorelines as most affected [34]. These observations provide the rationale for the examination of SRP in previously unexamined tributaries in the northeastern region of the Cayuga Lake watershed to determine their potential to act as SRP sources and to compare them with the better-studied southern tributary of Fall Creek.
Our work is comprised of a long-term study of Fall Creek that compares its SRP concentrations in the 1970s and in the 2000s, and a spatial study that compares SRP concentration in Fall Creek to that in northeastern tributaries of the watershed, 2009–2018. We use our findings to develop recommendations for effective future monitoring and management of the Fall Creek and Cayuga Lake watersheds.

2. Materials and Methods

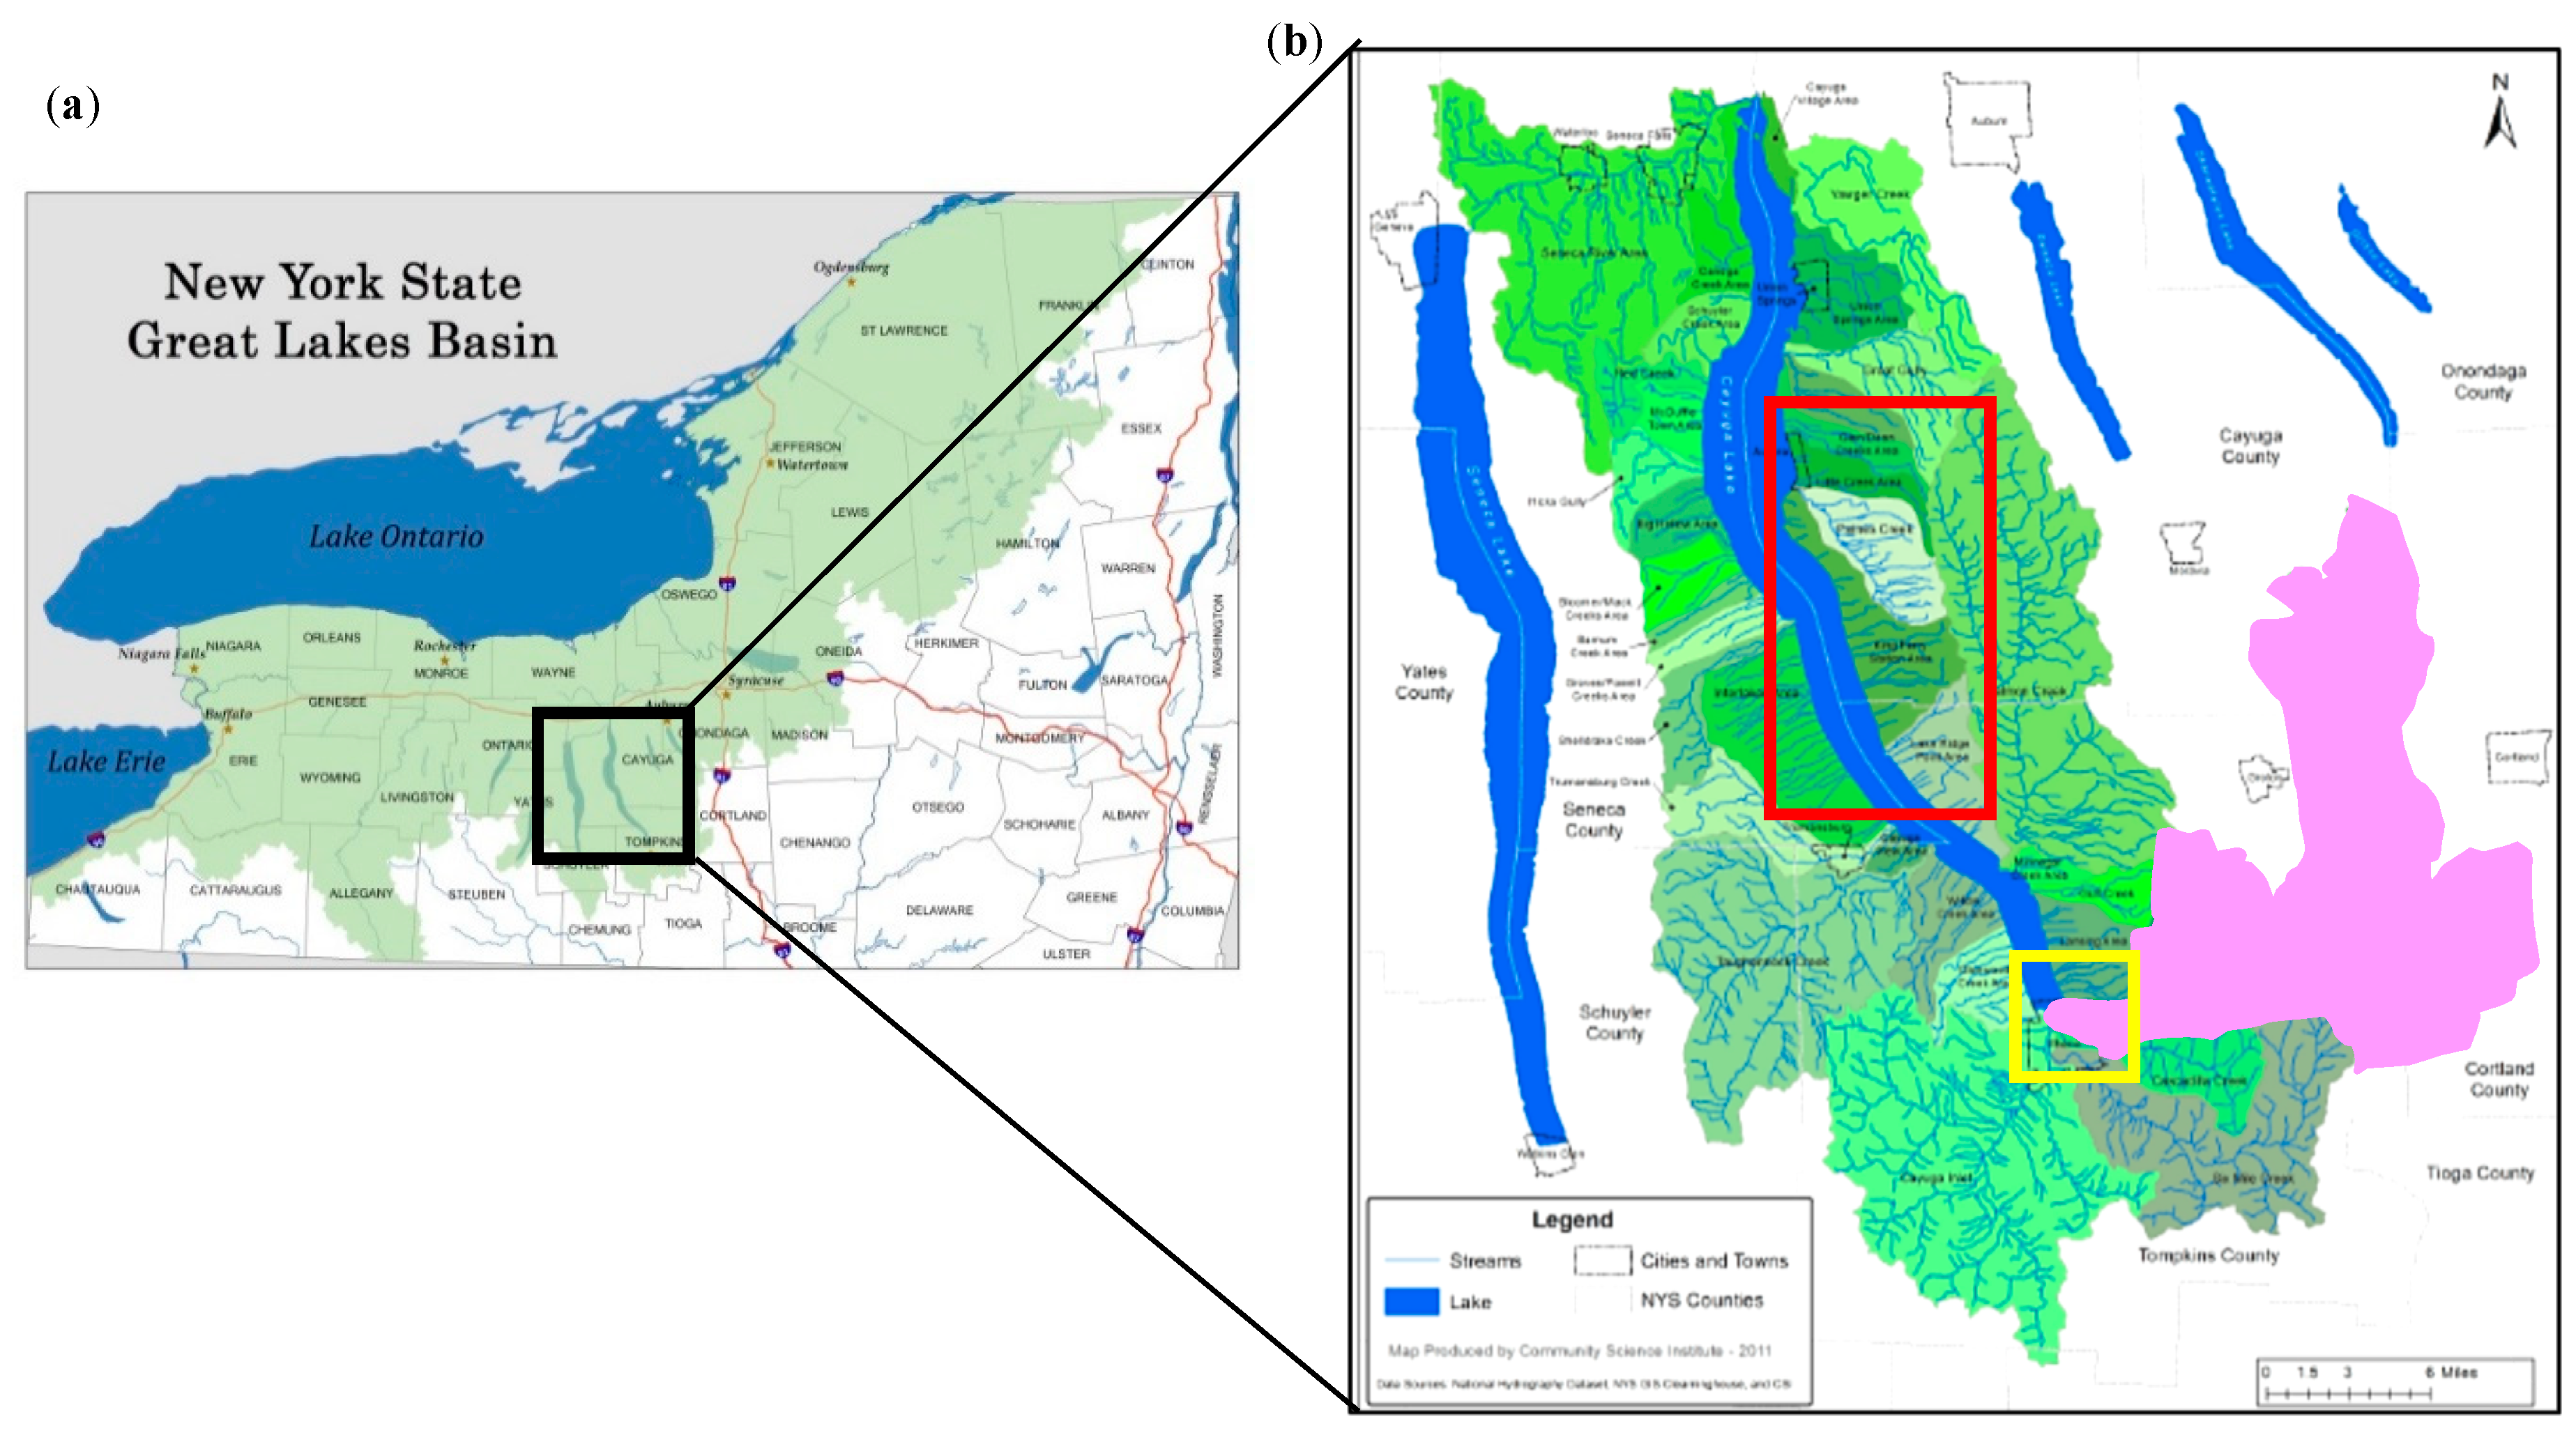
2.1. Geographic Setting and Watershed Characteristics

The Cayuga Lake watershed is part of the Seneca-Oneida-Oswego River drainage in New York State, in the northeastern region of the United States (Figure 1a). The center of Cayuga Lake is located at a latitude of 42.692° N and longitude of 76.689° W [18]. Elevations in the Cayuga watershed range between approximately 120 and 600 m above sea level. Bedrock geology is predominantly shale, siltstone, and sandstone, and surficial geology is comprised of glacial till [18].
The Fall Creek watershed is 33,086 hectares in size and is the largest sub-watershed of the 187,066 hectare Cayuga Lake watershed [19] (Figure 1b). Northeastern tributaries sampled in the spatial study are comprised of Paines, Dean’s, Lake Ridge, Mill, and Town Line Creeks, some of which have very small watersheds that are not well-characterized (Figure 1b and Figure 2b). Other authors document the sizes of the Paines and Dean’s Creek (in combination with Glen Creek) watersheds as 3945 ha and 1902 ha, respectively, and include Lake Ridge, Mill, and Town Line Creeks all under the name Lake Ridge, documented as 3409 ha in size [19].

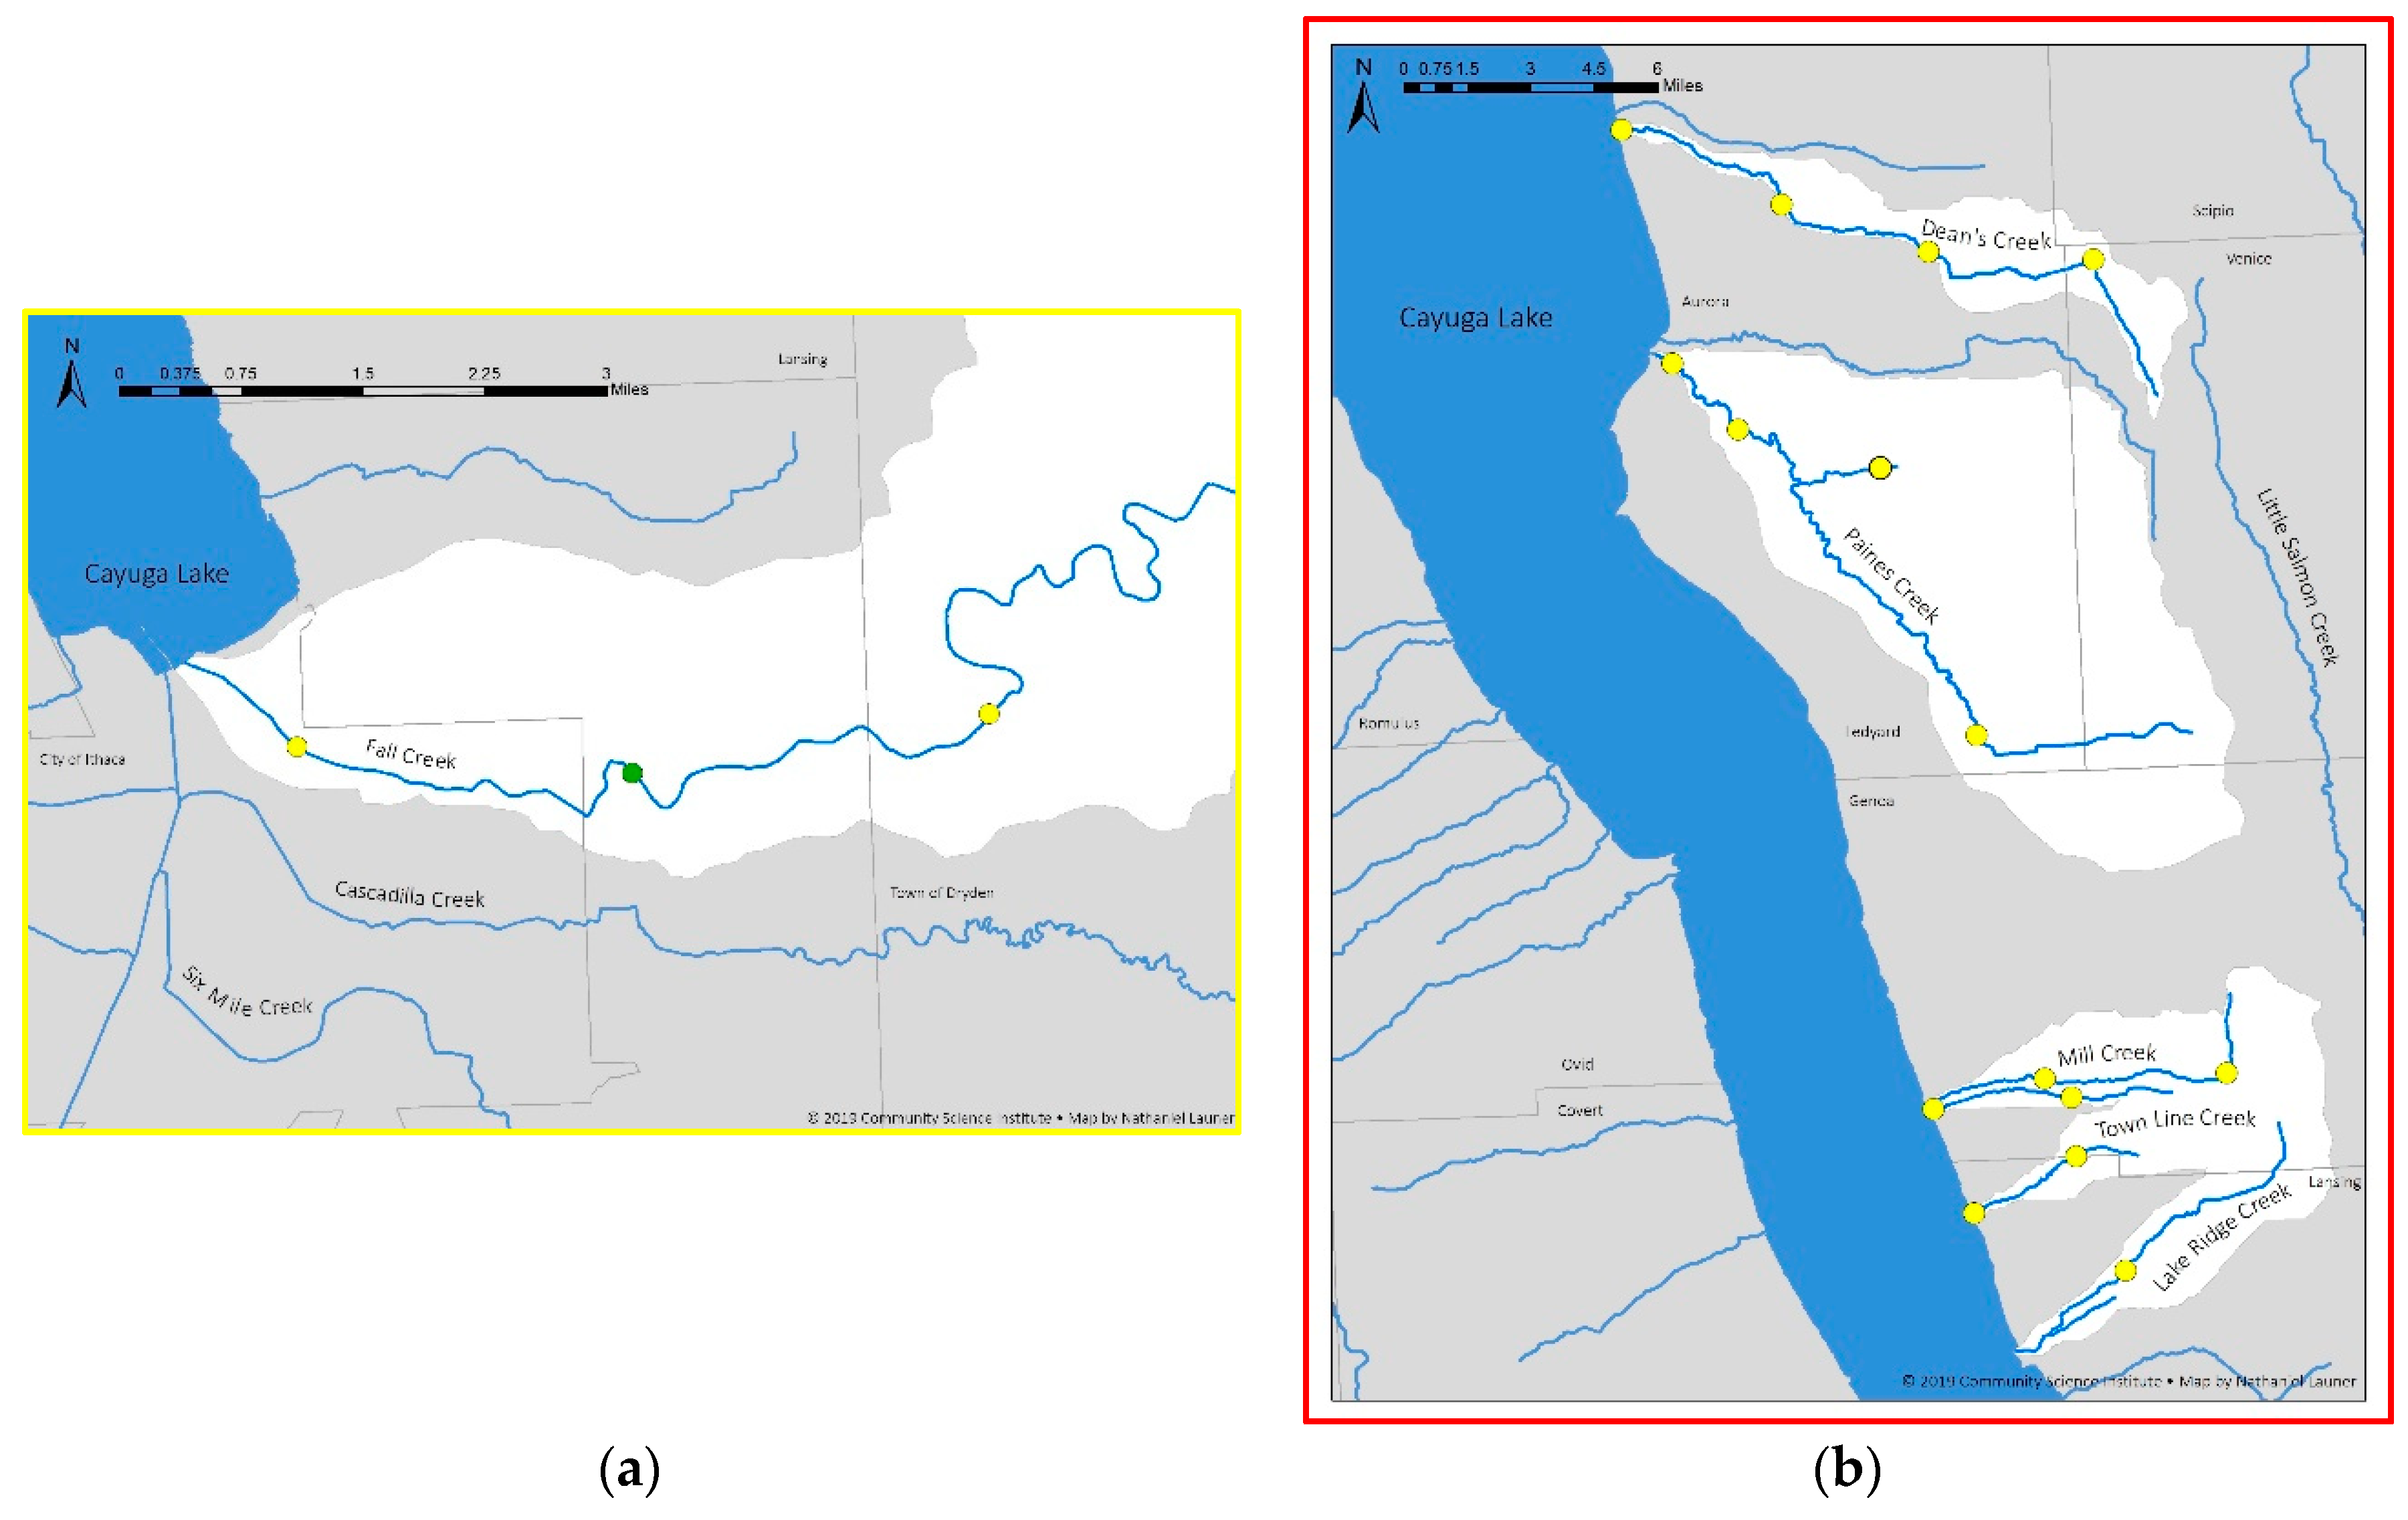
2.1.1. Long-Term Study of Fall Creek

The long-term study compares Fall Creek’s SRP concentrations in the 1970s with those in the first decade of the 2000s. Various characteristics of the Fall Creek watershed during these two time periods are summarized in Table 1. Major land uses are included with the caution that land use comparisons across time periods have inherent uncertainties, due to differences in techniques and categorizations used. Nevertheless, in the absence of superior records or data, they are included here to give a general assessment of dominant land uses in each time period. These data point to a decline in agricultural land use and increases in forest and urban land uses between the 1970s and 2000s. Wastewater treatment has expanded and improved over the decades. Also included are agricultural statistics on dairy farming in the town of Dryden, a significant portion of which lies within the Fall Creek watershed. Municipal boundaries do not align with watershed boundaries and portions of three counties, Tompkins (58%), Cortland (22%), and Cayuga (20%) are represented in the Fall Creek watershed [25]. Similarly, within these counties nine towns are represented within the Fall Creek watershed boundary; among them, the town of Dryden has been described as most representative of dairy farming in the surrounding area and has been the focus of a longitudinal study on local agricultural trends [37]. In the 2000s farms in Dryden produced more crops and more milk with fewer animals and on less land than in the 1970s (Table 1). In addition to the changes documented in Table 1, between 1970 and 2010 the total population in the three counties represented in the Fall Creek watershed combined increased by 15% from 200,397 to 230,926 [38].

2.1.2. Spatial Study

The spatial study compares SRP concentrations in Fall Creek with those in northeastern tributaries of Cayuga Lake. Various characteristics of the Fall Creek and northeastern tributary watersheds are summarized in Table 2. Overall the watersheds of the northeastern tributary sites are more agricultural, and have a higher density of septic systems. Because agricultural and population census data are not available on the watershed scale, agricultural and population statistics are provided for Tompkins County, in which both Fall Creek sampling sites are located, and Cayuga County, which includes 13 of the 15 northeastern sampling sites, the remaining two being just over the county line in Tompkins County. Using county level data as a guide, the watersheds of the northeastern tributaries are judged to be less densely populated and more agricultural than the Fall Creek watershed. In addition, their farms are bigger and have more density of livestock on average, with greater proportions of farmers employing reduced and no-tillage practices, as well as using cover crops (Table 2).

2.2. Sampling Sites, Sample Collection, and Sample Analysis

2.2.1. Long-Term Study of Fall Creek

Sample collection and analysis were conducted by the research group of Dr. D. Bouldin, now Emeritus Professor of Soil and Crop Sciences at Cornell University. Water samples were collected from Fall Creek at one site near its outlet (Figure 2a). Coordinates for the site are 42.453° N and 76.4705° W. All samples were collected as grab samples. Samples were collected from a bridge above the stream, directly downstream of a point where Fall Creek flows through a notch in an old dam. This ensured that all samples were well-mixed. An approximately 1 L glass container was used to retrieve samples. In the 1970s water quality samples were collected during the years 1972–1975 and 1978. In the 2000s, samples were collected during 2006 and 2009–2010. The number of samples collected and analyzed in any given time period was determined by the funding available.
In order to mitigate the confounding influence of flow rate at the time of sampling on SRP concentration, we equalized the boundaries of sampled flow regimes between the two time periods by removing from the 1970s dataset samples that had higher associated flow rates than the 2000s maximum of 57.7 m3/s, and those that had lower associated flow rates than the 2000s minimum of 0.767 m3/s. The resulting sample size of our 1970s dataset was 552; our 2000s dataset had a sample size of 60. Thus the total number of samples for the long-term study was 612. As indicated in Table 3, on some dates only one sample was collected, while on other multiple samples were collected. Aggregate data for each time period were separated into high and low flow strata demarcated by the 75th percentile of flow when both time periods were combined, in keeping with the method used in a previous study [21]. The cut-off between high and low flow strata was 20 m3/s.
Particulates were removed by centrifugation at 35,000 g, and SRP analysis was conducted using standard method 4500-P D [42] in which a phosphomolybdate complex is reduced by stannous chloride.
Additional information including all data used in the long-term study are provided in the supplementary materials (Table S1 and Note S1).

2.2.2. Spatial Study

Sample collection and analysis was conducted by the Community Science Institute (CSI) in Ithaca, NY. CSI operates a New York State and NELAC (National Environmental Laboratory Accreditation Conference) certified laboratory. The institute recruits, trains, and coordinates volunteer community groups to collect water samples from local waterbodies for certified analysis. Volunteer groups typically sample on pre-selected calendar dates, and thus are more likely to capture baseflow rather than storm event conditions. However, at least one planned event per year is re-scheduled on short notice for the purpose of capturing high flows in each monitored stream. CSI’s certified water quality results are made publicly available on an online database [43]. CSI data have been successfully used in research and were used to help calibrate the initial tributary model for the Cayuga watershed TMDL process [23,25,44].
Samples were collected from Fall Creek as grab samples at one site close to the outlet and a second site about 6 km upstream, both in Tompkins County, NY. Latitudes and longitudes of the downstream and upstream sites are 42.4547° N, 76.5004° W and 42.4569° N, 76.4387° W, respectively (Figure 2a). Grab samples were collected in 1 L plastic bottles from the center of the stream. Sample bottles were opened and closed underwater to avoid surface debris. Under flow conditions that posed safety hazards, grab samples were collected either from the shoreline or from a bridge at the sampling site. In the case of the latter, a clean bucket was lowered and rinsed by filling and emptying twice before collecting the sample. The sample was mixed thoroughly in the bucket before transfer to the sample bottle. A total of 95 samples were collected from Fall Creek between 2009 and 2018. Samples were categorized as high flow or low flow samples using the flow rate cut-off of 20 m3/s calculated in the long-term study.
Fifteen sites were sampled in the northeastern tributaries of Dean’s, Lake Ridge, Mill, Paines, and Town Line Creeks (Figure 1b and Figure 2b). Thirteen of the 15 sites were in Cayuga County, NY, and the remaining two sites were just over the county line in Tompkins County, NY. Latitudes and longitudes of the northeastern tributary sites ranged from 42.769° to 42.609° N and from 76.709° to 76.623° W, respectively. Samples were collected from the northeastern tributaries in all but two of the years between 2009 and 2018. Data from the fifteen northeastern sites were pooled for a total of 237 samples collected from the northeastern tributaries over the years 2009–2012 and 2015–2018. The northeastern tributaries are ungaged. Samples were categorized as high flow or low flow using Fall Creek flow rate at noon on each northeastern tributary sampling day as a proxy; again the threshold of 20 m3/s flow rate in Fall Creek was used to demarcate high and low flow samples. The sampling regime for the spatial study is summarized in Table 4.
Particulates were removed by filtration through a 0.45 µm cellulose acetate filter and SRP analysis was conducted using EPA method 365.3 [45] in which a phosphomolybdate complex is reduced by ascorbic acid.
Additional information including all data used in the spatial study are provided in the supplementary materials (Table S2 and Note S2).

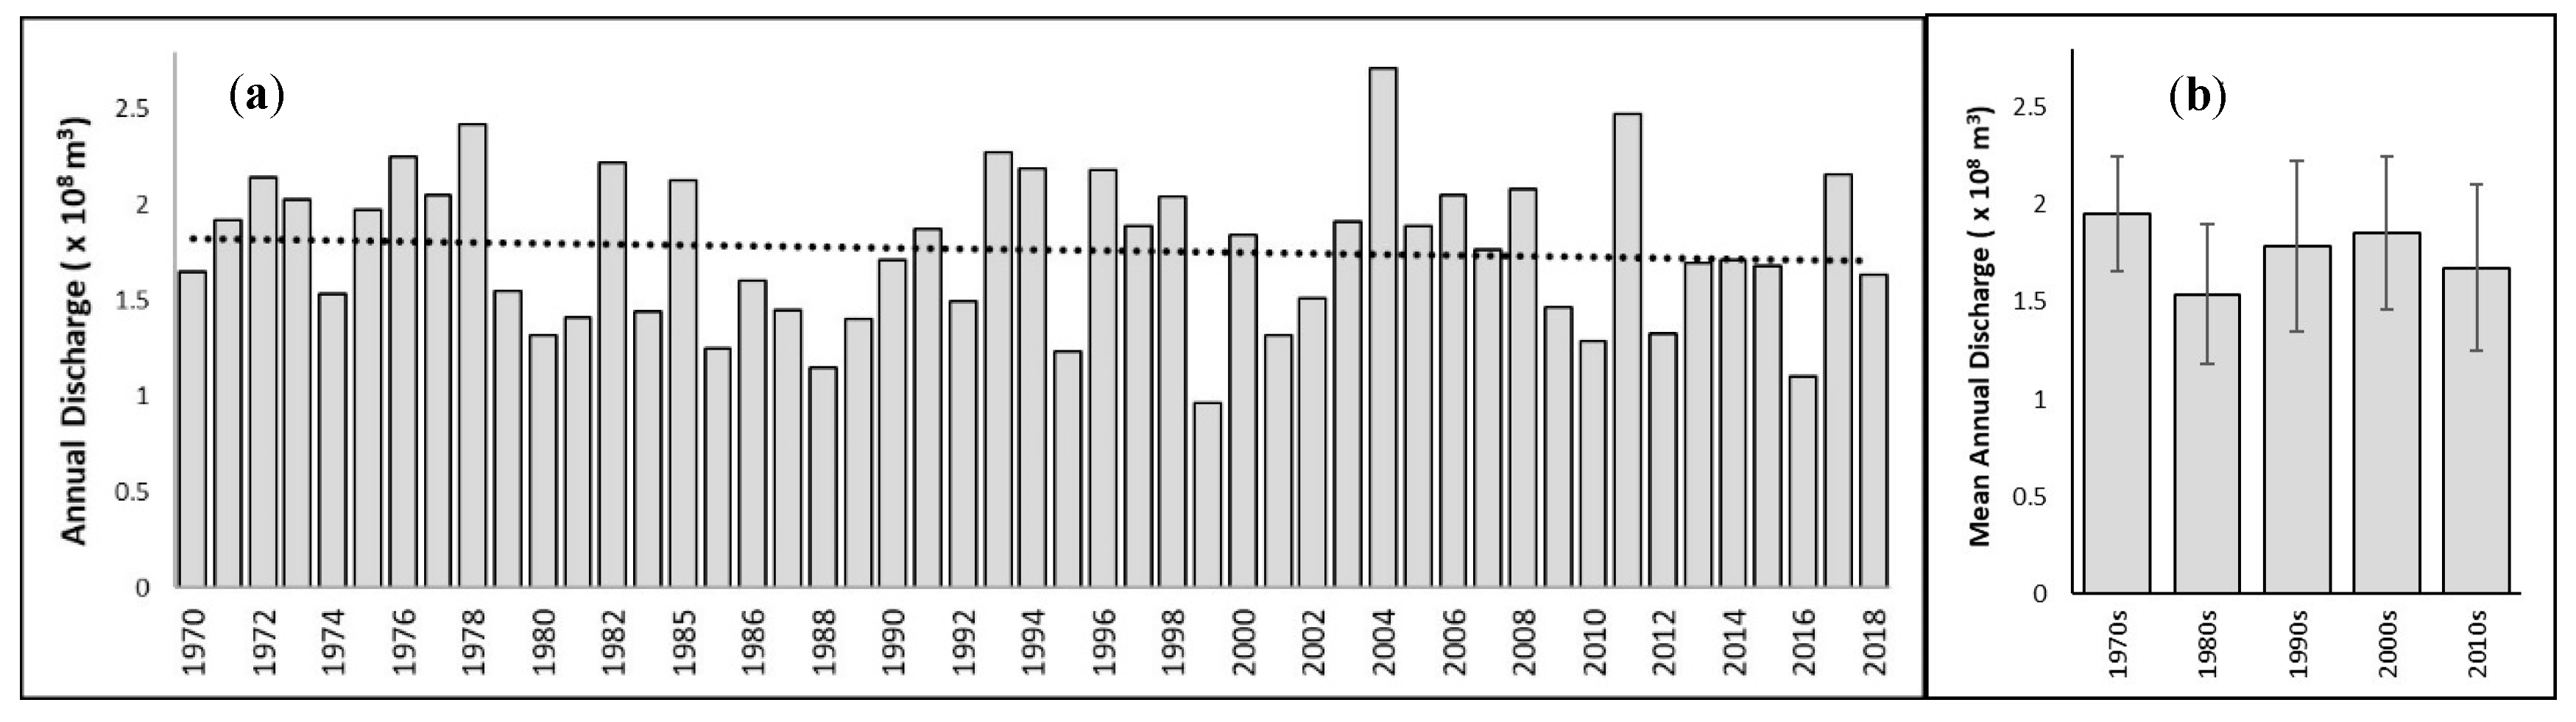
2.3. Discharge Records and Statistical Methods

United States Geological Survey (USGS) gaging station 04234000 continuously monitors discharge in Fall Creek and served as the source of flow rate data corresponding to each Fall Creek sample in both studies, and as the proxy for northeastern tributary flow rates in the spatial study.
The Microsoft Excel Data Analysis Package was used for statistical analysis. Large sample sizes and the application of the central limit theorem justified the use of t-tests to test for significant differences between means. Flow-weighted means were calculated using the equation below, where x represents SRP concentrations in µg/L, and w represents corresponding flow rates at the time of sampling in m3/s,
x ¯ = i = 1 n ( x i × w i ) i = 1 n w i .
Standard errors of flow-weighted means were calculated using the bootstrap method. Simple linear regression was used to assess relationships between variables. The 5% level of probability was used as the threshold for statistical significance.

3. Results

The hydrology of Fall Creek exhibits considerable interannual variability in discharge. Between 1972 and 2018, discharge in high flow years was more than double that in low flow years. Annual discharge showed no trend over time (Figure 3a). Decadal averages were also variable. The mean annual discharge in the 1970s was 2.0 ± 0.3 × 10⁸ m3, which was not significantly different from the value of 1.9 ± 0.4 × 10⁸ m3 in the first decade of the 2000s (Figure 3b).

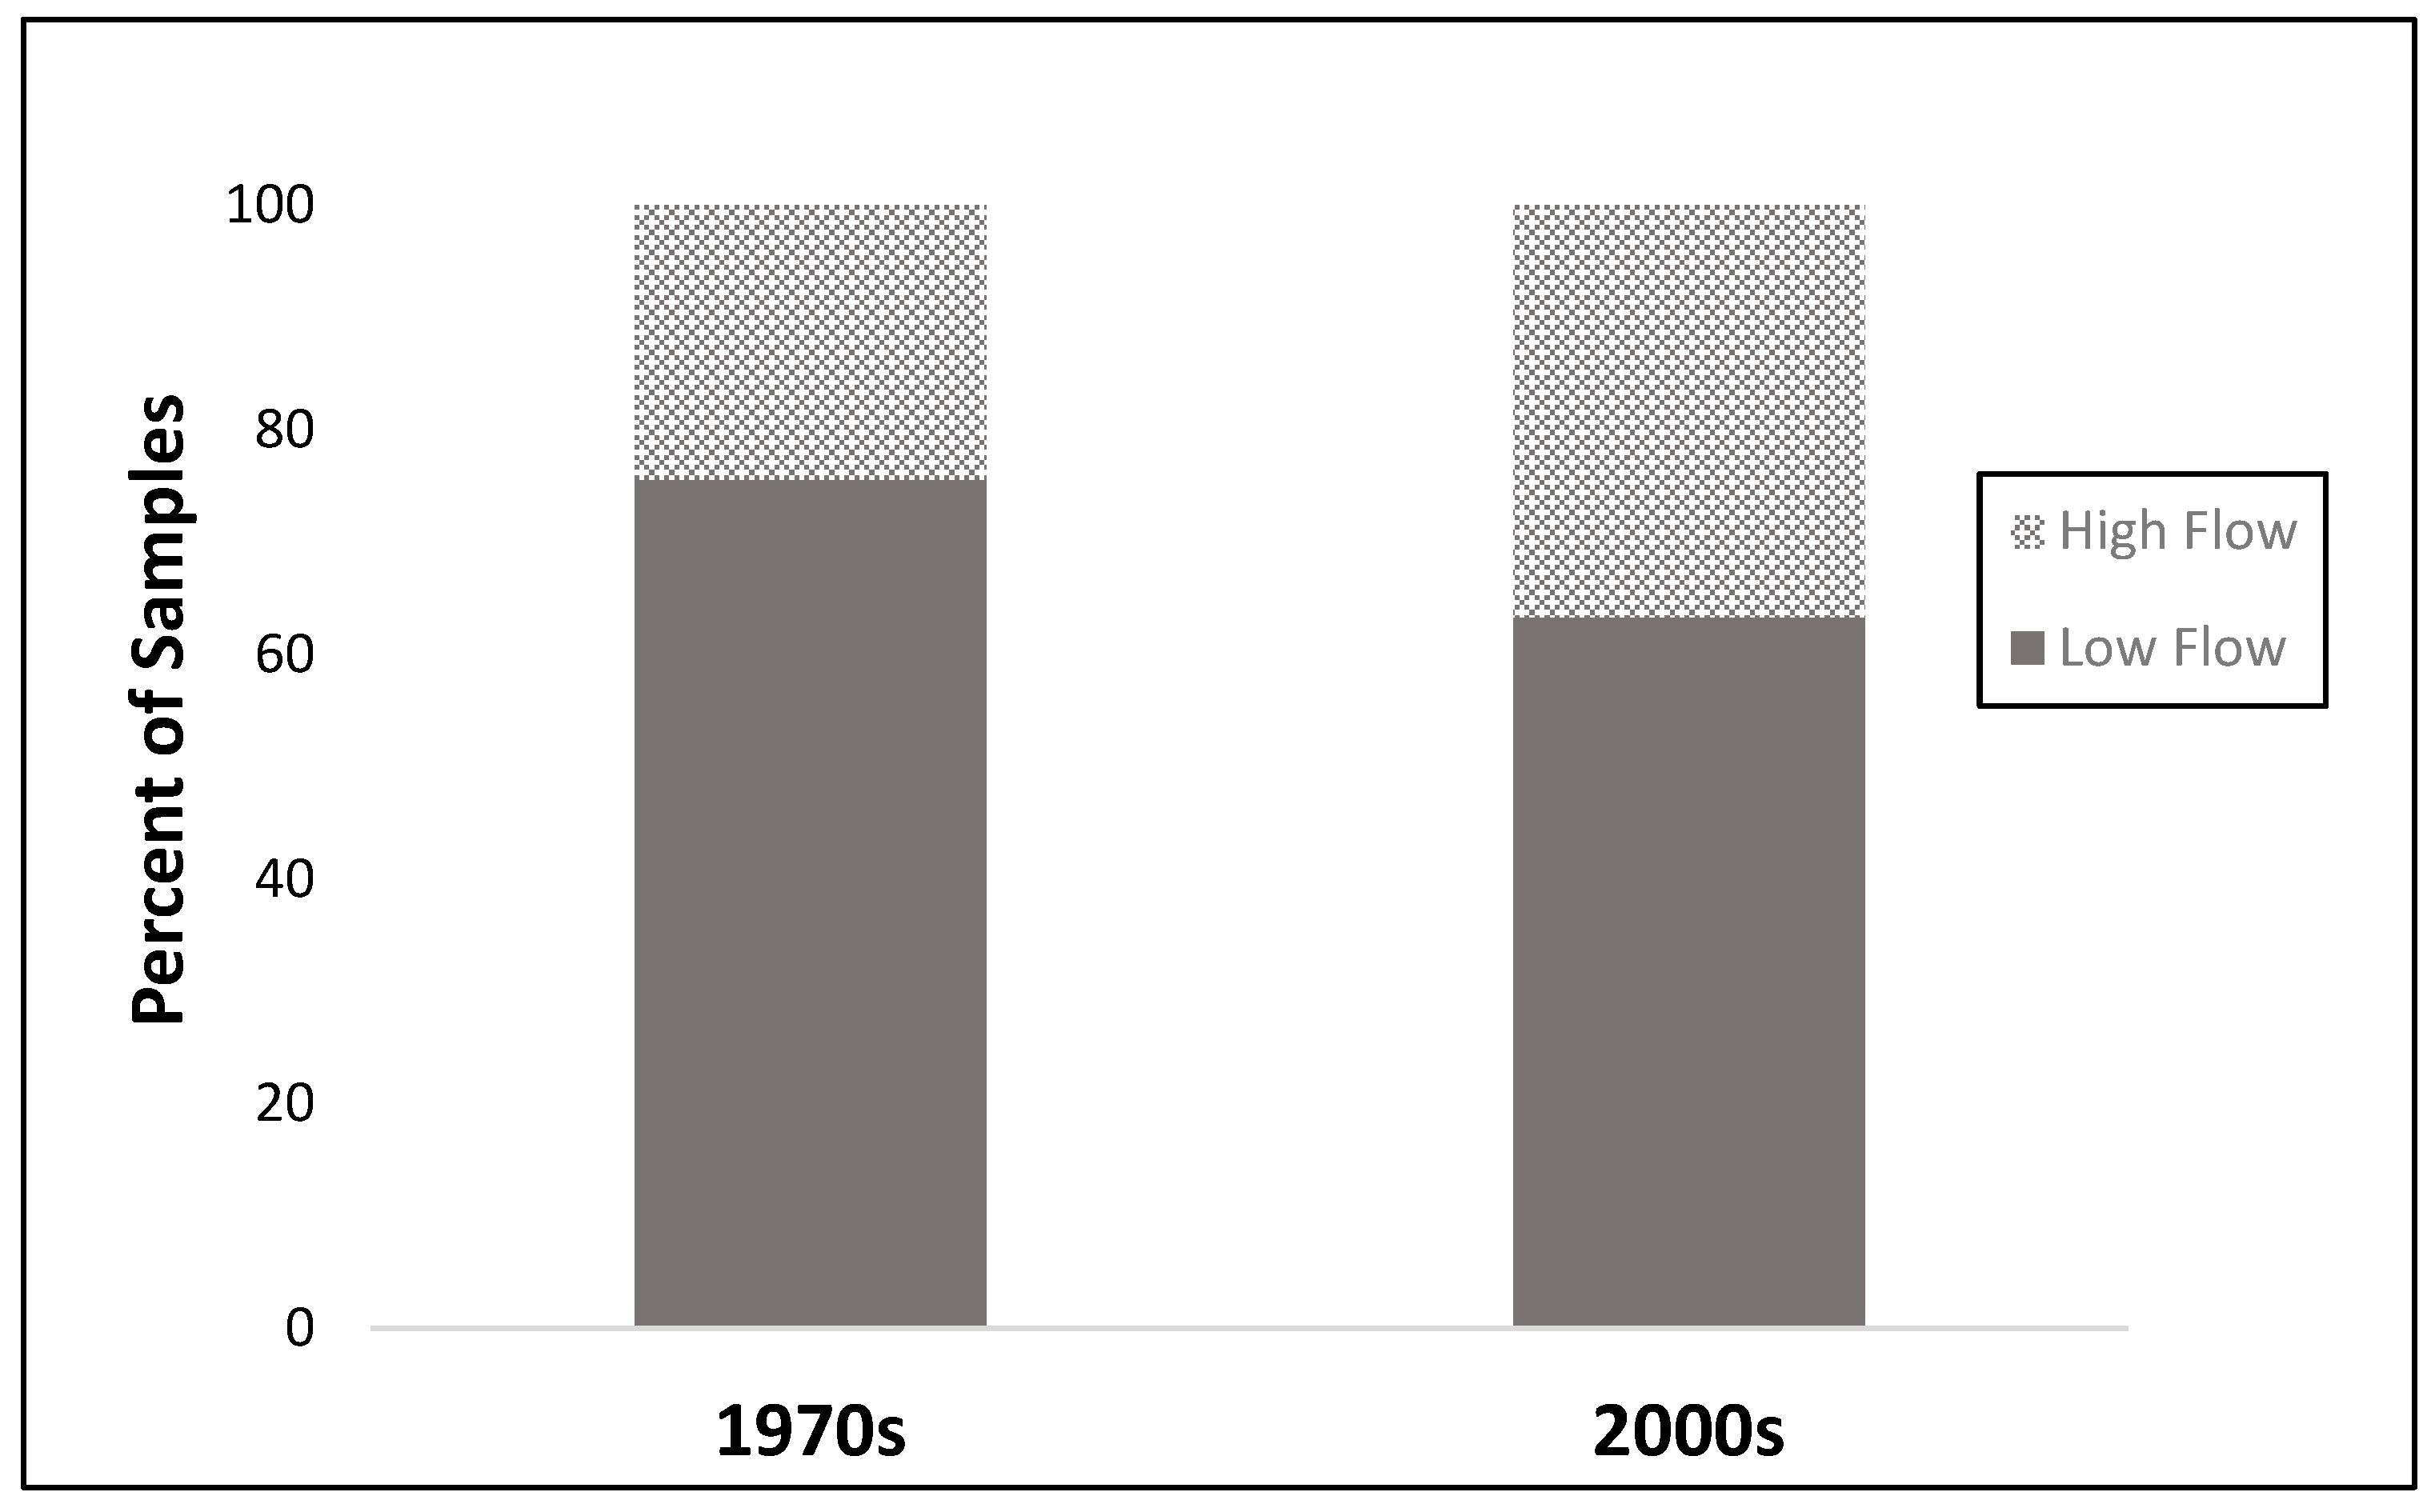
3.1. Long-Term Study of Fall Creek.

Flow-weighted mean SRP concentration ranged between 15.0 µg/L and 30.0 µg/L in all years studied in both the 1970s and 2000s, except for 2010 (Figure 4a,b), a year in which particularly low flows were captured (Figure 4c,d) and sample size was small (Table 3). SRP concentrations were influenced by flow rates at the time of sampling. Years in which the sampling regime captured low flows generally had lower associated SRP concentrations (Figure 4a–d). Across time periods, the two years with the most comparable flow rates, 1972 and 2006 (Figure 4c,d), yielded near identical SRP concentrations with flow-weighted means of 29.5 µg/L and 29.9 µg/L, respectively (Figure 4a,b).
The larger 1970s dataset was trimmed as described in Section 2.2.1 above. Examination of the resulting data for each of the two time periods indicates that within the common flow boundaries of 0.767 m3/s and 57.7 m3/s a higher proportion of high flow samples was captured in the 2000s compared to the 1970s (Figure 5).
In both the 1970s and the 2000s SRP concentration increased with increasing flow rate (Figure 6) and the relationship was significant (p < 0.001) in both time periods. Flow rate at the time of sampling accounted for 23% and 33% of the variability in SRP concentration in the 1970s and the 2000s, respectively (Figure 6). There was no significant difference in the slope of the SRP concentration—flow rate relationship between the two time periods.
Our sampling of a greater proportion of higher flows in the 2000s compared to the 1970s (Figure 5) was reflected in significantly (p < 0.01) higher mean captured flow rates in the 2000s compared to the 1970s (Figure 7a). A 41% increase in median captured flow rate at the time of sampling between the two time periods (Figure 7a) was accompanied by an equivalent increase in median SRP concentration of 43% (Figure 7b). Flow-weighted mean SRP concentration in the 2000s was 29.3 µg/L, significantly (p < 0.001) higher than the 1970s flow-weighted mean of 19.4 µg/L (Figure 7b).

3.2. Spatial Study

SRP concentration was elevated in samples collected at high flow rates in both Fall Creek and the northeastern tributaries. Mean SRP concentration in the northeastern tributaries was significantly (p < 0.001) higher than in Fall Creek under both high and low flow regimes (Table 5). Mean SRP concentrations in the northeastern tributaries were 106.6 µg/L and 183.1 µg/L under low and high flow conditions, respectively, whereas, mean SRP concentrations in Fall Creek were 13.7 µg/L and 32.8 µg/L under low and high flow conditions, respectively. SRP concentration values in the northeastern tributaries exhibited slightly higher variability than those in Fall Creek (Table 5).

4. Discussion

4.1. Long-Term Study of Fall Creek

The annual discharge in Fall Creek is highly variable year to year and shows no trend between 1972 and 2018 (Figure 3a). Mean annual discharge for the decade of the 1970s is not significantly different from that in the first decade of the 2000s (Figure 3b). This result is consistent with the finding of a monitoring and modeling study that also concluded that there had been no significant change in tributary flows to Cayuga Lake between the 1970s and the first decade of the 2000s [19]. The amount of discharge has a large influence on the predominantly runoff-driven transport of phosphorus in the Fall Creek watershed [21]. Though heavy rain events appear to be becoming more common in the larger northeast region [31], this does not seem to have increased annual discharge in Fall Creek. Stability in annual discharge is one aspect of overall phosphorus transport in the watershed. Any impacts of various additional components of a changing climate on mobilization along phosphorus pathways in the watershed have yet to be determined.
The influence of flow rate at the time of sampling on stream SRP concentration constitutes a challenge when comparing water quality data across two time periods. In this study, we mitigated that challenge by tailoring a larger 1970s dataset to generate flow boundaries that matched data available from the 2000s, and by examining SRP concentration in the context of flow rates at the time of sampling. Our results indicate that SRP concentrations in Fall Creek have not changed since the 1970s (Figure 4). Higher flow-weighted mean concentrations in the 2000s (Figure 7) appear to be a reflection of a greater proportion of high flow conditions captured during this time period (Figure 5).
There was no statistically significant change in the SRP concentration-discharge relationship between the two time periods (Figure 6). A given volume of water flowing down Fall Creek in the 2000s delivered the same amount of SRP to Cayuga Lake that it did decades before, but higher flows captured by sampling in the 2000s resulted in proportionally increased SRP concentrations (Figure 7). Four decades of changes in the watershed might reasonably have been expected to alter the SRP concentration-discharge relationship in Fall Creek. Increasing population and urbanization might have been expected to increase SRP per unit flow, while expanded and improved sewage management, less land in agriculture, more land in forest, and increasingly regulated agricultural practices would have been expected to have the opposite effect (Table 1). The finding of stability in the SRP concentration-discharge relationship indicates that these changes have not been significant enough to alter the relationship, or that their combined effect overall has resulted in no net impact. Nutrient budgets within the watershed may also serve to insulate stream SRP from watershed changes. It is estimated that the amount of soluble phosphorus leaving the watershed in the waters of Fall Creek is less than 3% of the amount added to it annually [46].
Significant changes in the management of human wastes have taken place in the Fall Creek watershed over the time period of the long-term study. Phosphorus sources originating in inadequate on-lot waste treatment practices that were documented in the 1970s [22] would be highly unusual today. At that time, only one wastewater treatment plant serving about 1400 people in the village of Dryden discharged into Fall Creek [22]. This plant was upgraded in 1997 and now serves approximately 2500 people. An additional plant that serves about 750 people in the village of Freeville was constructed in 1985 [27]. In addition, the 1973 New York State ban on phosphorus in laundry detergents had the effect of reducing anthropogenic inputs of phosphorus to Fall Creek [22].
As agriculture is the biggest source of nutrients to Fall Creek [19], its potential impacts across the decades warrant close examination. Agriculture in the watershed has become more productive, and farms are bigger on average, but overall this activity is occurring on a smaller footprint and in a more regulated way (Table 1). On the one hand, as measured by feed crop production and milk sales, agriculture has intensified over time (Table 1); on the other hand, agricultural land decreased and agricultural management improved in an era of greater regulation and more widespread concern regarding agriculture’s environmental impact. Similarly, urbanization and population increased since the 1970s, but wastewater treatment expanded and improved over the same time period (Table 1). Detailing the complex interplay of the variety of factors that influences the phosphorus budget in this watershed is beyond the scope of our study, but the overall finding of stability over time is significant.
Our results are consistent with other studies of the Fall Creek watershed. A previous study that included modeling, as well as monitoring, determined that loading of dissolved phosphorus occurred at a similar rate in the 1970s and the 2000s [19]; the authors attributed the lack of change to improved wastewater treatment and improved agricultural practices [19]. A study of trends in nitrate concentration in Fall Creek over time also found no change between the 1970s and 2000s, despite the intensification of farming operations over the same time period. The authors attribute the stability in Fall Creek’s nitrate concentration to improved dairy management over time, including increased adoption of best management practices, and to the dividends of increased investment in addressing the environmental impacts of agriculture [25].
Streamflow at the time of sampling has a significant (p < 0.001) positive relationship with SRP concentration in Fall Creek (Figure 6), as has been documented in other tributaries of the Cayuga watershed [23]. The stability of SRP concentration over time (Figure 4) means that any variation in the input of SRP into the lake in this watershed is primarily a consequence of variation in flow regimes with large hydrological events driving much of the exports [21,24,44]. Although discharge is, to a large extent, a natural factor derived from meteorological and hydrological conditions [21], it can also be affected by land management. Reducing phosphorus inputs is the anticipated focus of a forthcoming TMDL for phosphorus in the Cayuga Lake watershed [21], but large interannual variations in tributary flow (Figure 3a) mean that detecting responses to changes in watershed management will be difficult [21]. Even significant reductions in nutrient loading can take many decades to manifest in water quality improvements against the backdrop of year to year variability [15,16]. Realistic expectations amongst community stakeholders should be fostered on the basis of an accurate understanding of the water quality response to the component factors of watershed management and streamflow, and of the historical stability that appears to buffer water quality in this watershed.
Long-term stability in phosphorus concentration has been observed in other water bodies around the world. Between 1980 and the late 1990s no significant change was observed in phosphorus concentration in the Yangtze River in China, despite increases in population and crop production in the river’s watershed over the time period [1]. Total phosphorus concentration in the Black Sea and coastal waters of western Europe exhibited stability between 1985 and 2005, but decreased in the coastal areas of the Mediterranean and North Seas [2]; widespread decreases in phosphorus have also been reported in watersheds across southwestern Europe [3]. Across the U.S. and Canada, long-term stability in total phosphorus concentrations in streams is not uncommon [4]. SRP concentration was found to be stable between 1979 and 2011 in 40 of 56 watersheds studied in Ontario [5]. No significant trend in total phosphorus concentration was found in 33 of 112 stream stations studied in southern Ontario, and a decline was found in the majority of sites [6]. Increasing SRP concentration in water bodies over time has been observed in some areas, and at least in some cases is attributable to changes in both storm events and in agricultural management practices [7]. Water quality trends, when observed, are the result of additive interaction between trends in streamflow and changes in watershed management [17].

4.2. Spatial Study

Northeastern tributaries had significantly (p < 0.001) higher SRP concentrations than Fall Creek, indicating that large geographic variation in SRP export exists within the Cayuga Lake watershed (Table 5). Greater agricultural land use in the watersheds of the northeastern tributaries (Table 2) may be a significant source of SRP [7,14,21]. Due to the unavailability of watershed scale statistics, general agricultural profiles of the Fall Creek and northeastern tributary watersheds were compared using county level data and making the assumption that Tompkins and Cayuga County data provide reasonable representations of the Fall Creek and northeastern tributary watersheds, respectively. While the southern and northern parts of the Cayuga watershed have similarities in terms of the dominance of dairy farming, they are somewhat different in their agricultural profiles [39,40]. The higher density of livestock in Cayuga County and the greater extent of agricultural land use in the northeastern tributary watersheds (Table 2) would be expected to yield higher SRP in the northeastern tributaries. Some features in the region of the northeastern sites would, however, be expected to reduce SRP, such as lower population and urbanization, and, on average, larger farms with nutrient management practices that are more extensively regulated than on smaller farms. Adoption rates for some best management practices, including no-till, reduced tillage, and cover crops, are higher in Cayuga County than in Tompkins County (Table 2). If this is representative of the watersheds of our sampling sites, it suggests that these practices, though effective at conserving soil and reducing the flow of particulate phosphorus to water bodies, could serve to increase pathways for SRP. The impact of agricultural soil conservation practices on increasing dissolved phosphorus loading to nearby waterways has been documented [7]. Septic systems prevalent in rural areas can also contribute SRP to receiving waters [47], and the higher density of septic systems in the area of our northeastern tributary sites compared to the Fall Creek watershed could also be expected to lead to higher SRP in the former (Table 2). One of the 15 sites in the northeastern tributaries is directly downstream of a wastewater treatment plant, and both Fall Creek sampling sites are well downstream of wastewater treatment plants in that watershed. Given the limited contribution of point sources to phosphorus loading in the region [19], these sources are judged not to have a significant influence on the results of this study. Additional studies of the watersheds’ soils, drainage, and groundwater contributions would assist in developing a more thorough understanding of the sources of SRP in the northeastern tributary watersheds.
Previously published water quality studies of the Cayuga Lake watershed have focused primarily on the lake and on major tributaries in the southern portion of the watershed. Our finding of a large difference in SRP concentration between Fall Creek and the northeastern tributaries under both high and low flow regimes (Table 5) indicates that southern tributaries are not representative of the watershed as a whole. These results justify dedicated monitoring of minor tributaries in the northern half of the watershed as part of any watershed management scheme.

4.3. Implications for Future Monitoring and Management

The Cayuga Lake watershed and its tributaries have a history of water monitoring studies conducted by several entities, including academic institutions, CSI, and state and federal agencies. Current work is ongoing, and the watershed will remain the subject of study during the implementation of the forthcoming TMDL and in the context of efforts to address HABs. Monitoring will continue to play a crucial role that complements other approaches, but the data it generates can be inherently challenging to analyze on a watershed scale [16]. In order to guide ongoing and future monitoring and help ensure that data collected are of maximum utility, the following recommendations for a long-term monitoring strategy are based on lessons learned from the studies described above. While they are drawn from our studies of SRP concentration in our region, the fundamental concepts apply broadly to various water quality parameters in many watersheds.
  • Sample High Flows and Record Flow Rates. Hydrology driven SRP export must be accounted for in monitoring protocols. A range of flow conditions must be sampled, with particular efforts to capture high flows. Rapid deployment of monitoring personnel in response to storm events is key. In ungaged streams flow rate at the time of sampling can be estimated using drainage basin ratios and data from nearby gaged streams [48]. Alternatively, simple current velocity meters and stream dimensions can be used to roughly estimate flow rates, as long as high water does not pose safety concerns.
  • Plan for the Long Term and for Extensive Sampling. Our data suggest that SRP in the Fall Creek watershed has been stable for decades. As we enter an era of TMDL-guided watershed management and efforts to reduce HABs, expectations of rapid watershed response are not realistic. Highly variable hydrology will confound our ability to detect changes attributable to decreased phosphorus inputs. Monitoring protocols should be designed and resourced for decadal timescales and large sample sizes.
  • Incorporate Spatial Variety When Locating Monitoring Sites. Smaller tributaries in the northern part of the Cayuga Lake watershed represent a large data gap that we have begun to fill in this study using data collected by CSI and its volunteer partner groups. During TMDL implementation and assessment, the historical focus on southern tributaries and large sub-watersheds must be expanded to include more diversity in sub-watershed location and size.
Adoption of a TMDL or other comprehensive management strategy is a milestone event in any watershed. Successful implementation requires a commitment to appropriately designed and executed water monitoring programs that will benefit watershed residents and ecosystems by supporting informed decision-making.

Supplementary Materials

The following are available online at https://www.mdpi.com/2073-4441/11/10/2075/s1, Table S1: Data used in long-term study, Table S2: Data used in the spatial study, Note S1: Additional information related to long-term study, Note S2: Additional information related to the spatial study.

Author Contributions

Conceptualization, D.R.B. and S.M.P.; Data curation, N.O.L. and S.M.P.; Formal analysis, N.O.L. and E.L.G.; Funding acquisition, S.M.P. and D.R.B.; Investigation, S.M.P. and D.R.B.; Methodology, S.M.P. and D.R.B.; Project administration, R.J., S.M.P. and D.R.B.; Resources, S.M.P. and D.R.B.; Software, S.M.P.; Supervision, R.J., S.M.P. and D.R.B.; Validation, N.O.L., S.M.P. and D.R.B.; Visualization, N.O.L.; Writing—original draft, N.O.L.; Writing—review and editing, N.O.L., R.J., E.L.G., S.M.P. and D.R.B.

Funding

We are grateful to the Rockefeller Foundation, Cornell University, and local governments in Tompkins and Cayuga Counties, New York, for their financial support of this work.

Acknowledgments

We thank Renee Andrews, City of Ithaca Laboratory Technician, the citizen volunteers and the laboratory staff at the Community Science Institute, Abner Figueroa for developing and maintaining the Community Science Institute database, and Sarrah Jesmer, Library Assistant at Long Library, Wells College, for their assistance and expertise. We also thank Dr. Elizabeth Moran, President of Ecologic LLC, for her assistance with data interpretation.

Conflicts of Interest

The authors declare no conflicts of interest. The funders had no role in the design of the study; in the collection, analyses, or interpretation of data; in the writing of the manuscript, or in the decision to publish the results.

References

  1. Liu, S.M.; Zhang, J.; Chen, H.T.; Wu, Y.; Xiong, H.; Zhang, Z.F. Nutrients in the Changjiang and its tributaries. Biogeochemistry 2003, 62, 1–18. [Google Scholar] [CrossRef]
  2. Grizzetti, B.; Bouraoui, F.; Aloe, A. Changes of nitrogen and phosphorus loads to European seas. Glob. Chang. Biol. 2012, 18, 769–782. [Google Scholar] [CrossRef]
  3. Romero, E.; Garnier, J.; Lassaletta, L.; Billen, G.; Le Gendre, R.; Riou, P.; Cugier, P. Large-scale patterns of river inputs in southwestern Europe: Seasonal and interannual variations and potential eutrophication effects at the coastal zone. Biogeochemistry 2013, 113, 481–505. [Google Scholar] [CrossRef]
  4. Sprague, L.A.; Lorenz, D.L. Regional nutrient trends in streams and rivers of the United States, 1993–2003. Environ. Sci. Technol. 2009, 43, 3430–3435. [Google Scholar] [CrossRef] [PubMed]
  5. Stammler, K.L.; Taylor, W.D.; Mohamed, M.N. Long-term decline in stream total phosphorus concentrations: A pervasive pattern in all watershed types in Ontario. J. Gt. Lakes Res. 2017, 43, 930–937. [Google Scholar] [CrossRef]
  6. Raney, S.M.; Eimers, M.C. Unexpected declines in stream phosphorus concentrations across southern Ontario. Can. J. Fish. Aquat. Sci. 2014, 71, 337–342. [Google Scholar] [CrossRef]
  7. Daloglu, I.; Cho, K.H.; Scavia, D. Evaluating causes of trends in long-term dissolved reactive phosphorus loads to Lake Erie. Environ. Sci. Technol. 2012, 46, 10660–10666. [Google Scholar] [CrossRef]
  8. Weigelhofer, G.; Hein, T.; Bondar-Kunze, E. Phosphorus and nitrogen dynamics in riverine systems: Human impacts and management options. In Riverine Ecosystem Management; Schmutz, S., Sendzimir, J., Eds.; Aquatic Ecology Series; Springer: London, UK, 2018; Volume 8, pp. 187–202. [Google Scholar]
  9. Kosten, S.; Huszar, V.L.M.; Mazzeo, N.; Scheffer, M. Lake and watershed characteristics rather than climate influence nutrient limitation in shallow lakes. Ecol. Appl. 2009, 19, 1791–1804. [Google Scholar] [CrossRef]
  10. Kelderman, P.; Koech, D.K.; Gumbo, B.; O’Keeffe, J. Phosphorus budget in the low-income, peri-urban area of Kibera, in Nairobi (Kenya). Water Sci. Technol. 2009, 60, 2669–2676. [Google Scholar] [CrossRef]
  11. Chen, Q.; Chen, J.; Wang, J.; Guo, J.; Jin, Z.; Yu, P.; Zhenzhen, M. In situ, high-resolution evidence of phosphorus release from sediments controlled by the reductive dissolution of iron-bound phosphorus in a deep reservoir, southwestern China. Sci. Total Environ. 2019, 666, 39–45. [Google Scholar] [CrossRef]
  12. Anderson, D.M. HABs in a Changing World: A Perspective on Harmful Algal Blooms, their Impacts, and Research and Management in a Dynamic Era of Climactic and Environmental Change. In Harmful Algae 2012, Proceedings of the 15th International Conference on Harmful Algae, Changwon, Gyeongnam, Korea, 29 October–2 November 2012; Kim, H.G., Reguera, B., Hallegraeff, G.M., Lee, C.K., Eds.; 2014. Available online: https://www.ncbi.nlm.nih.gov/pmc/articles/PMC4667985/ (accessed on 23 June 2019).
  13. Gilbert, P.M. Eutrophication, harmful algae and biodiversity-challenging paradigms in a world of complex nutrient changes. Mar. Pollut. Bull. 2017, 124, 591–606. [Google Scholar] [CrossRef] [PubMed]
  14. Baker, D.B.; Confesor, R.; Ewing, D.E.; Johnson, L.T.; Kramer, J.W.; Merryfield, B.J. Phosphorus loading to Lake Erie from the Maumee, Sandusky and Cuyahoga rivers: The importance of bioavailability. J. Gt. Lakes Res. 2014, 40, 502–517. [Google Scholar] [CrossRef]
  15. Stow, C.A.; Borsuk, M.E.; Stanley, D.W. Long-term changes in watershed nutrient inputs and riverine exports in the Neuse River, North Carolina. Water Res. 2001, 35, 1489–1499. [Google Scholar] [CrossRef]
  16. Betanzo, E.A.; Choquette, E.F.; Reckhow, K.H.; Hayes, L.; Hagen, E.R.; Argue, D.M.; Cangelosi, A.A. Water Data to Answer Urgent Water Policy Questions: Monitoring Design, Available Data and Filling Data Gaps for Determining the Effectiveness of Agricultural Management Practices for Reducing Tributary Nutrient Loads to Lake Erie. Northeast-Midwest Institute Report. 2015. Available online: http://www.nemw.org/wp-content/uploads/2016/06/Final-Nutrient-Case-Study-Report.pdf (accessed on 23 June 2019).
  17. Murphy, J.; Sprague, L. Water-quality trends in US rivers: Exploring effects from streamflow trends and changes in watershed management. Sci. Total Environ. 2019, 656, 645–658. [Google Scholar] [CrossRef]
  18. Genesee-Finger Lakes Regional Planning Council. Cayuga Lake Watershed Characterization. 2000. Available online: https://www.cayugawatershed.org/documents/CLW_characterization_2000.pdf (accessed on 23 June 2019).
  19. Haith, D.A.; Hollingshead, N.; Bell, M.L.; Kreszewski, S.W.; Morey, S.J. Nutrient loads to Cayuga Lake, New York: Watershed modeling on a budget. J. Water Resour. Plan. Manag. 2012, 138, 571–580. [Google Scholar] [CrossRef]
  20. New York State Department of Environmental Conservation. Cayuga Lake TMDL Outreach. Available online: https://www.dec.ny.gov/lands/95403.html (accessed on 23 June 2019).
  21. Prestigiacomo, A.R.; Effler, S.W.; Gelda, R.K.; Matthews, D.A.; Auer, M.T.; Downer, B.E.; Kuczynski, A.; Walter, M.T. Apportionment of bioavailable phosphorus loads entering Cayuga Lake, New York. J. Am. Water Resour. Assoc. 2016, 52, 31–47. [Google Scholar] [CrossRef]
  22. Bouldin, D.; Johnson, A.; Lauer, D. The influence of human activity on the export of phosphorus and nitrate from Fall Creek. In Nitrogen and Phosphorus. Food Production, Waste and the Environment; Porter, K., Ed.; Ann Arbor Science: Ann Arbor, MI, USA, 1975; pp. 59–120. [Google Scholar]
  23. Upstate Freshwater Institute; Department of Biological and Environmental Science Cornell University; Cornell Biological Field Station; Department of Ecology and Evolutionary Biology Cornell University. Final Phase I Report: Monitoring and Modeling Support for a Phosphorus/Eutrophication Model for Cayuga Lake. 2014. Available online: https://energyandsustainability.fs.cornell.edu/file/Phase_I_Cayuga_Lake_Final_Report_121914.pdf (accessed on 23 June 2019).
  24. Johnson, A.H.; Bouldin, A.R.; Goyette, E.A.; Hedges, A.M. Phosphorus loss by stream transport from a rural watershed: Quantities, processes, and sources. J. Environ. Qual. 1976, 5, 148–157. [Google Scholar] [CrossRef]
  25. Johnson, M.S.; Woodbury, P.B.; Pell, A.N.; Lehmann, J. Land-use change and stream water fluxes: Decadal dynamics in watershed nitrate exports. Ecosystems 2007, 10, 1182–1196. [Google Scholar] [CrossRef]
  26. Copeland, C. Animal Waste and Water Quality: EPA’s response to the Waterkeeper Alliance court decision on regulation of CAFOs. Congressional Research Service Reports 43. 2010. Available online: https://digitalcommons.unl.edu/crsdocs/43/ (accessed on 23 June 2019).
  27. New York State Department of Environmental Conservation. Descriptive Data of Municipal Wastewater Treatment Plants in New York State. Available online: https://www.dec.ny.gov/docs/water_pdf/descdata2004.pdf (accessed on 23 June 2019).
  28. Oglesby, R.T. Limnological guidance for Finger Lakes management; Technical Report 89; Cornell University Water Resources and Marine Sciences Center: Ithaca, NY, USA, September 1974. [Google Scholar]
  29. Frankson, R.; Kunkel, K.; Champion, S.; Stewart, B.; Sweet, W.; DeGaetano, A.T. New York State Climate Summary; NOAA Technical Report NESDIS 149-NY; National Centers for Environmental Information: Asheville, NC, USA, 2017; p. 4. Available online: https://statesummaries.ncics.org/ny (accessed on 23 June 2019).
  30. Huang, H.; Winter, J.M.; Osterberg, E.C.; Horton, R.M.; Beckage, B. Total and extreme precipitation changes over the northeastern United States. J. Hydrometeorol. 2017, 18, 1783–1798. [Google Scholar] [CrossRef]
  31. Frei, A.; Kunkel, K.E.; Matonse, A. The seasonal nature of extreme hydrological events in the northeastern United States. J. Hydrometeorol. 2015, 16, 2065–2085. [Google Scholar] [CrossRef]
  32. Likens, G.E. The Runoff of Water and Nutrients from Watersheds Tributary to Cayuga Lake, New York; Technical Report No. 81; Cornell University Water Resources and Marine Sciences Center: Ithaca, NY, USA, 1974. [Google Scholar]
  33. Cornell University Facilities and Campus Services. Final Environmental Impact Statement, Lake Source Cooling, Cornell University. 1998. Available online: https://energyandsustainability.fs.cornell.edu/util/cooling/production/lsc/eis/default.cfm (accessed on 23 June 2019).
  34. New York State Department of Environmental Conservation. Harmful Algal Bloom Action Plan Cayuga Lake. Available online: https://www.dec.ny.gov/docs/water_pdf/cayugahabplan.pdf (accessed on 23 June 2019).
  35. Watson, S.B.; McCauley, E.; Downing, J.A. Patterns in phytoplankton taxonomic composition across temperate lakes of differing nutrient status. Limnol. Oceanogr. 1997, 42, 487–495. [Google Scholar] [CrossRef] [Green Version]
  36. The Water Bulletin, Community Science Institute Newsletter, Fall 2018 ed.; Harmful Algal Blooms (HABs) on Cayuga Lake; Community Science Institute: Ithaca, NY, USA, 2018; Available online: http://www.communityscience.org/wp-content/uploads/2014/07/2018WaterBulletinHarmfulAlgalBloomsEditionRevised2.pdf (accessed on 23 June 2019).
  37. Stanton, B.F.; Conneman, G.J.; Crispell, C.A.; Hoskins, S.B.; Smith, S.F. 100 Years of Dairy Farming, Town of Dryden, Tompkins County, New York; Department of Applied Economics and Management, Cornell University: Ithaca, NY, USA, 2008; Available online: https://ecommons.cornell.edu/handle/1813/65072 (accessed on 9 September 2019).
  38. United States Census Bureau. Census Statistics. Available online: www.factfinder.census.gov (accessed on 23 June 2019).
  39. Census of Agriculture. County Profile, Tompkins County, New York. 2017. Available online: https://www.nass.usda.gov/Publications/AgCensus/2017/Online_Resources/County_Profiles/New_York/cp36109.pdf (accessed on 9 September 2019).
  40. Census of Agriculture, County Profile, Cayuga County, New York. 2017. Available online: https://www.nass.usda.gov/Publications/AgCensus/2017/Online_Resources/County_Profiles/New_York/cp36011.pdf (accessed on 9 September 2019).
  41. New York State Agriculture and Markets. New York State Dairy Statistics. Annual Summary. 2017. Available online: https://www.agriculture.ny.gov/DI/NYSAnnStat2017.pdf (accessed on 9 September 2019).
  42. American Public Health Association, American Water Works Association, Water Environment Federation. Standard Methods for the Examination of Water and Wastewater, 22nd ed.; Rice, E.W., Baird, R.B., Eaton, A.D., Clesceri, L.S., Eds.; American Water Works Association: Denver, CO, USA, 2012. [Google Scholar]
  43. Community Science Institute, Ithaca, NY. Available online: http://www.database.communityscience.org/ (accessed on 23 June 2019).
  44. Effler, S.W.; Prestigiacomo, A.R.; Matthews, D.A.; Gelda, R.K.; Peng, F.; Cowen, E.A.; Schweitzer, S.A. Tripton, trophic state metrics, and near-shore versus pelagic zone responses to external loads in Cayuga Lake, New York, U.S.A. Fundam. Appl. Limnol. 2010, 178, 1–15. [Google Scholar] [CrossRef]
  45. United States Environmental Protection Agency. Method 365.3: Phosphorous All Forms (Colorimetric, Ascorbic Acid, Two Reagent). Available online: https://www.epa.gov/sites/production/files/2015-08/documents/method_365-3_1978.pdf (accessed on 23 June 2019).
  46. Porter, K.; Lauer, D.; Messinger, J.; Bouldin, D. Flows of nitrogen and phosphorus on land. In Nitrogen and Phosphorus. Food Production, Waste and the Environment; Porter, K., Ed.; Ann Arbor Science: Ann Arbor, MI, USA, 1975; pp. 123–168. [Google Scholar]
  47. Withers, P.J.A.; Jarvie, H.P.; Stoate, C. Quantifying the impact of septic tank systems on eutrophication risk in rural headwaters. Environ. Int. 2011, 37, 644–653. [Google Scholar] [CrossRef] [PubMed]
  48. Asquith, W.H.; Roussel, M.C.; Vrabel, J. Statewide Analysis of the Drainage-Area Ratio Method for 34 Streamflow Percentile Ranges in Texas: U.S. Geological Survey Scientific Investigations Report 2006–5286. 2006. Available online: https://pubs.usgs.gov/sir/2006/5286/pdf/sir2006-5286.pdf (accessed on 17 July 2019).
Figure 1. (a) The study area is located in the Finger Lakes region of upstate New York in the northeastern U.S., map retrieved from www.dec.ny.gov/lands/29065.html; (b) the 33,086 ha Fall Creek watershed (pink) is a major sub-watershed of the Cayuga Lake watershed. The area in the yellow box is shown in detail in Figure 2a and includes the locations of the single Fall Creek sampling site used in the long-term study and the two Fall Creek sampling sites used in the spatial study. The area in the red box is shown in detail in Figure 2b and includes the locations of the fifteen sampling sites in the northeastern tributaries used in the spatial study. Map provided by the Community Science Institute.
Water 11 02075 g001
Figure 2. (a) Detail of lower Fall Creek. Green dot—location of the single sampling site used in the long-term study; yellow dots—locations of the two Fall Creek sampling sites used in the spatial study; (b) yellow dots—locations of the fifteen sampling sites in the northeastern tributaries used in the spatial study. Maps provided by Nathaniel Launer, Community Science Institute.
Water 11 02075 g002
Figure 3. (a) Annual discharge in Fall Creek, water years 1970–2018; (b) decadal averages of annual Fall Creek discharge with error bars representing ± one standard deviation.
Water 11 02075 g003
Figure 4. (a) Flow-weighted mean SRP concentrations with error bars representing ± one standard error of the mean in the 1970s, and (b) the 2000s; (c) box and whisker plots of flow rates at the time of sampling for samples collected in the 1970s, and (d) the 2000s. Boxes contain first, second, and third quartiles; whiskers show maxima and minima. Sample sizes for each year are shown in Table 3.
Water 11 02075 g004
Figure 5. The proportion of high flow samples and low flow samples captured in each time period. High and low flow strata were demarcated by the 75th percentile of flow when both time periods were combined, which was 20 m3/s.
Water 11 02075 g005
Figure 6. Relationship between SRP concentration and flow rate at the time of sampling for Fall Creek samples collected in the 1970s and in the 2000s. R squared values and equations are shown in blue for 1970s data and red for 2000s data. Bands represent 95% confidence intervals for regression lines.
Water 11 02075 g006
Figure 7. (a) Medians and means of flow rate at the time of sampling; and (b) medians, means, and flow-weighted means of SRP concentration, for Fall Creek samples collected in the 1970s and in the 2000s. Error bars represent ± one standard error. n = 552 for the 1970s time period and 60 for the 2000s time period.
Water 11 02075 g007
Table 1. Comparison of Fall Creek watershed characteristics in the 1970s and first decade of the 2000s, with selected data on dairy farming trends in the representative town of Dryden.
Fall Creek Watershed
1970s2000s
Land Use [19,22]
  • 59% agriculture
  • 34% forest
  • 1% urban
  • 48% agriculture
  • 40% forest/brush
  • 11% urban
Point Sources [22,27]One wastewater treatment plantOne upgraded and one additional wastewater treatment plant
Sewered Population [22,27]14003250
Improved Agricultural Practices/Regulation [26]RareMore widespread
Town of Dryden (243 km2) 1
19772007
Percent of town in dairy farms178
Average size of dairy farms (ha)121234
Number of dairy cows17751540
Milk sold (mill kg)1016
Corn silage per acre (metric tons)1220
1 Data selected or calculated from a longitudinal study of dairy farming in the town of Dryden [37].
Table 2. Comparison of Fall Creek and northeastern tributary watershed characteristics, with selected county level data for Tompkins and Cayuga counties.
Fall CreekNortheastern Tributaries
Watershed Area (ha)33,086Paines and Dean’s1: 5847
Lake Ridge, Mill, and Townline: 3409
Land Use [19]
  • 48% agriculture
  • 40% forest/brush
  • 11% urban
    Paines and Dean’s 1:
  • 73% agriculture
  • 16–19% forest/brush
  • 6–9% urban
    Lake Ridge, Mill, and Townline:
  • 47% agriculture
  • 31% forest/brush
  • 15% urban
Point Sources [27]Two wastewater treatment plants serving 3250 peopleOne wastewater treatment plant serving 900 people
Septic System Density [34]LowerHigher
Tompkins County2Cayuga County3
Land area (km2)12702240
Population per square km 48036
Land in farms (% of county)2941
Average farm size (ha)71108
Dairy cows per square km 5716
Agricultural practices (% farms)
No-till
Reduced till
Cover crop
10
11
12
20
22
21
1 Watershed area and land use data for Dean’s Creek includes the additional minor tributary of Glen Creek [19]; 2 Data selected or calculated from Tompkins County agricultural census profile [39] unless otherwise specified; 3 Data selected or calculated from Cayuga County agricultural census profile [40] unless otherwise specified; 4 Population in 2010 [38]; 5 County level data retrieved from New York State Dairy Statistics 2017 [41].
Table 3. Summary of sampling regime used in the long-term study of soluble reactive phosphorus (SRP) concentration in Fall Creek.
Time PeriodYearNumber of SamplesNumber of Sampling Days
1970s19724024
197322799
197424774
1975138
19782512
2000s20064627
200999
201054
Table 4. Summary of sampling regime used in the spatial study of SRP concentration in Fall Creek and northeastern tributaries.
WaterbodyYearNumber of SamplesNumber of Sampling Days
Fall Creek200995
2010116
2011117
201295
2013116
2014105
2015105
201684
201784
201884
Northeastern Tributaries2009413
2010273
2011353
2012302
2015151
2016151
2017302
2018444
Table 5. Mean SRP concentration plus or minus one standard error (µg/L) in Fall Creek and northeastern tributaries of Cayuga Lake, NY. The 20 m3/s flow rate threshold generated in the long-term study was used to distinguish high flows and low flows in Fall Creek, and was also used as a proxy to classify high and low flows in the northeastern tributaries. The sample size is shown parenthetically.
Mean SRP Concentration (µg/L) ± Standard Error (Sample Size)
Fall CreekNortheastern Tributaries
High Flow Samples 32.8 ± 3.1 (16)183.1 ± 27.5 (29)
Low Flow Samples13.7 ± 1.0 (79)106.6 ± 12.0 (208)
All Samples16.9 ± 1.2 (95)116.0 ± 11.2 (237)

