Assessing the Potential for Potable Water Savings in the Residential Sector of a City: A Case Study of Joinville City


Laboratory of Energy Efficiency in Buildings, Department of Civil Engineering, Federal University of Santa Catarina, Florianópolis, SC 88040-900, Brazil
*
Author to whom correspondence should be addressed.
Water 2019, 11(10), 2074; https://doi.org/10.3390/w11102074
Submission received: 5 July 2019
/
Revised: 19 September 2019
/
Accepted: 24 September 2019
/
Published: 4 October 2019
(This article belongs to the Special Issue Urban Water Accounting)
Abstract
:The objective of this study is to evaluate the potential for potable water savings by using rainwater in the residential sector of Joinville, a city located in southern Brazil. Data on roof areas of residential buildings were obtained from the Joinville city council. By considering the roof areas and typologies of residential buildings, representative models were created. The following parameters were used to determine the rainwater tank capacity: the number of dwellers; the total daily water demand per capita; and the rainwater demand. To carry out the simulations for determining the optimal rainwater tank sizes and potential for potable water savings, the computer program Netuno was used to run 33,720 different scenarios. By considering the occurrence percentage for each representative building model (weighted average), the average potential for potable water savings by using rainwater was calculated. The average potential in the central region of Joinville was 18.5% when there is rainwater use only in toilets, and 40.8% when there is rainwater use in toilets and washing machines. The rainwater harvesting system showed a better performance for a rainwater demand equal to 20% of the total daily water demand. The results indicate the necessity to properly size rainwater tank capacities to meet water demands, thereby encouraging more people to adopt rainwater harvesting as an alternative source for non-potable water in buildings. The demand for rainwater should be carefully evaluated, especially in multi-story residential buildings, due to the low availability of roof areas.
1. Introduction
By 2030, the current world population (7.6 billion) is expected to increase by 13% and reach 8.6 billion [1]. The availability of potable water of adequate quality and quantity is one of the greatest challenges that humanity will face in this century [2]. Water shortage is a problem that deserves significant attention, given the fundamental role of water in human development and economic growth [3]. In several regions of the world, population growth, industrial growth, and climate change have put great pressure on the water resources, thereby necessitating the development of new techniques to tackle the increasing water demand [4,5]. Climate, as well as social and economic changes, has forced society to continually adapt to water shortages [6,7,8]. Various strategies have been developed and improved in the last decades to mitigate water shortage, such as rainwater harvesting [9,10,11,12], greywater use [13], and hybrid rainwater–greywater systems [14].
Many authors have proposed rainwater harvesting to reduce the potable water demand in buildings. Rostad et al. [15] assessed the potential for residential potable water savings in four cities in the United States, namely New York, Philadelphia, Chicago, and Seattle. The use of rainwater in toilet flushing, washing machines, and irrigation has the potential to achieve average potable water savings of 40% in these cities. Several studies have demonstrated the efficiency of rainwater for potable water savings in residential buildings. In Ireland, potable water savings due to rainwater harvesting have been reported to range from 30% to 90% [16]. In Jordan, the savings ranged from 0.27% to 19.7% [17], and in Sweden, the savings ranged from 40% to 60% [18]. In Barcelona, the average potable water savings in residential buildings was 18% [19], and in Brazil, it ranged from 48% to 100% [20]. According to the results of studies focusing on different regions of Brazil, the savings in southern Brazil ranged from 14.7% to 17.7% [21], whereas it was 31% for northeastern Brazil [22]. The reasons for such large ranges in potable water savings are due to the variability on parameters involved on rainwater harvesting, such as roof area, daily rainfall, potable water demand, non-potable water demand, and user behavior.
Many previous researches have shown that rainwater helps reduce potable water consumption. The viability of rainwater harvesting systems depends completely on the roof areas [23]. Regarding the roof area, these studies have been conducted considering: typical roof areas [12]; total roof area of buildings in a chosen region [16]; a specific roof area per person [20]. However, the estimated roof areas may not properly represent reality. Thus, in this study, the potential for potable water savings by using rainwater in residential buildings was estimated considering the roof areas of all residential buildings in a certain region. Thus, instead of a single average roof area for all buildings, the average roof areas of several groups of buildings were considered to take into account the variability of roof areas. This study aims to estimate the potential for potable water savings by using rainwater in houses and multi-story residential buildings in Joinville, southern Brazil.
2. Method
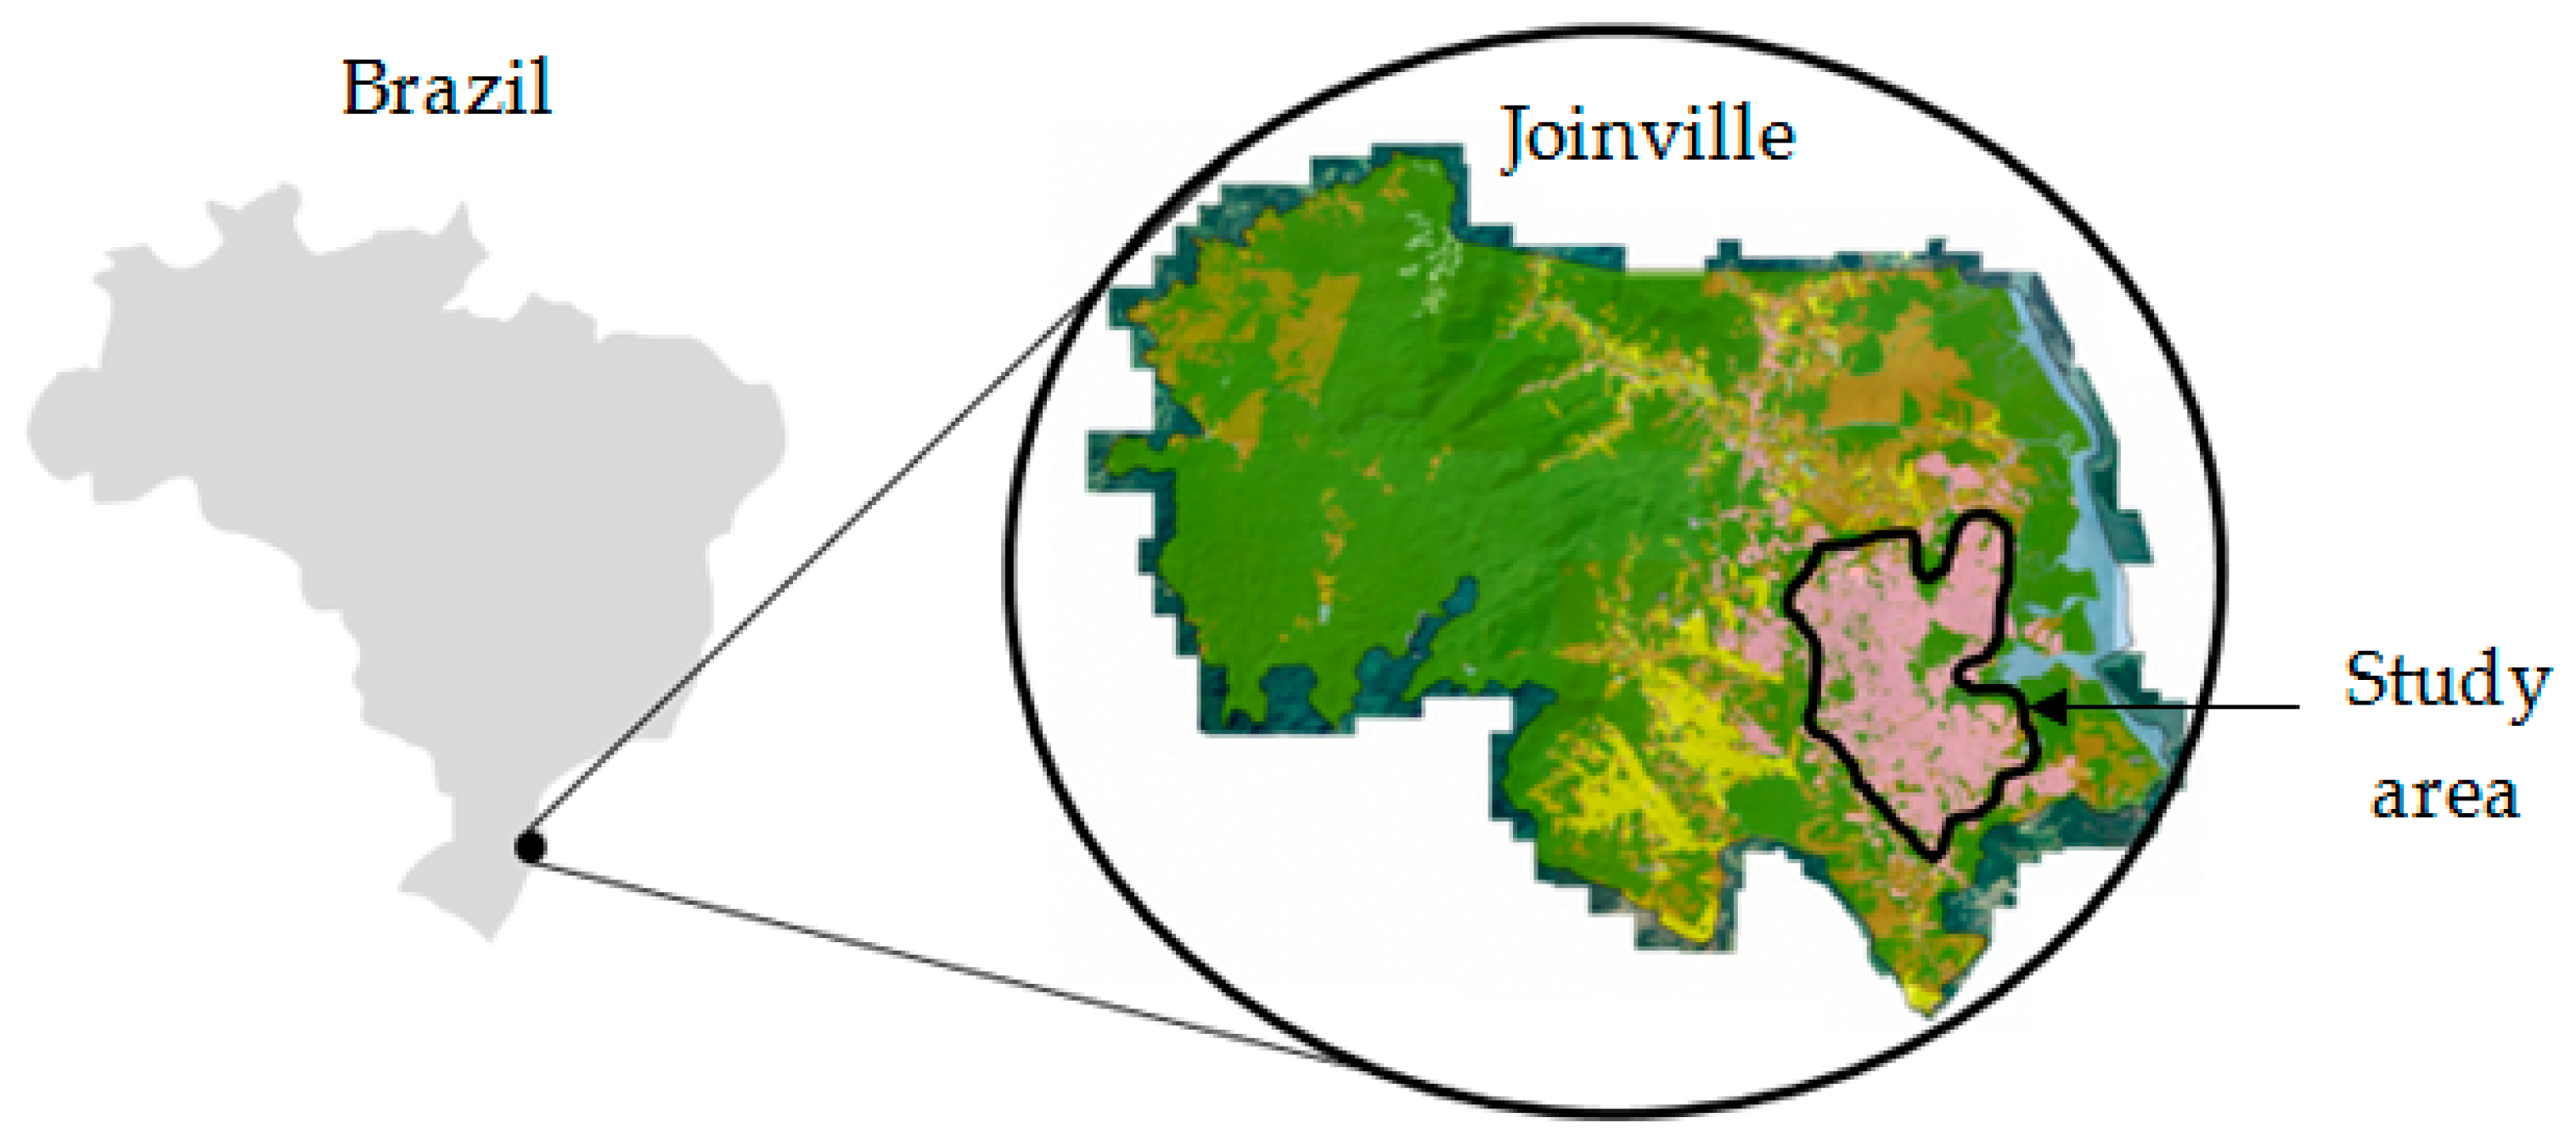
The rainwater tank capacity of each building and the number of buildings in the study area must be determined in order to estimate the potential for potable water savings by using rainwater. The residential buildings in the urbanized area of Joinville were considered for this study, as shown in Figure 1.
The urban region (shown in pink color in Figure 1) comprises 49% of the city’s population [25], 57,946 houses, and 7380 multi-story residential buildings. Therefore, there are 65,326 buildings, which correspond to 40.7% of the total residential buildings in the city. The rainwater tank capacity was estimated using the computer program Netuno. More information about Netuno can be found in [26]. The input data required for the simulations are as follows:
- Daily rainfall;
- Roof area of buildings;
- Number of dwellers per building;
- Total daily water demand per capita;
- Rainwater demand (% of daily water demand);
- Runoff coefficient;
- First flush.
2.1. Daily Rainfall
Daily rainfall was collected from the CCJ (municipal management committee for the Cubatão and Cachoeira River hydrographical basins, located in Joinville) for a 20-year period (1997–2006).
2.2. Roof Areas of Buildings
The roof area is a fundamental parameter in this research, since it collects the rainwater. The city government provided the following data on buildings: Cadastral registration number; building projection area; building typology; building address; number of apartments (for multi-story residential buildings); neighborhood.
Non-residential buildings and all buildings in districts located outside the area studied were excluded from the database (in accordance with the maps of the municipal georeferenced information system). The buildings were grouped according to similar roof areas by means of a frequency distribution analysis. In the first step, the buildings were divided into two groups: Houses and multi-story residential buildings. This grouping is important, since the population, potable water demand, rainwater demand, and roof areas are different for each typology. In the second step, the frequency distribution of the roof areas was calculated. The relative frequencies were obtained using Equation (1).
where is the relative frequency, is the absolute frequency, and i is the total number of observations in each class.
The average roof area of each class represents the class itself. The frequency distribution is used to determine the percentage of buildings that have a specific roof area. The number of classes was defined using Sturges’ equation [27], i.e., Equation (2).
where is the number of classes, and is the total number of observations.
The interval of each class of roof areas was estimated using Equation (3).
where is the amplitude of the sample (m2), is the maximum roof area in the sample (m2), and is the minimum roof area in the sample (m2).
Based on the number of classes and amplitude of the sample, the amplitude of the intervals for each class of roof areas was obtained using Equation (4).
where is the interval amplitude.
Thus, the lower limit of the first range of classes is the minimum value in the sample coverage area. Its upper limit can be calculated using Equation (5).
where is the upper limit of the first range.
For the remaining class intervals, the lower intervals were determined using Equation (6).
where is the lower limit of the nth interval (m2), and is the upper limit of the (n−1)th interval (m2).
The upper limits for each class were estimated using Equation (7).
where is the upper limit of the nth interval (m2), is the lower limit of the nth interval (m2), and is the interval amplitude.
2.3. Number of Dwellers
The total number of people served by the municipal water supply service was obtained from the Water and Sewage Services Diagnosis [28]. Thus, the number of people per dwelling was estimated using Equation (8) [29].
where is the number of people per dwelling, is the number of people served by the municipal water supply service, and is the number of dwellings in the city. In this research, the number of dwellers ranged from 1 to 5 since the average number of dwellers was 3.5 (determined using Equation (8)).
2.4. Total Daily Water Demand
According to the Water and Sewage Services Diagnosis [28], the average potable water consumption in the state of Santa Catarina, where Joinville is located, is 153.6 L/capita/day. The water consumption in residential buildings in Joinville ranged from 129.89 L/capita/day to 335.67 L/capita/day. However, the authors state that most of the buildings consume less than 200 L per person per day [30]. Thus, water demands equal to 110 L/capita/day and 220 L/capita/day were adopted for the rainwater harvesting system design.
2.5. Rainwater Demand
The rainwater demand was chosen considering two scenarios: Rainwater for toilet flushing, and rainwater for washing machines and toilet flushing. The typical water end-uses for residential buildings were taken from the literature (Table 1). For the computer simulations, the rainwater demand was set considering the minimum percentage of potable water demand for toilet flushing (20%) and the maximum percentage of potable water demand for washing machines and toilet flushing (50%).
2.6. Runoff Coefficient
Runoff coefficients equal to 70%, 80%, and 90% were adopted for the different combinations of computer simulation scenarios.
2.7. First Flush
The first flush was set to 2 mm as recommended by the Brazilian Standard NBR 15,527 [36]. The first flush is used to wash the roof area, thereby avoiding the deposition of dirt inside the rainwater tanks.
2.8. Computer Simulation
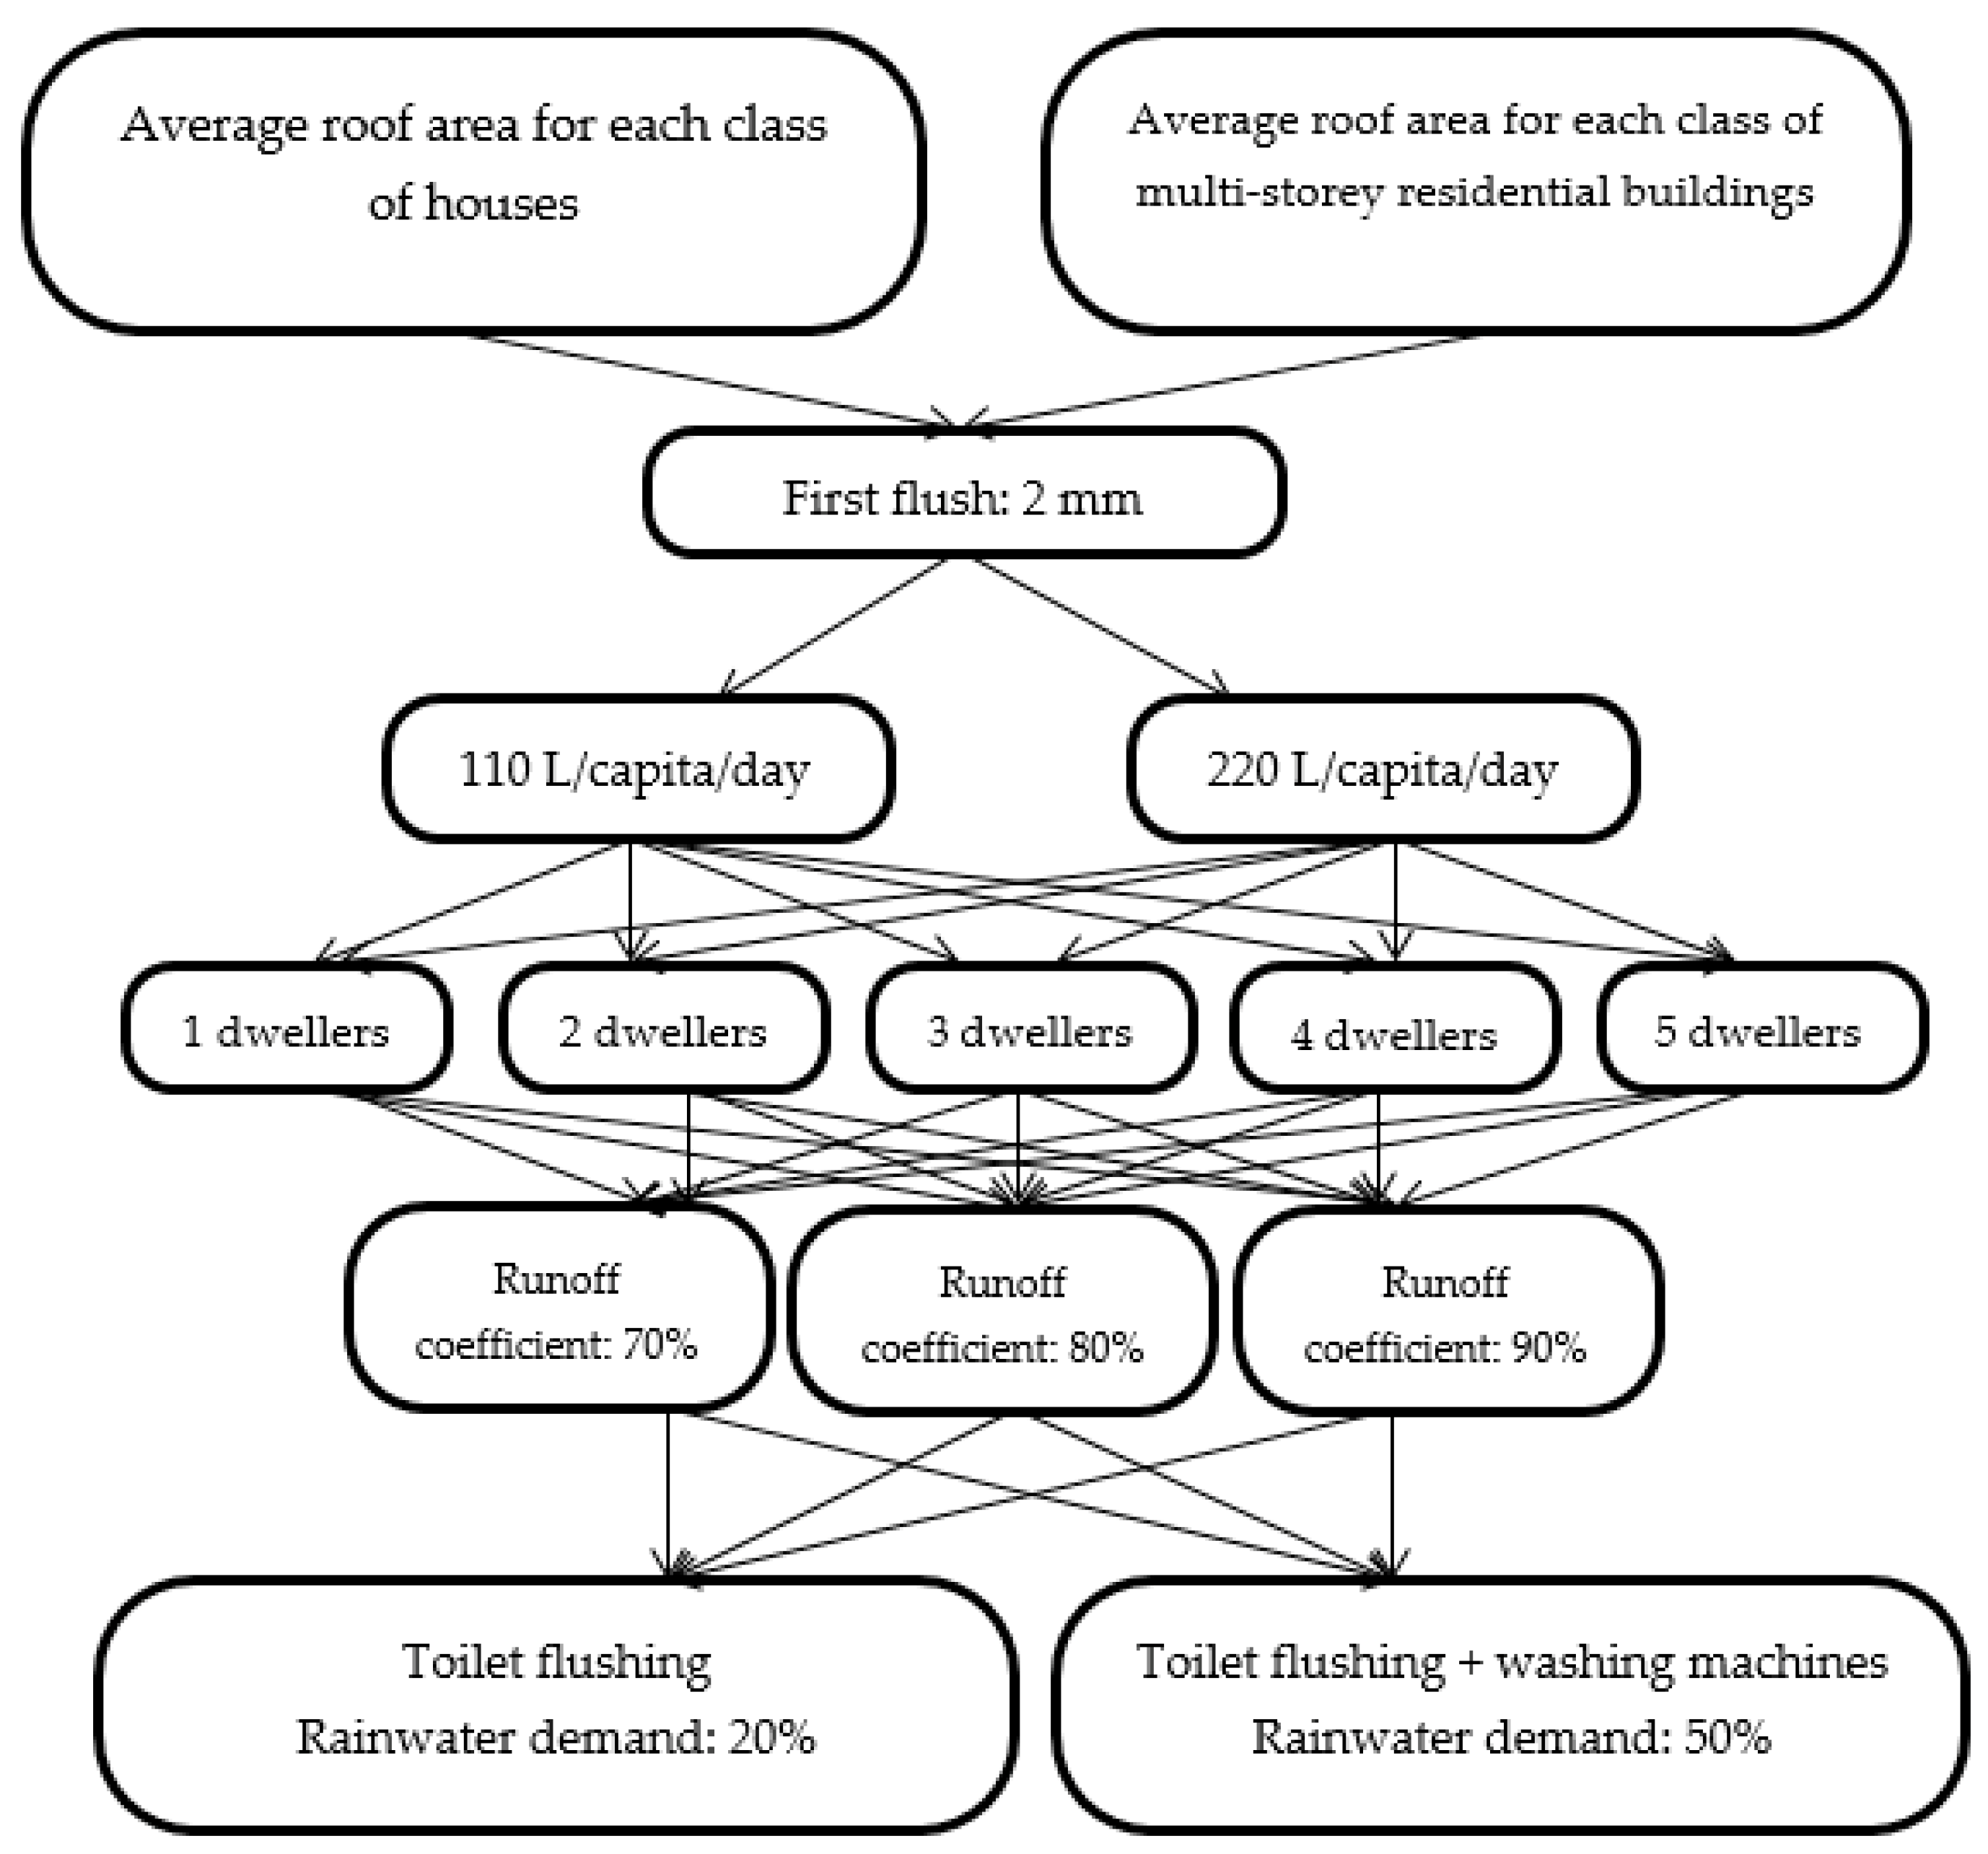
Figure 2 illustrates the combination of multiple scenarios for computer simulations.
Based on the combinations shown in Figure 2, a total of 33,720 cases were created and simulated in Netuno to determine the rainwater tank sizes and potential for potable water savings for each case. The parameters shown in Figure 2 were used as input data for the computer simulations. The capacities of the rainwater tanks were estimated considering the amount of storage needed to cover the daily water consumption for toilet flushing and washing machines.
The Netuno program calculates the potential for potable savings for each rainwater tank size. This function has an asymptotic behavior, and the simulations are conducted in discrete intervals. When the difference between two consecutive potentials was less than 2%/m3, the rainwater tank capacity was considered optimal. The difference between the various potentials for potable water savings by using rainwater is defined as shown in Equation (9) [26].
where is the difference between the potential for potable water savings by using rainwater (%/m2), is the variation in the potential for potable water savings by using rainwater in two consecutive simulated tanks, and is the variation in minimum rainwater tank capacity (m3).
The difference between the potential for potable water savings by using rainwater was set to 2%/m3. The rainwater tank sizes were simulated at 500 L intervals, considering a minimum of 0 L and a maximum of 50,000 L. Finally, the average potential for potable water savings by using rainwater in the region studied was obtained using Equation (10).
where is the average potential for potable water savings by using rainwater in the region studied (%), is the potential for potable water savings by using rainwater in the ith building class according to the frequency analysis, and is the percentage of the ith building class in the frequency distribution in relation to the total number of buildings in the region.
3. Results and Discussion
For each representative building group, the rainwater tank capacities and potential for potable water savings by using rainwater were calculated using Netuno. Each building was represented by an average roof area and simulated for all scenarios shown in the previous section.
3.1. Daily Rainfall
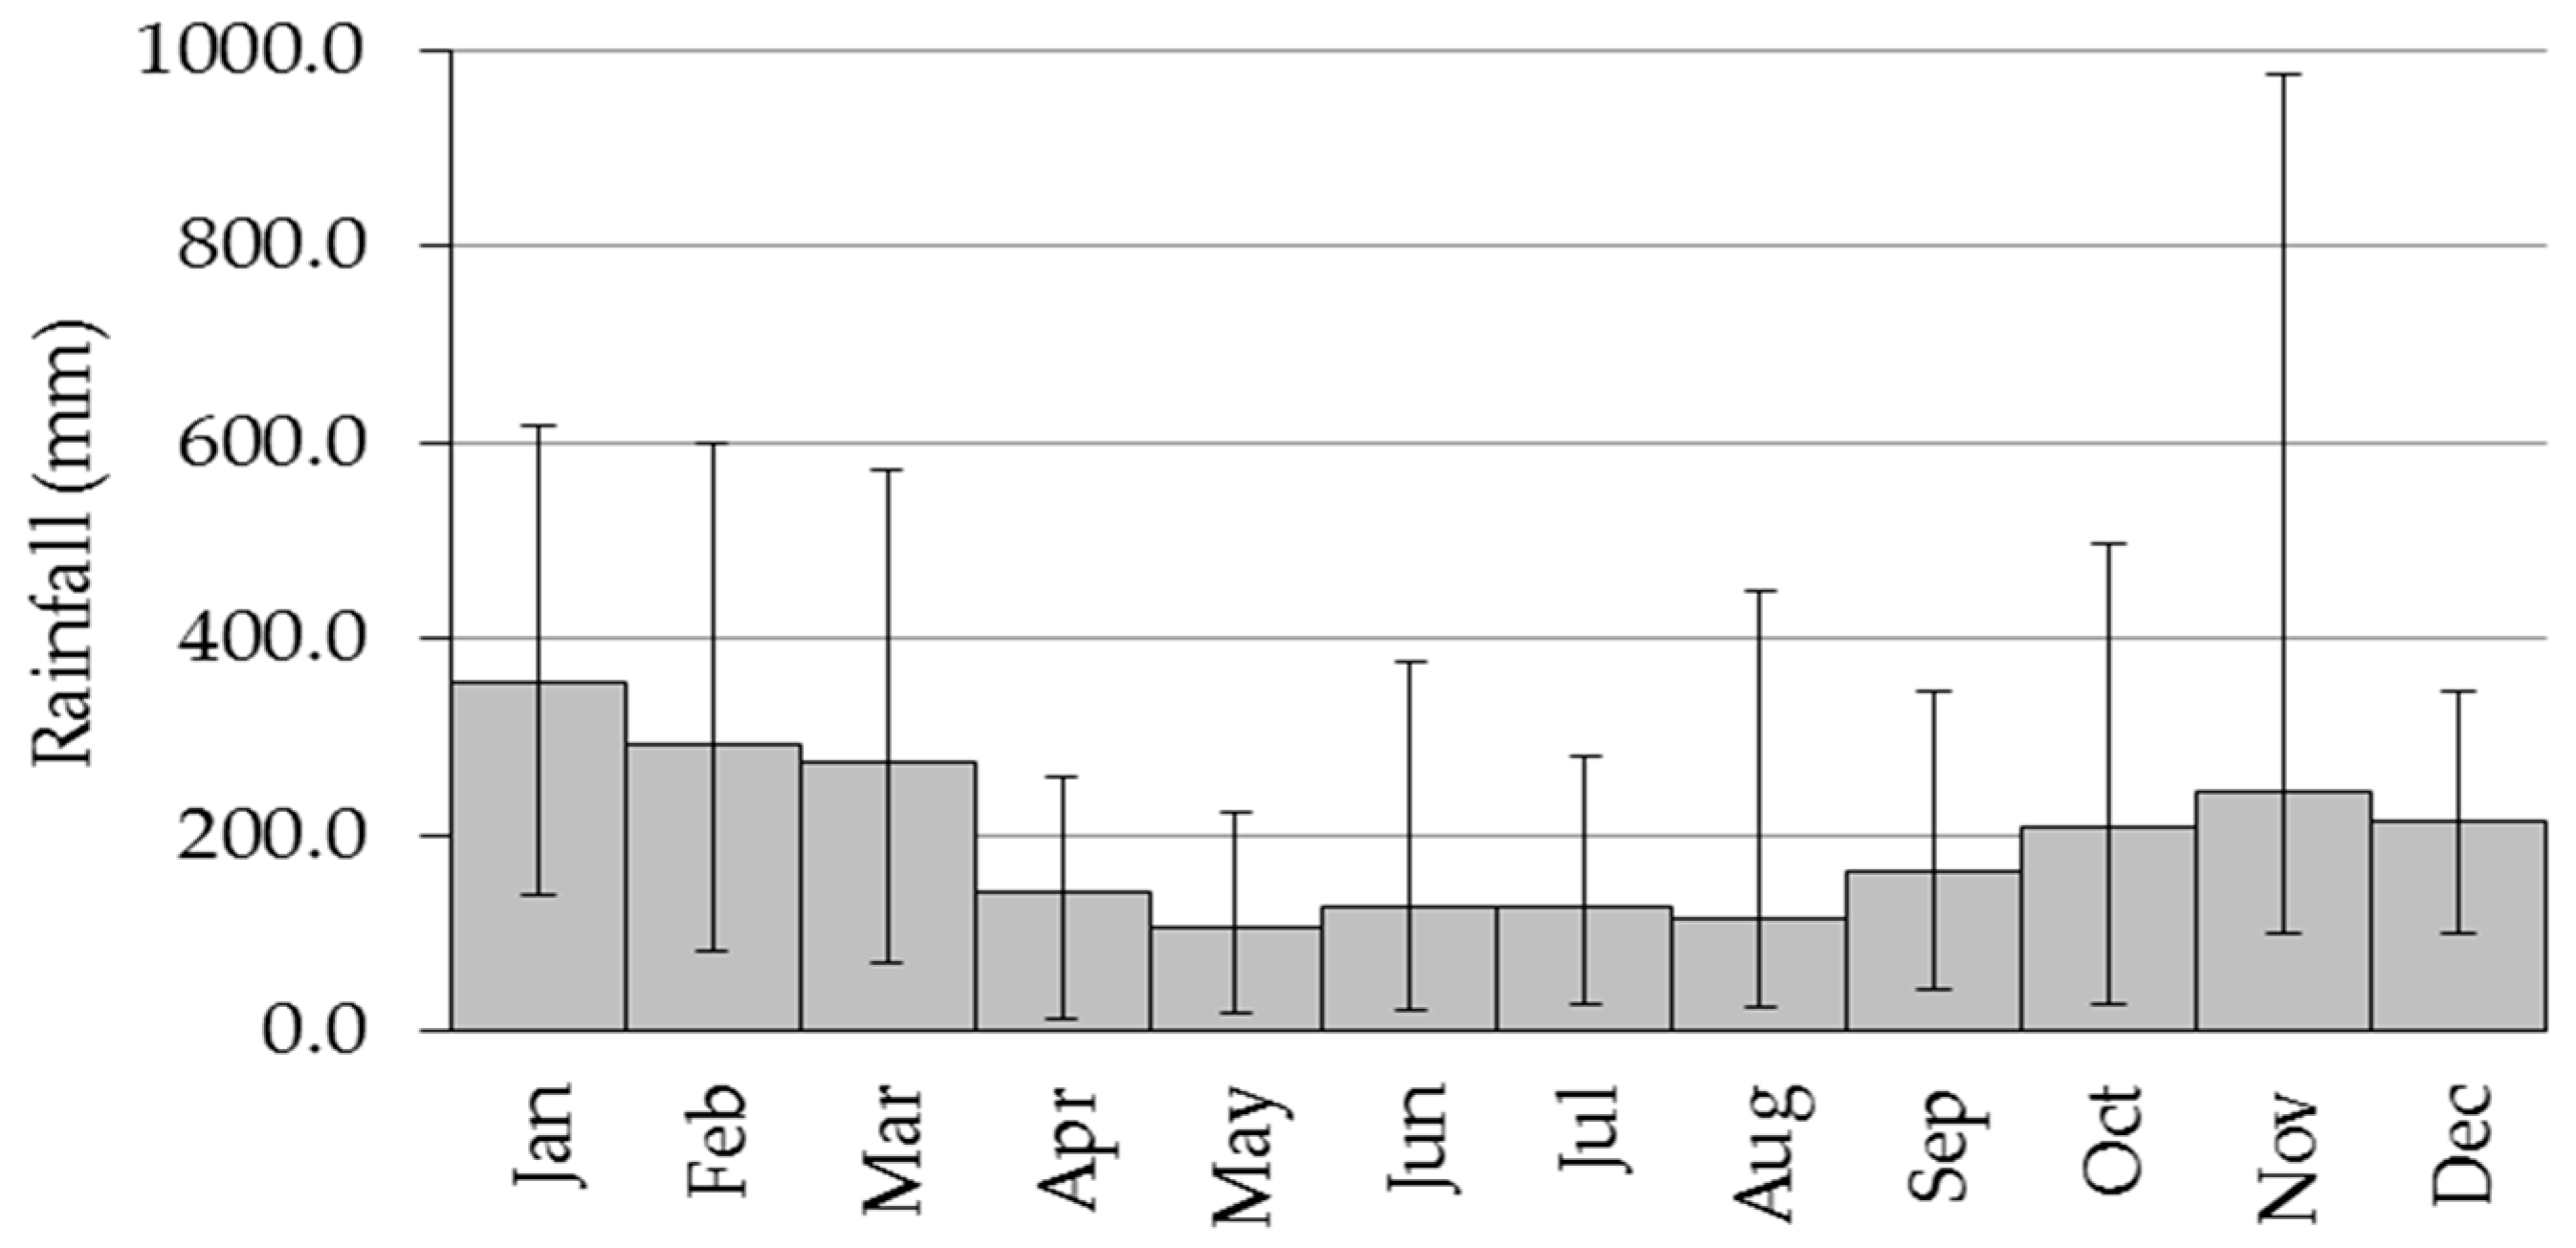
The daily rainfall data was used as input to Netuno. The average annual rainfall for the region studied was 2358 mm. Figure 3 shows the minimum and maximum rainfall for the last twenty years for each month of the year. The maximum rainfall observed in November 2008 was 974 mm. The minimum rainfall observed in April 2000 was 12 mm. This variability on average monthly rainfall demonstrates the necessity to use models that consider daily rainfall, such as the Netuno program.
3.2. Roof Area
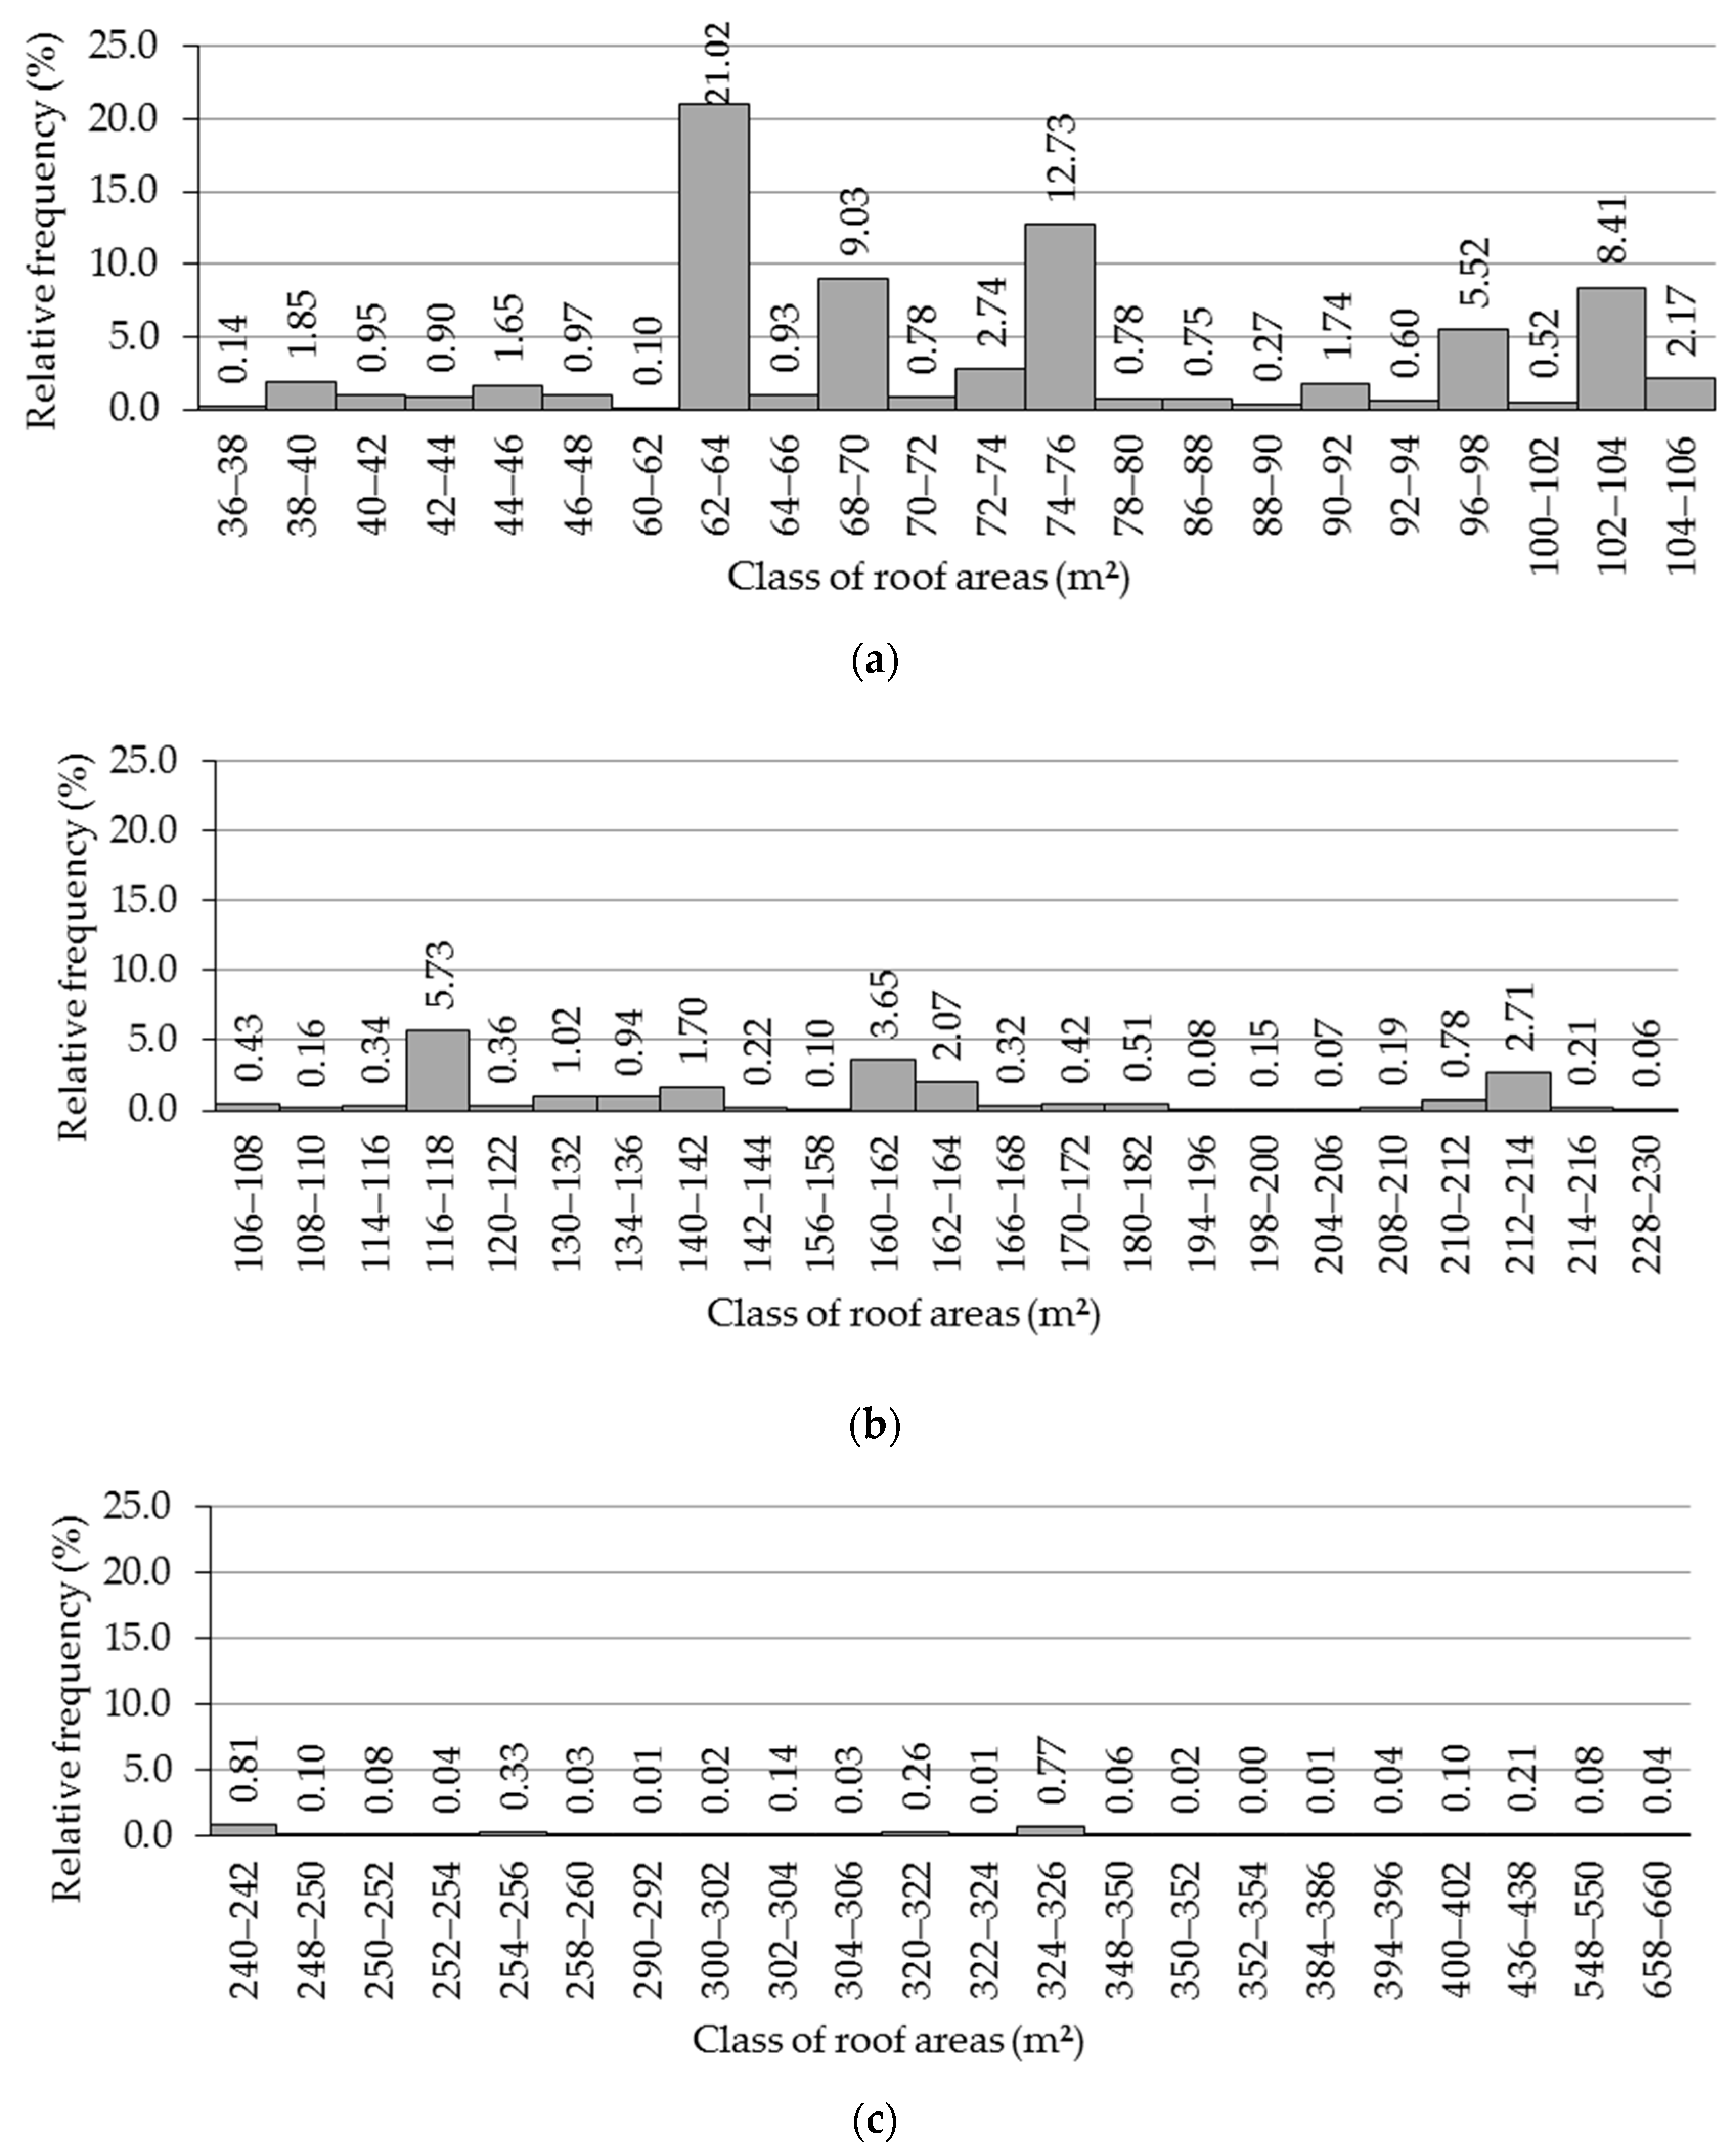
Figure 4 shows the frequency distribution for each house class concerning the relative frequency percentage for all houses in the area studied. According to the results, 21.0% of the houses have an average roof area equal to 63.3 m2, 12.7% have an average roof area equal to 75.1 m2, 9.0% have an average roof area equal to 69.0 m2, 5.5% have an average roof area equal to 97.2 m2, 8.4% have an average roof area equal to 103.2 m2, and 5.7% have an average roof area equal to 117.0 m2. Regarding the rest, the relative frequency percentage was between 0–5%. In Philadelphia, USA, it was observed that the most common roof areas were in the range of 50–60 m2 [12]. In New York, most houses had roof areas between 80–90 m2 [12]. In this study, the average roof area of 57,946 houses was 101.6 m2. The average roof area was not considered to calculate the potential for potable water savings by using rainwater. The average roof area has a standard deviation equal to 61.5 m2, which could cause errors in the calculation of the rainwater tank sizes. The frequency distribution was used (Section 2.2).
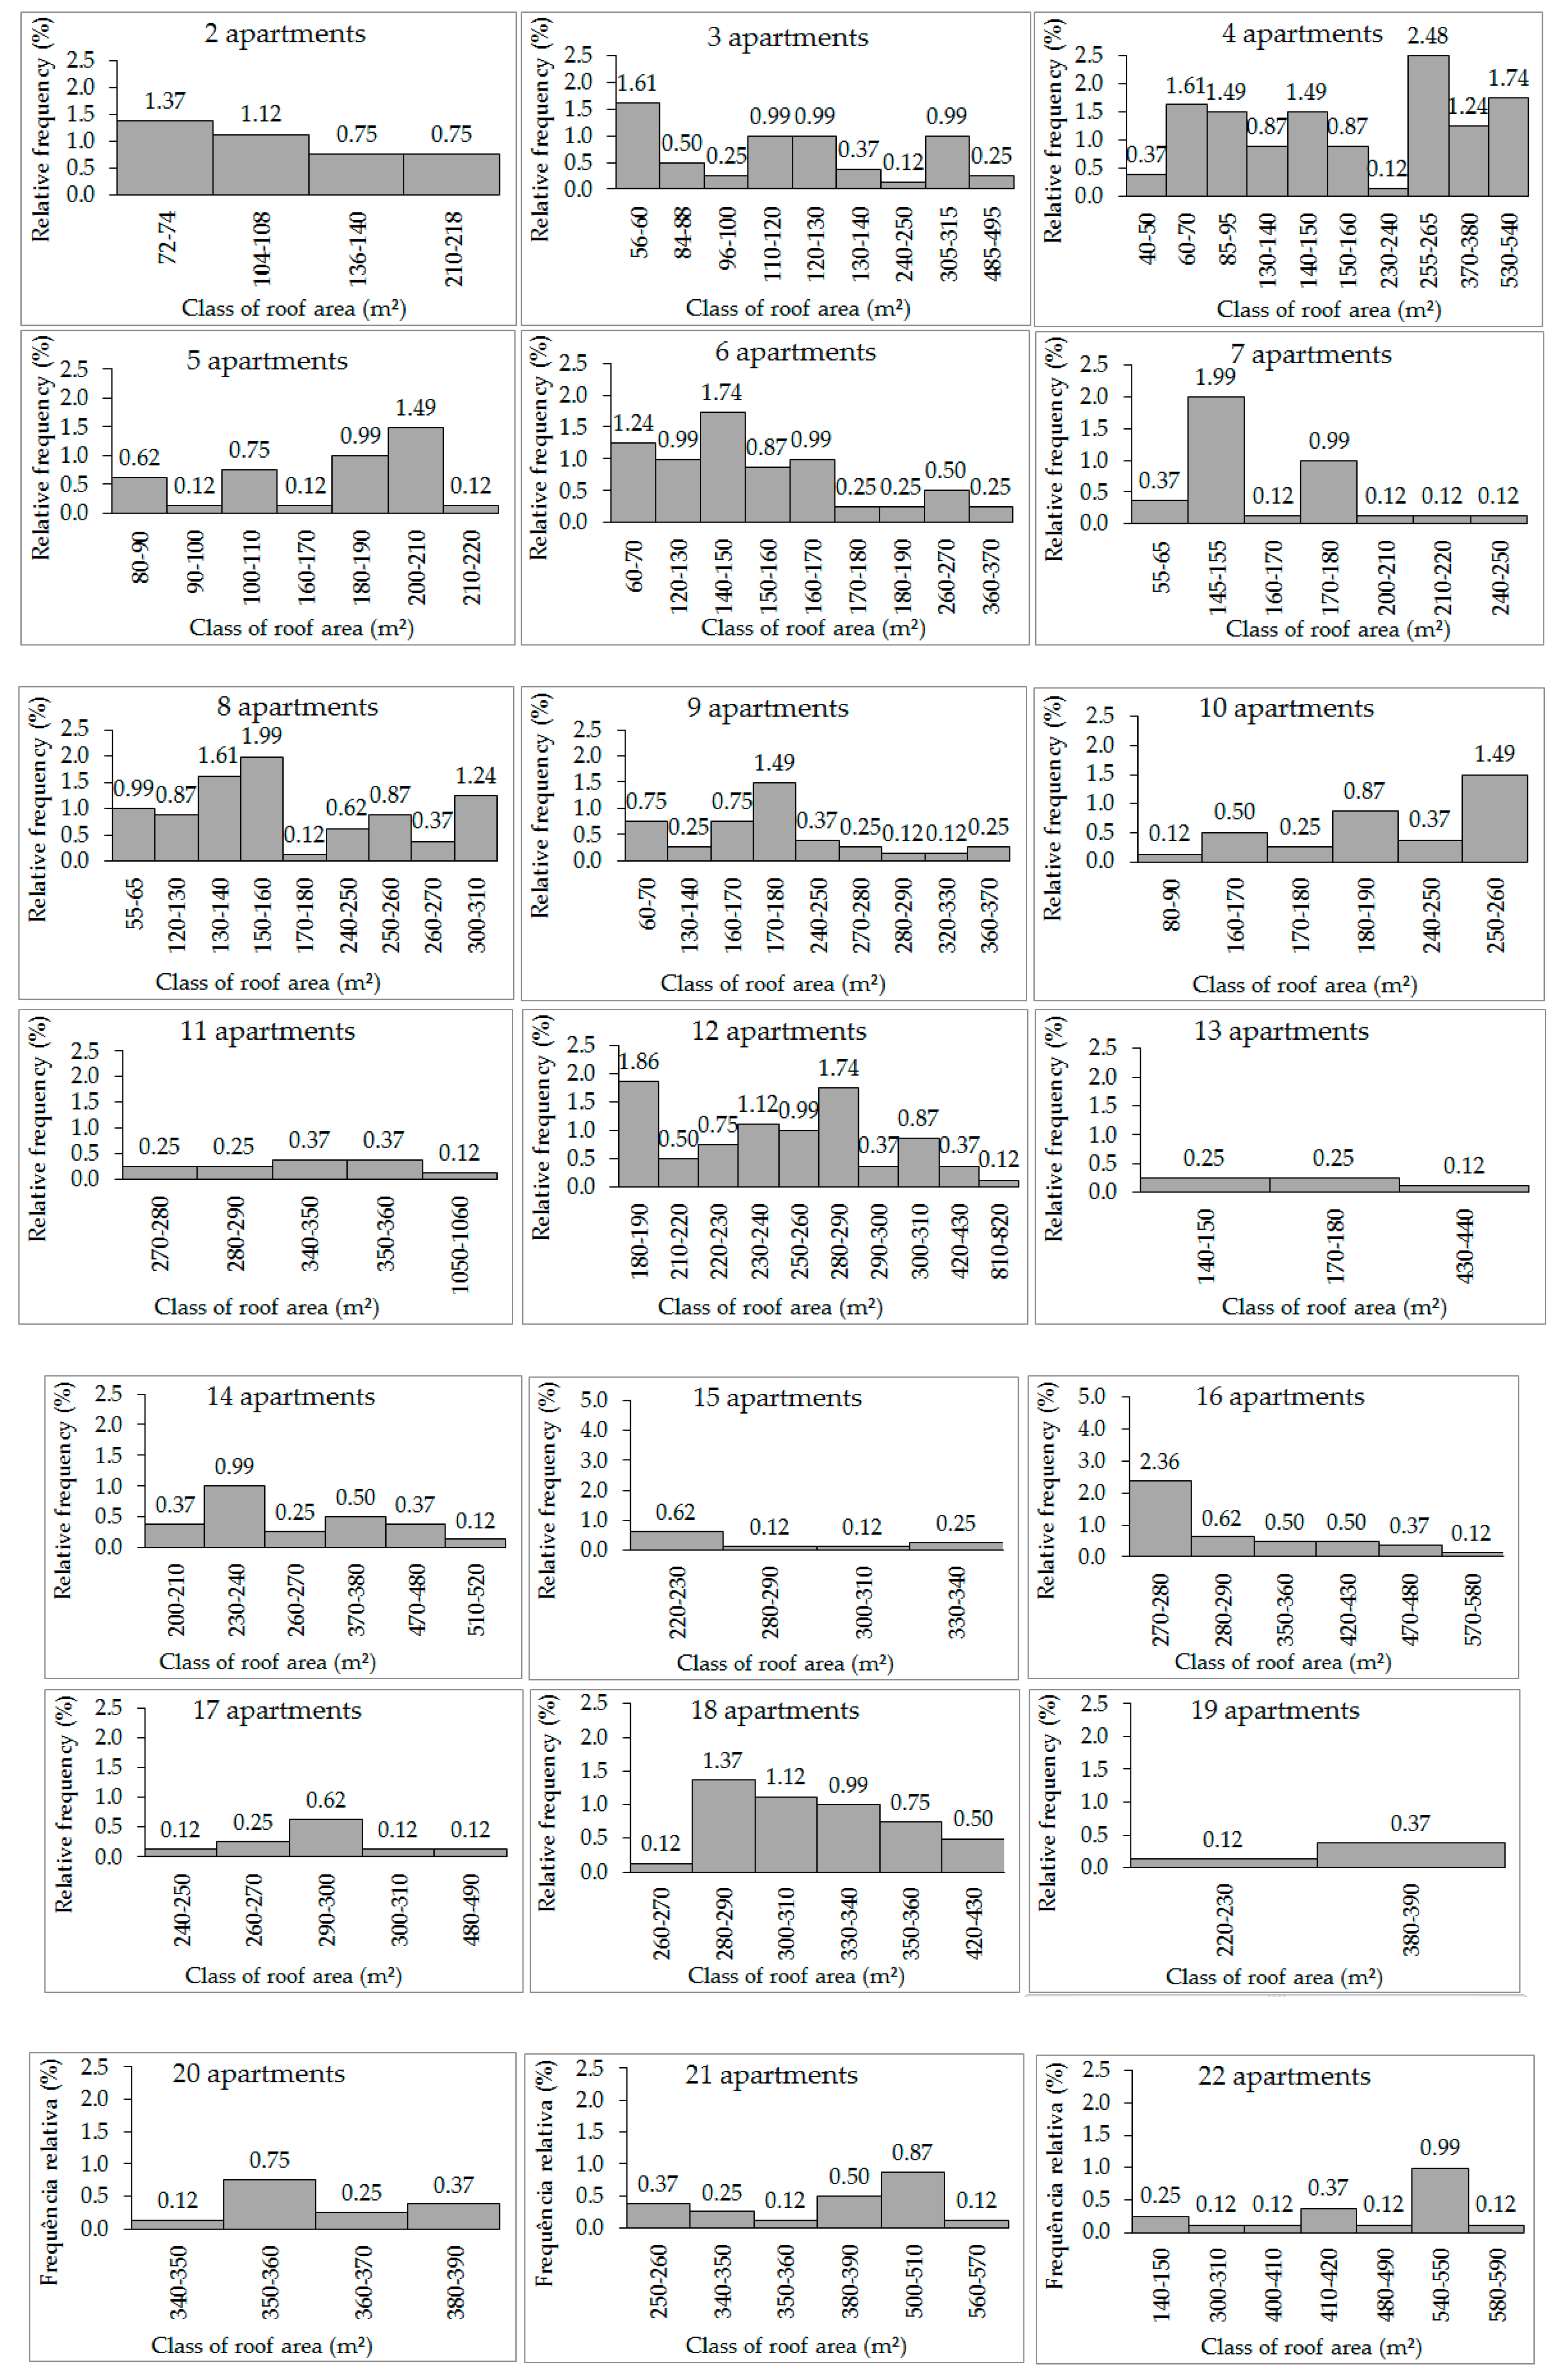
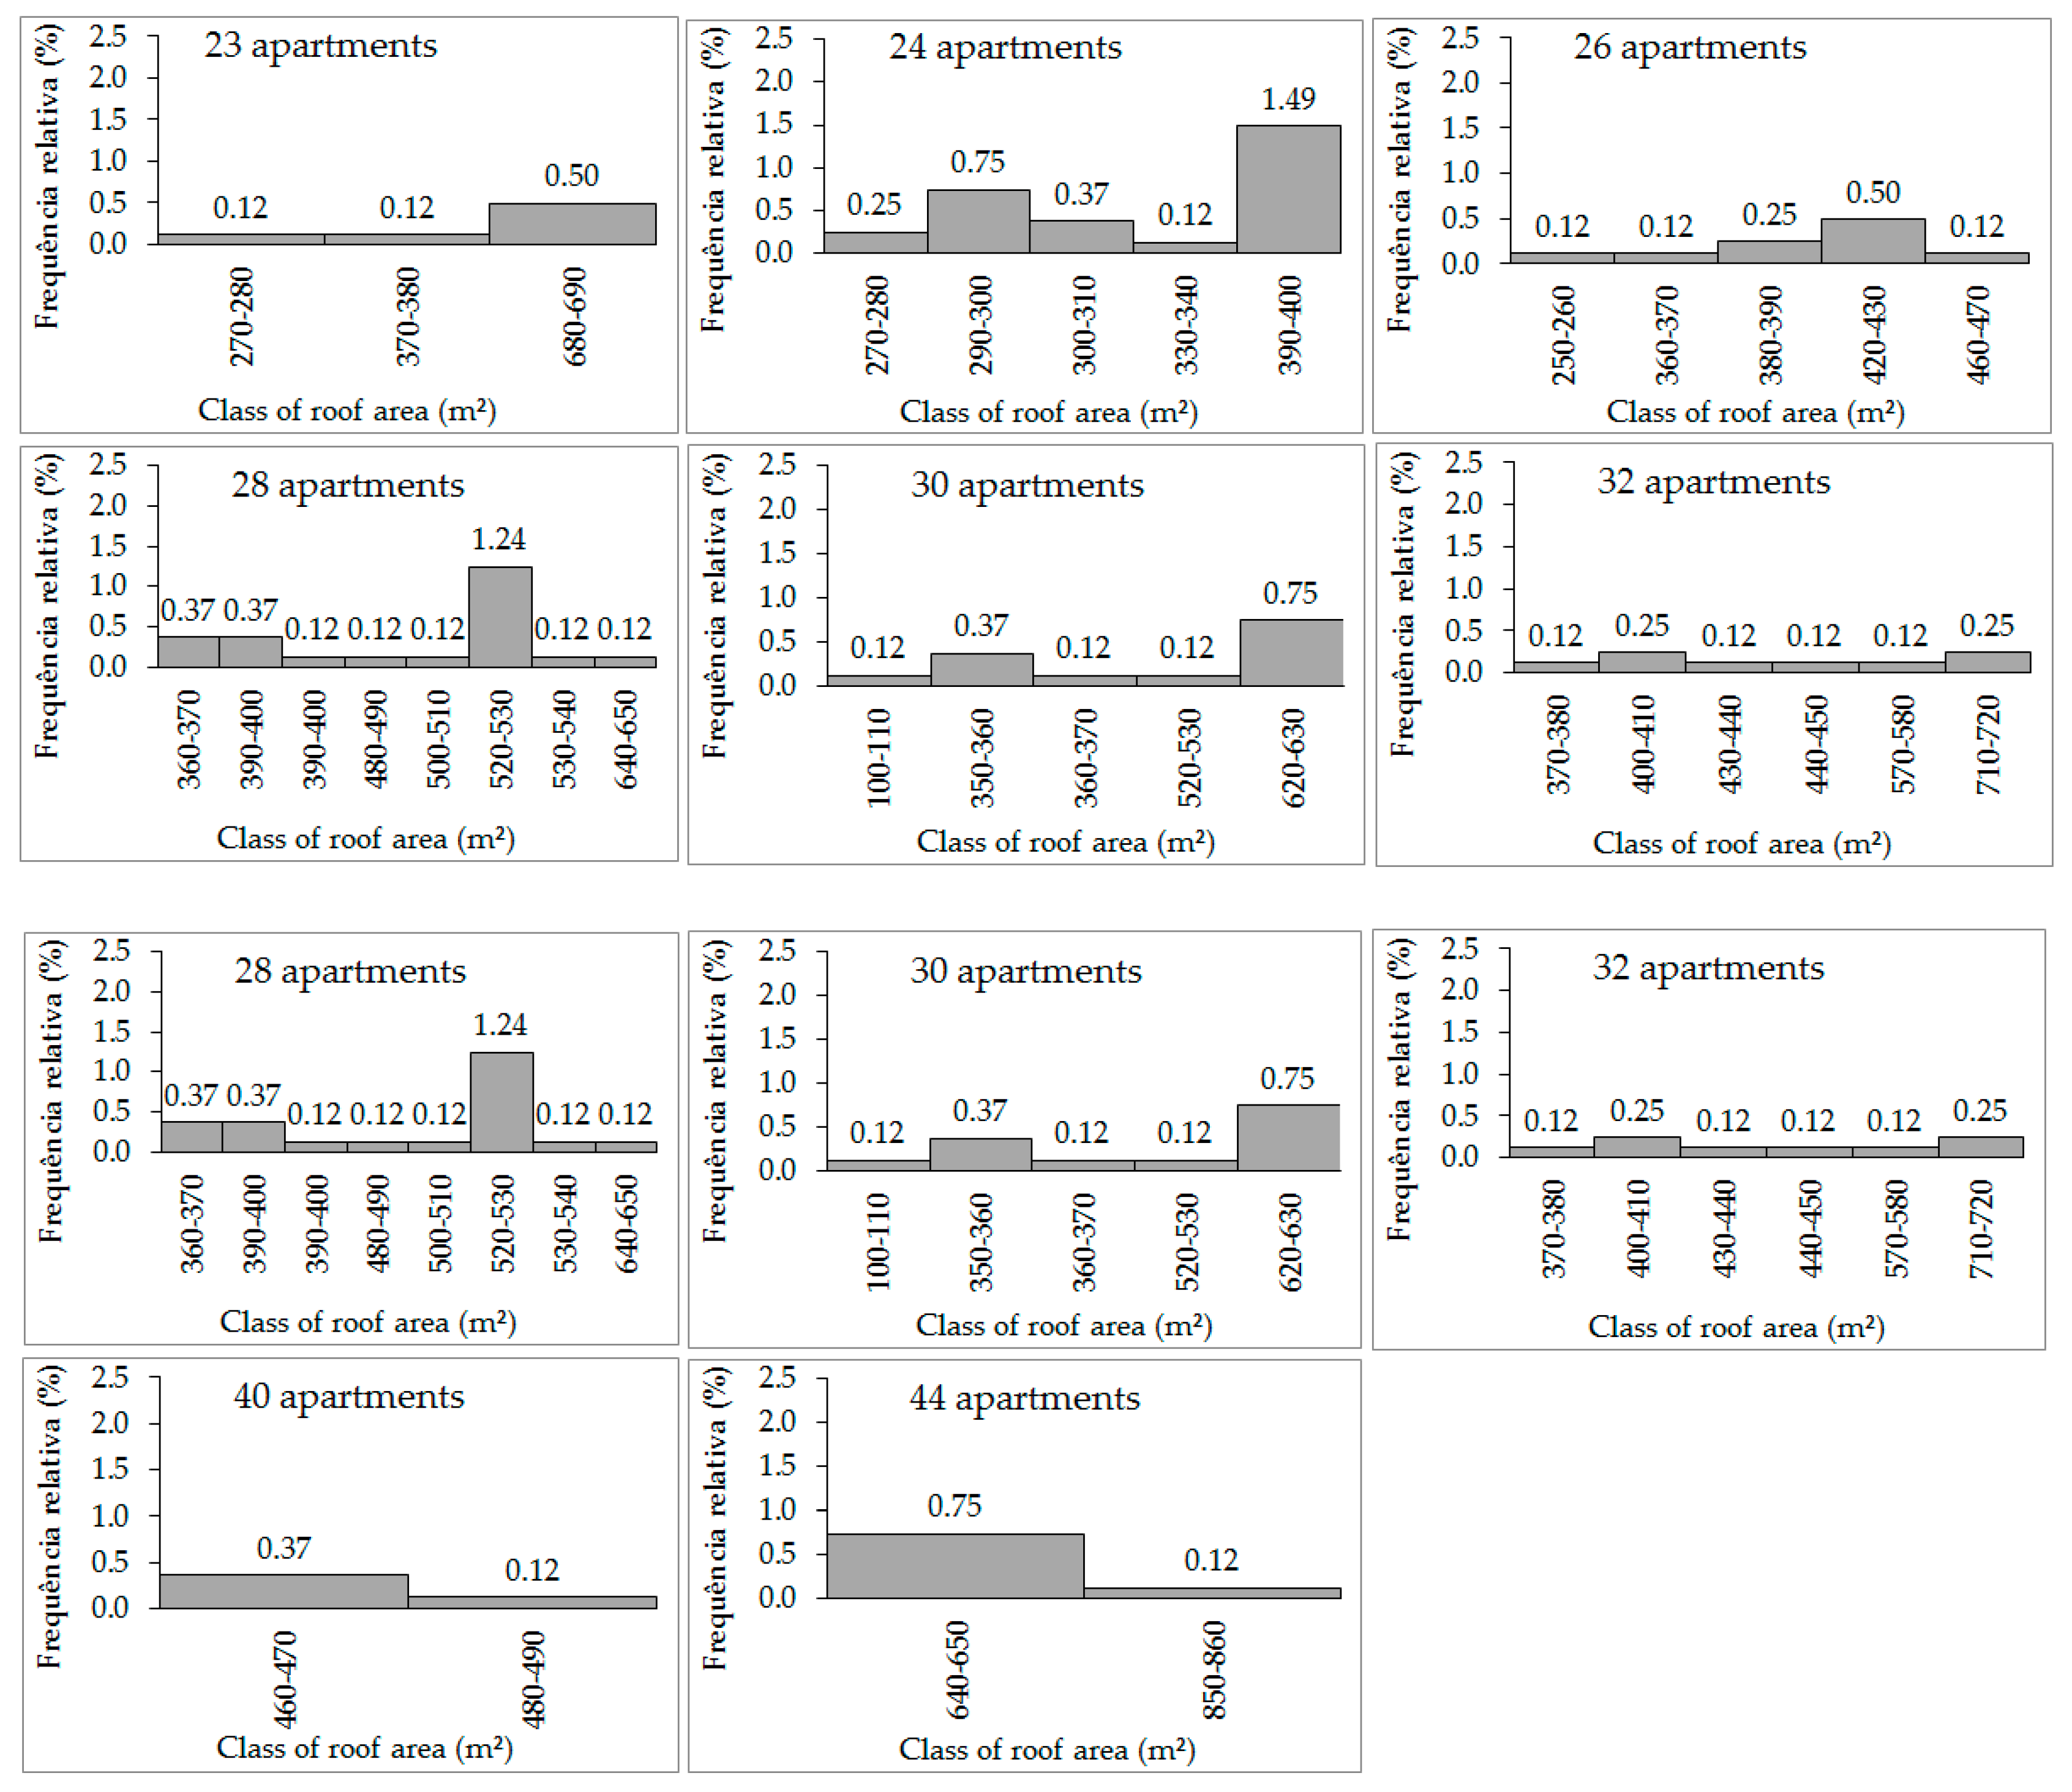
Figure 5 shows the frequency distribution for each multi-story residential buildings class concerning the relative frequency percentage for all multi-story residential buildings in the area studied. The number of apartments for each multi-story residential buildings was considered to estimate the number of dwellers of these buildings.
The number of dwellings in each multi-story residential building was considered for grouping the buildings. However, multi-story residential buildings with an absolute frequency equal to 1 also exist. These buildings and their roof areas are shown in Table 2.
3.3. Potential for Potable Water Savings by Using Rainwater
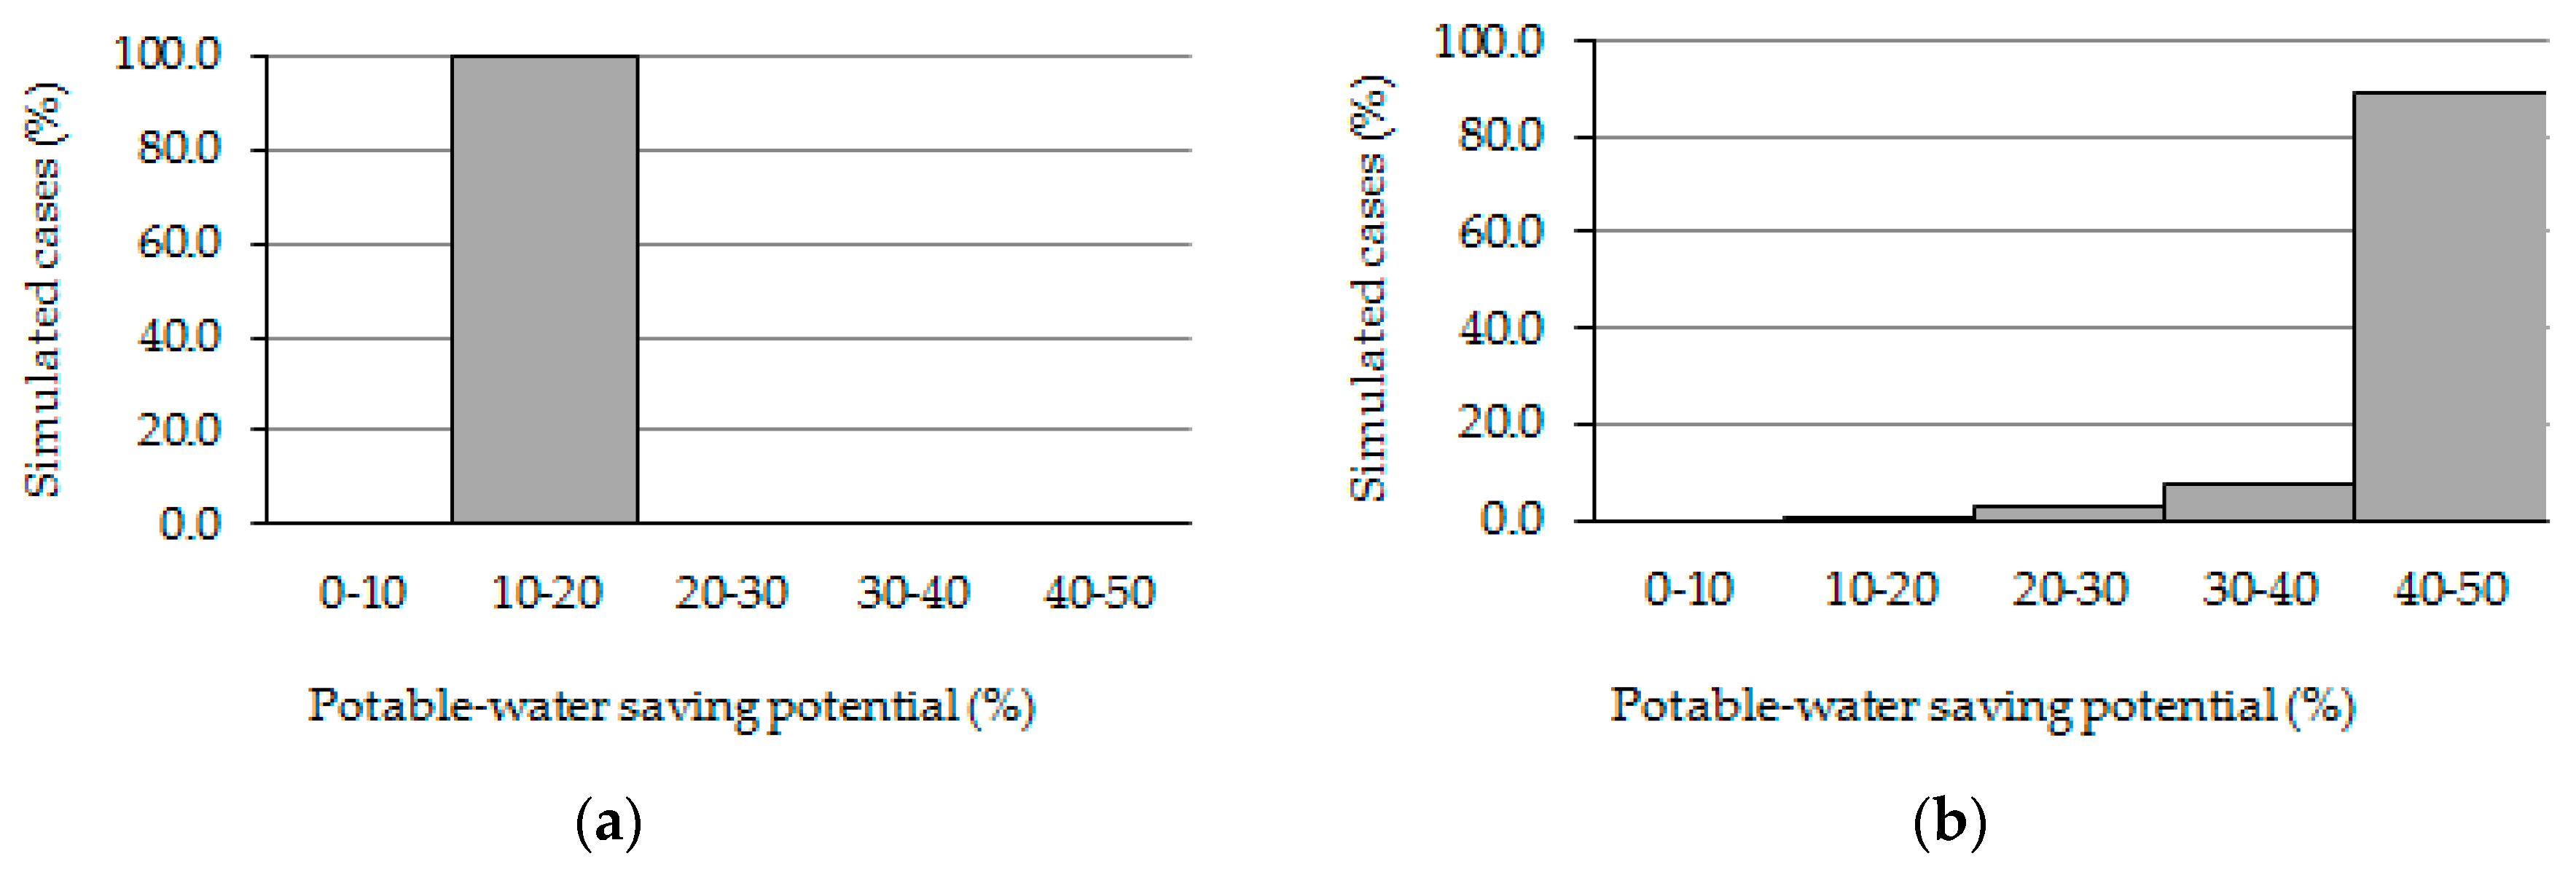
Figure 6 presents a frequency histogram of the potential for potable water savings by using rainwater for 7200 cases involving houses simulated using Netuno. The 7200 cases were obtained by combining the 67 classes of roof areas and other parameters for the rainwater tank sizing: Potable water demand, rainwater demand, number of dwellers, and runoff coefficient. According to Figure 6a, for a rainwater demand of 20%, approximately 99.8% of the cases have a potential for potable water savings equal to 10–20%. In Figure 6b, for a rainwater demand equal to 50%, approximately 90.0% of the cases have a potential for potable water savings equal to 40–50%.
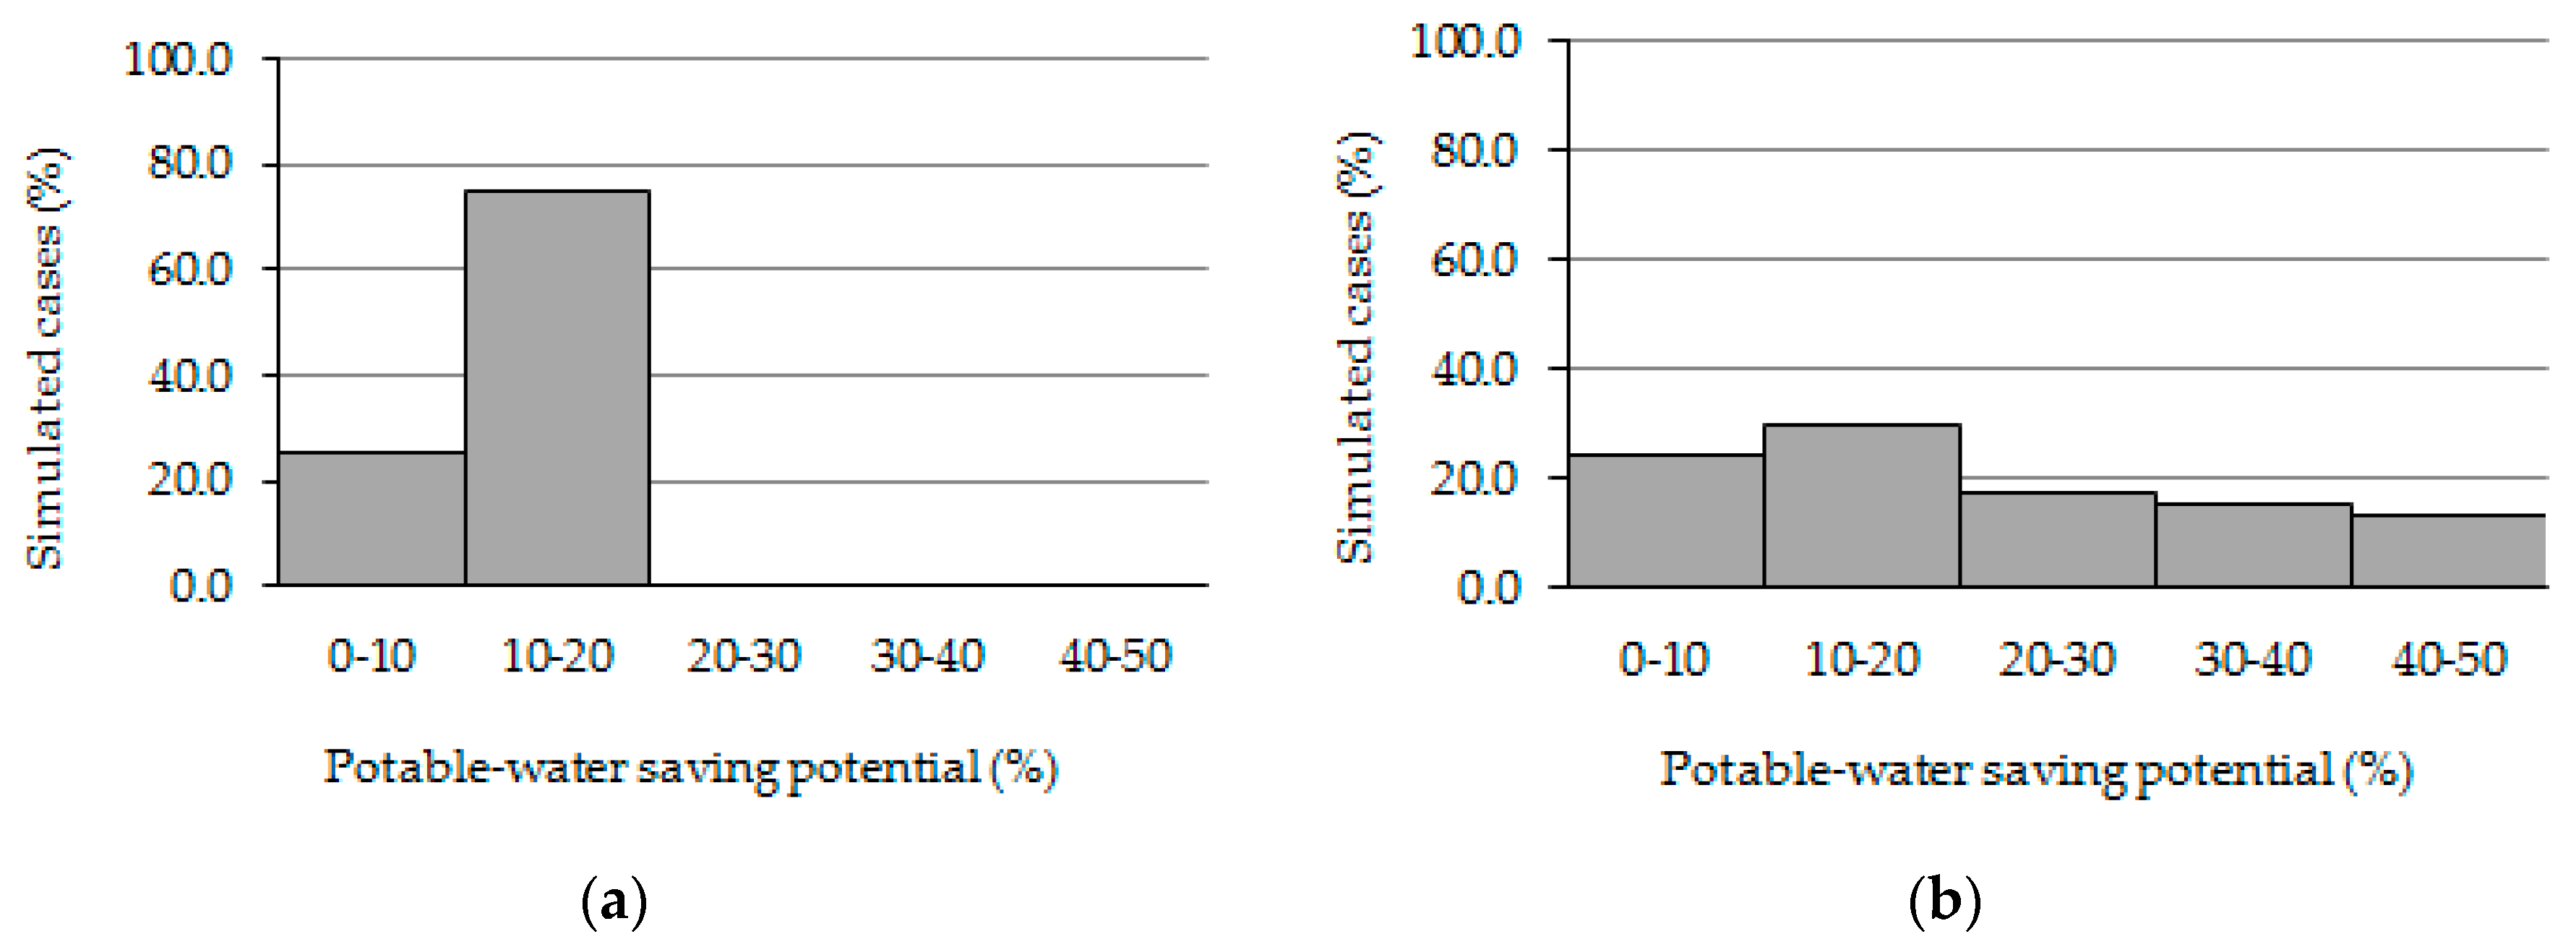
Despite only 7380 multi-story residential buildings, the number of classes per roof area is greater than that for houses, due to the high number of apartments. Whereas 67 classes were created for houses, 235 classes were created for multi-story residential buildings considering the roof areas and the number of apartments, which influence the number of dwellers. This consideration and the parameters for rainwater tank sizing (Section 2) led to the generation of 26,520 simulations for multi-story residential buildings. In Figure 7a, for a rainwater demand equal to 20%, approximately 75.1% of cases for multi-story residential buildings have a potential for potable water savings equal to 10–20%. However, in Figure 7b, for a rainwater demand equal to 50%, only 13.3% of the cases have a potential for potable water savings equal to 40–50%; this means that supplying the rainwater demand to these buildings requires an increase in the roof area.
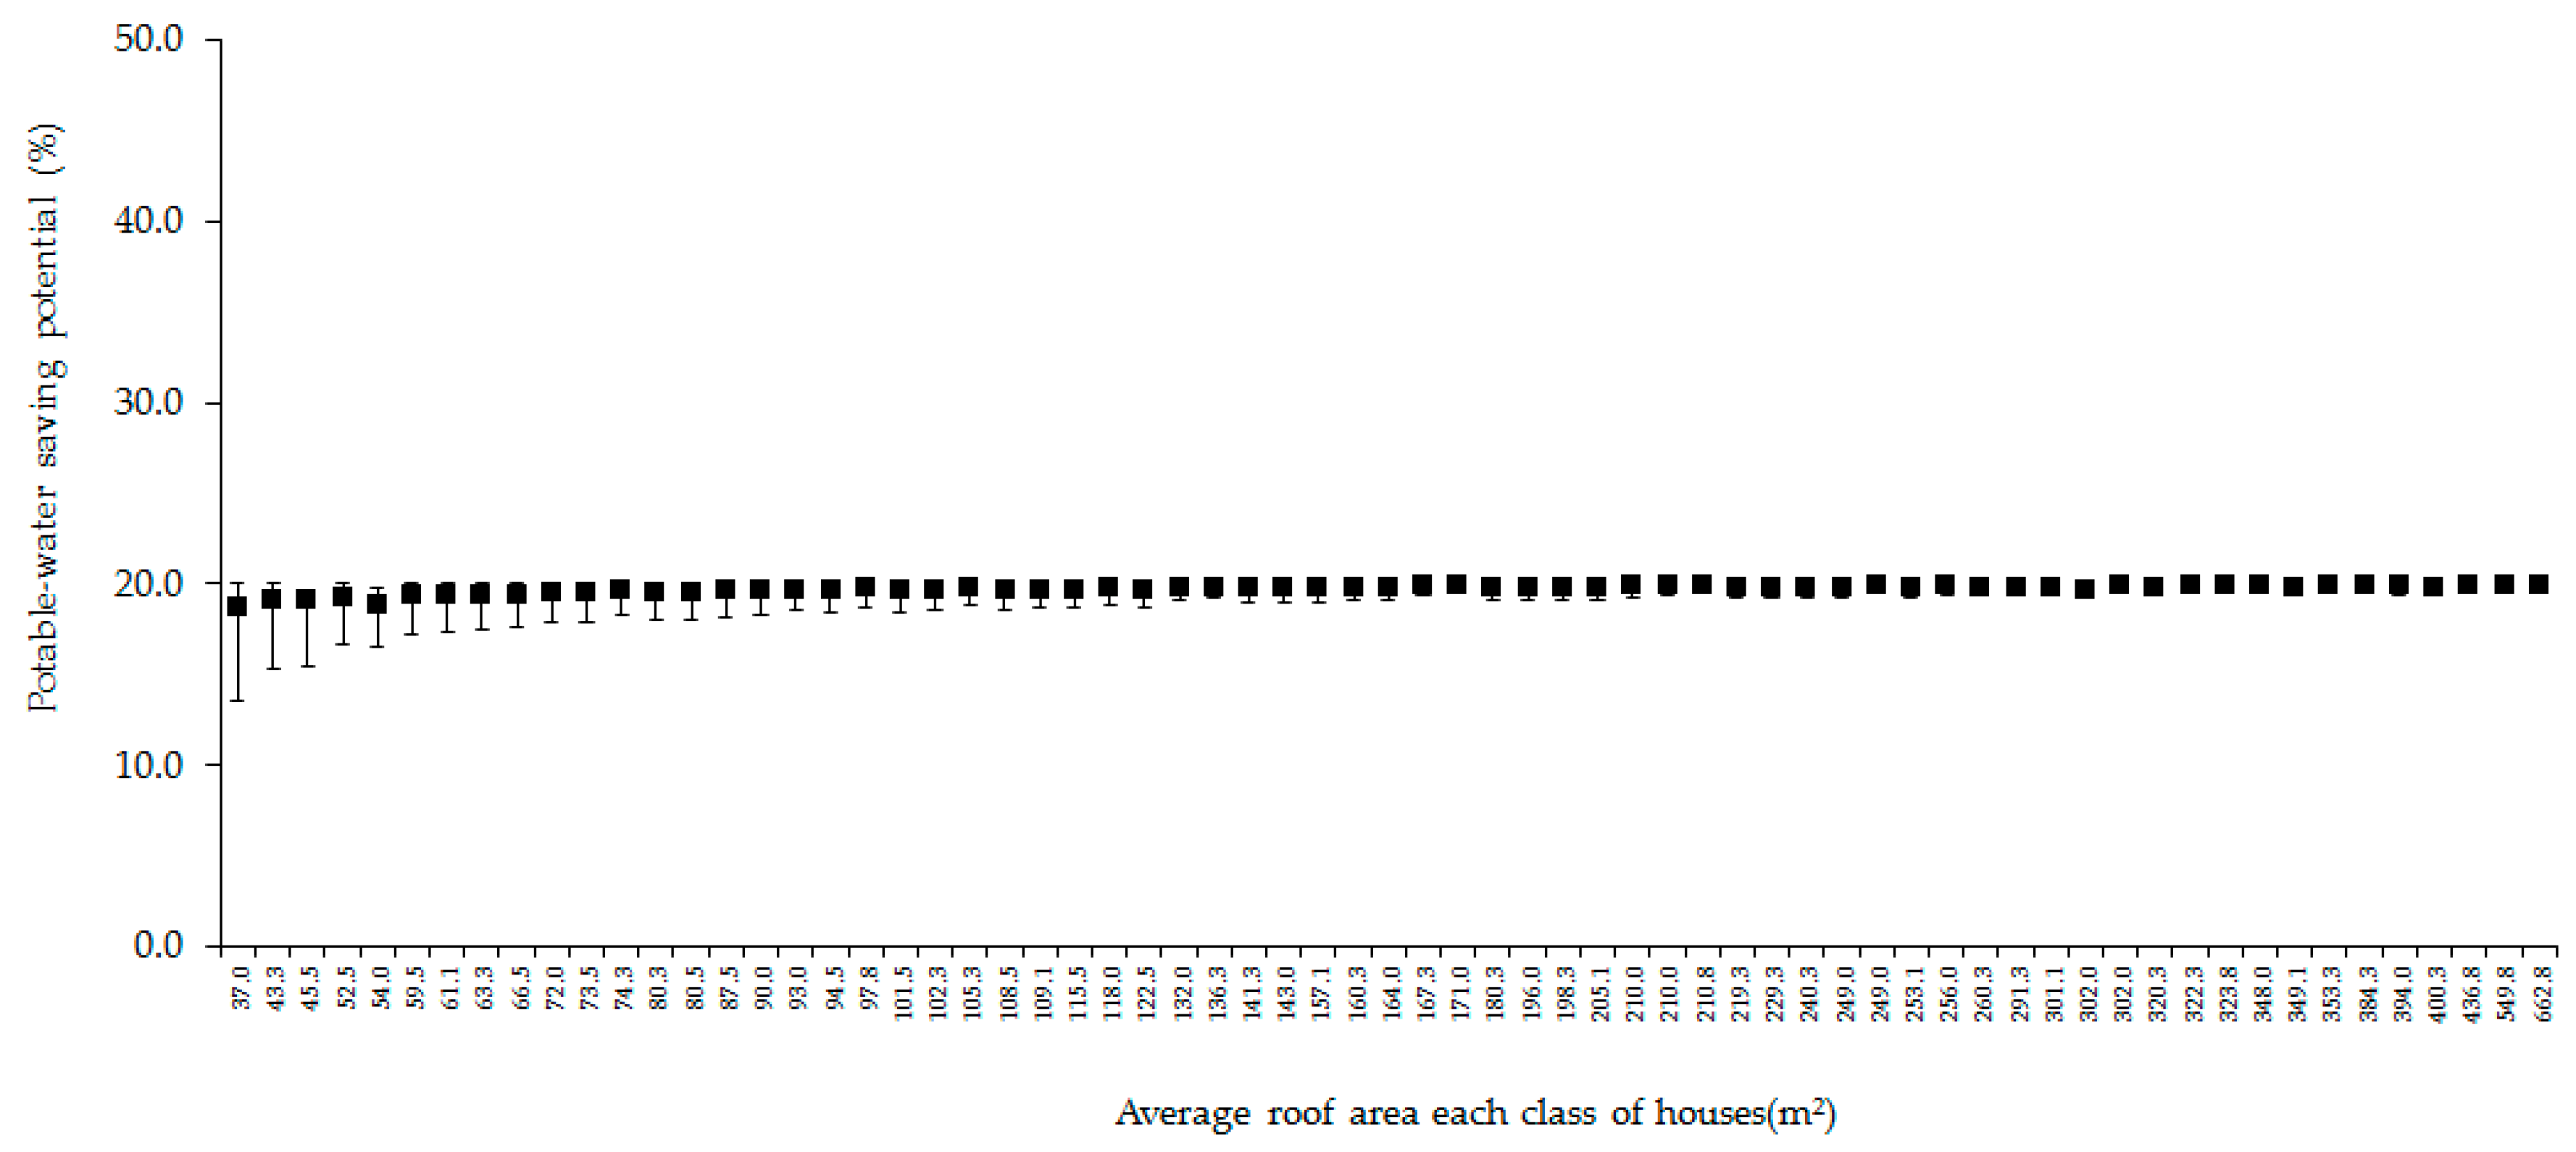
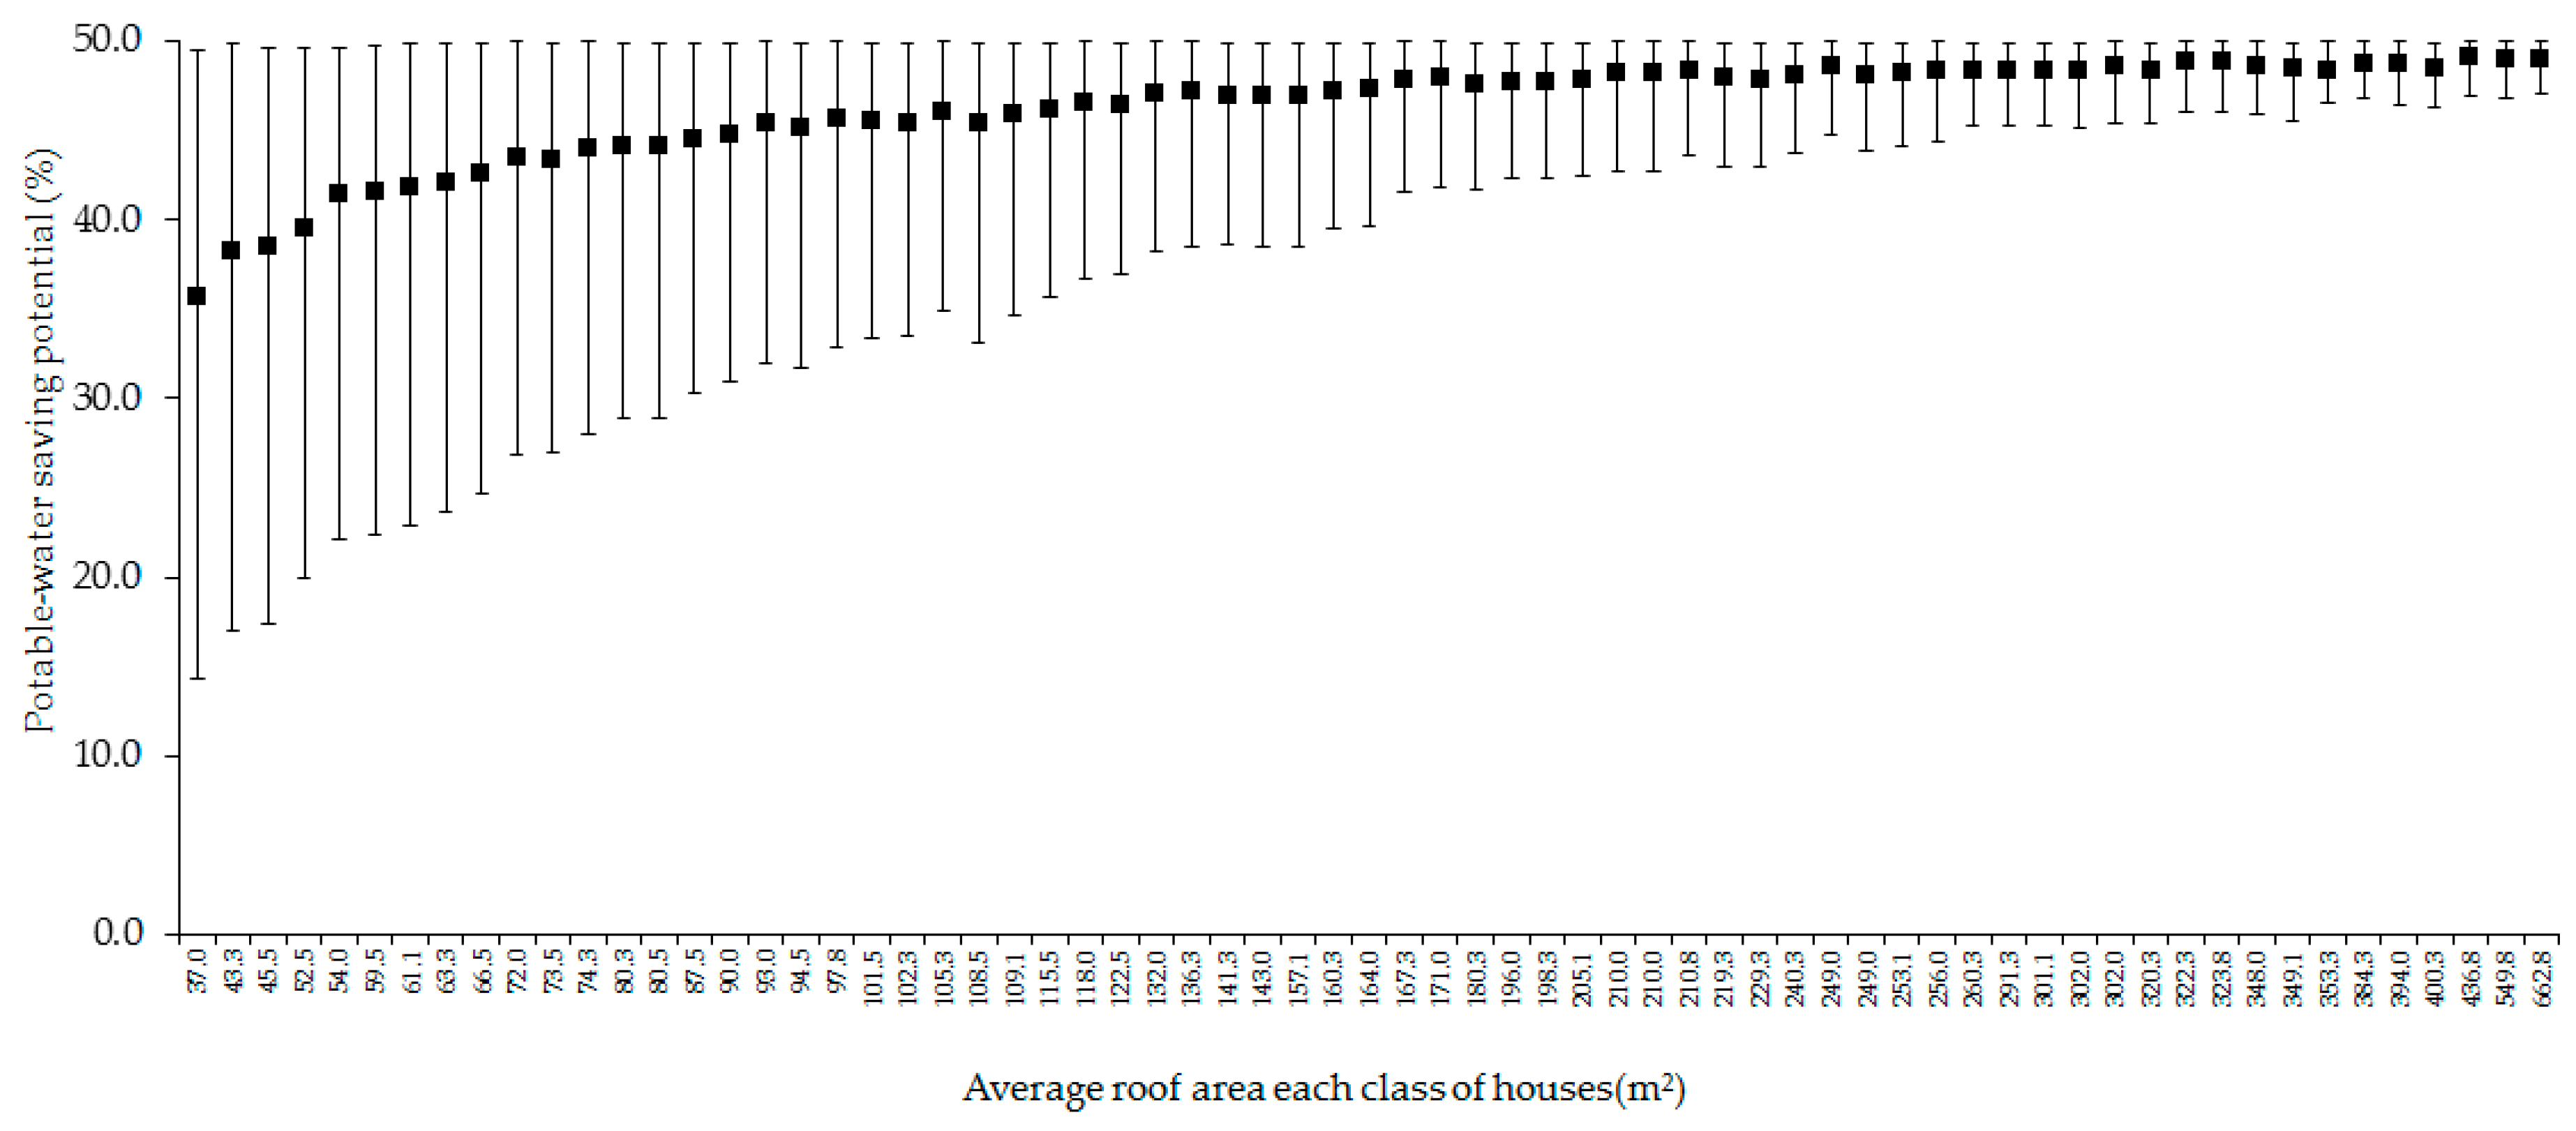
Figure 8 and Figure 9 show the minimum, maximum, and average potential for potable water savings by using rainwater for all house classes for rainwater demands equal to 20% and 50%, respectively. In Figure 8 and Figure 9, the squares represent the average potential for potable water savings by using rainwater, and the vertical lines above and below represent the maxima and minima.
For a rainwater demand equal to 20% and all house classes, the average potential for potable water savings by using rainwater is approximately 20%. The minimum 13.6% belongs to the class with the smallest roof area (37 m2). The minimum, maximum, and average potentials for potable water savings are approximately 20% for buildings with larger roof areas. For a demand equal to 50%, only houses with a roof area greater than 200 m2 have a potential for potable water savings by using rainwater greater than 40%.
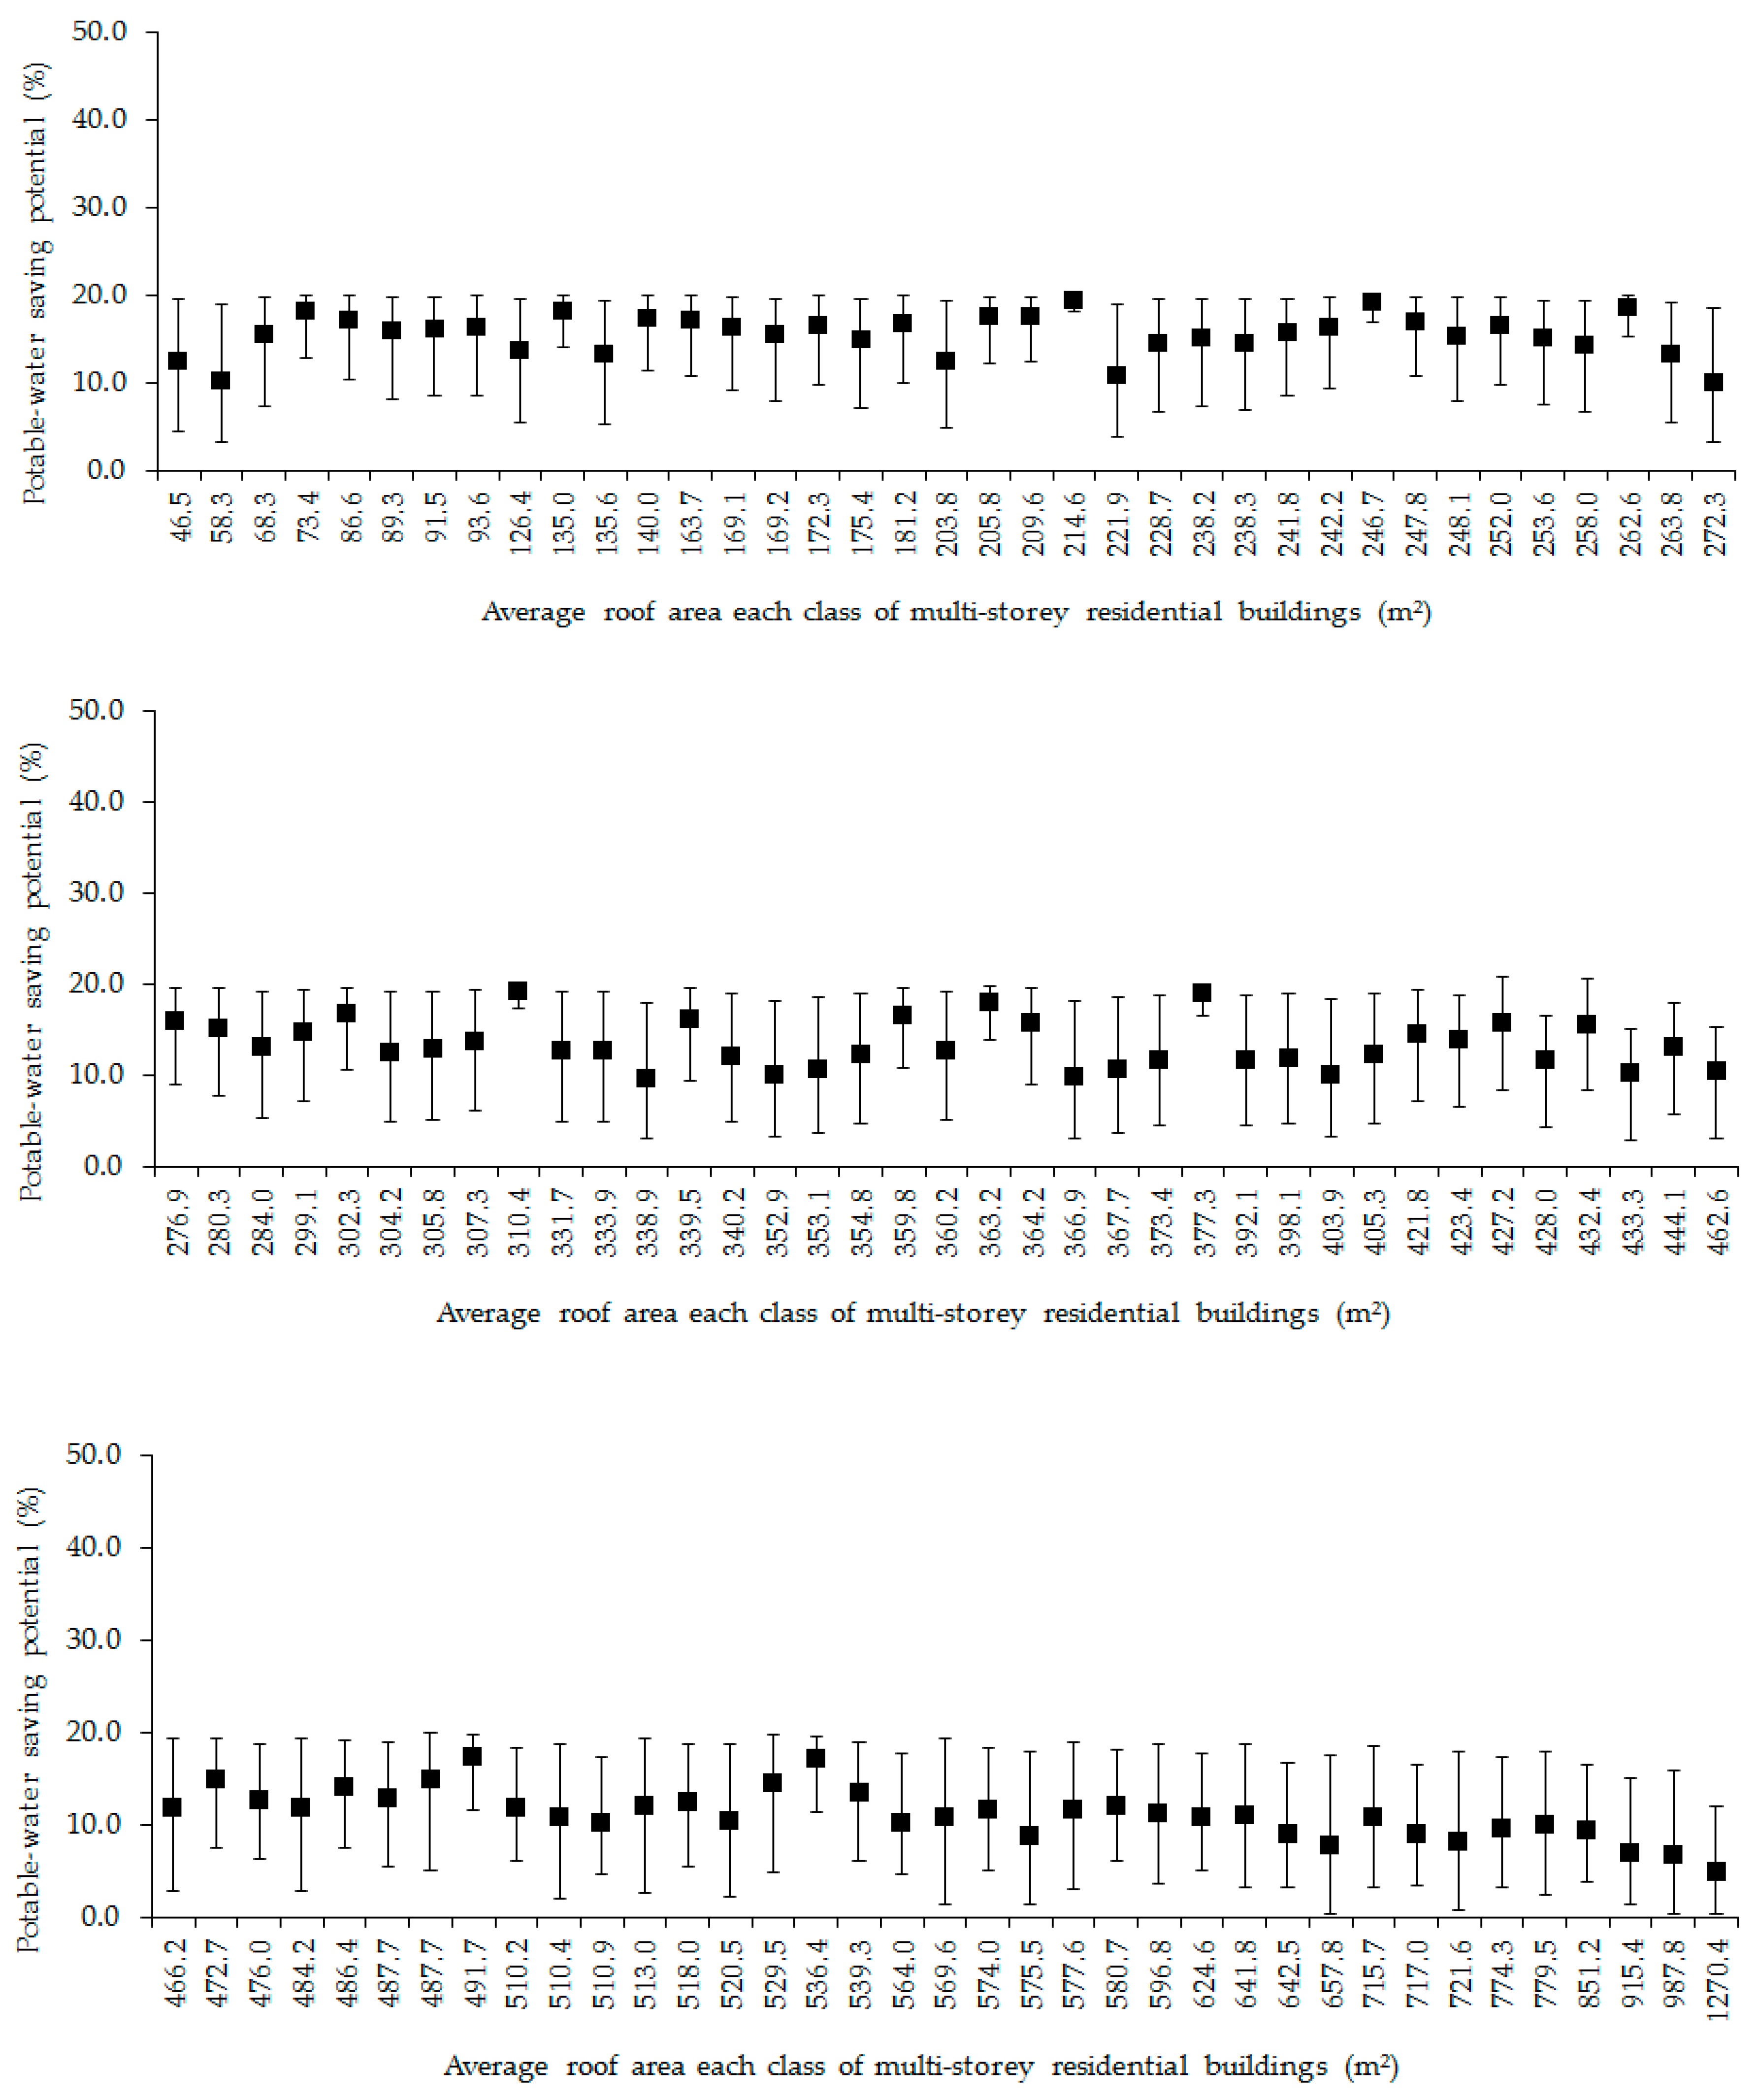
Figure 10 and Figure 11 present the minimum, maximum, and average potential for potable water savings by using rainwater for each multi-story residential-building class and rainwater demands equal to 20% and 50%, respectively. The larger ranges are caused by greater variations in the number of dwellers in multi-story residential buildings (1–5 persons per dwelling), as described in Section 2.3. The minimum potential for potable water savings in multi-story residential buildings was obtained for the scenario with one resident per dwelling.
When only houses and a rainwater demand equal to 20% are considered, the average potential for potable water savings is approximately 19.3%. However, for multi-story residential buildings, the average potential for potable water savings is 14.8%. For houses with a 50% rainwater demand, the potential for potable water savings by using rainwater is 43.9%. For multi-story residential buildings, the potential for potable water savings is approximately 23.7%, because the roof areas are not sufficiently large enough to meet the potable water demand.
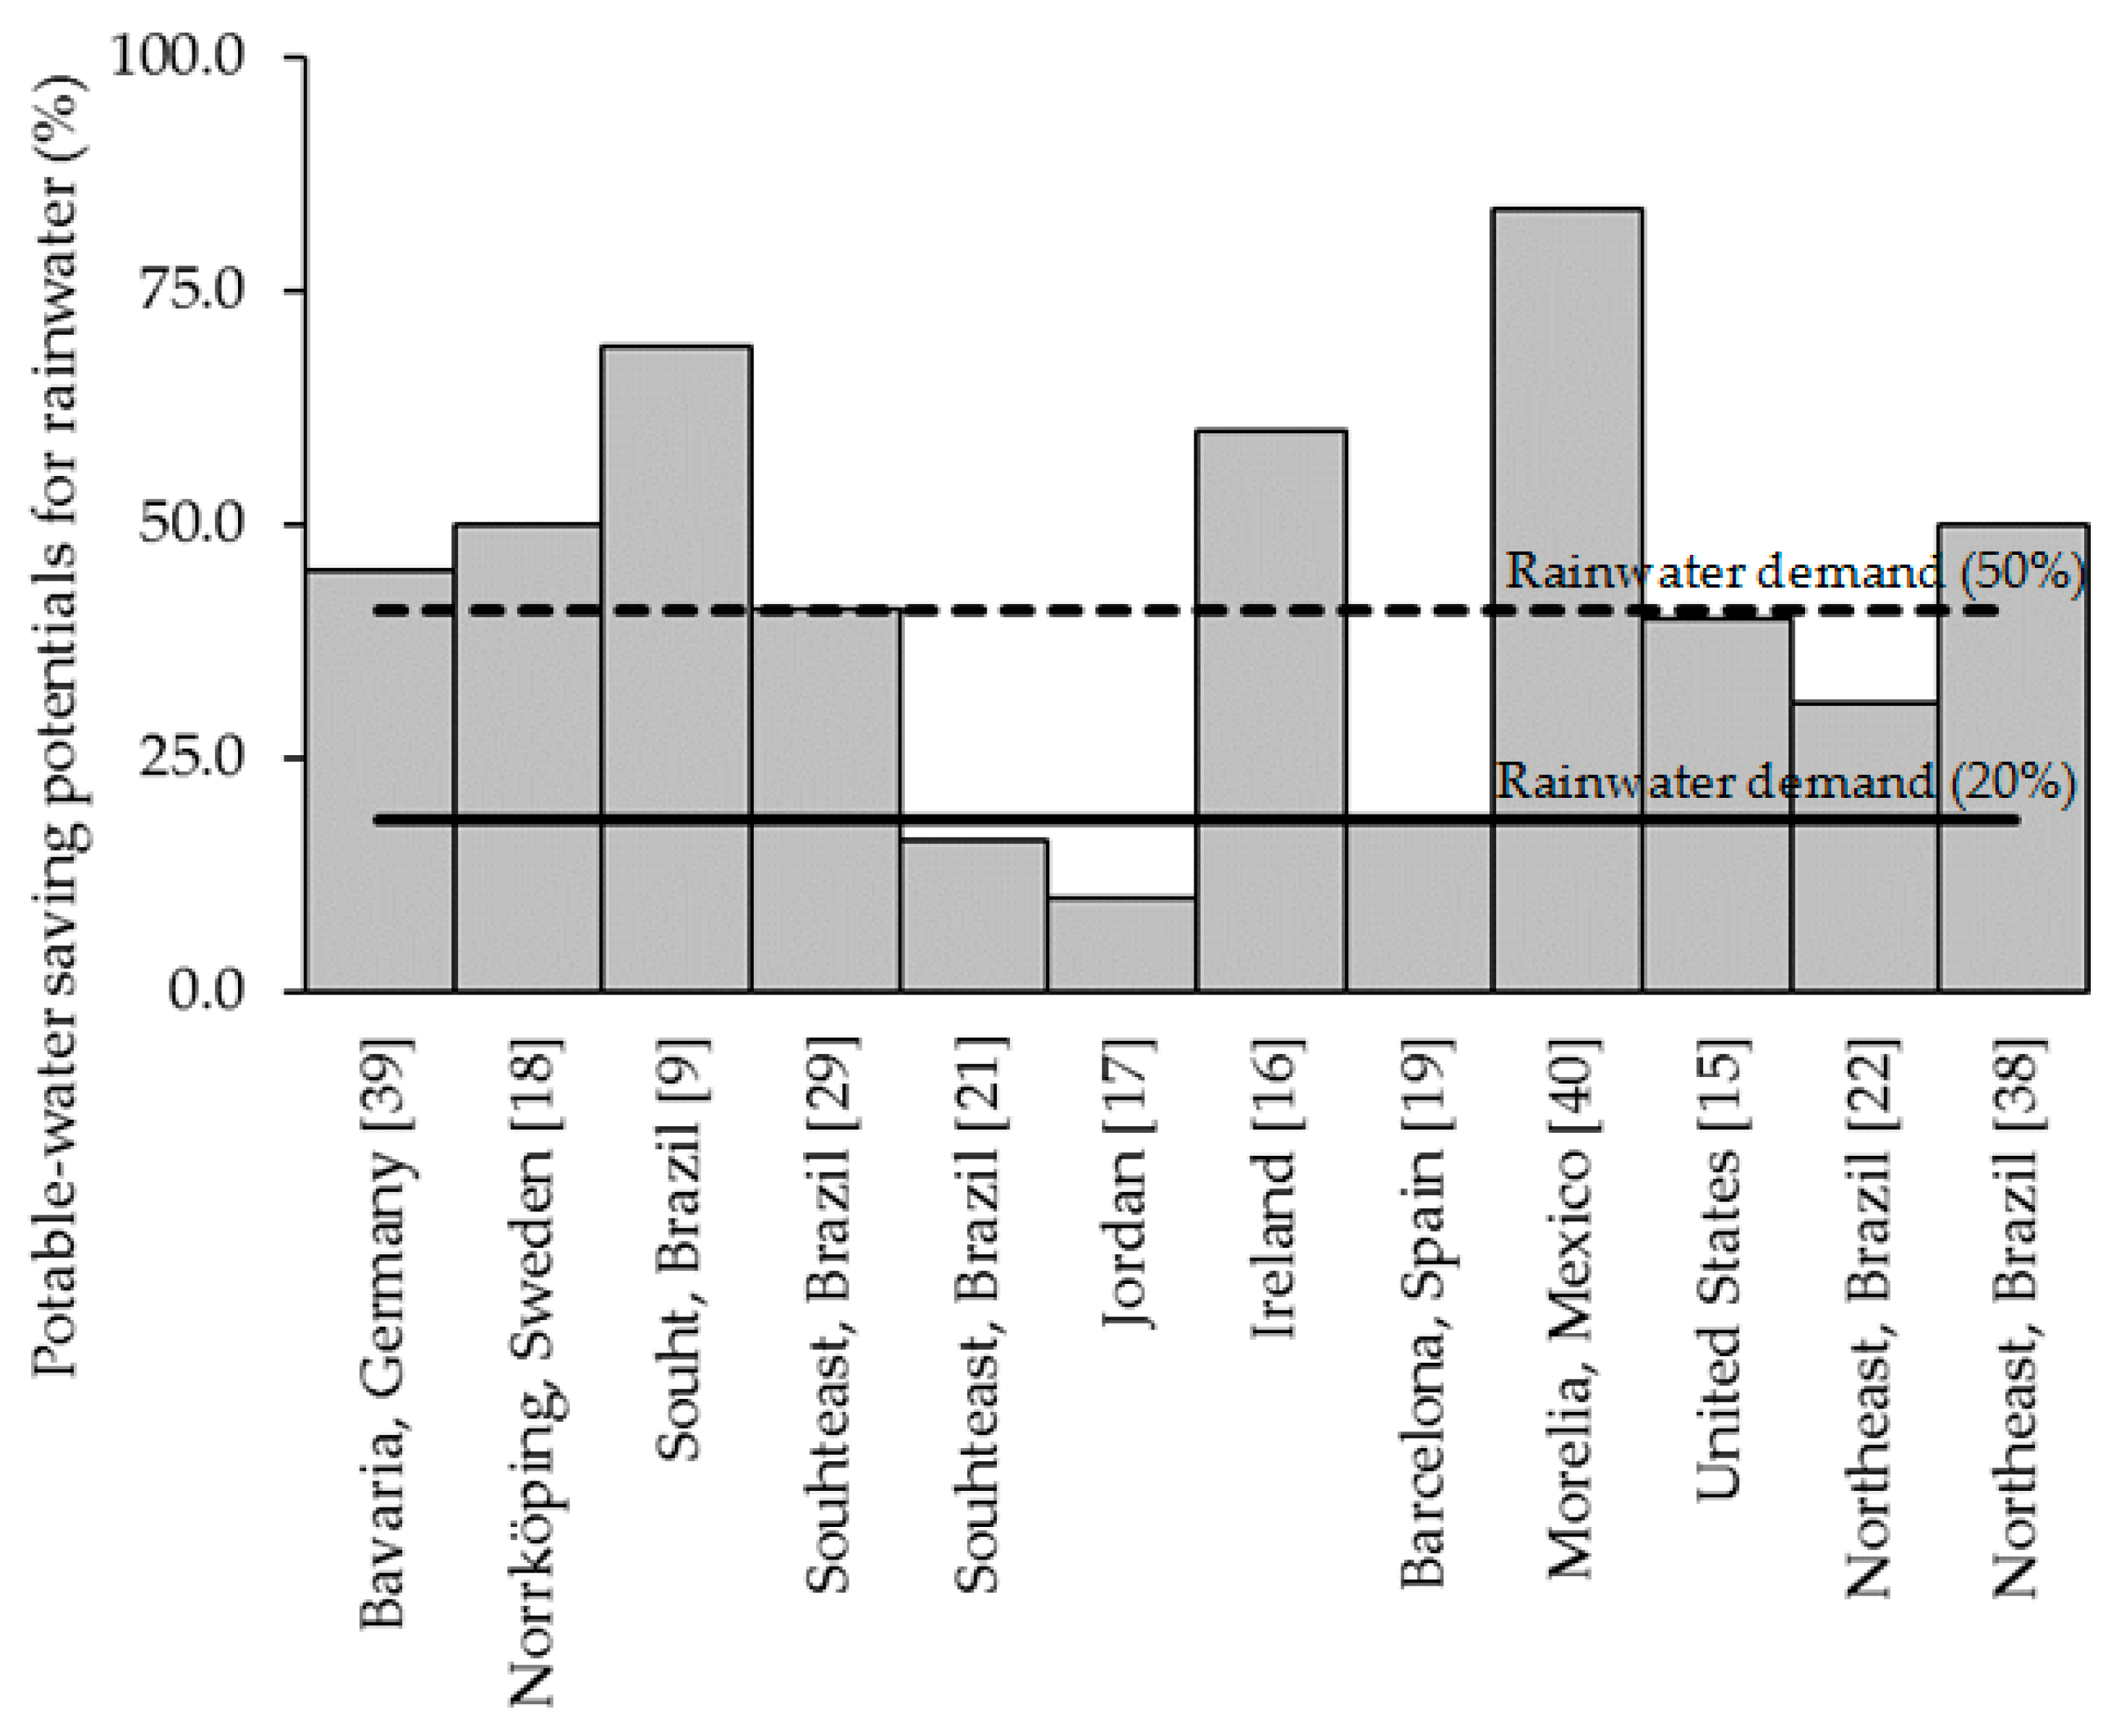
In Minas Gerais, a state in southeastern Brazil, for an assumed rainwater demand equal to 50%, the potable water saving potential was 50% [38], because the authors considered average roof areas equal to 85 m2 and 150 m2; this implies that the roof areas in this region were sufficiently large enough to meet the rainwater demand. In northeastern Brazil, the average potential for potable water savings by using rainwater was 31% [22], which was similar to the average potentials determined in this study. Figure 12 shows the results of other studies regarding residential buildings worldwide. The two lines indicate the potential for potable water savings obtained herein for rainwater demands equal to 20% and 50%.
The potential for potable water savings by using rainwater considering the demand for toilet flushing (20%) in the region studied is 18.5%. For a demand of 50% (toilet flushing and washing machines), the potential is 40.8%. In the case of houses (Figure 12), the rainwater demand can be met up to 90%.
3.4. Rainwater Tank Capacities
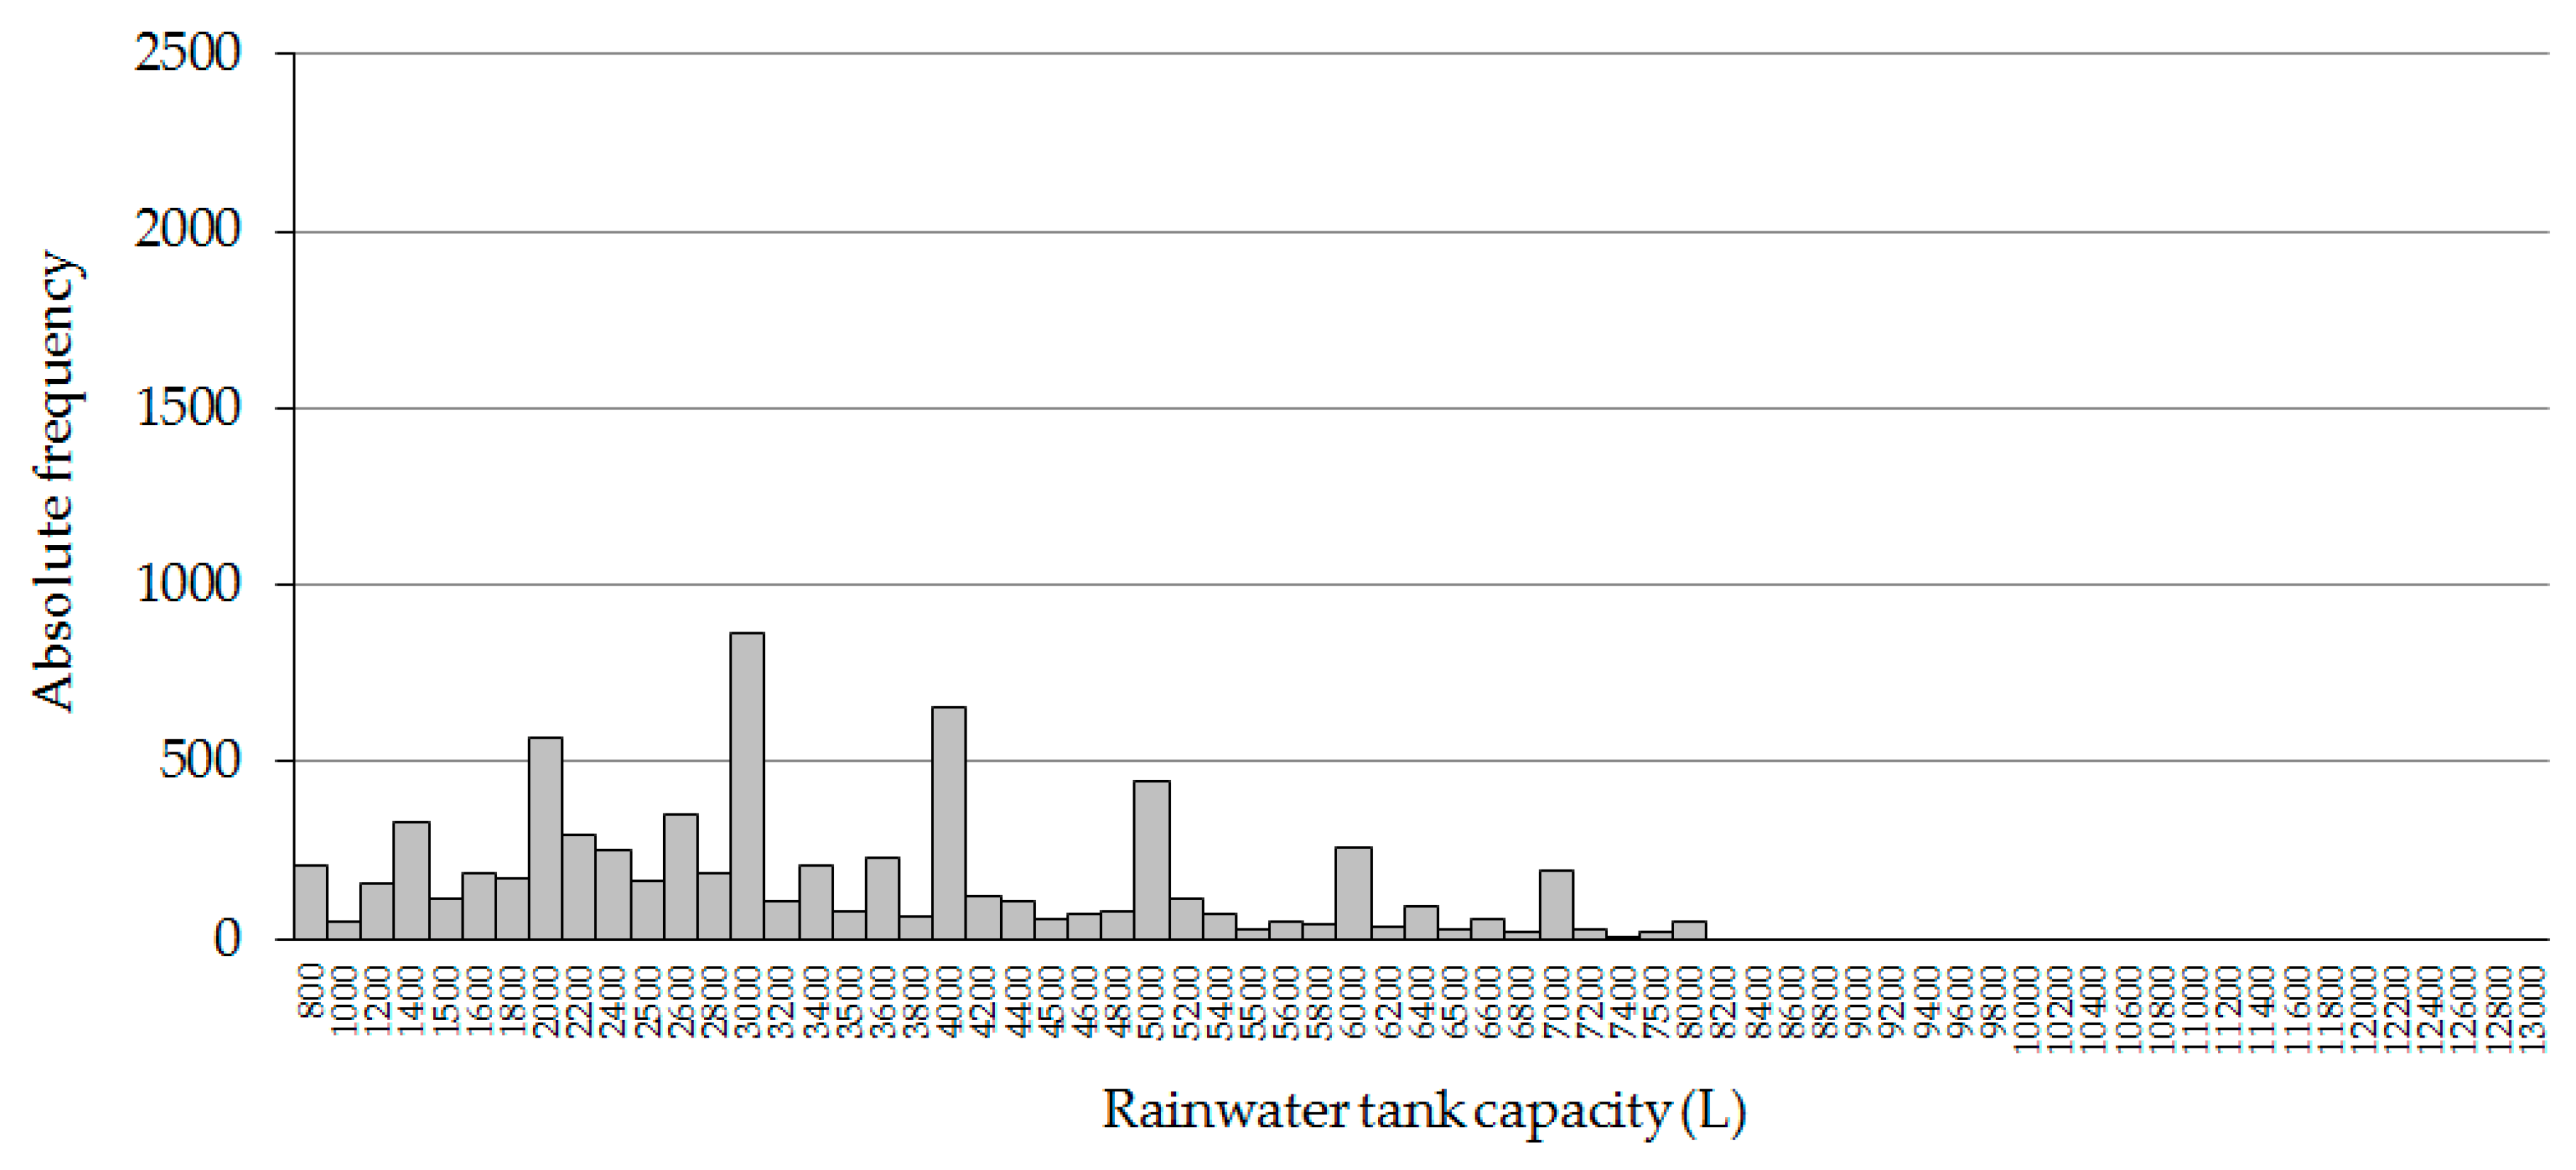
The rainwater tank capacity for each scenario was determined. Figure 13 shows the absolute frequency distribution and rainwater tank capacities for each case simulated involving houses. Figure 14 presents the results for multi-story residential buildings. According to Figure 13, approximately 69.3% of the cases simulated have a rainwater tank capacity between 1000–4000 L.
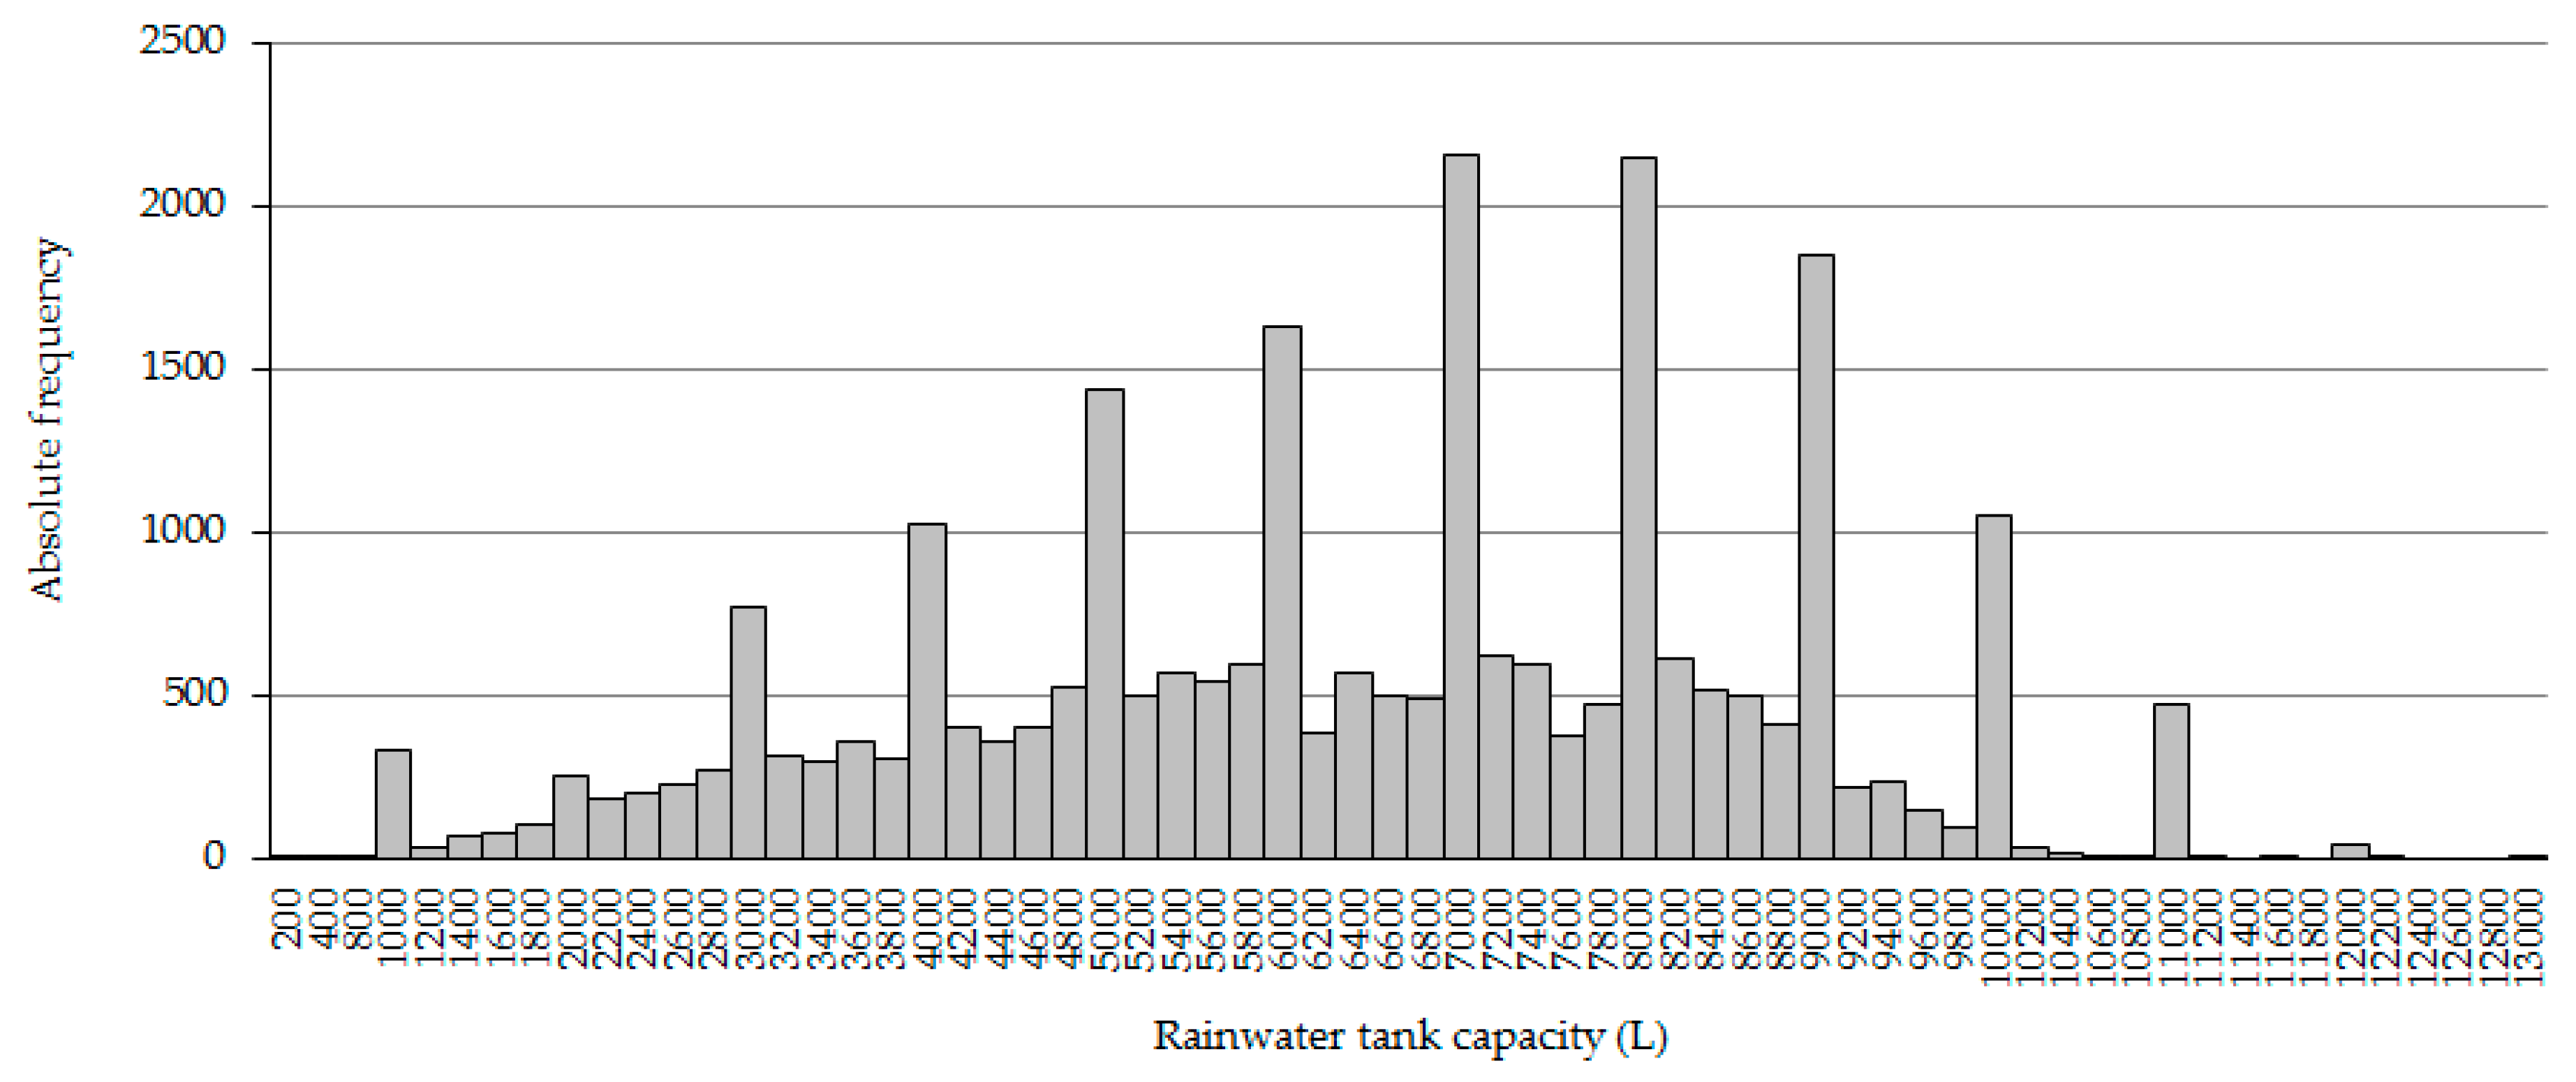
The values presented in Figure 13 are similar to those of other studies. In San Diego, USA, the rainwater tank capacities were 227–7571 L for residential buildings [41]. For Nanjing, China, an average rainwater tank equal to 26.7 L/m2 of roof area was assumed for residential buildings [42]. Considering a rainwater tank equal to 26.7 L/m2 [42] and the average roof area in this study (101.6 m2), the rainwater tank capacity would be approximately 2712 L. In this research, 29.4% of the cases simulated have rainwater tank sizes in the range of 2000–3000 L. The average rainwater tank capacities are 43.8 L/m2 of roof area for houses, and 21.0 L/m2 of roof area for multi-story residential buildings. In Germany and Malaysia, studies involving residential buildings have used rainwater tank capacities equal to 5000 L [39,43]. Figure 14 shows the absolute frequencies of the rainwater tank capacities for multi-story residential buildings for different scenarios.
According to Figure 13 and Figure 14, the rainwater tank capacities obtained for each scenario with their corresponding average roof area have approximately normal frequency distributions. Two normal distributions can be observed because the simulation considered various numbers of dwellers (1–5 dwellers). For one resident, the potable water demand in the buildings is minimum. Thus, even residential buildings with large roof areas would need relatively small rainwater tanks. For higher numbers of dwellers (2–5), the increase in the potable water demand results in greater rainwater tank capacities. For example, 7000 L rainwater tanks were obtained in 2156 computer simulations for approximately all building classes because potable water demand values of 110 L/capita/day and 220 L/capita/day were considered, which were then multiplied by the number of dwellers.
For multi-story residential buildings, approximately 57.8% of the cases presented rainwater tank capacities equal to 4000–8000 L as a result. These capacities are due to the larger daily rainwater demand (more dwellers than in houses). Only 3.4% of the cases of multi-story residential buildings needed tank capacities lower than 2000 L.
4. Conclusions
This study aimed to estimate the potential for potable water savings by using rainwater in residential buildings in Joinville, southern Brazil. The study used data from residential buildings registered in the region and their corresponding roof areas. The buildings were grouped according to the average roof area and their types (houses or multi-story residential buildings). Buildings with very small roof areas cannot harvest enough rainwater to meet greater demands, thereby causing simulation results with unreasonable rainwater tank sizes. A rainwater demand of up to 50% would guarantee the efficiency of the rainwater harvesting system for houses. High efficiency means that the potential for potable water savings reaches values closer to the rainwater demand. However, regarding multi-story residential buildings, the design of rainwater harvesting systems with rainwater demands greater than 20% will result in larger rainwater tanks. The system will be less efficient because the roof areas of most buildings will not be sufficiently large enough to harvest enough rainwater to meet the demand.
Regarding the existing buildings in the city, the rainwater harvesting system performs better for a rainwater demand equal to 20%. In this case, the potential for potable water savings is closer to the rainwater demand. This study can contribute to the municipal legislation proposal on rainwater usage in new buildings, and also serve as instruction for local designers. The application of this method to other cities with different climates to evaluate the potential for potable water savings by using rainwater should be considered in future research. Data on buildings should be available for surveys to assess the real potential for potable water savings by using rainwater.
Author Contributions
In this study, author D.A.C. did conceptualization, methodology, formal analysis and write, while author E.G. helped to write the paper, to review and editing.
Funding
This research received no external funding.
Conflicts of Interest
The authors declare no conflict of interest.
References
- UN. United Nations. World Population Prospects. 2017. Available online: https://population.un.org/wpp/Publications/Files/WPP2017_DataBooklet.pdf (accessed on 20 May 2018).
- Distefano, T.; Kelly, S. Are we in deep water? Water scarcity and its limits to economic growth. Ecol. Econ. 2017, 142, 130–147. [Google Scholar] [CrossRef]
- Katz, D.; Grinstein, A.; Kronrod, A. Evaluating the effectiveness of a water conservation campaign: Combining experimental and field methods. J. Environ. Manag. 2016, 180, 335–343. [Google Scholar] [CrossRef] [PubMed]
- Bouwer, H. Integrated water management: Emerging issues and challenges. Agric. Water Manag. 2000, 45, 217–228. [Google Scholar] [CrossRef]
- Garcia, X.; Pargament, D. Reusing wastewater to cope with water scarcity: Economic, social and environmental considerations for decision-making. Resour. Conserv. Recycl. 2015, 101, 154–166. [Google Scholar] [CrossRef]
- Hadadin, N.; Qaqish, M.; Akawwi, E.; Bdour, A. Water shortage in Jordan—Sustainable solutions. Desalination 2010, 250, 197–202. [Google Scholar] [CrossRef]
- Manes, K.S.; Husain, S.; Ferse, S.C.A.; Costa, M.M. Water scarcity in the Spermonde Archipelago, Sulawesi, Indonesia: Past, present and future. Environ. Sci. Policy 2012, 23, 78–84. [Google Scholar] [CrossRef]
- Wu, P.; Tan, M. Challenges for sustainable urbanization: A case study of water shortage and water environment changes in Shandong, China. Procedia Environ. Sci. 2012, 13, 919–927. [Google Scholar] [CrossRef]
- Ghisi, E.; Montibeller, A.; Schmidt, R.W. Potential for potable water savings by using rainwater: An analysis over 62 cities in southern Brazil. Build. Environ. 2006, 41, 204–210. [Google Scholar] [CrossRef]
- Lee, K.E.; Mokhtar, M.; Hanafiah, M.M.; Halim, A.A.; Badusah, J. Rainwater harvesting as an alternative water resource in Malaysia: Potential, policies and development. J. Clean. Prod. 2016, 126, 218–222. [Google Scholar] [CrossRef]
- Amos, C.C.; Rahman, A.; Gathenya, J.M. Economic analysis of rainwater harvesting systems comparing developing and developed countries: A case study of Australia and Kenya. J. Clean. Prod. 2018, 172, 196–207. [Google Scholar] [CrossRef]
- Umapathi, S.; Pezzaniti, D.; Beecham, S.; Whaley, D.; Sharma, A. Sizing of Domestic Rainwater Harvesting Systems Using Economic Performance Indicators to Support Water Supply Systems. Water 2019, 11, 783. [Google Scholar] [CrossRef]
- Leong, J.Y.C.; Chong, M.N.; Poh, P.E.; Vieritz, A.; Talei, A.; Chow, M.F. Quantification of mains savings from decentralised rainwater, greywater, and hybrid rainwater-greywater systems in tropical climatic conditions. J. Clean. Prod. 2018, 179, 946–958. [Google Scholar] [CrossRef]
- Marinoski, A.K.; Ghisi, E. Environmental performance of hybrid rainwater-greywater systems in residential buildings. Resour. Conserv. Recycl. 2019, 144, 100–114. [Google Scholar] [CrossRef]
- Rostad, N.; Foti, R.; Montalto, F.A. Harvesting rooftop runoff to flush toilets: Drawing conclusions from four major U.S. cities. Resour. Conserv. Recycl. 2016, 108, 97–106. [Google Scholar] [CrossRef]
- Li, Z.; Boyle, F.; Reynolds, A. Rainwater harvesting and greywater treatment systems for domestic application in Ireland. Desalination 2010, 260, 1–8. [Google Scholar] [CrossRef] [Green Version]
- Abdulla, F.A.; Al-Shareef, A.W. Roof rainwater harvesting systems for household water supply in Jordan. Desalination 2009, 243, 195–207. [Google Scholar] [CrossRef]
- Villarreal, E.L.; Dixon, A. Analysis of a rainwater collection system for domestic water supply in Ringdansen, Norrköping, Sweden. Build. Environ. 2005, 40, 1174–1184. [Google Scholar] [CrossRef]
- Domènech, L.; Saurí, D. A comparative appraisal of the use of rainwater harvesting in single and multi-family buildings of the Metropolitan Area of Barcelona (Spain): Social experience, drinking water savings and economic costs. J. Clean. Prod. 2011, 19, 598–608. [Google Scholar] [CrossRef]
- Ghisi, E. Potential for potable water savings by using rainwater in the residential sector of Brazil. Build. Environ. 2006, 41, 1544–1550. [Google Scholar] [CrossRef]
- Ghisi, E.; Ferreira, D.F. Potential for potable water savings by using rainwater and greywater in a multi-storey residential building in southern Brazil. Build. Environ. 2007, 42, 2512–2522. [Google Scholar] [CrossRef]
- Santos, S.M.; De Farias, M.M.M.W.E.C. Potential for rainwater harvesting in a dry climate: Assessments in a semiarid region in northeast Brazil. J. Clean. Prod. 2017, 164, 1007–1015. [Google Scholar] [CrossRef]
- Campisano, A.; Mondica, C. Optimal sizing of storage tanks for domestic rainwater harvesting in Sicily. Resour. Conserv. Recycl. 2012, 63, 9–16. [Google Scholar] [CrossRef]
- SIMGeo. Sistema de Informações Municipais Georreferenciadas (Georeferenced Municipal Information System); SIMGeo: Joinville, Brazil, 2017. Available online: http://prefeituradigital.joinville.sc.gov.br/servico/detalhe-3-SIMGeo.html (accessed on 10 June 2017). (In Portuguese)
- Maia, B.G.O.; Klostermann, D.; Ribeiro, J.M.G.; Simm, M.; Oliveira, T.M.N.; Barros, V.G. Bacias Hidrográficas da Região de Joinville (Joinville River Basins), 2nd ed.; UNIVILLE: Joinville, Brazil, 2013; pp. 10–51. (In Portuguese) [Google Scholar]
- Ghisi, E.; Cordova, M.M. Netuno 4. Programa computacional (Netuno 4, computer programme); Federal University of Santa Catarina: Florianópolis, Brazil, 2014; Available online: http://www.labeee.ufsc.br/ (accessed on 15 September 2017). (In Portuguese)
- Sturges, H.A. The choice of a class interval. J. Am. Stat. Assoc. 1926, 153, 65–66. [Google Scholar] [CrossRef]
- SNIS. Diagnóstico dos Serviços de Água e Esgoto-2015 (Diagnosis of Water and Sewerage Services-2015); Sistema Nacional de Informações sobre Saneamento (National System about Information on Sanitation) (SNIS): Brasília, Brazil, 2016.
- Ghisi, E.; Bressan, D.L.; Martini, M. Rainwater tank capacity and potential for potable water savings by using rainwater in the residential sector of south-eastern Brazil. Build. Environ. 2007, 42, 1654–1666. [Google Scholar] [CrossRef]
- Dias, T.F.; Kalbusch, A.; Henning, E. Factors influencing water consumption in buildings in southern Brazil. J. Clean. Prod. 2018, 184, 160–167. [Google Scholar] [CrossRef]
- Peters, M.R.; Sezerino, P.H.; Melo, K.M.S.; Philippi, L.S. Potencialidade de reuso residencial utilizando fontes alternativas de água (Residential reuse potential using alternative water sources). In Proceedings of the Simpósio Ítalo-Brasileiro de engenharia sanitária e ambiental (Italian-Brazilian Symposium on sanitary and Environmental Engineering), Fortaleza, Brazil, 17–22 September 2006. (In Portuguese). [Google Scholar]
- Ghisi, E.; Oliveira, S.M. Potential for potable water savings by combining the use of rainwater and greywater in houses in southern Brazil. Build. Environ. 2007, 42, 1731–1742. [Google Scholar] [CrossRef]
- Almeida, G. Metodologia para caracterização de efluentes domésticos para fins de reúso: Estudo em Feira de Santana, Bahia (Methodology for characterization of domestic wastewater for reuse purposes: Study in Feira de Santana, Bahia). Master’s Thesis, Clean Technologies in Production Process, Federal University of Bahia, Salvador, Brazil, 2007. (In Portuguese). [Google Scholar]
- Barreto, D. Perfil do consumo residencial e usos finais da água (Residential water consumption profile and end-uses). AMB Constr. 2008, 8, 23–40. (In Portuguese) [Google Scholar]
- Marinoski, A.K.; Vieira, A.S.; Silva, A.S.; Ghisi, E. Water end-uses in low-income houses in Southern Brazil. Water 2014, 6, 1985–1999. [Google Scholar] [CrossRef]
- Associação Brasileira de Normas Técnicas (ABNT). Água de Chuva: Aproveitamento de coberturas em áreas urbanas para fins não potáveis-requisitos (Rainwater—Use of the roofs in urban areas for non-potable purposes—Requirements); Associação Brasileira de Normas Técnicas (ABNT): Rio de Janeiro, Brazil, 2007. (In Portuguese) [Google Scholar]
- Comitê de gerenciamento das bacias do Rio Cubatão e Cachoeira; Joinville daily rainfall data; CCJ: Joinville, Brazil, 2016; Available online: https://www.cubataojoinville.org.br/ (accessed on 10 may 2017). (In Portuguese)
- Lopes, V.A.R.; Marques, G.F.; Dornelles, F.; Azuara, J.M. Performance of rainwater harvesting systems under scenarios of non-potable water demand and roof area typologies using a stochastic approach. J. Clean. Prod. 2017, 148, 304–316. [Google Scholar] [CrossRef]
- Herrmann, T.; Schmida, U. Rainwater utilisation in Germany: Efficiency, dimensioning, hydraulic and environmental aspects. Urban Water J. 2000, 1, 307–316. [Google Scholar] [CrossRef]
- Martínez, A.B.; Ortega, J.M.P.; Rivera, F.N.; González, M.S.; Montoya, A.J.C.; El-Halwagi, M.M. Optimal design of rainwater collecting systems for domestic use into a residential development. Resour. Conserv. Recycl. 2014, 84, 44–56. [Google Scholar] [CrossRef]
- Walsh, T.C.; Pomeroy, C.A.; Burian, S.J. Hydrologic modeling analysis of a passive, residential rainwater harvesting program in an urbanized, semi-arid watershed. J. Hydrol. 2014, 508, 240–253. [Google Scholar] [CrossRef]
- Zhang, X.; Hu, M.; Chen, G.; Xu, Y. Urban rainwater utilization and its role in mitigating urban waterlogging problems—A case study in Nanjing, China. Water Resour. Manag. 2012, 26, 3757–3766. [Google Scholar] [CrossRef]
- Shaaban, A.J.B.; Appan, A. Utilizing rainwater for non-potable domestic uses and reducing peak urban runoff in Malaysia. In Proceedings of the International Rainwater Catchment Systems Conference, Mexico City, Mexico, 25–29 August 2003. [Google Scholar]
Figure 1.
Location of Joinville and the study area [24].
Figure 1.
Location of Joinville and the study area [24].

Figure 2.
Flowchart showing combinations of multiple scenarios for computer simulations.

Figure 3.
Average monthly rainfall in Joinville over 1997–2016 [37].
Figure 3.
Average monthly rainfall in Joinville over 1997–2016 [37].

Figure 4.
Relative frequency for the class of roof areas for houses in the region studied. (a) Class of roof areas for houses: 36–106 m2. (b) Class of roof areas for houses: 106–230 m2. (c) Class of roof areas for houses: 240–660 m2.
Figure 4.
Relative frequency for the class of roof areas for houses in the region studied. (a) Class of roof areas for houses: 36–106 m2. (b) Class of roof areas for houses: 106–230 m2. (c) Class of roof areas for houses: 240–660 m2.

Figure 5.
Relative frequency for the class of roof areas for multi-story residential buildings in the region studied.
Figure 5.
Relative frequency for the class of roof areas for multi-story residential buildings in the region studied.


Figure 6.
Potential for potable water savings by using rainwater in houses. (a) Rainwater demand equal to 20%. (b) Rainwater demand equal to 50%.
Figure 6.
Potential for potable water savings by using rainwater in houses. (a) Rainwater demand equal to 20%. (b) Rainwater demand equal to 50%.

Figure 7.
Potential for potable water savings by using rainwater in multi-story residential buildings. (a) Rainwater demand equal to 20%. (b) Rainwater demand equal to 50%.
Figure 7.
Potential for potable water savings by using rainwater in multi-story residential buildings. (a) Rainwater demand equal to 20%. (b) Rainwater demand equal to 50%.

Figure 8.
Minimum, maximum, and average potential for potable water savings by using rainwater for 67 house classes for rainwater demand equal to 20%.
Figure 8.
Minimum, maximum, and average potential for potable water savings by using rainwater for 67 house classes for rainwater demand equal to 20%.

Figure 9.
Minimum, maximum, and average potential for potable water savings by using rainwater for 67 house classes for rainwater demand equal to 50%.
Figure 9.
Minimum, maximum, and average potential for potable water savings by using rainwater for 67 house classes for rainwater demand equal to 50%.

Figure 10.
Minimum, maximum, and average potential for potable water savings by using rainwater of classes multi-story residential buildings for rainwater demand equal to 20%.
Figure 10.
Minimum, maximum, and average potential for potable water savings by using rainwater of classes multi-story residential buildings for rainwater demand equal to 20%.

Figure 11.
Minimum, maximum, and average potential for potable water savings by using rainwater for rainwater of classes multi-story residential buildings for rainwater demand equal to 50%.
Figure 11.
Minimum, maximum, and average potential for potable water savings by using rainwater for rainwater of classes multi-story residential buildings for rainwater demand equal to 50%.

Figure 12.
Potential for potable water savings due to rainwater use in different regions of the world compared to the results of the study shown herein [9,15,16,17,18,19,21,22,29,38,39,40].

Figure 13.
Rainwater tank capacities for houses for the study area.

Figure 14.
Rainwater tank capacities for multi-story residential buildings for the study area.


Table 1.
Water end-uses in Brazilian residential buildings.
| City | Water End-Uses | |
|---|---|---|
| Toilet Flushing | Washing Machine | |
| Florianópolis (southern Brazil) [31] | - | 22.0 |
| Florianópolis (southern Brazil) [21] | 32.8 | 12.4 |
| Palhoça (southern Brazil) [32] | 28.0 | 7.2 |
| Feira de Santana (northeastern Brazil) [33] | 8.0 | 13.0 |
| Simões Filho (northeastern Brazil) [33] | 23.0 | 17.0 |
| São Paulo (southeastern Brazil) [34] | 20.0 | 14.0 |
| Florianópolis (southern Brazil) [35] | 20.0 | 14.0 |
Table 2.
Multi-story residential buildings with absolute frequency equal to 1.
| Number of Dwellings | Roof Area (m2) | Number of Dwellings | Roof Area (m2) |
|---|---|---|---|
| 34 | 44.09 | 58 | 575.47 |
| 36 | 510.35 | 64 | 569.64 |
| 38 | 596.78 | 71 | 915.39 |
| 41 | 577.59 | 84 | 721.59 |
| 45 | 512.99 | 88 | 657.77 |
| 46 | 520.50 | 93 | 1270.44 |
| 47 | 715.65 | 103 | 987.82 |
© 2019 by the authors. Licensee MDPI, Basel, Switzerland. This article is an open access article distributed under the terms and conditions of the Creative Commons Attribution (CC BY) license (http://creativecommons.org/licenses/by/4.0/).
Share and Cite
MDPI and ACS Style
Custódio, D.A.; Ghisi, E. Assessing the Potential for Potable Water Savings in the Residential Sector of a City: A Case Study of Joinville City. Water 2019, 11, 2074. https://doi.org/10.3390/w11102074
AMA Style
Custódio DA, Ghisi E. Assessing the Potential for Potable Water Savings in the Residential Sector of a City: A Case Study of Joinville City. Water. 2019; 11(10):2074. https://doi.org/10.3390/w11102074
Chicago/Turabian StyleCustódio, Diego Antônio, and Enedir Ghisi. 2019. "Assessing the Potential for Potable Water Savings in the Residential Sector of a City: A Case Study of Joinville City" Water 11, no. 10: 2074. https://doi.org/10.3390/w11102074
Note that from the first issue of 2016, this journal uses article numbers instead of page numbers. See further details here.