Water Governance in India: Evidence on Water Law, Policy, and Administration from Eight Indian States


Lee Kuan Yew School of Public Policy, National University of Singapore, Singapore 117570, Singapore
*
Author to whom correspondence should be addressed.
Water 2019, 11(10), 2071; https://doi.org/10.3390/w11102071
Submission received: 20 July 2019
/
Revised: 22 September 2019
/
Accepted: 28 September 2019
/
Published: 4 October 2019
(This article belongs to the Collection Water Policy Collection)
Abstract
:Water governance is a widely acknowledged as an important factor for sustainable development. This study attempts to assess if the water governance in eight Indian states has improved after the announcement of the United Nations Sustainable Development Goals (SDGs). We utilize the Institutional Decomposition and Analysis (IDA) framework developed by Saleth and Dinar. Using survey data from two periods and 152 respondents, we calculate the scores on 17 indicators of water law, policy, and administration. We found that average scores on water law, policy, and administration have increased between the first and the second survey. We attributed this improvement to the fact that the Indian government is paying special attention to the provision of clean drinking water after the announcement of the SDGs. We also calculated nominal and weighted water governance indices (WGIs) for eight Indian states. This study made an important contribution to the existing water governance literature by capturing improvements in the water governance scores of eight Indian states after the announcement of the SDGs.
1. Introduction
The provision of safe drinking water took central stage in global environmental and developmental discussions; due to this, it was included previously in the Millennium Development Goals (MDGs) and in the Sustainable Development Goals (SDGs) more recently. Despite the tremendous amount of attention paid to the provision of safe and affordable drinking water, hundreds of millions of people around the world still lack access to it [1,2]. In Asia, India has the largest percentage of its population without access to clean drinking water, reaching up to more than 75 million people [3]. India lags behind most of its neighbors in terms of access to safe potable water [4].
According to estimates, India has 16% of the world’s population but only 4% of the world’s freshwater resources. Despite significant investment and improvement in the water sector, it is becoming very difficult to manage the ever-increasing demand of water in India [5]. If the status quo is not changed, India’s water problems would be further aggravated, as it is already a water-stressed country [6]. Also, in India, water is not evenly distributed geographically. More than two-thirds of water resources are confined to about one-third of the land area. The Ganges–Meghna–Brahmaputra river basin in the east contains 60% of available freshwater [7].
According to the constitution of India, the responsibility of water resources development and management rests with individual states [8]. Therefore, we can say that water governance in India is decentralized at the state level. Although the central government provides financial resources to the state governments for implementing national-level projects, the states are responsible for the development and management of water resources within their administrative/physical boundaries. States have different institutions such as regulatory authorities, water departments, gram panchayats, irrigation departments, and public works departments to develop and manage water resources [9].
The upper state level is responsible for funding, policy-making, mobilization, and administration of the water sector in coordination with the central government. The state governments receive a significant chunk of their funding from the central government; therefore, they try to align their vision and policies with the central government. They make their own policies and provide funding from their own resources when necessary. The Indian constitution gives states full authority over water within their boundaries [10].
At the state level, water is managed differently in rural and urban areas. In rural areas, water is managed through the Panchayat Raj system. The Panchayat Raj system consists of three administrative levels: Zilla (district) Panchayat at the top level, followed by Taluk (block) Panchayat at the middle level, and Gram (village) Panchayat at the bottom. At the Zilla and Taluk levels, the water bodies consist of both elected and appointed officials, and at the Gram level, the water bodies include only elected representatives. Normally, a Gram Panchayat consists of about one to 10 villages, depending on total population [9]. This also varies from state to state. The Panchayat Raj system is responsible for implementation, operations and maintenance, funding, and the administration of water programs and projects. Functions involving funding and local policy making are performed by Zilla and Taluk Panchayats, while functions such as implementation, monitoring, maintenance, and operations are performed by Taluk and Gram Panchayats [11].
In urban areas, the water is managed by different political and bureaucratic bodies such as districts and municipalities where both elected and appointed officials perform their duties. These arrangements can differ from state to state. These district and municipality-level bodies are responsible for policy-making, implementation, and service provision. Service provision includes water infrastructure building and maintenance, water distribution, and other related tasks [12,13].
Civil society organizations such as non-governmental organizations (NGOs), academic bodies, community support organizations, and general citizenry also contribute to water governance through consultation, research, funding, project design, and advocacy [14,15]. Water utilities are underperforming in India despite investments to improve infrastructure and capacity. Most of the urban areas get water only a few hours a day, and 24/7 water supply is still a far cry. A lack of adequate access to water has negative effects on gender equity as well, and women are primarily on the losing side because they are normally responsible for fetching water from afar. This takes a lot of their time and energy, severely harming their productivity [16]. Piped water supply is heavily skewed in the favor of rich. Most (65%) of the rich have access to piped water supply, while only 2% of the poor enjoy the same. In Delhi, 20% of the population gets 92% of the water, while the remaining 80% gets only 8% [5,17,18]. Poor water services along with sanitation are also blamed for the undernutrition of 40% of underweight children in India [19]. India’s rivers are also heavily polluted. According to studies, 70% of India’s surface water is unfit for human consumption due to pollution [20,21].
Araral and Ratra [22] argued that India lags in water governance for a variety of reasons such as the poor capacity of Indian states, the complexity of the Indian decision-making system (which has a number of veto players), conflicts between states over water rights, and most importantly, the lack of water-related expertise among Indian political leaders and policymakers.
India has to improve a lot when it comes to the sustainable and equitable provision of drinking water to its masses. The sustainable provision of drinking water ultimately depends on the sustainable management of water resources. As we discuss in the coming section, water governance plays an important role in the sustainable management of water resources. Taking this into account, this study attempts to assess the state of water governance in eight Indian states, utilizing a framework developed by Saleth and Dinar. Particularly, we are interested in measuring any improvement in the water governance in these states after the announcement of SDGs.
India committed to SDGs right at the time when these were adopted by the United Nations (UN) General Assembly in September 2015. The Government of India (GoI) works in close coordination with state governments to realize SDGs by the target date of 2030. The SDGs include a water and sanitation-related goal called Sustainable Development Goal 6 (SDG6). According to a report by the UN and Research and Information System for Developing Countries (RIS), Indian governments both at central and state levels are actively pursuing the achievement of SDGs, including SDG6. Several of the Indian government’s initiatives can be directly linked to SDG6. These initiatives include the Water Framework Law of India 2016, National Rural Drinking Water Program (NRDWP), Accelerated Urban Water Supply Program (AUWSP), Namame-Gange (National Mission for Clean Ganga), and National Water Policy [23].
This study utilizes survey data collected over two survey periods before and after the announcement of SDGs to estimate if there is an improvement in water governance after SDGs were announced. This type of comparative study focusing on temporal variation in water governance in India has not been done before. Therefore, in our view, this study makes an important contribution to the already existing literature on water governance. This study can also be taken as a case study on India at the state level, which can aid in the decision-making process in the water sector. We argue that water governance in the states under study seems to have improved in recent years, as reported by survey respondents.
2. Water Governance and Sustainable Water Management
Water is essential to life, but difficult to manage due to the nature of its physical existence. Water is used in a multitude of human activities such as agriculture, industry, domestic, and most importantly for drinking. Apart from human consumption, water is essential for animal and plant life on earth, without which human life cannot exist. Water is difficult to manage for many reasons. It is not equally distributed geographically, so it needs costly infrastructure for transportation. It is difficult to store, because it evaporates and leaks. It gets polluted easily, as it is a good solvent, rendering it unfit for human consumption without expensive treatment. Other problems related to water include water logging and flooding [24].
Despite all the problems related to the physical nature of water, it is equally important to manage it efficiently and sustainably. The water crisis in the 21st century has more to do with poor management than scarcity and stress [25]. Sustainability, as defined by the Brundtland Commission’s report titled Our Common Future [26], emphasizes meeting the needs of the current generation without impairing the ability of future generations to meet their needs. According to the report, the development is sustainable if “it meets the needs of the present without the compromising the ability of future generations to meet their own needs”. Sustainability involves multiple goals and objectives that can ensure a safe future. These goals and objectives involve environmental and ecological protection, social equity, economic longevity, and physical reliability. Therefore, sustainable management will involve actions directed to realize these goals and objectives. Sustainable water management (SWM) will be a set of actions, tradeoffs, and decision-making processes to realize these goals in the context of water [27].
UNESCO defines sustainable water resource systems as the systems that are designed and managed to fully contribute to the objectives of society, now and in the future, while maintaining their ecological, environmental, and hydrological integrity [28]. Other definitions may have different wordings, but incorporate more or less similar objectives; see for example Loucks and Gladwell [28], Mays [29], and Alley et al. [30]. SWM strives to balance the demand of water by competing sectors including agriculture, industry, domestic, and environment [31]. Similar to any other sustainability concept, SWM also gives equal importance to the long-term future [27]. United Nations Agenda 21 gives a more holistic objective of SWM, which is supposed to ensure “adequate supplies of water of good quality are maintained for the entire population of the planet, while preserving the hydrological, biological, and chemical functions of ecosystems, adapting human activities within the capacity limits of nature and to combat vectors of water related diseases” [31,32]. Achieving SWM involves numerous challenges and obstacles such as intense urbanization, water scarcity and stress, impacts of globalization, climate change, infrastructure issues, non-stationary demand, water contamination, and lack of consistency in water governance [33,34]. For an in-depth understanding of sustainable water management and the state of the literature on it, please see Durán-Sánchez et al. [35]. Sustainable development and SWM are closely related, as water is essential for development. The sustainable management of water resources leads to sustainable food production, poverty alleviation, and a reduction in water-related diseases by improving the quality of water [31,36]. For this reason, water is included in Sustainable Development Goal 6, which is also known as SDG6.
Assessing and evaluating the sustainability of water systems is a complex process, and there is no agreed upon method to do it. Evaluation models can include generic indices to compare management practices across different environments and organizations to location specific models tailored for individual governments to measure the sustainability of their water management systems [37]. Quantitative evaluations are useful to evaluate the environmental, economic, and social impacts of systems, but still there is a lack of robust quantitative evaluation techniques to model sociocultural aspects and their relationships with biological and physical components of complex water management systems [38,39,40,41]. The three most prevalent methods to evaluate SWM are indicators and indices; product-related assessment; and integrated assessment [38,42]. Popular indicators and indices include the Water Poverty Index [43], Watershed Sustainability Index [44], Canadian Water Sustainability Index [45], and Environmental Performance Index. Popular product assessments include Ecological Footprint [46] and Water Footprint [47]. Integrated assessments include system dynamic modeling, risk analysis, cost–benefit analysis, and impact assessments [31].
Water governance is taken as a concept broader than that of water management. Water management normally refers to the government making decisions to manage water systems. Water governance includes both internal and external processes through which societies manage their water resources [48]. Lautze et al. [49] differentiated between water management and water governance as, “Water governance is a set of processes and institutions through which management goals are identified and water management is charged with practical measures to achieve those goals. More simply water management aims to improve outcomes directly whereas water governance seeks to define those outcomes and align water management to achieve those goals”. It is apparent from the argument of Lautze, De Silva, Giordano and Sanford [49] that water governance encompasses water management as well.
Water governance is a quite complex concept, and normally scholars define and understand it according to their own core area of expertise. The Global Water Partnership (GWP) defines water governance as “the range of political, social, economic and administrative systems that are in place to regulate [the] development and management of water resources at different levels of society” [50]. Pahl-Wostl [51] defined water governance as “the social function that regulates the development and management of water resources and provisions of water services at different levels of society and guiding the resources towards a desirable state and away from undesirable state”. According to the UN World Water Report (2006), the crisis of water is largely due to the failure of water governance, and for the sustainable development of water resources, water governance should be given due priority [52]. Water governance is defined and interpreted in a very broad manner. Recently, researchers have debated and brought many modern concepts within the water governance envelope: for example, Integrated Water Resource Management (IWRM) and Adaptive Co-Management (ACM) [53,54,55,56]. Due to the failure of conventional water management, many responses have been developed to address the human and environmental problems related to water, and this has resulted in a dynamic shift in water governance incorporating human, ecological, and collaborative dimensions well within its boundaries [57,58,59,60,61].
The mechanisms through which water governance is translated into water management or sustainable water management are referred to as water governance mechanisms (WGM). The WGMs include institutions, formal and informal rules, actors, networks, and systems. Through WGMs, the decisions taken in water governance are transformed into water management actions, generating outcomes [50,62,63]. Therefore, including elements of sustainability in water governance will lead to the actions promoting the sustainable management of water resources or SWM. Hence, we can link modern water governance to sustainable development and SDGs through SWM.
As mentioned in the Introduction section, water in India is a state subject that is heavily influenced by the pros and cons of the bureaucratic and democratic norms of the country. The central government cannot enforce anything on states regarding water. The central government influences water governance at the state level only through funding and recommendations, and state governments normally align their policies and goals with the central government’s vision to receive more of these funds [64]. Therefore, much of the responsibility toward achieving SDG water targets rests on the shoulders of individual states. There are many state-level actors working toward the sustainable management of water resources, thus contributing toward SDGs. These actors include government agencies, community organizations, NGOs, and consultants. Progress has been made to increase access to safe drinking water, especially in rural areas. Whether India will be able to achieve the SDG6 targets by 2030 deadline is still unclear due to the enormity of tasks and the complexity involved in achieving these targets [65,66,67,68].
Assessing water governance is a complex task, and there is no agreed upon way to do it. This is highlighted by Pahl-Wostl, Holtz, Kastens, and Knieper [57]: “Finding general patterns to explain successes or failures of governance regimes poses a considerable challenges. Governance embraces the full complexity of a wide range of processes and their interaction. A major challenge is to understand how all the different processes characterizing these systems in concert determine certain policy outcomes under certain structural conditions and how change in governance regimes occur”. Water governance assessments tend to take elements from frameworks for assessing governance in a broad general way, such as the World Bank’s Worldwide Governance Indicators, which look at six dimensions of governance, and Transparency International’s Corruption Perception Index [69]. Water governance assessments generally focus on enabling the environment and performance of the institutions involved [70]. Recently, the Organization for Economic Co-operation and Development (OECD) has developed a framework known as the Water Governance Indicator Framework, which is composed of 36 water governance indicators that are applied at different scales and for different water management functions [71]. Despite the usefulness of indicators-based water governance frameworks, it is generally acknowledged that the identification and development of these indicators is a challenging task, because these indicators may take years to attain global acceptance and relevance [72,73]. Many indicators are based on the perception of experts, making them prone to judgmental bias. There may be a significant difference between formally accepted governance arrangements and those actually implemented on the ground [74]. According to the OECD, key difficulties in governance indicators include data collection and comparability across different space and time, and drawing causal linkages between policies and outcomes [71]. Nevertheless, indicators are accepted as an important way to track if countries are on track to improve their water governance and hence achieve the goal of SWM [75].
Bakker et al. [76] applied a conceptual framework of governance failure to water supply in Jakarta, Indonesia. The study found that it was governance failure that prevented Jakarta from achieving a universal water supply. The study argues that although the governance issues such as high transaction costs, a lack of flexible payment options for poor households, and insecure tenure arose mainly during the public management of the Jakarta water supply, the privatization in 1998 also could not address these governance issues.
Saleth and Dinar [77] and Araral and David [78] in 2001 and 2010 respectively used 20 indicators of water laws, policies, and administration to study water governance. The findings given by these studies can be summed up as follows. A country’s level of economic development has a positive correlation with certain aspects of its water laws. These aspects include the integration of water laws with the land, forest, and environmental laws, water governance centralization, and the accountability of water sector officials. Countries with a higher level of economic development may have more sophisticated water laws. The studies find that besides a country’s level of economic development, water laws depend on many other factors such as culture, water endowments, historical pattern of water laws, and the political economy, to name a few. The studies also find that the linkage between water law, policy, and availability of funding also varies with a country’s level of economic development. Richer countries tend to invest more in the water sector and also pay attention to cost recovery through the proper pricing of water services. However, the studies find an inverse relationship between a country’s level of economic development and the extent of participation of the private sector. Richer countries have more capable public sectors, but this is not the case in poor countries, which rely more on the private sector for investments in new projects [77,78].
Araral and Wang [79] used the same framework described above to find a correlation between water governance and water sector performance in 10 provinces of China. The study finds a positive correlation between water governance and different indicators of water sector performance. These indicators include the adequacy of drinking water, overall water productivity, industrial water productivity, and agricultural productivity.
Araral and Ratra [22] compared water governance in India and China using the same framework. The study uses survey data. Ninety-three officials from China and 89 officials from India were surveyed. Standardized scores on water laws, policies, and administration were calculated for both countries. The study concluded that water governance in China is considerably stronger as compared to India in all three aspects. Our study also utilized the India-related data from Araral and Ratra [22] and combined it with the data from the new survey conducted in 2017–2018 to generate our results.
One of the most successful examples of how water governance leads to sustainable water management is the example of the Phnom Penh Water Supply Authority (PPWSA) in Cambodia. In the span of just 15 years, an almost bankrupt poor-performing water utility was transformed into an efficient profitable taxpaying entity, providing 24 hours of uninterrupted water supply to the residents of the Cambodian capital. This was achieved by focusing on different aspects of water governance such as legal and regulatory aspects, human resources, cost recovery, and financial sustainability. For a full account of how PPWSA was transformed, please see Biswas and Tortajada [80]. We also think that the case of PPWSA can be relevant to India, because both India and Cambodia are developing countries located in South and Southeast Asia, respectively. Other studies highlighting the positive impacts of water governance on sustainable development include Thắng et al. [81] and Bromley and Anderson [82].
In our view, India has to improve its water governance in order to achieve SDG6 targets related to drinking water. The cases of Jakarta and Phnom Penh are good examples of where the water sector will head in the future, depending on the state of water governance.
3. Theoretical Framework
Despite the importance of water governance for the sustainable water supply and management, it is generally acknowledged that there is a lack of a theoretical approach with respect to the research in water governance. Franks and Cleaver [62] argued that there is a surprising lack of analysis based on solid theoretical foundations and core concepts of governance. The reasons could be taking governance only as a normative set of principles, as argued by McGranahan and Satterthwaite [83], or because many elements of water governance are also incorporated in other concepts such as integrated water resources management, human rights, participatory management, and partnerships [84]. Franks and Cleaver [62] argued that many elements of water governance are taken from practitioners, and are not subjected to critical academic analysis and debates. Araral and Yu [85] also argued that most of the research in water governance is devoid of theoretical coherence and analytical rigor, as most of the studies are descriptive and not grounded in empirics. To address these gaps, Araral and Wang [86] argued for a paradigm shift in the water governance research and called for a water governance 2.0 research agenda. According to the study, public economics, new institutional economics, political economy, and public administration will make the core of this new water governance 2.0 and associated research as represented in Figure 1.
Water is usually considered a public good, so public sector economics has to play an important role in our understanding of water governance. Public sector economics is mainly concerned with market and government failures and their implications. These failures are explained with the help of the theory of commons, property rights, public goods, and agency theory. According to estimates, more than 85% of water utilities around the world are in government hands, and are often run inefficiently. For a more detailed discussion of public sector economics and its applications to water governance, see [85].
According to Araral and Yu [85], institutional economics constitutes the second core of research in water governance 2.0. Institutional economics theories such as the theory of incomplete contracts, agency theory, transaction cost theory, and the theory of property rights and commons are more relevant to water governance. For more on how these theories are relevant to water governance, please see Araral [87], Ménard and Saussier [88], and Guasch [89].
Political economy is the third core of water governance 2.0. Theories of political economy relevant to water governance research are public choice theory, game theory, and collective action theory [79]. As in many developing countries, politicians may influence the decisions regarding the provision of public services, as argued by Keefer [90], and water is one of these. Therefore, the political economy has an important place in water governance research.
As water utilities and agencies are mostly run by public officials and bureaucrats, therefore, the public administration practices such as human resource management, public financial management, transparency and efficiency in resource utilization, organizational structure, and leadership should also be the focus of research on water governance. There are many studies focusing on public administration aspect of water governance, such as for example Araral [87], Rijsberman [91], Davis [92], and Watson et al. [93].
This study builds on the Institutional Decomposition and Analysis (IDA) framework developed by Saleth and Dinar [77]. The framework consists of three institutional dimensions within the water sector i.e., water law, policy, and administration. The framework takes guidance from wider institutional literature such as North [94] and Ostrom [95]. It closely resembles the Institutional Analysis and Development (IAD) framework developed by Ostrom [95], but there are some fundamental differences between the two [77]. Dinar and Saleth [96] used the framework to compute the water institutions health index for 22 countries. This study uses an improved version of the IDA framework first used by Araral and David [78], and then Araral and Wang [79] and Araral and Ratra [22]. The improved framework consists of three variables that in turn consist of 20 indicators. Seventeen of these 20 indicators are ordinal, and three are nominal. We use ordinal indicators in our calculations, following Dinar and Saleth [96]. Figure 2 shows how water governance interacts with other institutions and impacts water systems performance.
In Figure 2 the big square containing water law, water policy, and water administration rectangles represents water governance. The figure shows that water governance interacts with water performance as well as other factors such as political and legal systems, demography, the level of economic development, and resource endowment. It also indicates that water governance is not the only factor impacting water performance, but the above-mentioned factors also influence it directly or indirectly. Figure 3 provides further details in the water institutions subsystem. All the indicators are carefully chosen by Saleth and Dinar to develop a holistic measure of water governance. For more details on the indicator selection and underlying logic behind, one should consult Saleth and Dinar [77]. Dinar and Saleth [96] used the same framework and indicators to calculate a Water Institutions Health Index (WIHI). Following this, we also utilize this methodology to calculate a water governance index for eight Indian states.
4. Data and Methods
Utilizing the above-mentioned framework 152 people were surveyed across eight states of India over two time periods. Survey one was conducted during 2014–2015, while survey two was conducted during 2017–2018. We used the same survey questionnaire used by Araral and Wang [79]. The states included in the survey are (1) Andhra Pradesh, (2) Arunachal Pradesh, (3) Karnataka, (4) Maharashtra, (5) Tamil Nadu, (6) Telangana, (7) Uttar Pradesh, and (8) Uttarakhand. Home to about 44% of the total Indian population, these states represent the widest socioeconomic and geographical diversity of India. Geographically, Arunachal Pradesh lies in the extreme east, Maharashtra lies in the west, Uttarakhand is situated in the northern Himalayan region, while Tamil Nadu is the southernmost state of India. These states can be fairly assumed to be representative of a large part of India, but still, we remain very cautious in extending and generalizing our findings for the whole country, because we acknowledge that 152 is a very small sample in a huge country such as India. The states have quite different topography and water endowments in terms of groundwater, surface water, and rain patterns. Maharashtra, Tamil Nadu, Andhra Pradesh, Uttar Pradesh, Telangana, and Karnataka are the states in India facing water scarcity problems due to various reasons such as climate change and the increasing population.
There were 74 respondents in the first survey who completed the questionnaire. These included 24 government officials in the water sector, seven engineers, 17 academics/researchers, 24 people from civil society/user groups, and two economists. The number of respondents ranged from seven for Arunachal Pradesh to 13 for Maharashtra. We used the same survey questionnaire that is used by Araral and David [78] and Saleth and Dinar [77]. The questionnaire can be found at [98].
For the second survey, there were 78 people who responded and completed the questionnaires. These included 20 engineers working in the water sector, 32 other government officials working in the water sector, 13 academics and researchers, and 11 people from civil society. The number of respondents for each state ranged from five for Arunachal Pradesh and Tamil Nadu each to 15 for Uttar Pradesh and Uttarakhand each. Details of respondents can be obtained from the authors.
We have ensured the reliability of data in the following ways. We have selected respondents based on their experience and responsibilities in the water sector. The respondent pool consists of people of responsibility from water ministries, water utilities, water apex bodies, academia, and the private sector. As the responses came from a pool of experts, the standard errors are distributed. In addition, we have reported our sample frame and standard deviations, enabling readers to judge the reliability of responses.
We have also chosen two other indicators to estimate the correlation between water governance variables and water performance and between water governance variables and the economic development of the states under study. It is very difficult to get state-level water performance indicators for India. The water performance indicator we use is the percentage of the rural population that has safe and adequate drinking water. This indicator is taken from the SDG India Index 2018 developed by National Institute of Transforming India (NITI) in collaboration with the United Nations [99]. The economic indicator we are using is the average per-capita income at the state level from 2012 to 2017 in 2011 constant dollar terms. This indicator is taken from the Central Statistical Organization, New Delhi.
To get the comprehensive picture of the state of water governance in the states under study, we employ four methods of analysis. First, we compute standardized scores for each of the indicators (see Table 1 for coding) for each state. We do this for both the old and new surveys. Then, we combine the scores from two surveys by taking a weighted average. The raw scores in the survey are collected on the scale of 0–10; we transform these raw scores into a standardized score by multiplying each score by 10. We do this because we are going to calculate a water governance index (WGI) for each state at the end of the study. The results are shown in Table 2. This gives an overall picture of all the indicator scores in both surveys as well as the combined scores.
Second, we report the descriptive statistics separately for water law, policy, and administration indicators. These statistics are reported for both old and new surveys individually, and for combined scores as well. This gives an insight into the state of the water law, policies, and administration in each state. With this, we can compare across the states the scores on all 17 indicators in terms of mean, standard deviation, minimum, and maximum. As we report it separately for both surveys, we are able to look into temporal variations in all indicators within the states. As we also report it for combined scores, we have an opportunity to compare weighted descriptive statistics such as mean and standard deviation. We can assign the overall rankings for each indicator based on weighted means.
Third, we calculate the average scores for water law, policies, and administration for all the eight states, and then report the descriptive statistics for water law, policies, and administration variables. The formula for calculating the average scores on water law, policy, and administration in a particular survey are given as:
Average score on water law = (L1 + L3 + L4 + L5 + L6)/5
Average score on water policy = (P2 + P3 + P4 + P5 + P6 + P7 + P8)/7
Average score on water administration = (A2 + A3 + A4 + A5 + A6)/5
Please note that the nominal variables L2, P1, and A1 are left out of these calculations.
Then, we calculate the correlation between these three variables and two other variables, which are (i) percentage of the population having safe and adequate drinking water in rural areas, and (ii) average per capita income from 2012 to 2017. We do this for two primary reasons. The first is to check the correlation between water governance and water performance, and the water governance and economy of the states. The second is to check the robustness and reliability of the data and estimates. If the individual survey scores from both surveys as well as the combined weighted scores have a similar correlation with water performance and state economy, we can say that the data is reliable, and the estimates are robust.
Finally, we calculate the WGI for each state. To calculate it, we estimate the average scores for water law, policies, and administration. For this purpose, we first average all the indicators for a particular variable for each survey response (here, one survey response is for one particular state). This way, we get the scores that each survey respondent has given to water law, policies, and administration variables. Then, we average these scores for each state to get a single score for each of the three variables for each state. We calculate both nominal and weighted water governance indices for eight states, as done by Dinar and Saleth [96].
After getting average water law policies and administration scores, we average them again to get a nominal water governance index (NWGI). For the weighted water governance index (WWGI), we multiply these average law, policy, and administration scores with a relative weight of each variable in overall water governance. Our questionnaire also asks for a relative weight (out of 100) to be given to each of these three variables. We first average these weights across all the 152 survey responses. As our indicators scores are already standardized, we divide these weights by 100. Then, we multiply these weights with respective scores for water law, policies, and administration for each state. Then, we add the three numbers to get a water governance index (WGI) for each state. Figure 4 shows the complete methodology in the form of a flowchart.
5. Results and Discussion
5.1. State of Water Law
Table 3 gives the summary statistics of water law indicators. We discuss each indicator and its variation among the states one by one. First, we report scores from two surveys individually, and then combined them by taking the weighted averages. We will refer the 2014–2015 survey as the old survey, and the 2017–2018 survey as the new survey from now on. Looking at the mean values of law indicators, it is clear that all the law indicators improved from the old survey to the new survey. This has improved the overall scores as well. There are variations in water law scores, and many states have changed positions from the old survey to the new survey.
For indicator L1 (level of legal differentiation), Andhra Pradesh scored a maximum of 68.8 in the old survey, but in the new survey, Arunachal Pradesh scored a maximum of 80 and Andhra Pradesh scored the minimum, which is 52.9. Telangana, which had the minimum score in the old survey, went many places up, with a score of 74. When we combine the scores from two surveys, Arunachal Pradesh gets the maximum score of 67.5, and Andhra Pradesh gets the minimum score of 58.7.
For indicator L3 (legal accountability of water sector officials), Maharashtra went from a minimum of 46.9 in the old survey to a maximum of 75.6 in the new survey. When scores from both surveys are combined, Maharashtra got the maximum score of 58.7, while Tamil Nadu got the minimum of 48.9.
For indicator L4 (level of centralization of water law), Telangana got the maximum score of 59 in the new survey, while in the old survey, Karnataka was the maximum, with a score of 48. In the old survey, Uttarakhand was at the minimum with a score of 15.7, which improved quite substantially and became 51.3 in the new survey, while Arunachal Pradesh got a minimum of 0.00 in the new survey. When the scores from the two surveys are combined, Telangana got a maximum of 50.5, and Arunachal Pradesh got a minimum of 10.00.
For indicator L5 (legal scope for private and user participation), Maharashtra went from a minimum score of 45.1 in the old survey to a maximum score of 62.6 in the new survey. Uttar Pradesh was at maximum with 58.3 in the old survey, while Arunachal Pradesh is at the minimum with a score of 44 in the new survey. When the scores are combined, Uttar Pradesh gets a maximum of 56.6 and Uttarakhand gets a minimum of 48.6.
For indicator L6 (integration of water law with other laws), Maharashtra again went from a minimum of 33.9 in the old survey to a maximum of 75.6 in the new survey. In the old survey, Uttarakhand was at maximum with a score of 56.7, while in the new survey, Karnataka is at a minimum with a score of 34. When the scores are combined, Uttar Pradesh has a maximum score of 61.7, while Karnataka has a minimum score of 38.
5.2. State of Water Policies
The mean values of policy-related indicators given in Table 4 indicate that similar to the water law, the scores on water policy also went up in the new survey as compared to the old survey. Scores from all the policy indicators increased in the new survey except for P4 (private sector participation). There are also variations among the states with time.
In the old survey, Arunachal Pradesh had a maximum score of 57.1 and Tamil Nadu had the minimum score, which is 46.9 for the water policy indicator P2 (linkage with other policies). In the new survey, Maharashtra has the maximum score, which is 69.2, and Arunachal Pradesh has the minimum, which is 42.6. When scores from two surveys are combined through weighted average, Maharashtra has the maximum score, which is 59.9, and Karnataka has the minimum, which is 49.6, as shown in Table 2.
Scores on indicator P3 (cost recovery) also increased substantially between the old survey and the new survey, as shown by the mean values given in Table 4. In the old survey, Telangana had the maximum score of 32.8, and Arunachal Pradesh had the minimum, which is 12.9. In the new survey, Tamil Nadu has the maximum score, which is 70, and Arunachal Pradesh has the minimum, which is 42, and a substantial improvement from survey one. When scores from the two surveys are combined, Telangana has the maximum score, which is 49.9, and Arunachal Pradesh has the minimum, which is 25.
Scores on indicator P4 (private sector participation) declined substantially between the first and second surveys. This indicates that policies are becoming less favorable to private sector participation in most of the state under study. In the first survey, Uttar Pradesh had the maximum score of 45.2, while Karnataka had the minimum score of 31.8. In the second survey, three states—Uttarakhand, Maharashtra, and Arunachal Pradesh—scored 0 on P4, while Telangana scored the maximum of 64.
For indicator P5 (user participation), most of the states improved the scores between the old and the new survey. Andhra Pradesh, Uttar Pradesh, Uttarakhand, and Telangana improved substantially in terms of policies favoring user participation. Arunachal Pradesh, Karnataka, and Tamil Nadu scored less in the new survey as compared to the old survey. In the old survey, Telangana scored the maximum of 47.7, and Uttarakhand scored the minimum of 33.9. In the new survey, Telangana scored the maximum of 66.3, and Tamil Nadu scored the minimum of 20.5. When the scores from the two surveys are combined, Telangana has the maximum score of 57, and Tamil Nadu has the minimum score of 34.
Scores for indicator P6 (linkage between water law and policy) also increased for most of the states between the old and the new survey, as shown by the mean values in Table 4. In the old survey, Uttar Pradesh had the maximum score of 61.3, and Telangana had the minimum score of 51. In the second survey, Maharashtra scored the maximum of 73.3, and Karnataka scored the minimum of 52.9. When scores are combined, Uttar Pradesh scored the maximum of 63.9, and Arunachal Pradesh scored the minimum, which is 55.8.
Andhra Pradesh scored the minimum in both the first and second survey for indicator P7 (attention to poverty). Telangana scored the maximum of 36 in the old survey, while Maharashtra scored the maximum of 67.8 in the new survey. For combined scores from the two surveys, Telangana scored a maximum of 50.5, while Andhra Pradesh scored a minimum of 16.8. The mean score for this indicator is the second-lowest, indicating that states are paying less attention to poverty while designing their water policies.
The scores for indicator P8 (availability of finance) also increased for most of the states between the old and new survey. Only one state, Arunachal Pradesh, recorded a decline in their score. Arunachal Pradesh scored a minimum on both surveys. In the old survey, Tamil Nadu had the maximum score of 51.8, while Maharashtra scored the maximum in the new survey, which is 69.2. When the scores are combined Telangana, has a maximum score of 59.1, and Arunachal Pradesh has a minimum score of 44.6.
5.3. State of Water Administration
Scores for almost all of the water administration indicators also increased between the old and new survey. This can be confirmed by looking at the mean values of these indicators in Table 5. In addition, there is also a substantial variation among the states between the two surveys.
Indicator A2 (functional capacity balance) saw significant improvement between the old and new survey. In the old survey, Maharashtra had the maximum score of 13.1, and Karnataka had the minimum score of 0. In the new survey, Telangana has the maximum score of 63, and Arunachal Pradesh has the minimum, which is 0. When the scores from the two surveys are combined, Uttar Pradesh has the maximum score, which is 43, and Arunachal Pradesh has the minimum, which is 1.7. This also shows the substantial difference between the states in terms of functional capacity balance. Many states have paid attention to achieve a higher level of functional capacity balance after the old survey was conducted.
Indicator A3 (independent pricing body) also saw substantial improvement between the old and new survey periods. In the old survey, Telangana had the maximum score of 24, and three other states, Tamil Nadu, Karnataka, and Arunachal Pradesh had the minimum score of 0. In the new survey, no state has a 0 score. Uttar Pradesh has the maximum score of 64.7, and Tamil Nadu has the minimum score of 22. It is clear from these scores that now states are empowering the water pricing bodies to make independent decisions. When the scores from two surveys are combined, Uttar Pradesh has the maximum score of 49.6, and Tamil Nadu has the minimum score of 7.9.
All the states except Tamil Nadu saw improvement in indicator A4 (accountability and regulatory mechanisms) between the old and new survey periods. For Tamil Nadu, it decreased slightly. In the old survey, Uttar Pradesh had the maximum score of 59.7, and Karnataka had the minimum score of 47.5. In the new survey, Maharashtra has the maximum score, which is 73.9, and Karnataka has the minimum score, which is 51. When scores from two surveys are combined, Uttar Pradesh has the maximum score of 68.6, and Karnataka has the minimum score of 48.67.
Scores on indicator A5 (validity of water data) also improved between the old and new survey periods. This shows that the experts surveyed are increasingly confident in the water data. In the old survey, Andhra Pradesh had the maximum score of 58.8, and Karnataka had the minimum score of 50. In the new survey, Maharashtra has the maximum score, which is 77.8, and Karnataka has the minimum score, which is 47. When the scores of the two surveys are combined, Uttar Pradesh has the maximum score of 68, and Karnataka has the minimum score of 49.
For indicator A6 (science and technology application), the scores for all the states increased between the old and new survey periods. In the old survey, Telangana had the maximum score of 72.7, and Arunachal Pradesh had the minimum score of 49. In the new survey, Maharashtra has the maximum score, which is 72.7, and Arunachal Pradesh has the minimum score, which is 46.7. When the scores from the two surveys are combined, Uttar Pradesh has the maximum score of 65.7, and Arunachal Pradesh has the minimum score of 48.4.
It is interesting to note that Uttar Pradesh has the maximum scores for all of the water administration indicators when the scores from the two surveys are combined. Uttar Pradesh has the maximum scores for eight out of 17 ordinal variables, and Telangana has the maximum scores for six ordinal variables.
5.4. t-Test and Area Graphs
To check if the differences in values of variables between the first and second survey are statistically significant, we conducted the t-test of significance. Table 6 shows the p values obtained for all the variables. Most of the values are significant at least at the 10% level.
Similarly, we also tested for significant differences (95% level) between the means of the variables from the two surveys. The p-values for water law, policy, and administration are 0.026, 0.018 and 0.001 respectively, making them all significant at least at the 5% level, further validating the robustness of our calculations.
In order to give a visual understanding of water governance in eight Indian states, we have also generated area graphs, as shown in Figure 5. Comparing the graphs gives important information about the state of water governance in each state. For example, the size of the graphs represents a higher overall governance score. The balance of the graphs indicates whether all the 17 indicators have identical scores, and the value patterns indicate which indicators have higher and lower scores.
Figure 5 tells us that Maharashtra, Telangana, Uttar Pradesh, and Uttarakhand have comparatively higher water governance scores, as the area graphs of these states are larger in size than those of the other four states. Telangana has the most balanced graph, followed by Uttar Pradesh. This means all the aspects of water governance variables are relatively consistent when compared to other states. Dinar and Saleth [96] noted that such consistency in institutional/governance variables is important to the health of water institutions. When it comes to value patterns, we can see that many states have lower scores on administration variables. Dinar and Saleth [96] argued that these value patterns have important implications. Higher scores on the administration variables will lead to the effective performance of water institutions. It is clear that many states here need to focus on the administration side of their water agencies and institutions.
5.5. Correlation of Governance Variables with Water Performance and State Economy
After analyzing the state-wise temporal variation in individual indicators, we combine those indicators by taking the simple average. Table 7 gives descriptive statistics of water law, policies, and administration variables generated by averaging their individual components. The average score for each state for each of the three variables is given in Table 7.
As shown by the mean values, the scores increased substantially between the old and new survey periods. This depicts an overall positive trend in water governance in India in general, and in the states under study in particular. The most substantial improvement is in the average score for water administration, which jumped from 36.5 to 54.4 between the old and new surveys. What could be the reasons for this?
India has paid special attention to the provision of clean drinking water after the announcement of the SDGs in 2016. The provision of clean drinking water is part of goal 6, or SDG6, which also includes the provision of safe sanitation to all.
In 2017, India restructured the National Rural Drinking Water Program (NRDWP), which was originally launched in 2011. It is now more efficient and performance-oriented. States now have to compete for NRDWP funding both by the speedy completion of piped water supply projects and by the verification of completed projects by third parties.
Also in 2015, the government of India launched the National Water Quality Sub Mission (NWQSM) to improve the quality of drinking water inhabitations where people are forced to use contaminated water. In March 2018, the Indian government launched a community-led drinking water program called Swajal. The aim of this program is to promote community participation in water supply and sanitation systems, and change the role of state government from service provider to facilitator.
Indian governments both at the central and the state levels have invested heavily in the provision of clean drinking water. Rs. 17,184 crores have been invested in NRDWP from 2016 to 2018. During the same period, the state of Telangana has invested over Rs. 40,000 crores to provide piped water to every household.
Table 8 shows the correlations between three water governance variables and two other objective variables, i.e., the percent of the population having safe and adequate drinking water in rural areas, and the average per-capita income of each state between 2012 and 2017. It is clear from the results that the water governance variables are positively correlated with the water performance variables. The correlations are positive for individual survey scores as well as when scores from both surveys are combined. This is in line with the broader literature, which states that water governance is positively correlated with water performance. Here specifically, we see that correlation between “% Population having safe and adequate drinking water in rural areas” and water administration score is strongest among all correlations in both surveys, supporting the argument of Dinar and Saleth [96] that water administration is key to the effectiveness of water institutions.
The correlations of water performance variables with the per-capita income of the states are mostly negative, and are contrary to the expectations. These are not entirely surprising for the reasons that India has only recently started to have greater economic growth. It may take a longer time for a better economy to have a positive impact on water governance. This is because decisions for allocating resources for public services are normally influenced by political economies of the states and the center. Still, for the new survey, the water policies variable is positively correlated with the average per-capita income of the state. This can be an indication that better economies of the states may have started resulting in better water policies. This correlation analysis also serves as a robustness check for our data and estimates. The correlations are mostly in the same (positive) direction for both surveys individually, as well as when scores are combined, showing that the data is reliable.
In the final step, we calculated the water governance index for eight Indian states. The use of indicators and indices for policy-making based on objective and observed data has a long history and acceptance. Some of these indicators and indices include gross domestic product (GDP), per-capita income, the human development index, and the sustainable livelihood security index. However, more recently, indicators and indices based on subject/perception data are also gaining widespread attention and acceptance. Such indices used ex ante information collected from experts/stakeholders through surveys. Examples of such indices are the corruption perception index by Transparency International and Bureaucratic Quality Index (BQI), which is developed by the Political Risk Services Group (PRSG). The indicators and indices used in the water sector are the Water Barrier Norm by Falkenmark [100], the Water Poverty Index by Sullivan [101], and the Water Institutions Health Index (WIHI) by Dinar and Saleth [94]. Iribarnegaray and Seghezzo [102] also calculated a Sustainable Water Governance Index (SWGI) for the city of Salta, Argentina and argued that these indices, when combined with contextual information, can be very helpful in making water and sanitation-related decisions. Our index most closely resembles the WIHI, as we use the same but improved framework developed by Dinar and Saleth [96].
We calculate both nominal and weighted water governance indices. The results are given in columns eight and nine of Table 9. The method for calculating these indices is described in the methodology section. It is evident from the results that both the nominal and weighted indices are in close proximity. Dinar and Saleth [96] also calculated the nominal and weighted indices for India at the country level; those are also identical in magnitude. However, our state indices are significantly greater than those obtained by Dinar and Saleth [96]. This reflects that survey respondents reported an improvement in water governance between 2005 and now.
We can see that almost all of the values of both indices are identical as given in Table 9. The reason for this is that on the average, the survey respondents gave almost equal weight to all three aspects of water governance, i.e., water law, policies, and administration.
6. Conclusions and Implications
Good water governance is the key for the sustainable management of water resources, which is important for the realization of SDGs and particularly SDG6, which specifically deals with water and sanitation. There is no single agreed upon measure to assess water governance, and many frameworks and indices are used. In this paper, we made an attempt to measure and compare three components of water governance—i.e., water law, policy, and administration—across eight Indian states. We utilized an improved version of Institutional Decomposition and Analysis (IDA) framework, which was originally developed by Saleth and Dinar. We used survey data collected from 152 respondents across eight Indian states in two separate surveys. The first survey was held in 2014–2015—i.e., before the announcement of SDGs, and the second survey was done in 2017–2018—i.e., after the announcement of SDGs. The respondents include water sector officials, academics/researchers, and people from civil society/user groups.
Our findings suggest that water governance in the eight Indian states under study may have improved, as reported by survey respondents. If we compare the results with previous literature, we can see the improvement in water governance in the Indian states under study. Araral and Ratra [22] used the same framework to compare water governance in China and India. The scores obtained for India by the study are same as those obtained in our study using the first survey data, but the scores obtained by our study using the second survey (which was conducted after the announcement of the SDGs) shows considerable improvement. India has many programs and initiatives geared toward realizing SDGs, which may have contributed toward the improvement of water governance scores in the second survey. Some of the notable programs and regulatory measures include the National Rural Drinking Water Program (NRDWP), Accelerated Urban Water Supply Program (AUWSP), Water Framework Law of India 2016, and Namame-Gange and National Water Policy. As water is constitutionally a state subject in India, therefore, state governments are responsible for governing water within their boundaries with technical and financial help from the center. Many ministries at the federal level are involved in work related to water governance and SDGs. These ministries include the Ministry of Water Resources, River Development and Ganga Rejuvenation (MoWR, RD & GR), the Ministry of Drinking Water and Sanitation (MoDWS), the Ministry of Housing and Urban Affairs (MoHUA), the Ministry of Environment, Forest, and Climate Change (MoEFCC), and the Ministry of Agriculture and Farmers’ Welfare (MoAFW). The NRDWP is the flagship scheme to provide safe drinking water to rural areas. This program is implemented by states, with 50% funding provided by the center. For the period of 2017/18 to 2019/20, a sum of 23,050 crore Indian rupees has been approved for the program. India also has an apex body called NITI Aayog, which directly reports to the prime minister and is tasked with coordination among all stakeholders involved in the implementation of SDGs. States regularly apprise NITI Aayog about progress on SDGs [103]. All this should have contributed to the reported improvement in water governance.
The study also estimates the correlation between water law, policy, and administration, and the drinking water performance and economies of the states. We find that as expected, all the water governance variables are positively correlated with drinking water performance. This is true for both the surveys individually and when the scores from both surveys are combined. Araral and Wang [79] also found a positive correlation between water governance (the study uses the same framework as ours) and water sector performance using survey data from 10 provinces in China. The water sector performance measures they used include drinking water adequacy, overall water productivity, industrial water productivity, and agricultural water productivity. The correlations between water governance variables and the per-capita income of the states are negative in most cases, except for the water policy variable, which was estimated with 2017–2018 survey data. This can be because a better economy does not automatically lead to better water governance.
The study provides an in-depth view to water policymakers in India both at the federal and state level, as it takes a bottom–up approach to have a nuanced view of water governance across eight Indian states. First, it calculates and compares score across 17 ordinal indicators, capturing cross-sectional and temporal variations. Then, it combines the scores of those 17 indicators to calculate water law, policy, and administration variables. Finally, we calculate a water governance index (WGI) for each state. Following Dinar and Saleth [96], we have calculated both the nominal and weighted WGI for each state. This is the first time that an attempt has been made to calculate a water governance index for India at the state level. The WGI provides a useful measure to compare states in terms of water governance. This can help water policymakers in better decision making.
The study uses an established framework to assess water governance. In our view, there are two main advantages or strengths of utilizing the framework that we use. First, this framework takes water governance mainly as a function of government. It assesses water governance at three different levels: water law at the macro level, water policy at the meso level, and water administration at the micro level. This is a more realistic approach, as in the developing countries such as India, the water governance is mainly carried out by the government. Second, this framework places water governance as a component in a wider water institutional context as represented by Figure 2, showing that water governance is one of the factors influencing water sector performance, and there are many other political, social, and economic factors that also influence the water sector directly or indirectly. This gives us a conceptual clarity about water governance with well-defined boundaries, making it measureable with relative ease. Frameworks used by other studies try to present water governance as an all-encompassing concept, rendering it conceptually ambiguous and making it difficult to measure; see for example Bakker, Kooy, Shofiani and Martijn [76]; Thắng, Tran, and Luong [81]; Aminova and Abdullayev [104]; Franks and Cleaver [105]; and Iribarnegaray and Seghezzo [102].
There are some potential limitations to our study that need to be taken into account while interpreting the results. First, this study only measures the state of water governance in eight Indian states utilizing data from two surveys. The aim of this study is to see if water governance has improved between the first and second survey periods. The study only calculates correlations between water governance variables and two other variables. Due to the lack of data, we have not made an attempt to establish a causal relationship between water governance and water performance/sustainable water management. So, care must be taken while interpreting the results. Second, as India is a big country, some of the states such as Uttar Pradesh are huge in population and area. It would have been ideal to get more survey responses for such states. However, due to time, cost, and other constraints, we could not solicit more responses. Third, care needs to be taken while generalizing the results to the whole of India. This is because some of the drier states such as Rajasthan and Gujarat are not included in the study, and water is more often treated as a local good. Fourth, the study is based on perception data collected through surveys, so there is always an element of bias in sampling as well as responses [106]. Dinar and Saleth [96] argued that this bias can be significantly reduced if the number of respondents is greater than three for each country (in our case, it will be a state). It is satisfying that in our study, the minimum number of respondents in any state is 12, but still, the element of bias cannot be fully eliminated in perception-based surveys. In both surveys, the respondents in each state were not necessarily the same people. This needs to be taken into consideration while interpreting the results.
The study also throws open many questions for future research within the Indian and South Asian context. Similar studies can be carried out in other Indian states and also in other South Asian countries. In addition, as we have seen, the water governance indicator scores mostly increased from the old to the new survey. It will be interesting to probe whether these improvements are due to water governance reforms or some other factor such as better human resources. There is a need to conduct studies establishing causal linkages between measures taken by governments and resulting improvements in water governance scores, and also between water governance scores and SDG6 indicators. It will be worthwhile to probe why there are negative correlations between water governance variables and the average per-capita income of states under study. Whether it is due to the lagged effect of the economy, corruption, or simply neglect of the water sector in terms of resource provision despite the economic growth of states remains to be investigated.
Author Contributions
The contributions of the authors are as follows: conceptualization, M.A. and E.A.; methodology, M.A.; formal analysis, M.A.; investigation, M.A.; resources, E.A.; data curation, M.A.; writing—original draft preparation, M.A.; writing—review and editing, E.A.; supervision, E.A.; project administration, E.A.; funding acquisition, E.A.
Funding
This research was funded by the Institute of Water Policy (IWP) at the LKY School of Public Policy, National University of Singapore, grant number WBS R 603 000 193 490.
Acknowledgments
We acknowledge the support (other than funding) provided by Institute of Water Policy (IWP) at the LKY School of Public Policy, National University of Singapore. We also acknowledge the feedback provided by two anonymous reviewers which helped us improve the paper.
Conflicts of Interest
The authors declare no conflict of interest.
References
- Hunter, P.R.; MacDonald, A.M.; Carter, R.C. Water supply and health. PLoS Med. 2010, 7, e1000361. [Google Scholar] [CrossRef] [PubMed]
- Mekonnen, M.M.; Hoekstra, A.Y. Four billion people facing severe water scarcity. Sci. Adv. 2016, 2, e1500323. [Google Scholar] [CrossRef] [PubMed]
- World Health Organization; WHO/UNICEF Joint Water Supply, and Sanitation Monitoring Programme. Progress on Sanitation and Drinking Water: 2015 Update and MDG Assessment; World Health Organization: Geneva, Switzerland, 2015. [Google Scholar]
- Chaudhuri, S.; Roy, M. Drinking water sources in India: How safe is safe? Curr. Sci. 2017, 113, 393–402. [Google Scholar] [CrossRef]
- Cronin, A.A.; Prakash, A.; Priya, S.; Coates, S. Water in India: Situation and prospects. Water Policy 2014, 16, 425–441. [Google Scholar] [CrossRef]
- India world’s 13th most water-stressed country: WRI. Available online: https://www.downtoearth.org.in/news/water/india-world-s-13th-most-water-stressed-country-wri-66066 (accessed on 25 May 2019).
- Verma, S.; Phansalkar, S.J. India’s Water Future 2050: Potential Deviations from ‘Business-as-Usual’. Int. J. Rural Manag. 2007, 3, 149–179. [Google Scholar] [CrossRef]
- Pandit, C.; Biswas, A.K. India’s National Water Policy:‘feel good’document, nothing more. Int. J. Water Resour. Dev. 2019, 1–14. [Google Scholar] [CrossRef]
- Bhatt, N.; Bhatt, K.J. An Analysis of Water Governance in India: Problems and Remedies. Int. J. Adv. Eng. Res. Dev. 2018. [Google Scholar] [CrossRef]
- Lindamood, D. Towards a More Sustainable Water Future: Water Governance and Sustainable Development Goal 6 Achievability in India. Master’s Thesis, University of Waterloo, Waterloo, ON, Canada, 2017. [Google Scholar]
- Hutchings, P.; Franceys, R.; Smits, S.; Mekala, S. Community Management of Rural Water Supply: Case Studies of Success from India; Routledge: Abingdon-on-Thames, UK, 2017. [Google Scholar]
- Arora, R.K. Indian Public Administration: Institutions and Issues; New Age International: New Delhi, India, 1995. [Google Scholar]
- Cronin, A.A.; Prakash, A.; Sridhar, P.; Coates, S. Drinking Water Supply in India: Context and Prospects. In Indian Water Policy at the Crossroads: Resources, Technology and Reforms; Springer: Berlin/Heidelberg, Germany, 2016; pp. 49–71. [Google Scholar]
- Sahu, S. Sustainable Urban Water supply in India: Some Issues of Governance. J. Gov. Public Policy 2016, 6, 105. [Google Scholar]
- McKenzie, D.; Ray, I. Urban water supply in India: Status, reform options and possible lessons. Water Policy 2009, 11, 442–460. [Google Scholar] [CrossRef]
- Seaforth, W. Why water is a women’s issue: Habitat debate. UNCHS Habitat 2001, 7, 9. [Google Scholar]
- Shah, M. Water: Towards a paradigm shift in the twelfth plan. Econ. Political Wkly. 2013, 48, 40–52. [Google Scholar]
- Aid, W. Profiling Informal City of Delhi: Policies, Norms, Institutions and Scope of Interventions; Water Aid India and Delhi Slum Dwellers Federation: New Delhi, India, 2006. [Google Scholar]
- Kishor, S.; Gupta, K. Gender Equality and Womens Empowerment in India; National Family Health Survey (NFHS-3) India 2005-06; National Family Health Survey: Maharashtra, India, 2009. [Google Scholar]
- Wang, Y.; Mukherjee, M.; Wu, D.; Wu, X. Combating river pollution in China and India: Policy measures and governance challenges. Water Policy 2016, 18, 122–137. [Google Scholar] [CrossRef]
- Murty, M.N.; Kumar, S. Water pollution in India: An economic appraisal. India Infrastruct. Rep. 2011, 19, 285–298. [Google Scholar]
- Araral, E.; Ratra, S. Water governance in India and China: Comparison of water law, policy and administration. Water Policy 2016, 18, 14–31. [Google Scholar] [CrossRef]
- India and Sustainable Development Goals: The Way Forward. Available online: http://ris.org.in/sdg/india-and-sustainable-development-goals-way-forward (accessed on 25 May 2019).
- Qian, Y. Sustainable Management of Water Resources. Engineering 2016, 2, 23–25. [Google Scholar] [CrossRef] [Green Version]
- Rogers, P.P.; Llamas, M.R.; Cortina, L.M. Water Crisis: Myth or Reality? CRC Press: Boca Raton, FL, USA, 2005. [Google Scholar]
- Brundtland, G.H.; Khalid, M.; Agnelli, S.; Al-Athel, S.; Chidzero, B. Our Common Future; Oxford University Press: Oxford, UK; New York, NY, USA, 1987. [Google Scholar]
- Loucks, D.P. Sustainable water resources management. Water Int. 2000, 25, 3–10. [Google Scholar] [CrossRef]
- Loucks, D.P.; Gladwell, J.S. Sustainability Criteria for Water Resource Systems; Cambridge University Press: Cambridge, UK, 1999. [Google Scholar]
- Mays, L.W. Water Resources Sustainability; McGraw-Hill: New York, NY, USA, 2007. [Google Scholar]
- Alley, W.M.; Reilly, T.E.; Franke, O.L. Sustainability of Ground-Water Resources; U.S. Department of the Interior; U.S. Geological Survey: Reston, VA, USA, 1999; Volume 1186.
- Russo, T.; Alfredo, K.; Fisher, J. Sustainable water management in urban, agricultural, and natural systems. Water 2014, 6, 3934–3956. [Google Scholar] [CrossRef]
- Johnson, S.P. The earth summit: The United Nations conference on environment and development (UNCED). Verfass. Recht Übersee 1994, 28, 134–135. [Google Scholar]
- Tundisi, J.G. Water resources in the future: Problems and solutions. Estud. Av. 2008, 22, 7–16. [Google Scholar] [CrossRef]
- Cosgrove, W.J.; Loucks, D.P. Water management: Current and future challenges and research directions. Water Resour. Res. 2015, 51, 4823–4839. [Google Scholar] [CrossRef] [Green Version]
- Durán-Sánchez, A.; Álvarez-García, J.; Del Río-Rama, M.D.L.C. Sustainable Water Resources Management: A Bibliometric Overview. Water 2018, 10, 1191. [Google Scholar] [CrossRef]
- Gleick, P.H. Basic water requirements for human activities: Meeting basic needs. Water Int. 1996, 21, 83–92. [Google Scholar] [CrossRef]
- Gleick, P.H.; Chalecki, E.L.; Wong, A. Measuring Water Well-Being: Water Indicators and Indices; Island Press: Washington, DC, USA, 2002. [Google Scholar]
- Ness, B.; Urbel-Piirsalu, E.; Anderberg, S.; Olsson, L. Categorising tools for sustainability assessment. Ecol. Econ. 2007, 60, 498–508. [Google Scholar] [CrossRef]
- Singh, R.K.; Murty, H.R.; Gupta, S.K.; Dikshit, A.K. An overview of sustainability assessment methodologies. Ecol. Indic. 2012, 15, 281–299. [Google Scholar] [CrossRef]
- Mori, K.; Christodoulou, A. Review of sustainability indices and indicators: Towards a new City Sustainability Index (CSI). Environ. Impact Assess. Rev. 2012, 32, 94–106. [Google Scholar] [CrossRef]
- Hellström, D.; Jeppsson, U.; Kärrman, E. A framework for systems analysis of sustainable urban water management. Environ. Impact Assess. Rev. 2000, 20, 311–321. [Google Scholar] [CrossRef]
- Juwana, I.; Muttil, N.; Perera, B. Indicator-based water sustainability assessment—A review. Sci. Total Environ. 2012, 438, 357–371. [Google Scholar] [CrossRef]
- Lawrence, P.R.; Meigh, J.; Sullivan, C. The Water Poverty Index: An International Comparison; Citeseer: University Park, PA, USA, 2002. [Google Scholar]
- Chaves, H.M.; Alipaz, S. An integrated indicator based on basin hydrology, environment, life, and policy: The watershed sustainability index. Water Resour. Manag. 2007, 21, 883–895. [Google Scholar] [CrossRef]
- Dunn, G.; Bakker, K. Fresh water-related indicators in Canada: An inventory and analysis. Can. Water Resour. J. 2011, 36, 135–148. [Google Scholar] [CrossRef]
- Kitzes, J.; Peller, A.; Goldfinger, S.; Wackernagel, M. Current methods for calculating national ecological footprint accounts. Sci. Environ. Sustain. Soc. 2007, 4, 1–9. [Google Scholar]
- Hoekstra, A.Y.; Chapagain, A.K.; Mekonnen, M.M.; Aldaya, M.M. The Water Footprint Assessment Manual: Setting the Global Standard; Routledge: Abingdon-on-Thames, UK, 2011. [Google Scholar]
- Hoekstra, A.Y. The global dimension of water governance: Why the river basin approach is no longer sufficient and why cooperative action at global level is needed. Water 2011, 3, 21–46. [Google Scholar] [CrossRef]
- Lautze, J.; De Silva, S.; Giordano, M.; Sanford, L. Putting the cart before the horse: Water governance and IWRM. Nat. Resour. Forum 2011, 35, 1–8. [Google Scholar] [CrossRef]
- Rogers, P.; Hall, A.W. Effective Water Governance; Global Water Partnership: Stockholm, Sweden, 2003; Volume 7. [Google Scholar]
- Pahl-Wostl, C. An evolutionary perspective on water governance: From understanding to transformation. Water Resour. Manag. 2017, 31, 2917–2932. [Google Scholar] [CrossRef]
- Gleick, P.H.; Wolff, G.H.; Cooley, H.; Palaniappan, M.; Samulon, A.; Lee, E.; Morrison, J.; Katz, D. The World’s Water 2006–2007: The Biennial Report on Freshwater Resources; Island Press: Washington, DC, USA, 2013. [Google Scholar]
- Parkes, M.W.; Morrison, K.E.; Bunch, M.J.; Hallström, L.K.; Neudoerffer, R.C.; Venema, H.D.; Waltner-Toews, D. Towards integrated governance for water, health and social–ecological systems: The watershed governance prism. Glob. Environ. Chang. 2010, 20, 693–704. [Google Scholar] [CrossRef]
- Engle, N.; Johns, O.; Lemos, M.C.; Nelson, D. Integrated and adaptive management of water resources: Tensions, legacies, and the next best thing. Ecol. Soc. 2011, 16, 19. [Google Scholar] [CrossRef]
- Halbe, J.; Pahl-Wostl, C.; Sendzimir, J.; Adamowski, J. Towards adaptive and integrated management paradigms to meet the challenges of water governance. Water Sci. Technol. 2013, 67, 2651–2660. [Google Scholar] [CrossRef]
- de Loë, R.C.; Patterson, J.J. Rethinking water governance: Moving beyond water-centric perspectives in a connected and changing world. Nat. Resour. J. 2017, 57, 75–100. [Google Scholar]
- Pahl-Wostl, C.; Holtz, G.; Kastens, B.; Knieper, C. Analyzing complex water governance regimes: The management and transition framework. Environ. Sci. Policy 2010, 13, 571–581. [Google Scholar] [CrossRef]
- Foerster, A. Developing purposeful and adaptive institutions for effective environmental water governance. Water Resour. Manag. 2011, 25, 4005–4018. [Google Scholar] [CrossRef]
- Farrelly, M.; Brown, R. Rethinking urban water management: Experimentation as a way forward? Glob. Environ. Chang. 2011, 21, 721–732. [Google Scholar] [CrossRef]
- Mollinga, P.P.; Meinzen-Dick, R.S.; Merrey, D.J. Politics, plurality and problemsheds: A strategic approach for reform of agricultural water resources management. Dev. Policy Rev. 2007, 25, 699–719. [Google Scholar] [CrossRef]
- Woodhouse, P.; Muller, M. Water governance—An historical perspective on current debates. World Dev. 2017, 92, 225–241. [Google Scholar] [CrossRef]
- Franks, T.; Cleaver, F. Water governance and poverty: A framework for analysis. Prog. Dev. Stud. 2007, 7, 291–306. [Google Scholar] [CrossRef]
- Biermann, F.; Betsill, M.M.; Gupta, J.; Kanie, N.; Lebel, L.; Liverman, D.; Schroeder, H.; Siebenhüner, B.; Zondervan, R. Earth system governance: A research framework. Int. Environ. Agreem. Politics Law Econ. 2010, 10, 277–298. [Google Scholar] [CrossRef]
- Bansil, P. Water Management in India; Concept Publishing Company: New Delhi, India, 2004. [Google Scholar]
- Prokopy, L.S. The relationship between participation and project outcomes: Evidence from rural water supply projects in India. World Dev. 2005, 33, 1801–1819. [Google Scholar] [CrossRef]
- Bakker, K. The “commons” versus the “commodity”: Alter-globalization, anti-privatization and the human right to water in the global south. Antipode 2007, 39, 430–455. [Google Scholar] [CrossRef]
- Conrad, C.C.; Hilchey, K.G. A review of citizen science and community-based environmental monitoring: Issues and opportunities. Environ. Monit. Assess. 2011, 176, 273–291. [Google Scholar] [CrossRef]
- Wallis, P.J.; Ison, R.L.; Samson, K. Identifying the conditions for social learning in water governance in regional Australia. Land Use Policy 2013, 31, 412–421. [Google Scholar] [CrossRef]
- Bertule, M.; Glennie, P.; Bjørnsen, P.K.; Lloyd, G.J.; Kjellen, M.; Dalton, J.; Rieu-Clarke, A.; Romano, O.; Tropp, H.; Newton, J. Monitoring Water Resources Governance Progress Globally: Experiences from Monitoring SDG Indicator 6.5. 1 on Integrated Water Resources Management Implementation. Water 2018, 10, 1744. [Google Scholar] [CrossRef]
- Hooper, B. River basin organization performance indicators: Application to the Delaware River basin commission. Water Policy 2010, 12, 461–478. [Google Scholar] [CrossRef]
- Akhmouch, A.; Correia, F.N. The 12 OECD principles on water governance—When science meets policy. Util. Policy 2016, 43, 14–20. [Google Scholar] [CrossRef]
- Pires, A.; Morato, J.; Peixoto, H.; Botero, V.; Zuluaga, L.; Figueroa, A. Sustainability Assessment of indicators for integrated water resources management. Sci. Total Environ. 2017, 578, 139–147. [Google Scholar] [CrossRef] [PubMed]
- De Stefano, L. International initiatives for water policy assessment: A review. Water Resour. Manag. 2010, 24, 2449–2466. [Google Scholar] [CrossRef]
- Kaufmann, D.; Kraay, A.; Mastruzzi, M. The worldwide governance indicators: Methodology and analytical issues. Hague J. Rule Law 2011, 3, 220–246. [Google Scholar] [CrossRef]
- Jacobson, M.; Meyer, F.; Oia, I.; Reddy, P.; Tropp, H. User’s Guide on Assessing Water Governance; UNDP Governance Centre: Oslo, Norway, 2013.
- Bakker, K.; Kooy, M.; Shofiani, N.E.; Martijn, E.J. Governance failure: Rethinking the institutional dimensions of urban water supply to poor households. World Dev. 2008, 36, 1891–1915. [Google Scholar] [CrossRef]
- Saleth, R.M.; Dinar, A. The Institutional Economics of Water: A Cross-Country Analysis of Institutions and Performance; The World Bank: Washington, DC, USA, 2004. [Google Scholar]
- Araral, E.; David, J.Y. Comparative water law, policies, and administration in Asia: Evidence from 17 countries. Water Resour. Res. 2013, 49, 5307–5316. [Google Scholar] [CrossRef]
- Araral, E.; Wang, Y. Does water governance matter to water sector performance? Evidence from ten provinces in China. Water Policy 2015, 17, 268–282. [Google Scholar] [CrossRef]
- Biswas, A.K.; Tortajada, C. Water supply of Phnom Penh: An example of good governance. Int. J. Water Resour. Dev. 2010, 26, 157–172. [Google Scholar] [CrossRef]
- Thắng, V.T.; Tran, T.; Luong, D. Water governance for sustainable development: International practices and implications for the Mekong Delta region. J. Econ. Dev. 2019, 24, 99–120. [Google Scholar]
- Bromley, D.W.; Anderson, G. Does Water Governance Matter? Water Econ. Policy 2018, 4, 1750002. [Google Scholar] [CrossRef]
- McGranahan, G.; Satterthwaite, D. Governance and Getting the Private Sector to Provide Better Water and Sanitation Services to the Urban Poor; International Institute for Environment and Development: London, UK, 2006. [Google Scholar]
- Ryan, P. Scaling-up: A Literature Review; International Resource Centre: Delft, The Netherlands, 2004. [Google Scholar]
- Araral, E.; Yu, D. Water Governance: Critique, Theory and Evidence from Asia. Working Paper. 2012. Available online: https://www.researchgate.net/profile/Eduardo_Araral2/publication/268029924_Water_governance_Critique_Theory_and_Evidence_from_Asia_1/links/567e367108aebccc4e040d1f/Water-governance-Critique-Theory-and-Evidence-from-Asia-1.pdf (accessed on 20 May 2019).
- Araral, E.; Wang, Y. Water governance 2.0: A review and second generation research agenda. Water Resour. Manag. 2013, 27, 3945–3957. [Google Scholar] [CrossRef]
- Araral, E. The failure of water utilities privatization: Synthesis of evidence, analysis and implications. Policy Soc. 2009, 27, 221–228. [Google Scholar] [CrossRef]
- Ménard, C.; Saussier, S. Contractual choice and performance the case of water supply in France. Rev. D’écon. Ind. 2000, 92, 385–404. [Google Scholar] [CrossRef]
- Guasch, J.L. Granting and Renegotiating Infrastructure Concessions: Doing It Right; The World Bank: Washington, DC, USA, 2004. [Google Scholar]
- Keefer, P. Democracy, Public Expenditures, and the Poor. World Bank Res. Obs. 2005, 20, 1–28. [Google Scholar] [CrossRef]
- Rijsberman, F.R. Water for food: Corruption in irrigation systems. In Global Corruption Report 2008; Transparency International Pakistan: Karachi, Pakistan, 2008; Volume 67. [Google Scholar]
- Davis, J. Corruption in public service delivery: Experience from South Asia’s water and sanitation sector. World Dev. 2004, 32, 53–71. [Google Scholar] [CrossRef]
- Watson, N.; Deeming, H.; Treffny, R. Beyond Bureaucracy? Assessing Institutional Change in the Governance of Water in England. Water Altern. 2009, 2, 448–460. [Google Scholar]
- North, D.C. A transaction cost theory of politics. J. Theor. Politics 1990, 2, 355–367. [Google Scholar] [CrossRef]
- Ostrom, E. Governing The Commons: The Evolution Of Institutions for Collective Action; Cambridge University Press: Cambridge, UK, 1990; Volume 68. [Google Scholar]
- Dinar, A.; Saleth, R.M. Can water institutions be cured? A water institutions health index. Water Sci. Technol. Water Supply 2005, 5, 17–40. [Google Scholar] [CrossRef]
- Saleth, R.M.; Dinar, A. Water institutional reforms: theory and practice. Water Policy 2005, 7, 1–19. [Google Scholar] [CrossRef] [Green Version]
- Survey Questionnaire. Available online: https://www.surveymonkey.com/r/Preview/?sm=L6_2FbVvBGKhC2rlmIzkUQh52EtmZArruyGeLmwN_2FcWxPtojhUsRfH9IQRmM4r8fhV (accessed on 25 May 2019).
- SDG India Index 2018: A Baseline Report. Available online: https://in.one.un.org/wp-content/uploads/2018/12/SDX-Index-India-21-12-2018.pdf (accessed on 25 May 2019).
- Falkenmark, M. New Ecological Approach to the Water Cycle: Ticket to the Future. Ambio 1984, 13, 152–160. [Google Scholar]
- Sullivan, C. Calculating a water poverty index. World Dev. 2002, 30, 1195–1210. [Google Scholar] [CrossRef]
- Iribarnegaray, M.; Seghezzo, L. Governance, sustainability and decision making in water and sanitation management systems. Sustainability 2012, 4, 2922–2945. [Google Scholar] [CrossRef]
- Girija K Baharat, N.B.D. Aligning India’s Water Resource Policies with the SDGs, TERI Discussion Paper; The Energy and Resources Institute: New Delhi, India, 2018. [Google Scholar]
- Aminova, M.; Abdullayev, I. Water management in a state-centered environment: Water governance analysis of Uzbekistan. Sustainability 2009, 1, 1240–1265. [Google Scholar] [CrossRef]
- Franks, T.; Cleaver, F. Analysing water governance: A tool for sustainability? Proc. Inst. Civ. Eng. Eng. Sustain. 2009, 162, 207–213. [Google Scholar] [CrossRef]
- Kaufmann, D.; Kraay, A.; Mastruzzi, M. Governance Matters III: Governance Indicators for 1996–2002; The World Bank: Washington, DC, USA, 2003. [Google Scholar]
Figure 1.
Foundations for Water Governance 2.0. Source: Araral and Wang [86].
Figure 1.
Foundations for Water Governance 2.0. Source: Araral and Wang [86].

Figure 2.
Water governance and water performance. Source: Saleth and Dinar [77].
Figure 2.
Water governance and water performance. Source: Saleth and Dinar [77].

Figure 3.
Composition of water governance. Source: Saleth and Dinar [77]
Figure 3.
Composition of water governance. Source: Saleth and Dinar [77]

Figure 4.
Flowchart of methodology.

Figure 5.
Area graphs.


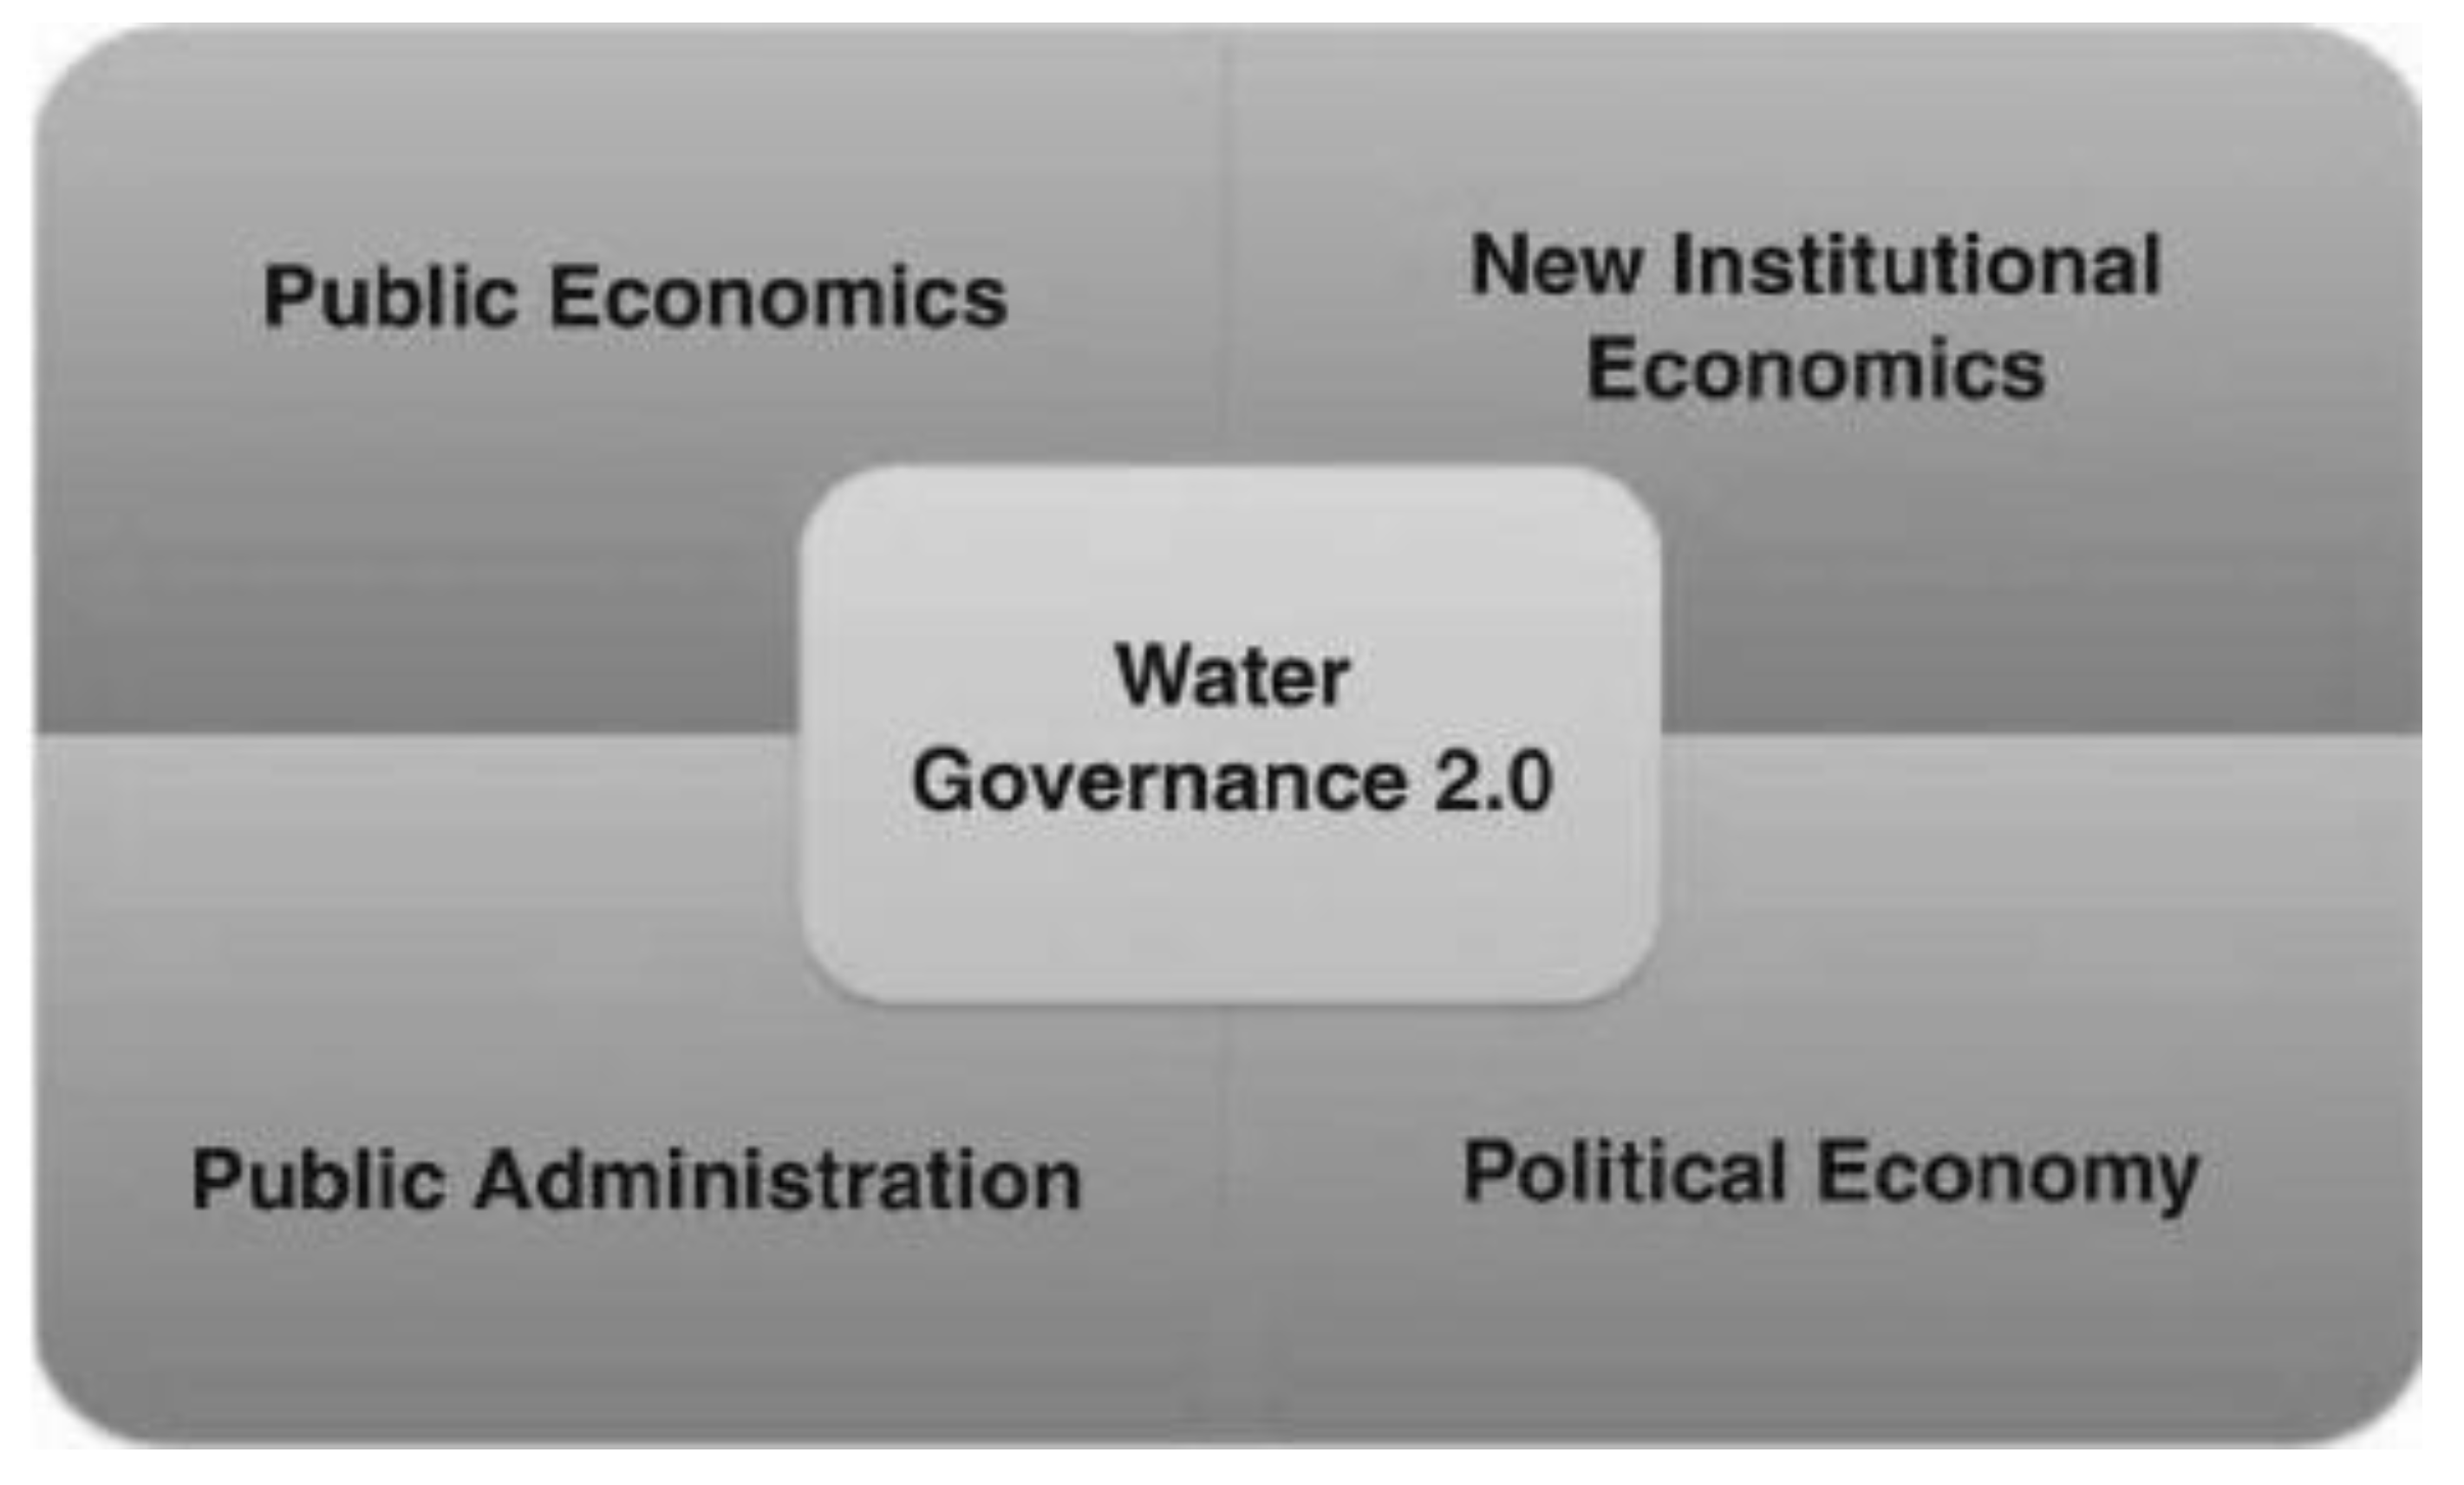
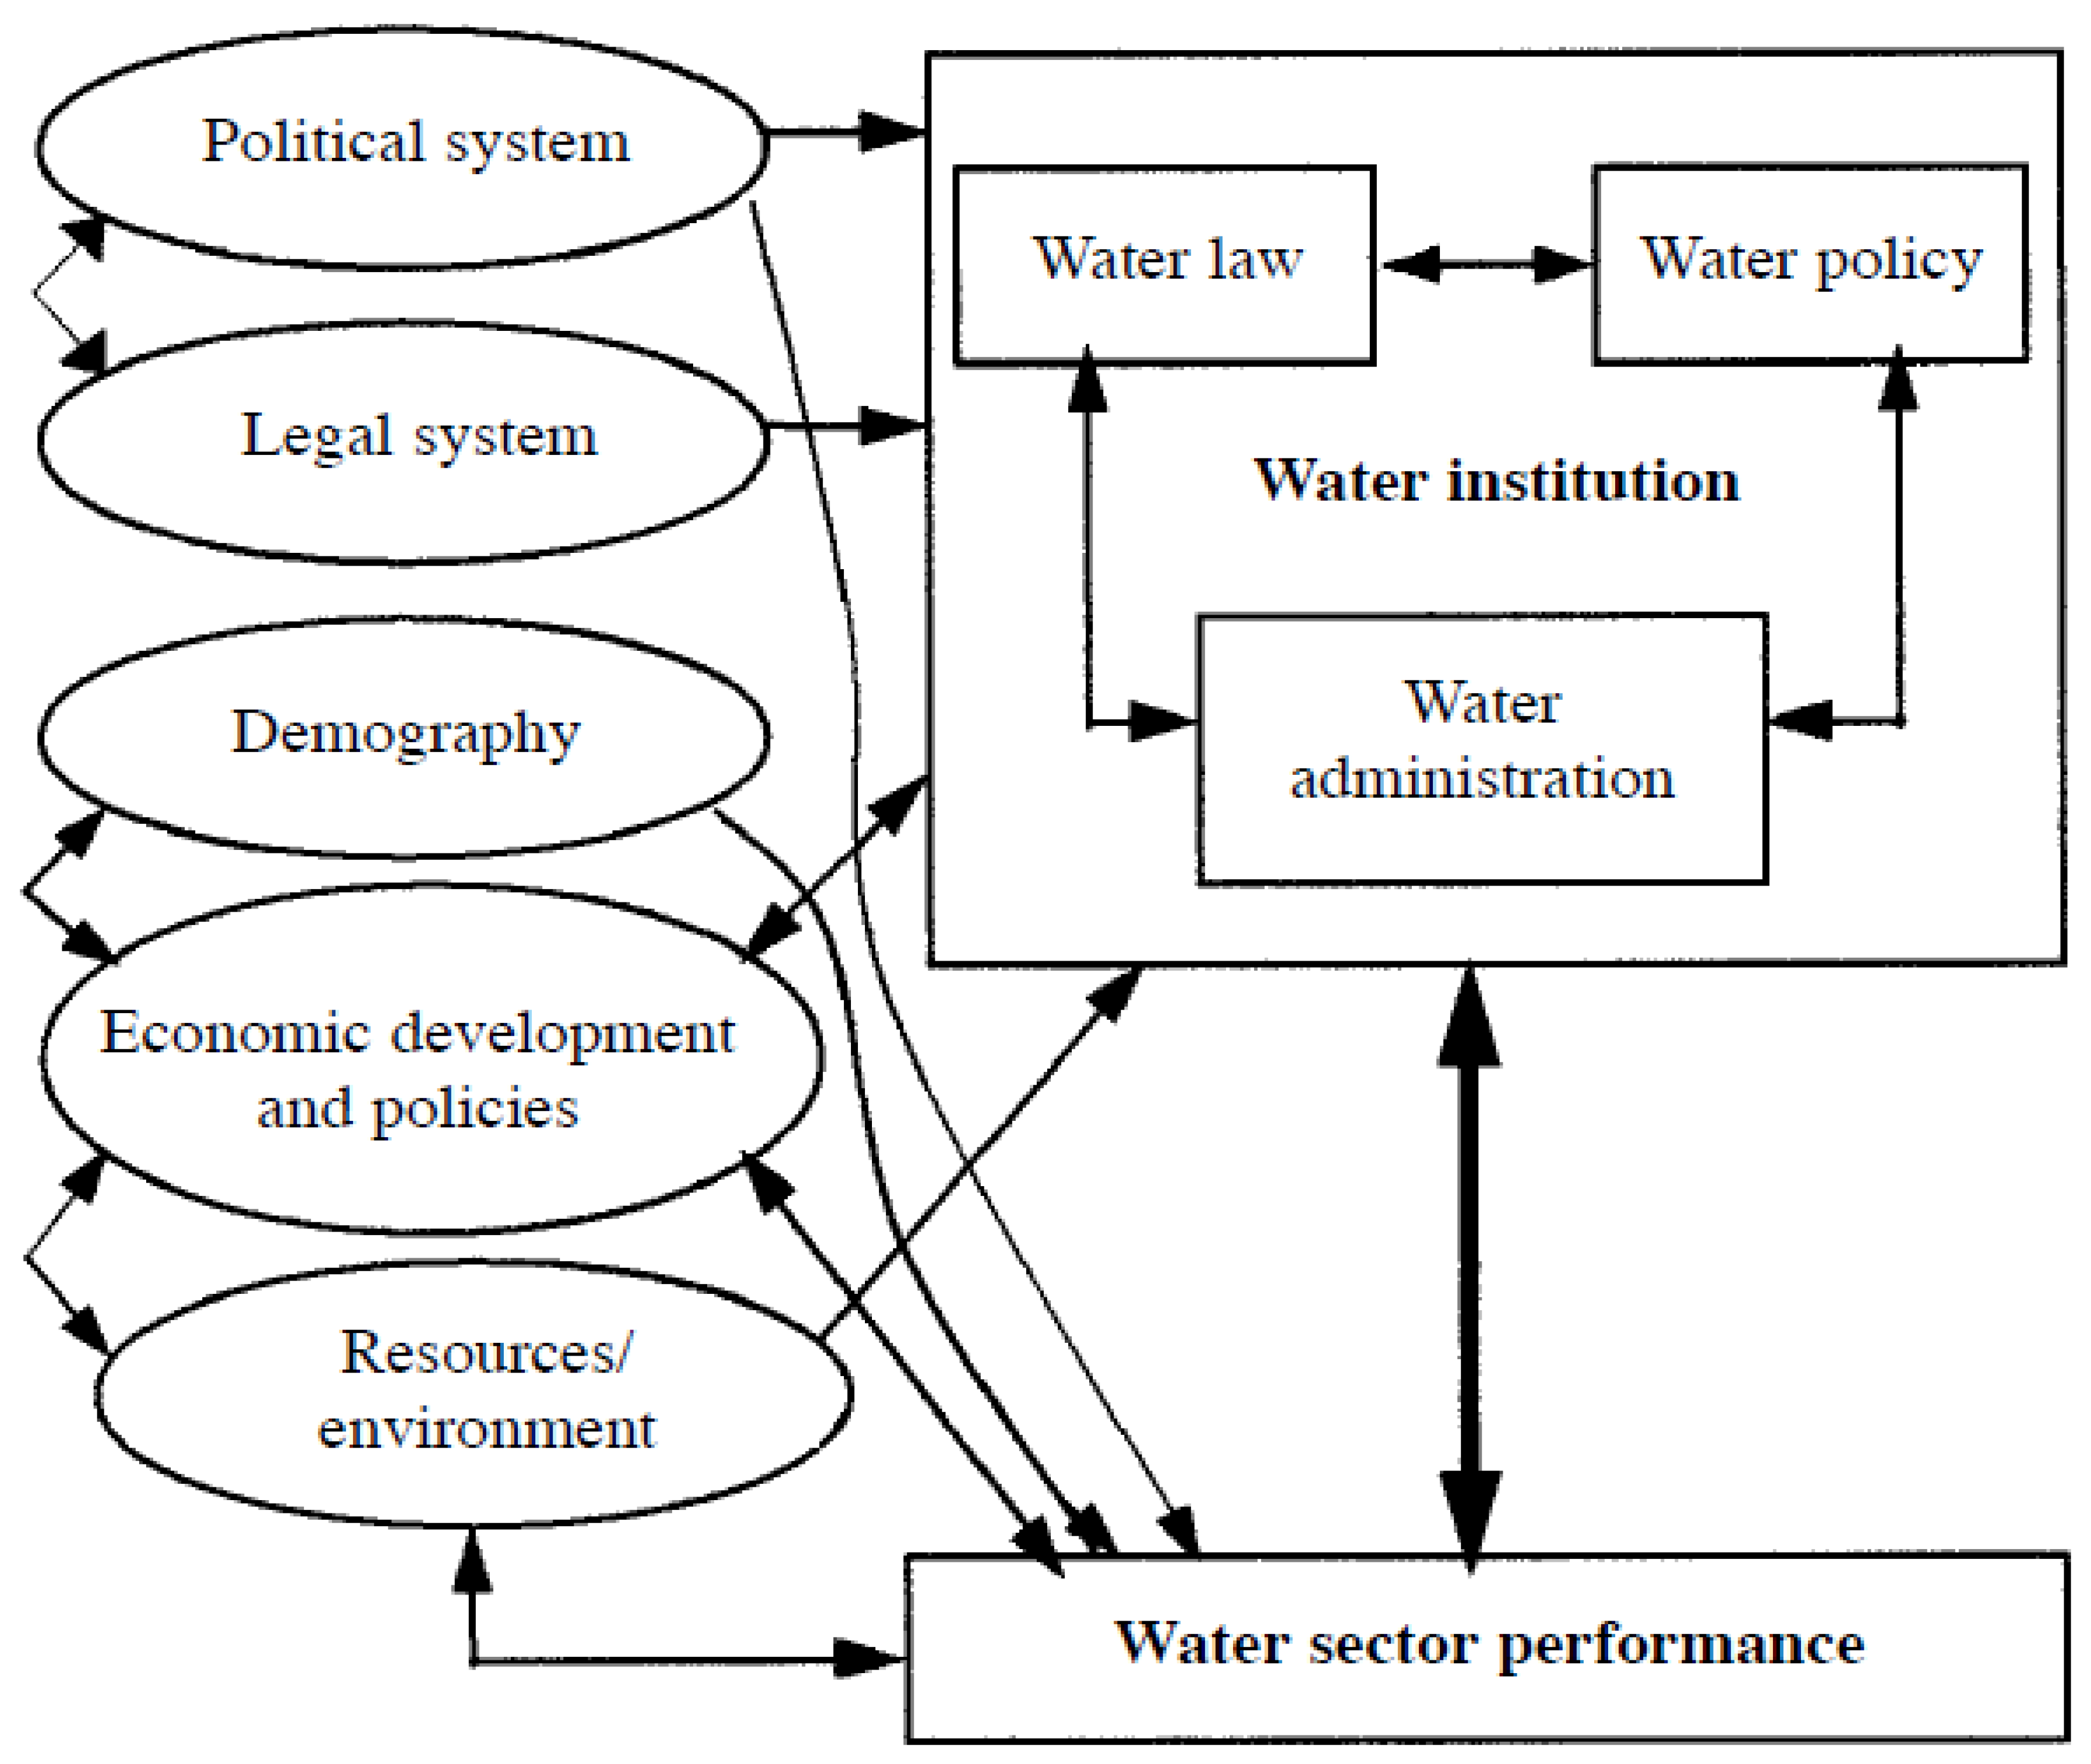
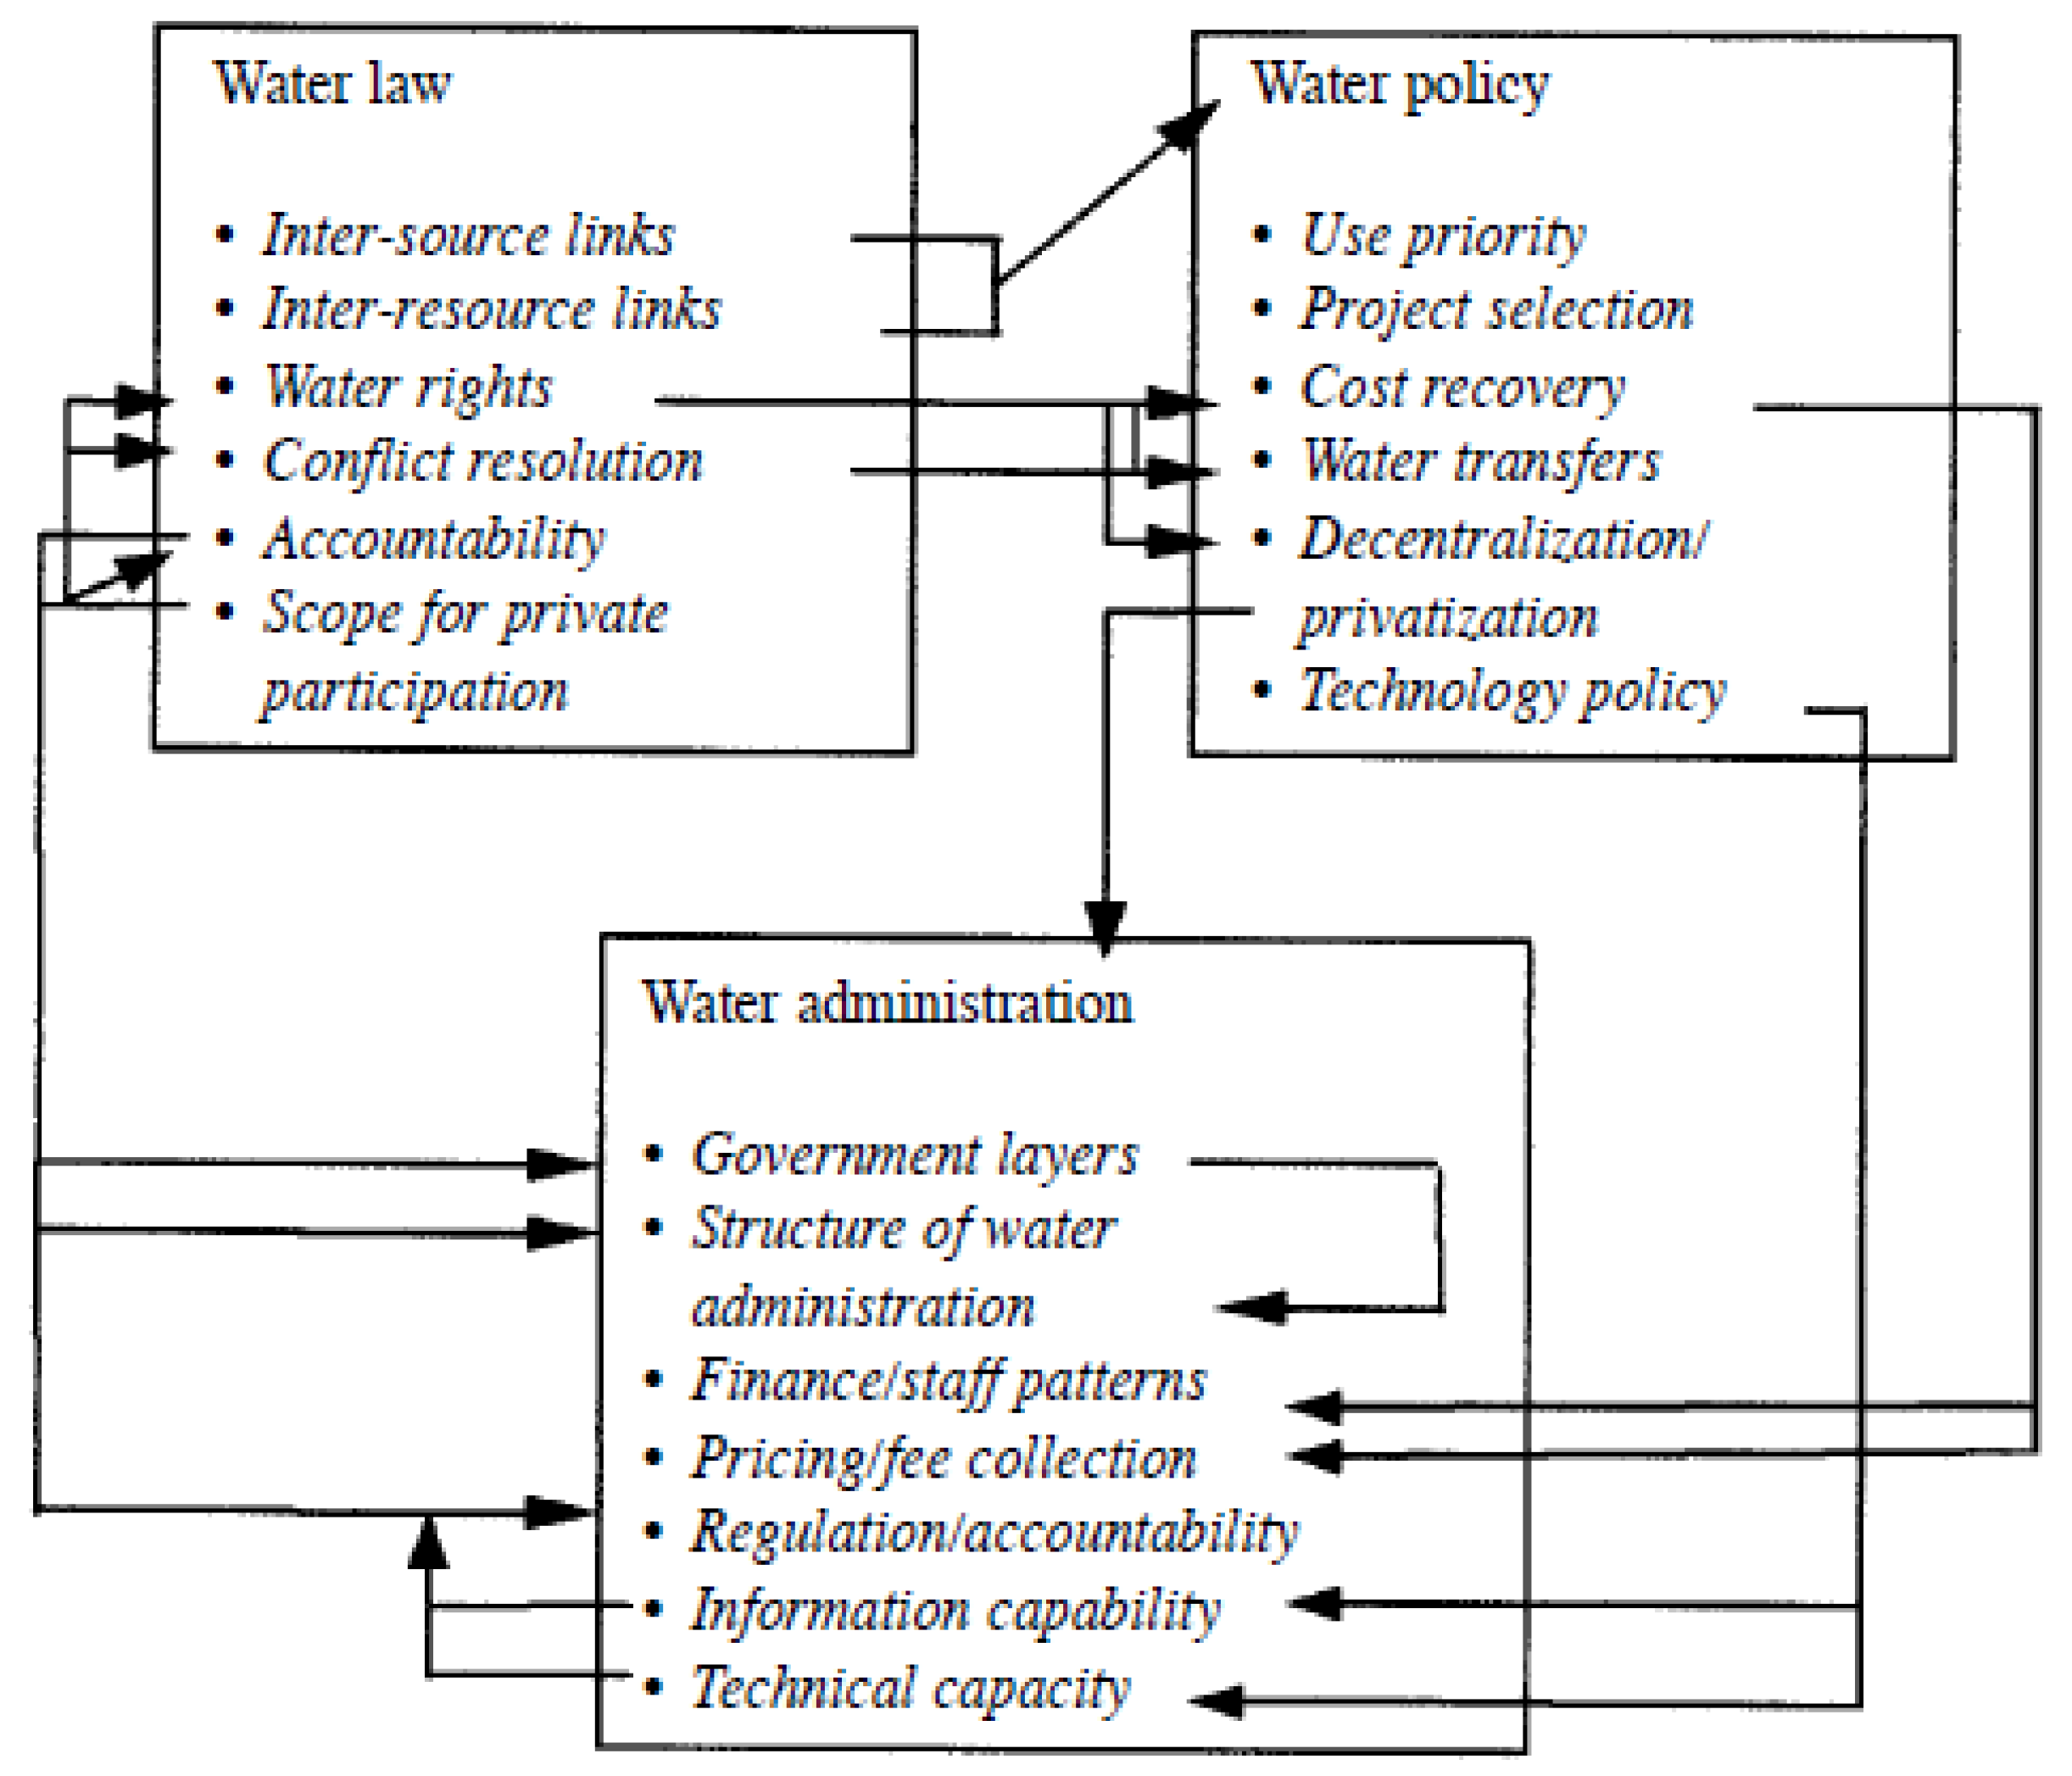
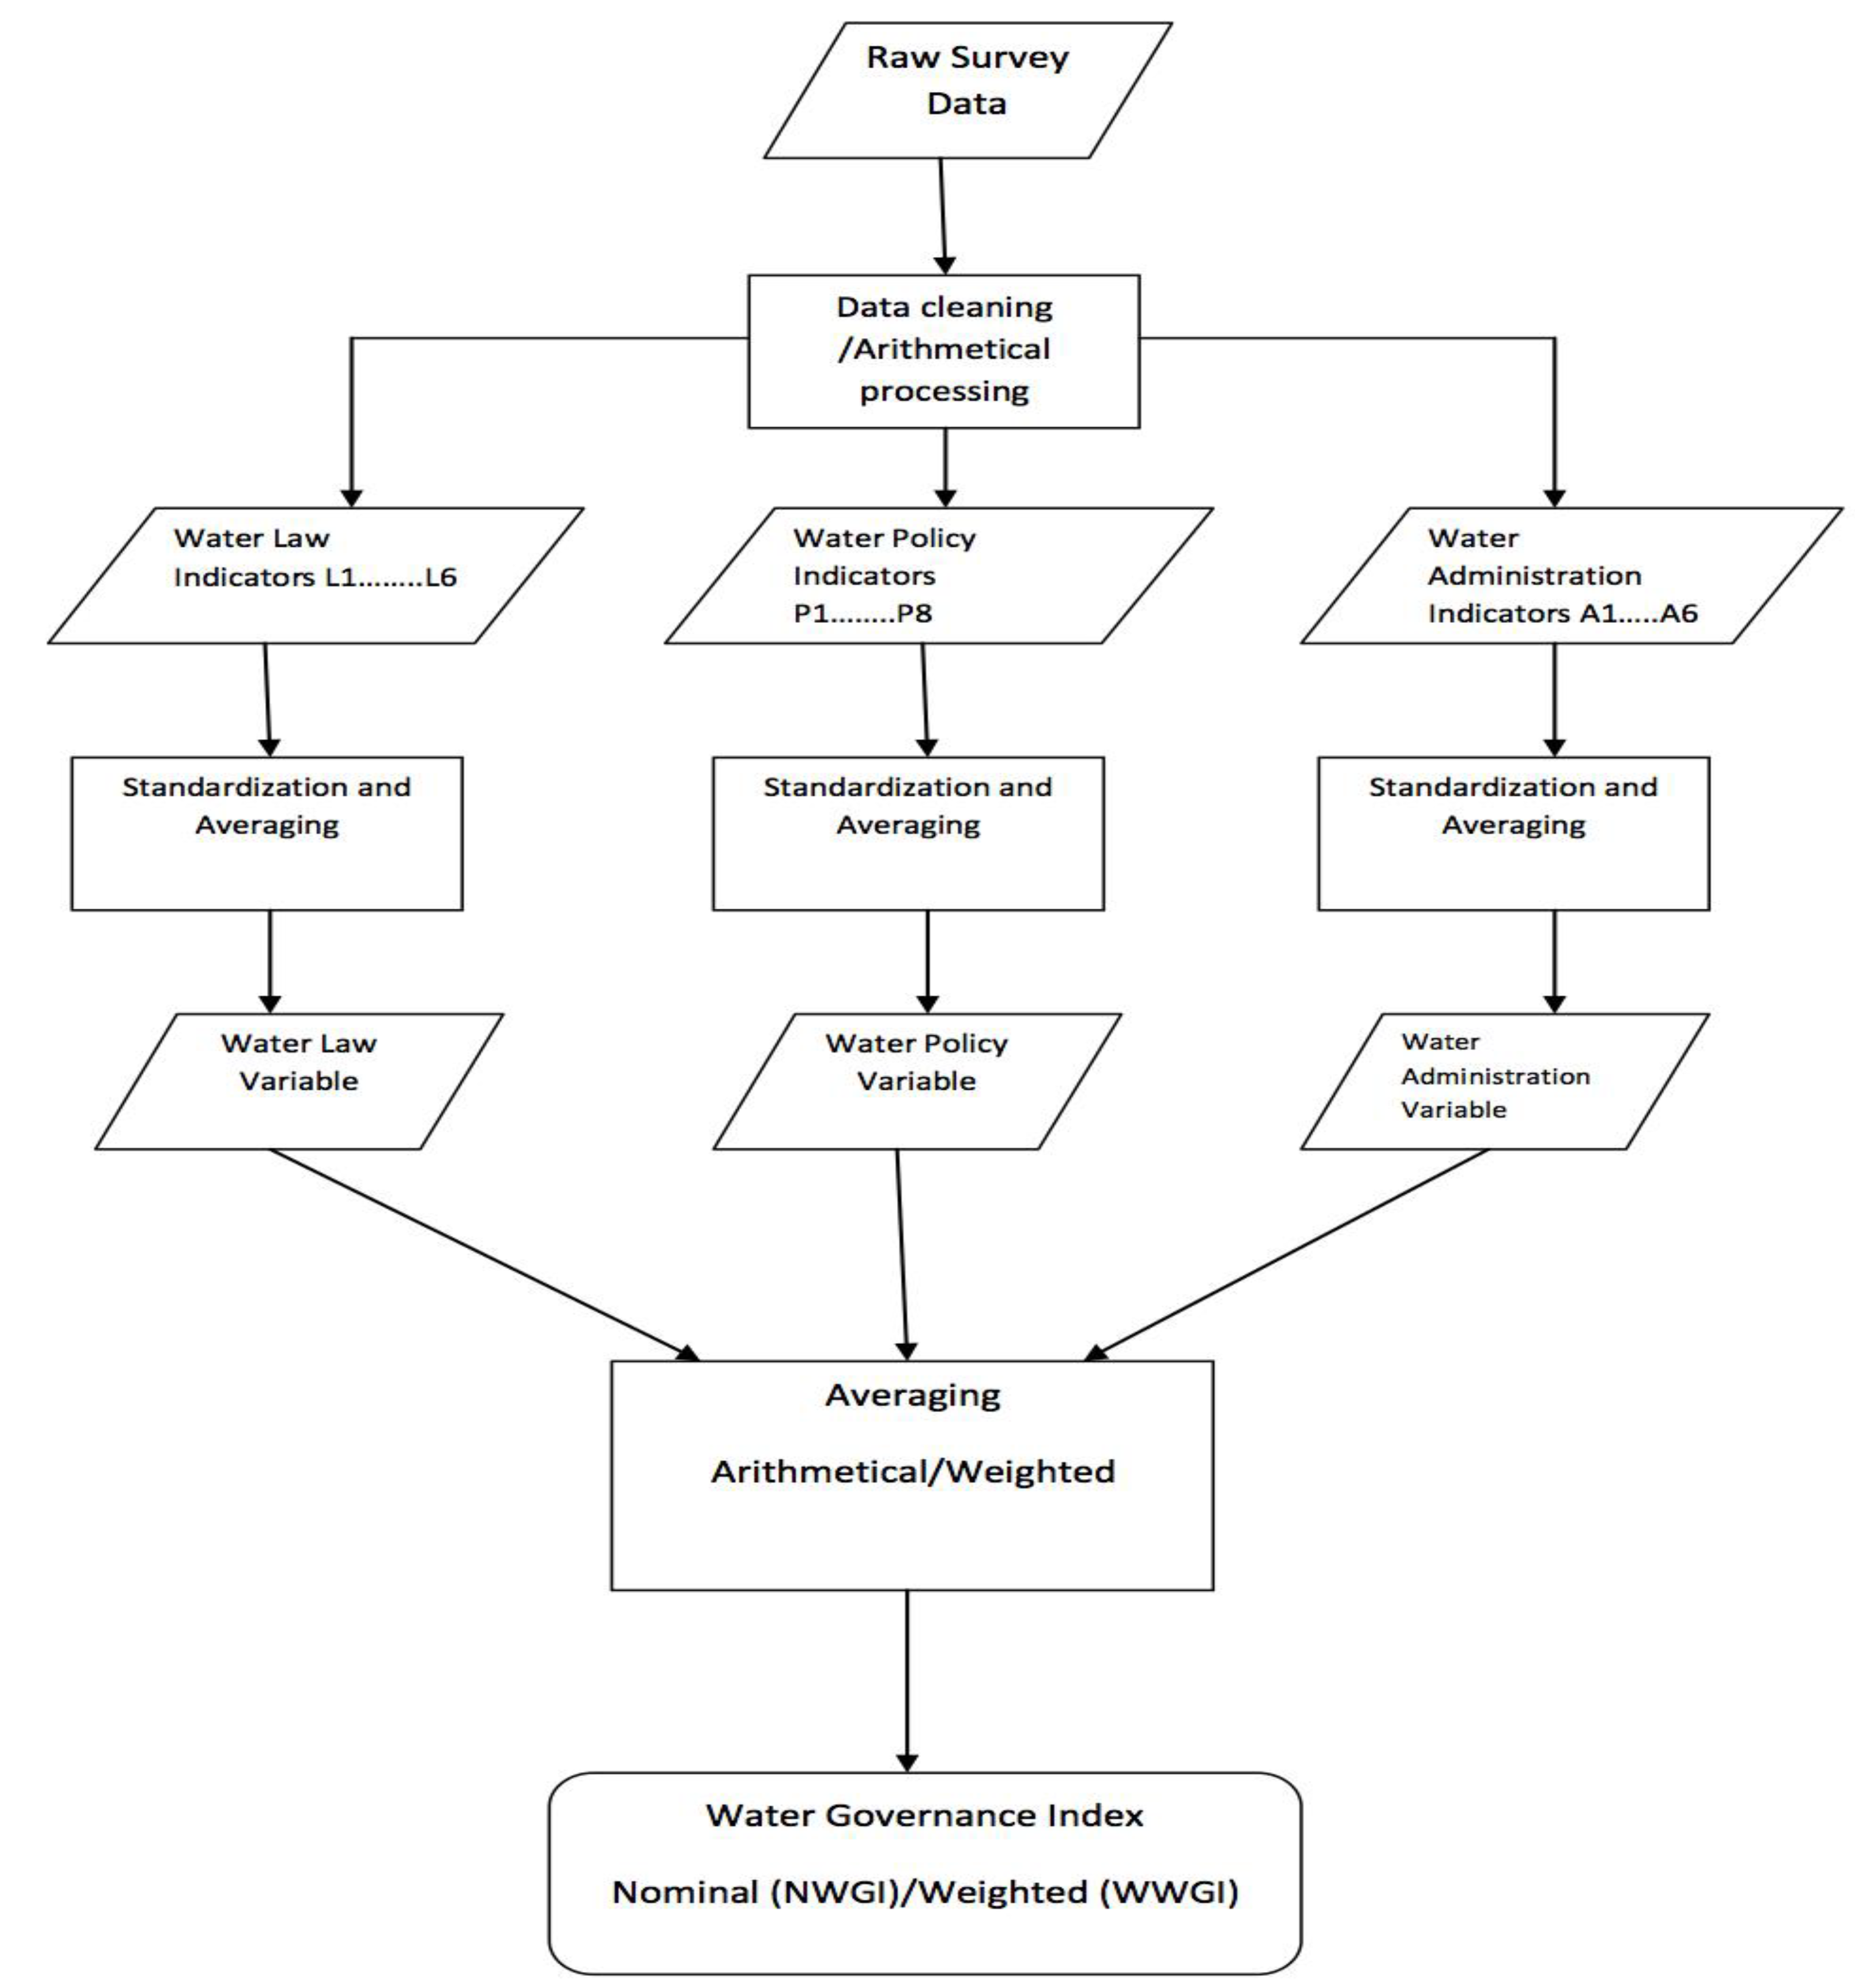
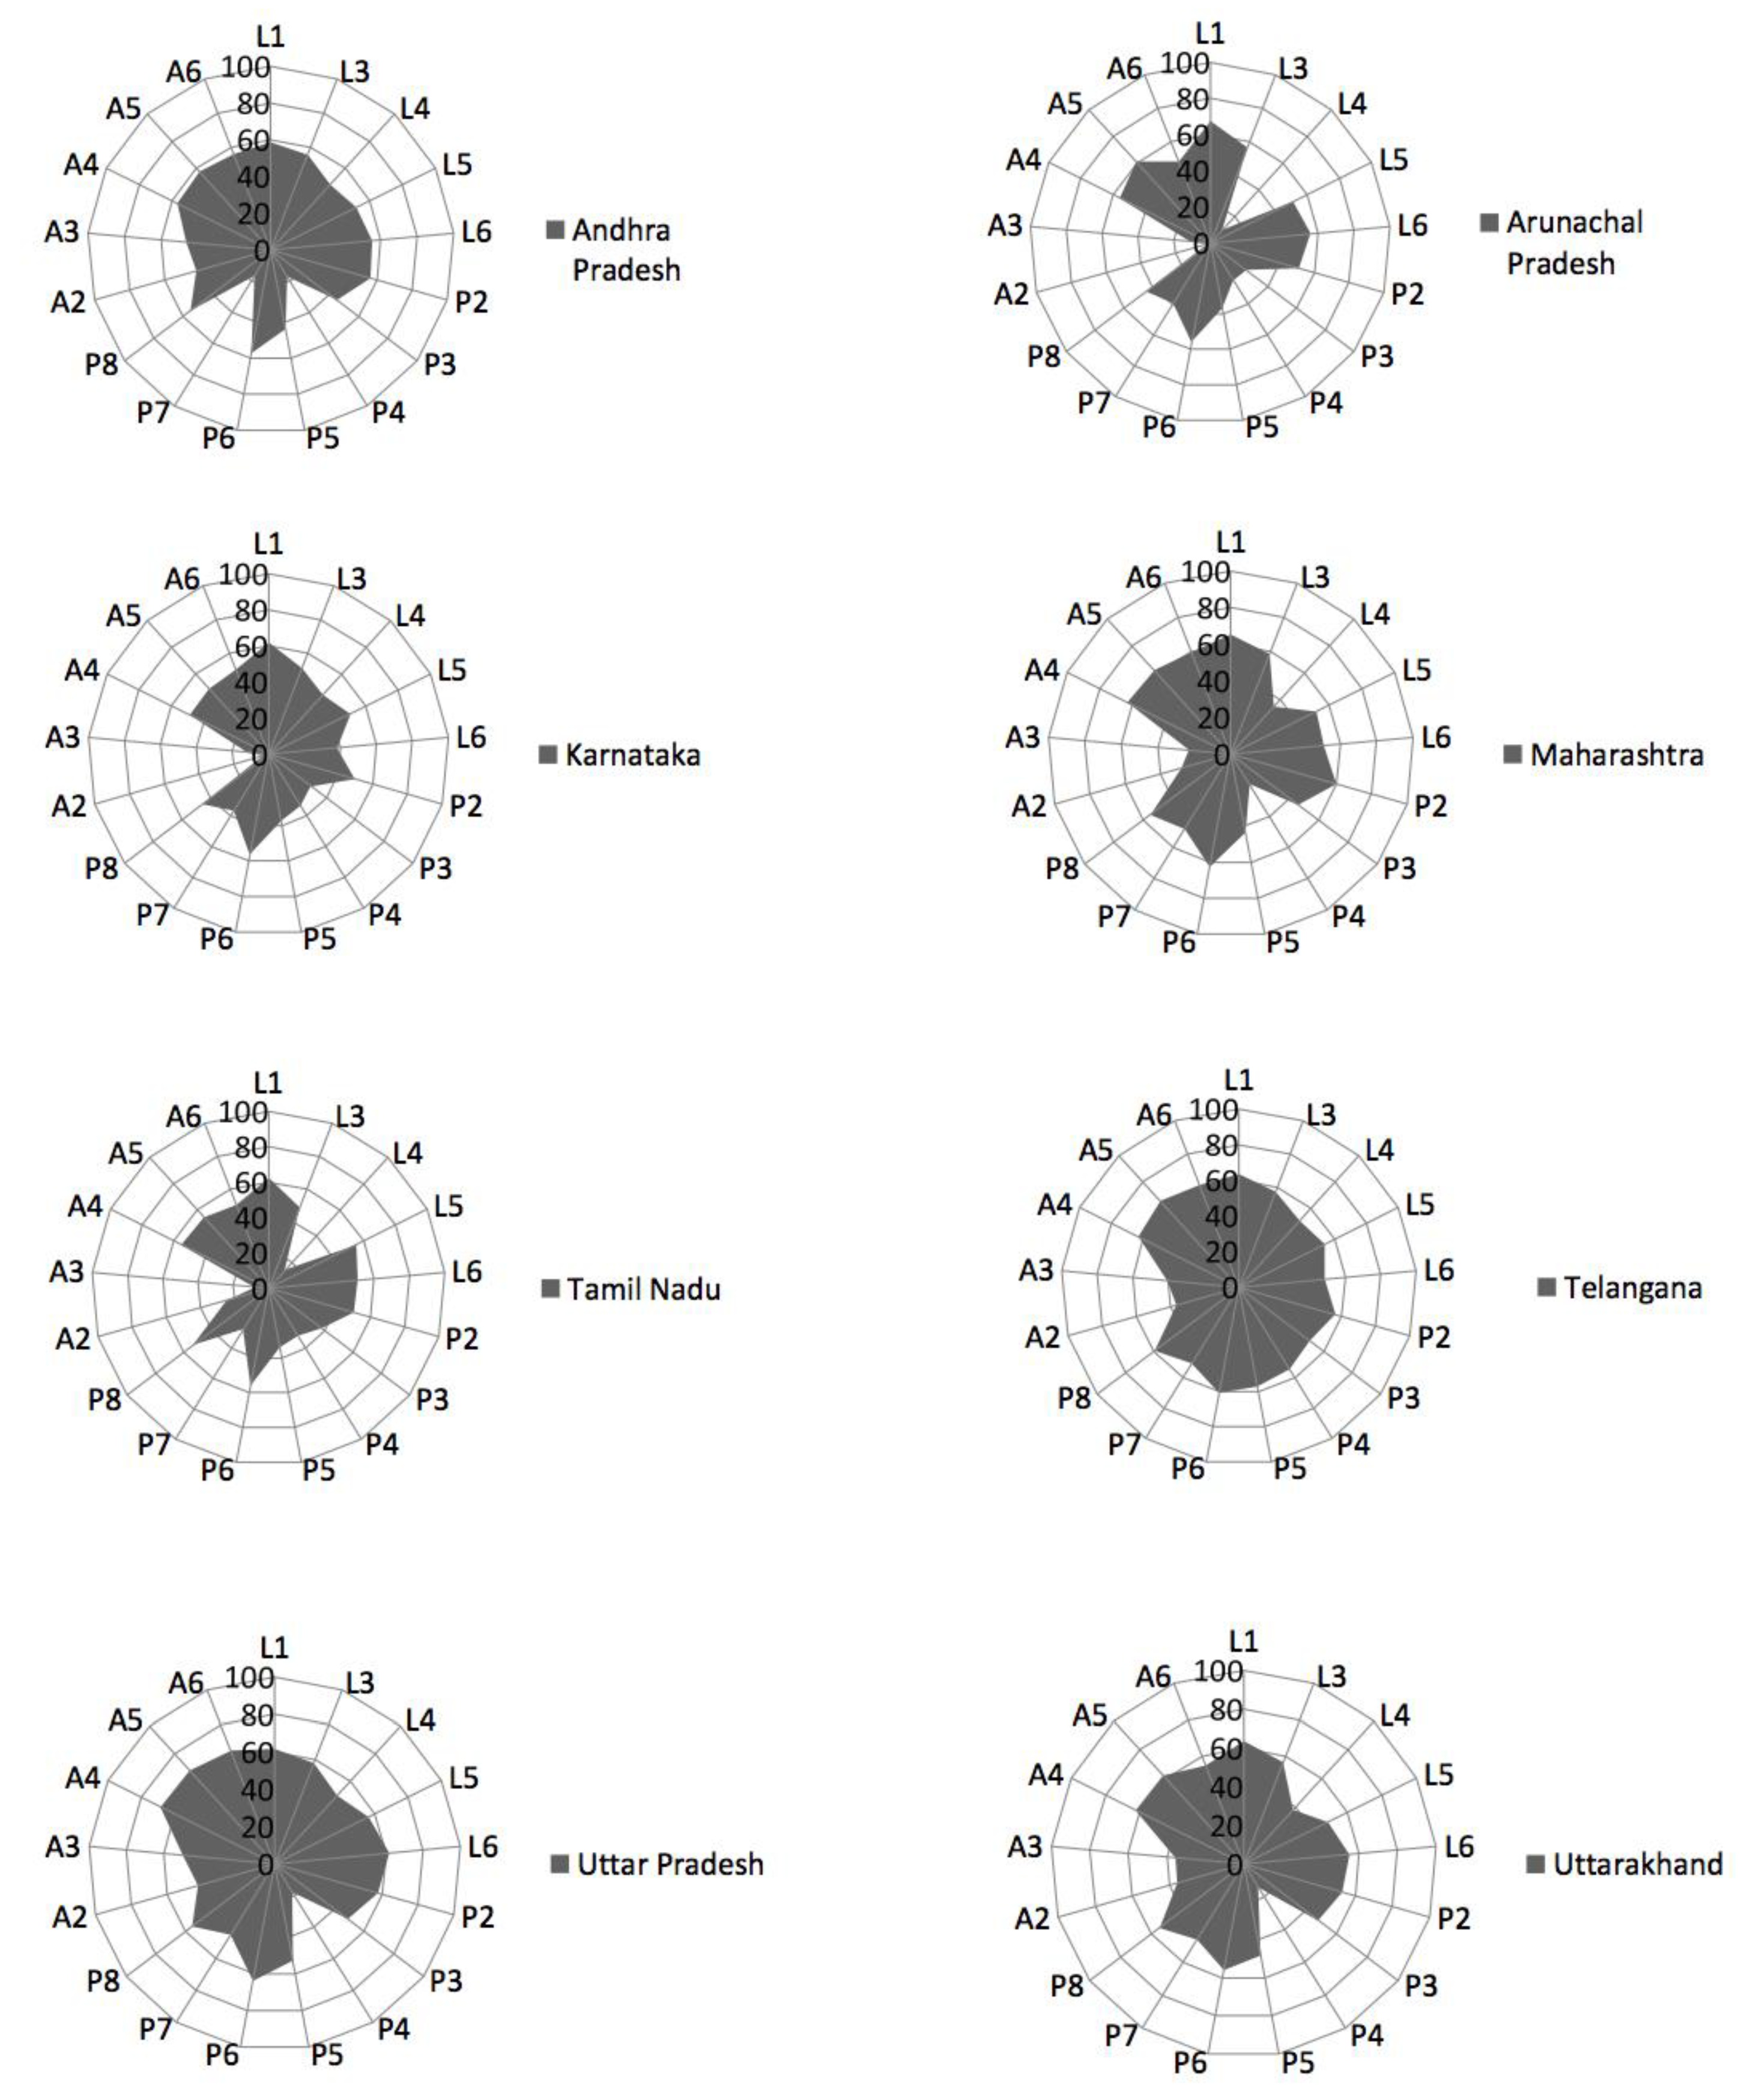
Table 1.
Conceptual and Operational Indicators of Water Governance Source. a.
| Dimension | ID | Component | Definition |
|---|---|---|---|
| Water law | L1 | Legal distinction of different water sources (ORD) | This represents the degree to which varying water sources are treated alike or differently by water laws (i.e., surface water and ground water). It is on a scale of 0–10, with 10 being ‘‘Very Different’’, and 0 being ‘‘Alike’’. |
| L2 | Format of surface water rights (NOM) | This indicates the basis of general rights in surface water. The scores center around the following criteria: none, not clear, common or state property, multiple rights, riparian system, appropriative system, correlative system (equal or proportional sharing), and license/permits. | |
| L3 | Legal accountability of water sector officials (ORD) | This represents the effectiveness of accountability provisions by water laws for water officials. It is on a scale of 0–10, with 10 being ‘‘Highly Accountable’’, and 0 being ‘‘No Accountability’’. | |
| L4 | Decentralization tendency within water (ORD) | This illustrates whether or not present laws contribute to centralization and the strength of the tendency of present laws toward centralization. It is on a scale of 0–10, with 10 being ‘‘Highly Centralized’’, and 0 being ‘‘Highly Decentralized’’. | |
| L5 | Legal scope for private and user participation (ORD) | This represents the favorable level of the legal provisions for private sector, non-governmental organizations (NGOs), and community participation in water development/management. It is on a scale of 0–10, with 10 being ‘‘Very Favorable’’, and 0 being ‘‘Unfavorable’’. | |
| L6 | Legal framework for integrated treatment of water sources (ORD) | This indicates the integration level of water laws with other laws on land, forest, and environment. It is on a scale of 0–10, with 10 being ‘‘Highly Integrated’’, and 0 being ‘‘Fragmented’’. | |
| Water policy | P1 | Project selection criteria (NOM) | This indicates the criteria used in water project selection and how extensively they are applied in irrigation, urban, and multipurpose projects. The scores center around the following criteria: no response, political dictates, equity factors, ecological factors (ECO), benefit–cost ratio (BC), internal rate of return (IRR), and multiple criteria. |
| P2 | Linkages with other policies (NOM) | This represents the extent of the influence of other policies on water policy. It is on a scale of 0–10, with 10 being ‘‘Highly Influential’’, and 0 being ‘‘No Influence’’. The linked policies include agricultural policies, energy and power policies, soil conservation policies, pollution control and environmental policies, fiscal policies (structural adjustment), credit and investment policies, and foreign investment and aid policies. | |
| P3 | Pricing policy (ORD) | This represents the extent of cost recovery by tariffs. It is on a scale of 0–10, with 10 being ‘‘Full Cost Recovery’’, and 0 being ‘‘Full Subsidy’’. The average of domestic, industrial, and irrigation pricing policies is derived. | |
| P4 | Private sector participation (ORD) | This corresponds to how favorable water policy is on private sector participation. It is on a scale of 0–10, with 10 being ‘‘Very Favorable’’, and 0 being ‘‘Unfavorable’’. The scores are averaged across the domains of irrigation, urban domestic use, rural domestic use, and industrial and commercial use. | |
| P5 | User participation (ORD) | This explains how favorable water policy is on user participation and decentralization. It is on a scale of 0–10, with 10 being ‘‘Very’’, and 0 being ‘‘Unfavorable’’. The scores are averaged across the domains of irrigation, urban domestic use, rural domestic use, and industrial and commercial use in the stages of planning and development and operation and maintenance. | |
| P6 | Linkage between water law and water policy (ORD) | This represents the extent of the linkages between water law and water policy. It is on a scale of 0–10, with 10 being ‘‘Tightly Linked’’, and 0 being ‘‘No Linkage’’. | |
| P7 | Attention to poverty (ORD) | This represents how well the concerns of the poor are reflected by water policy. It is on a scale of 0–10, with 10 being ‘‘Highly Reflected’’, and 0 being ‘‘Hardly Reflected’’. | |
| P8 | Finance for water investment (ORD) | This represents the adequacy of funding available for current and future water investments. It is on a scale of 0–10, with 10 being ‘‘Highly Adequate’’, and 0 being ‘‘Inadequate’’. The scores are averaged across the funding for ‘‘new infrastructure’’, ‘‘utilities repair and operation and maintenance (O&M)’’, ‘‘irrigation’’, and ‘‘water resources management’’. | |
| A1 | Organizational basis (NOM) | This shows the basis on which water administration is organized. The scores center around the following criteria: on administrative division (geographical basis), on hydrogeological regions, on river basins, and a mixture of all of these. | |
| Water administration | A2 | Functional balance (ORD) | This indicates whether or not functional specialization within water administration is balanced. It is on a scale of 0–10, with 10 being ‘‘Highly Balanced’’, and 0 being “Highly Unbalanced’’. The tested functions are planning and design, implementation, financial management, operation and maintenance, rehabilitation and resettlement, environmental monitoring, research, training, and extension, interagency, or departmental relationships. |
| A3 | Existence of independent water pricing body or apex body (ORD) | This represents the existence of independent bodies for determining water price. It is on a scale of 0–10, with 10 being ‘‘Existent’’, and 0 being ‘‘Nonexistent’’. | |
| A4 | Accountability and regulatory mechanisms (ORD) | This represents the effectiveness of the accountability arrangements evaluated. It is on a scale of 0–10, with 10 being ‘‘Highly Effective’’, and 0 being “Highly Ineffective’’. The accountability mechanism was analyzed with respect to both within and outside of formal administration. | |
| A5 | Validity of water data for planning (ORD) | This represents the adequacy and reliability of water data for planning purposes. It is on a scale of 0–10, with 10 being ‘‘Highly Valid’’, and 0 being ‘‘Invalid’’. | |
| A6 | Science and technology application (ORD) | This indicates the extent to which the following science and technology components are used within water administration: computers, remote sensing and satellite, research and experimental information, modern accounting and auditing techniques, management information systems, geographic information systems, wireless communication, water-measuring technology, computerized dynamic regulation of canals, and water delivery networks. The aggregate score is on a scale of 0–10, with 10 being ‘‘Very Extensive,’’ and 0 being ‘‘Very Low’’. The scores are averaged across the technologies specified above. |
Table 2.
Standardized scores for water law, policies, and administration from individual and combined survey data.
Table 2.
Standardized scores for water law, policies, and administration from individual and combined survey data.
| State | L1 | L3 | L4 | L5 | L6 | P2 | P3 | P4 | P5 | P6 | P7 | P8 | A2 | A3 | A4 | A5 | A6 |
|---|---|---|---|---|---|---|---|---|---|---|---|---|---|---|---|---|---|
| 2017–2018 Survey | |||||||||||||||||
| Andhra Pradesh | 52.9 | 59.3 | 55.0 | 52.6 | 57.1 | 58.2 | 55.0 | 4.6 | 48.6 | 58.6 | 17.1 | 58.2 | 60.0 | 60.0 | 59.3 | 56.8 | 59.0 |
| Arunachal Pradesh | 80.0 | 56.0 | 0.0 | 44.0 | 64.0 | 42.6 | 42.0 | 0.0 | 28.5 | 56.0 | 54.0 | 37.5 | 0.0 | 28.0 | 60.0 | 64.0 | 46.7 |
| Karnataka | 72.0 | 44.0 | 38.0 | 52.7 | 34.0 | 47.2 | 52.0 | 37.0 | 32.3 | 52.9 | 52.0 | 47.0 | 10.0 | 36.0 | 51.0 | 47.0 | 50.2 |
| Maharashtra | 74.4 | 75.6 | 24.4 | 62.6 | 75.6 | 69.2 | 68.9 | 0.0 | 46.4 | 73.3 | 67.8 | 69.2 | 50.0 | 23.3 | 73.9 | 77.8 | 72.7 |
| Tamil Nadu | 58.0 | 47.0 | 10.0 | 54.7 | 50.0 | 55.4 | 70.0 | 27.9 | 20.5 | 56.0 | 36.0 | 56.0 | 30.0 | 22.0 | 53.3 | 55.0 | 53.3 |
| Telangana | 74.0 | 66.0 | 59.0 | 62.5 | 62.0 | 57.1 | 67.0 | 64.0 | 66.3 | 70.0 | 65.0 | 67.4 | 63.0 | 57.0 | 72.5 | 73.0 | 72.2 |
| Uttar Pradesh | 65.3 | 62.5 | 58.0 | 55.7 | 67.3 | 58.4 | 59.3 | 3.0 | 55.9 | 65.3 | 58.0 | 61.2 | 60.0 | 64.7 | 73.3 | 73.3 | 70.7 |
| Uttarakhand | 65.3 | 57.7 | 51.3 | 46.7 | 54.0 | 53.9 | 63.3 | 0.0 | 56.6 | 58.7 | 61.3 | 58.3 | 50.7 | 53.3 | 67.0 | 67.0 | 58.6 |
| 2014–2015 Survey | |||||||||||||||||
| Andhra Pradesh | 68.8 | 48.8 | 36.3 | 50.4 | 52.5 | 53.2 | 28.5 | 39.1 | 35.9 | 55.0 | 16.3 | 49.4 | 11.3 | 22.5 | 52.8 | 58.8 | 50.6 |
| Arunachal Pradesh | 58.6 | 57.1 | 17.1 | 56.2 | 50.0 | 57.1 | 12.9 | 42.0 | 43.0 | 55.7 | 28.6 | 49.6 | 2.9 | 0.0 | 53.2 | 58.6 | 49.5 |
| Karnataka | 57.0 | 55.0 | 48.0 | 49.3 | 40.0 | 50.9 | 18.0 | 31.8 | 39.9 | 58.0 | 29.0 | 45.3 | 0.0 | 0.0 | 47.5 | 50.0 | 50.0 |
| Maharashtra | 59.2 | 46.9 | 42.3 | 45.1 | 33.8 | 53.5 | 29.9 | 32.9 | 41.9 | 55.4 | 34.6 | 45.4 | 13.1 | 23.1 | 55.8 | 51.2 | 50.7 |
| Tamil Nadu | 65.0 | 50.0 | 16.0 | 56.0 | 51.0 | 46.9 | 19.0 | 33.4 | 41.4 | 56.0 | 22.0 | 51.8 | 22.0 | 0.0 | 56.3 | 53.5 | 49.3 |
| Telangana | 53.0 | 49.0 | 42.0 | 45.3 | 35.0 | 55.7 | 32.8 | 44.3 | 47.7 | 51.0 | 36.0 | 50.8 | 10.0 | 24.0 | 53.8 | 58.5 | 50.8 |
| Uttar Pradesh | 55.0 | 50.0 | 33.8 | 58.3 | 51.3 | 56.3 | 30.0 | 45.2 | 46.6 | 61.3 | 20.0 | 44.7 | 11.3 | 21.3 | 59.7 | 58.1 | 54.4 |
| Uttarakhand | 61.1 | 54.4 | 15.6 | 51.9 | 56.7 | 51.6 | 23.3 | 37.9 | 33.9 | 51.1 | 20.0 | 48.6 | 11.1 | 5.6 | 55.3 | 54.4 | 49.0 |
| Combined Data | |||||||||||||||||
| Andhra Pradesh | 58.7 | 55.5 | 48.2 | 51.8 | 55.4 | 56.4 | 45.4 | 17.1 | 44.0 | 57.3 | 16.8 | 55.0 | 42.3 | 46.4 | 56.9 | 57.5 | 55.9 |
| Arunachal Pradesh | 67.5 | 56.7 | 10.0 | 51.1 | 55.8 | 51.1 | 25.0 | 24.5 | 37.0 | 55.8 | 39.2 | 44.6 | 1.7 | 11.7 | 56.0 | 60.8 | 48.3 |
| Karnataka | 62.0 | 51.3 | 44.7 | 50.5 | 38.0 | 49.6 | 29.3 | 33.5 | 37.4 | 56.3 | 36.7 | 45.8 | 3.3 | 12.0 | 48.7 | 49.0 | 50.1 |
| Maharashtra | 65.4 | 58.7 | 35.0 | 52.3 | 50.9 | 59.9 | 45.8 | 19.4 | 43.7 | 62.7 | 48.2 | 55.1 | 28.2 | 23.2 | 63.2 | 62.1 | 59.7 |
| Tamil Nadu | 62.5 | 48.9 | 13.9 | 55.5 | 50.6 | 50.0 | 37.2 | 31.4 | 34.0 | 56.0 | 27.0 | 53.3 | 24.9 | 7.9 | 55.2 | 54.0 | 50.8 |
| Telangana | 63.5 | 57.5 | 50.5 | 53.9 | 48.5 | 56.4 | 49.9 | 54.1 | 57.0 | 60.5 | 50.5 | 59.1 | 36.5 | 40.5 | 63.1 | 65.8 | 61.5 |
| Uttar Pradesh | 61.7 | 58.2 | 49.6 | 56.6 | 61.7 | 57.7 | 49.1 | 17.7 | 52.7 | 63.9 | 44.8 | 55.5 | 43.0 | 49.6 | 68.6 | 68.0 | 65.1 |
| Uttarakhand | 63.7 | 56.5 | 37.9 | 48.6 | 55.0 | 53.0 | 48.3 | 14.2 | 48.1 | 55.9 | 45.8 | 54.7 | 35.8 | 35.4 | 62.6 | 62.3 | 55.0 |
Table 3.
Descriptive statistics for water law.
| Survey 2017–2018 | Mean | St.Dev | Min | Max |
| Level of legal differentiation | 67.7 | 9.09 | 52.9 | 80.0 |
| Legal accountability of water sector officials | 58.5 | 10.10 | 44.0 | 75.6 |
| Level of centralization of water law | 37.0 | 23.03 | 0.0 | 59.0 |
| Legal scope for private and user participation | 53.9 | 6.62 | 44.0 | 62.6 |
| Integration of water law with other laws | 58.0 | 12.56 | 34.0 | 75.6 |
| Survey 2014–2015 | ||||
| Level of legal differentiation | 59.7 | 5.18 | 53.0 | 68.8 |
| Legal accountability of water sector officials | 51.4 | 3.62 | 46.9 | 57.1 |
| Level of centralization of water law | 31.4 | 13.24 | 15.6 | 48.0 |
| Legal scope for private and user participation | 51.6 | 4.98 | 45.1 | 58.3 |
| Integration of water law with other laws | 46.3 | 8.69 | 33.9 | 56.7 |
| Combined | ||||
| Level of legal differentiation | 63.1 | 2.63 | 58.7 | 67.5 |
| Legal accountability of water sector officials | 55.4 | 3.46 | 48.9 | 58.7 |
| Level of centralization of water law | 36.2 | 15.98 | 10.0 | 50.5 |
| Legal scope for private and user participation | 52.5 | 2.67 | 48.6 | 56.6 |
| Integration of water law with other laws | 52.0 | 6.98 | 38.0 | 61.7 |
Table 4.
Descriptive statistics for water policy.
| Survey 2017–2018 | Mean | St.Dev | Min | Max |
| Linkage with other policies | 55.3 | 7.96 | 42.6 | 69.2 |
| Cost recovery | 59.7 | 9.65 | 42.0 | 70.0 |
| Private sector participation | 17.1 | 23.74 | 0.0 | 64.0 |
| User participation | 44.4 | 15.82 | 20.5 | 66.3 |
| Linkage between water law and policy | 61.4 | 7.33 | 52.9 | 73.3 |
| Attention to poverty | 51.4 | 16.97 | 17.1 | 67.8 |
| Availability of finance | 56.9 | 10.41 | 37.5 | 69.2 |
| Survey 2014–2015 | ||||
| Linkage with other policies | 53.2 | 3.35 | 46.9 | 57.1 |
| Cost recovery | 24.3 | 7.11 | 12.9 | 32.8 |
| Private sector participation | 38.3 | 5.25 | 31.8 | 45.2 |
| User participation | 41.3 | 4.75 | 33.9 | 47.7 |
| Linkage between water law and policy | 55.4 | 3.37 | 51.0 | 61.3 |
| Attention to poverty | 25.8 | 7.30 | 16.3 | 36.0 |
| Availability of finance | 48.2 | 2.72 | 44.7 | 51.8 |
| Combined | ||||
| Linkage with other policies | 54.3 | 3.85 | 49.6 | 59.9 |
| Cost recovery | 41.3 | 9.62 | 25.0 | 49.9 |
| Private sector participation | 26.5 | 13.13 | 14.2 | 54.1 |
| User participation | 44.2 | 8.06 | 34.0 | 57.0 |
| Linkage between water law and policy | 58.6 | 3.33 | 55.8 | 63.9 |
| Attention to poverty | 38.6 | 11.58 | 16.8 | 50.5 |
| Availability of finance | 52.9 | 5.02 | 44.6 | 59.1 |
Table 5.
Descriptive statistics for water administration.
| Survey 2017–2018 | Mean | St.Dev | Min | Max |
| Functional capacity balance | 40.5 | 24.32 | 0.0 | 63.0 |
| Independent water pricing body | 43.0 | 17.58 | 22.0 | 64.7 |
| Accountability and regulatory mechanisms | 63.8 | 9.16 | 51.0 | 73.9 |
| Validity of water data | 64.2 | 10.62 | 47.0 | 77.8 |
| Science and technology application | 60.4 | 10.31 | 46.7 | 72.7 |
| Survey 2014–2015 | ||||
| Functional capacity balance | 10.2 | 6.64 | 0.0 | 22.0 |
| Independent water pricing body | 12.1 | 11.56 | 0.0 | 24.0 |
| Accountability and regulatory mechanisms | 54.3 | 3.50 | 47.5 | 59.7 |
| Validity of water data | 55.4 | 3.59 | 50.0 | 58.8 |
| Science and technology application | 50.5 | 1.71 | 49.0 | 54.4 |
| Combined | ||||
| Functional capacity balance | 27.0 | 16.33 | 1.7 | 43.0 |
| Independent water pricing body | 28.3 | 16.75 | 7.9 | 49.6 |
| Accountability and regulatory mechanisms | 59.3 | 6.24 | 48.7 | 68.6 |
| Validity of water data | 59.9 | 6.22 | 49.0 | 68.0 |
| Science and technology application | 55.8 | 5.95 | 48.4 | 65.1 |
Table 6.
t-Test of significance.
| Variable | p-Value |
|---|---|
| Level of Legal Differentiation (L1) | 0.048 ** |
| Legal Accountability of Water Sector Officials (L3) | 0.082 * |
| Centralization of Water Law (L4) | 0.561 |
| Legal Scope of Private and User Participation (L5) | 0.433 |
| Legal Framework for Integrated Treatment of Water Sources (L6) | 0.048 ** |
| Linkages with other Policies (P2) | 0.502 |
| Pricing Policy (P3) | 0.000 *** |
| Private Sector Participation (P4) | 0.027 ** |
| User Participation (P5) | 0.604 |
| Linkage between Water Law and Policy (P6) | 0.057 * |
| Attention to Poverty (P7) | 0.002 *** |
| Finance for Water Investment (P8) | 0.039 ** |
| Functional Balance (A2) | 0.004 *** |
| Existence of Independent Water Pricing Body (A3) | 0.001 *** |
| Accountability and Regulatory Mechanisms (A4) | 0.016 ** |
| Validity of Water Data (A5) | 0.042 ** |
| Science and Technology Application (A6) | 0.018 ** |
Significance levels: * 10%, ** 5%, and *** 1%.
Table 7.
Descriptive statistics for water law, policies, and administration.
| Survey 2017–2018 | Mean | St.Dev | Min | Max |
| Score on water law | 55.0 | 7.60 | 43.9 | 64.7 |
| Score on water policy | 49.4 | 8.63 | 37.2 | 65.3 |
| Score on water administration | 54.4 | 12.15 | 38.8 | 68.4 |
| Survey 2014–2015 | ||||
| Score on water law | 48.1 | 2.19 | 44.9 | 51.3 |
| Score on water policy | 40.9 | 2.59 | 38.1 | 45.5 |
| Score on water administration | 36.5 | 3.87 | 29.5 | 41.0 |
| Summary statistics | ||||
| Score on water law | 51.9 | 3.71 | 46.3 | 57.6 |
| Score on water policy | 45.2 | 5.32 | 39.6 | 55.4 |
| Score on water administration | 46.1 | 9.37 | 32.6 | 58.9 |
Table 8.
Correlations of governance variables with water performance and state economy.
| Survey 2017–2018 | Score on Water Law | Score on Water Policy | Score on Water Administration |
| % Population having safe and adequate drinking water in rural areas | 0.102 | 0.123 | 0.289 |
| Average per-capita income in constant 2011–2012 prices from 2012–2017 | –0.198 | 0.217 | –0.293 |
| Survey 2014–2015 | |||
| % Population having safe and adequate drinking water in rural areas | 0.064 | 0.023 | 0.564 |
| Average per-capita income in constant 2011–2012 prices from 2012–2017 | –0.492 | -0.382 | –0.408 |
| Combined data | |||
| % Population having safe and adequate drinking water in rural areas | 0.189 | 0.091 | 0.363 |
| Average per-capita income in constant 2011–2012 prices from 2012–2017 | –0.509 | -0.018 | –0.425 |
Table 9.
Water governance index.
| State | Average of Water Law Variables | Average of Water Policy Variables | Average of Water Administration Variables | Weighted Score on Water Law | Weighted Score on Water Policy | Weighted Score on Water Administration | Nominal Water Governance Index (NWGI) | Weighted Water Governance Index (WWGI) |
|---|---|---|---|---|---|---|---|---|
| Andhra Pradesh | 53.9 | 41.7 | 51.8 | 16.8 | 13.2 | 19.3 | 49.1 | 49.3 |
| Arunachal Pradesh | 48.2 | 39.6 | 35.7 | 15.0 | 12.5 | 13.3 | 41.2 | 40.8 |
| Karnataka | 49.3 | 41.2 | 32.6 | 15.3 | 13.0 | 12.2 | 41.0 | 40.5 |
| Maharashtra | 52.5 | 47.8 | 47.3 | 16.3 | 15.1 | 17.6 | 49.2 | 49.1 |
| Tamil Nadu | 46.3 | 41.3 | 38.5 | 14.4 | 13.0 | 14.4 | 42.0 | 41.8 |
| Telengana | 54.8 | 55.4 | 53.5 | 17.0 | 17.5 | 19.9 | 54.5 | 54.5 |
| Uttar Pradesh | 57.6 | 48.7 | 58.9 | 17.9 | 15.4 | 22.0 | 55.1 | 55.3 |
| Uttarakhand | 52.3 | 45.7 | 50.2 | 16.3 | 14.4 | 18.7 | 49.4 | 49.5 |
© 2019 by the authors. Licensee MDPI, Basel, Switzerland. This article is an open access article distributed under the terms and conditions of the Creative Commons Attribution (CC BY) license (http://creativecommons.org/licenses/by/4.0/).
Share and Cite
MDPI and ACS Style
Ahmed, M.; Araral, E. Water Governance in India: Evidence on Water Law, Policy, and Administration from Eight Indian States. Water 2019, 11, 2071. https://doi.org/10.3390/w11102071
AMA Style
Ahmed M, Araral E. Water Governance in India: Evidence on Water Law, Policy, and Administration from Eight Indian States. Water. 2019; 11(10):2071. https://doi.org/10.3390/w11102071
Chicago/Turabian StyleAhmed, Masood, and Eduardo Araral. 2019. "Water Governance in India: Evidence on Water Law, Policy, and Administration from Eight Indian States" Water 11, no. 10: 2071. https://doi.org/10.3390/w11102071
Note that from the first issue of 2016, this journal uses article numbers instead of page numbers. See further details here.