Article

Wetland Biomass and Productivity in Coastal Louisiana: Base Line Data (1976–2015) and Knowledge Gaps for the Development of Spatially Explicit Models for Ecosystem Restoration and Rehabilitation Initiatives

1
Department of Oceanography and Coastal Sciences, College of the Coast and Environment, Louisiana State University, Baton Rouge, LA 70803, USA
2
Center for Energy Studies, College of the Coast and Environment, Louisiana State University, Baton Rouge, LA 70803, USA
3
Department of River-Coastal Science and Engineering, Tulane University, New Orleans, LA 70118, USA
4
Coastal Protection and Restoration Authority, 150 Terrace Ave., Baton Rouge, LA 70802, USA
5
School of Geosciences and Institute for Coastal and Water Research, University of Louisiana at Lafayette, Lafayette, LA 70504, USA
6
Department of Geography and Anthropology, College of Humanities and Social Sciences, Louisiana State University, Baton Rouge, LA 70803, USA
7
U.S. Geological Survey Wetland and Aquatic Research Center, Baton Rouge, LA 70803, USA
8
Department of Physical Geography, Stockholm University, SE-106 91 Stockholm, Sweden Baltic Sea Centre, Stockholm University, SE-106 91 Stockholm, Sweden
*
Author to whom correspondence should be addressed.
Water 2019, 11(10), 2054; https://doi.org/10.3390/w11102054
Submission received: 20 April 2019 / Revised: 28 August 2019 / Accepted: 2 September 2019 / Published: 1 October 2019

Abstract

:
Coastal Louisiana hosts 37% of the coastal wetland area in the conterminous US, including one of the deltaic coastal regions more susceptible to the synergy of human and natural impacts causing wetland loss. As a result of the construction of flood protection infrastructure, dredging of channels across wetlands for oil/gas exploration and maritime transport activities, coastal Louisiana has lost approximately 4900 km2 of wetland area since the early 1930s. Despite the economic relevance of both wetland biomass and net primary productivity (NPP) as ecosystem services, there is a lack of vegetation simulation models to forecast the trends of those functional attributes at the landscape level as hydrological restoration projects are implemented. Here, we review the availability of peer-reviewed biomass and NPP wetland data (below and aboveground) published during the period 1976–2015 for use in the development, calibration and validation of high spatial resolution (<200 m × 200 m) vegetation process-based ecological models. We discuss and list the knowledge gaps for those species that represent vegetation community associations of ecological importance, including the long-term research issues associated to limited number of paired belowground biomass and productivity studies across hydrological basins currently undergoing different freshwater diversions management regimes and hydrological restoration priorities.

1. Introduction

Globally, the extensions of inland and coastal wetlands are declining due to human impacts including agriculture expansion, urban development, aquaculture activities, road construction, oil and gas exploration and transportation infrastructure [1]. In addition to these threats, coastal wetlands are also impacted at the regional scales by sea level rise (SLR, 1.7 ± 0.3 mm year−1; [2]) and major landscape-level indirect hydrological alterations that maximize water use and human consumption along watersheds, but further contribute to wetland loss [3,4]. One of the regions more susceptible to this dynamic synergy between human and natural impacts causing wetland loss is coastal Louisiana where up to 37% of the continental US wetlands (herbaceous) wetland are located [5,6,7]. This coastal region comprises the Chenier and the Delta Plains where a variety of wetland communities sustain a number of ecosystem services (ESs) (e.g., raw materials and food, coastal protection, habitat for fisheries, tourism, recreation) representing a value of more than $100 billion for the regional economy [8,9]. As a result of the construction of flood protection infrastructure, dredging of channels across wetlands for oil/gas exploration and transport purposes, among other human impacts, coastal Louisiana has lost approximately 4900 km2 of wetlands since the early 1900s at variable land loss rates ranging from −83.5 ± 11.5 to −28.0 ± 16.4 km2 year−1 [10,11].
Wetland loss in coastal Louisiana is one of the best-documented effects of human impacts on coastal wetlands around the world, and therefore, there are substantial efforts to develop management plans to mitigate, restore, and rehabilitate these valuable ecosystems [12,13,14]. However, developing these types of programs is challenging due to the interaction of several major drivers such as climate variability and economic development priorities operating at different spatial and temporal scales. For instance, oil, gas and groundwater extraction (months) can exacerbate subsidence rates (annual) in wetland habitats already affected by increasing SLR (decadal) and other natural disturbances such as tropical cyclones [15,16] of variable intensity (decadal, century) including Katrina (2005) [17], Gustav (2008) [18], and Isaac (2012) [19], which caused large storm surges and flooding. Because of the close interactions among natural and human influence on coastal wetlands at multiple scales, the 2012 and 2017 Louisiana’s Comprehensive Master Plan for a Sustainable Coast (LCMPSC) explicitly includes an array of integrated, coast-wide predictive models to identify projects aimed at strategically selecting restoration projects based on different future scenarios and risk reduction criteria [13]. This approach follows on a long history of modeling development to forecast Louisiana wetlands’ spatial changes and loss, and the degree of vulnerability at different levels of hierarchical complexity [20,21,22]. Indeed, the success or failure of these models’ utility and applicability in forecasting vegetation changes is based on the availability of field and experimental data. Notwithstanding, the original spatial approach is used to develop models to simulate changes in vegetation development and spatial distribution; such models are not currently used as a result of their data requirements, structural complexity, and low resolution (e.g., cell size 100 km2; [23]). Currently, high-resolution models are needed to evaluate, for example, freshwater diversions controlling water salinity gradients, hydroperiod, and sediment and nutrient transport to restore wetlands in rapidly subsiding localities in coastal Louisiana [24,25,26,27]. Yet, high resolution models require sampling data at a frequency, duration (decadal), and coverage that is generally difficult to acquire due to obstacles associated with project duration, funding availability and duration, and spatial coverage [28,29].
Despite the relevance of both wetland biomass and net primary productivity (NPP) as performance measures in wetland rehabilitation/restoration projects [30,31], there is a lack of vegetation simulation models explicitly forecasting the trends of those attributes in coastal Louisiana [32,33]. Currently, the 2017 LCMPSC uses a computer species-based model assessing changes in plant community spatial distribution and species composition (spatial resolution, 25 ha) to assess potential restoration projects where these vegetation structural variables interact with different drivers, including SLR, hurricane frequency and intensity, river discharge, rainfall, and evapotranspiration [28,32,34]. Although the utility of this model is paramount to determine successional spatial changes in major vegetation types (n = 19) in response to restoration criteria, the model does not explicitly simulate changes in biomass and NPP as related to changes in abiotic environmental conditions.
The development of dynamic spatially explicit models at high spatial resolution (e.g., 500 m × 500 m) is a complex task, given the need to include explicit functions linking, for example, from species-specific plant metabolism to individual plant development and growth functions [35]. This level of detail about vegetation functional properties complicates model development because of the lack of local and regional field-based data to implement validation and calibration procedures during model uncertainty assessment [35,36,37]. Given the need to advance the development and implementation of process-based models at high spatial resolution in the context of restoration projects in coastal Louisiana (e.g., individual base models, agent base-models) [38]), the aim of this paper is to review the availability of published biomass and NPP wetland data (below and aboveground) during the period 1976–2015. Specifically, we address the following questions: (1) what is the range of values for aboveground and belowground biomass and NPP in wetlands of dominant categories (e.g., fresh, intermediate, brackish, saline, swamp; [39])?; (2) do biomass and NPP values vary substantially among wetland types? what plant species are the most commonly studied in field and under controlled experimental conditions? (i.e., mesocosm /greenhouse); (3) what is the spatial coverage of field studies for the assessment of field biomass and NPP and the locations/basins where most field studies have been performed? and (4) what set of wetland species account for the majority of the field/greenhouse biomass and NPP studies, including the historical trend in the implementation of field/greenhouse experiments and with what frequency or periodicity? We then describe research needs to pair future vegetation modeling efforts with the implementation of productivity studies in coastal Louisiana.

2. Materials and Methods

We performed a literature search/review to retrieve all wetland studies reporting aboveground and belowground biomass and productivity data for the Louisiana coastal region. Our dataset included only published (peer-reviewed) articles. The literature search was performed primarily online (Web of Science—Thomson Reuters and Google Scholar) using broad search terms, such as “wetland” plus “aboveground biomass”, “AGB”, “productivity”, “belowground biomass”, “BG”, “belowground productivity”, “coastal Louisiana”, “freshwater”, “brackish”, “intermediate”, and “saline”. The key words were also linked to hydrological basins/bay names (i.e., Atchafalaya, Barataria, Mermentau, Mississippi, Pearl, Pontchartrain, Sabine-Calcasieu, Terrebonne, Vermilion-Teche) where wetlands are present in different locations throughout the State of Louisiana. Once an article was retrieved, we also reviewed the document list of references to complement the online search. When compiling individual species biomass and productivity values in tables and figures, we listed the species separately, even when the original publication included several species and locations. Thus, the total number of studies per species might include data from the same study, and as a result, the total number of species-specific biomass and productivity assessments might not match the total number of actual publications identified in each basin (Figure 1). We used the latitude and longitude data provided in each paper’s methods section to map the study site, but in cases where the actual information was not precise enough to find the location (Supplemental Table S1), we used the publication site description to assign the most probable location using Google Earth Pro; this was the case for a few publications (n = 5, Table S1).
Due to the low number of studies in each hydrological basin, it was not possible to perform geospatial and metadata analyses, but we were able to identify the total number of studies per basin (Figure 1). We reported data only for live biomass expressed in grams of dry weight per square meter (g m−2) in tables and figures. We interpreted the measurement of below ground biomass and productivity (g m−2 year−1) based on the study description, because both variables cannot be totally assigned to a single species when the study is performed in vegetation patches where more than two species are present. Thus, we attributed the value based on species dominance as they were reported by each study. We also included values obtained from experiments performed in greenhouse settings and in different treatment applications in experimental plots in both field and laboratory settings (e.g., [40,41,42,43,44,45,46,47,48,49,50,51]). However, these values are not discussed in the context of field experiments because some of the estimates were difficult to extrapolate to an aerial extent and some of the results were reported relative to the sampling unit (i.e., experimental pots with variable diameter/volume). As mentioned before, our main objective was to compile information under natural settings for comparative purposes. We also produced a map (ArcGIS 10.2 software, Environmental Systems Research Institute; Redlands, CA, USA) to visualize the location of study sites related to the current layout of gas and oil infrastructure, including natural gas processing plants (U.S. Energy Information Administration (EIA-757, Natural Gas Processing Plant Survey) [52], natural gas storage (Natural Gas Underground Storage facilities map layer from EIA (EIA-191, 2014) [53], refineries (Petroleum refinery map layer; EIA-820 refinery capacity report (2015) [54], electric generators (Form EIA-860 detailed data (2013) [55], pipelines (Center for Energy Studies, Louisiana State University (modified data commercially available from PennWell MAP Search under a licensed agreement), and natural gas plants (LNG) (EIA, Federal Energy Regulatory Commission, and U.S. DOT, 2013) [56] (Figure 2A,B). This map was used to qualitatively underscore the need to deploy further study sites to evaluate the current and future effect of such critical infrastructure on wetland loss and biomass and productivity studies [57,58].

3. Results and Discussion

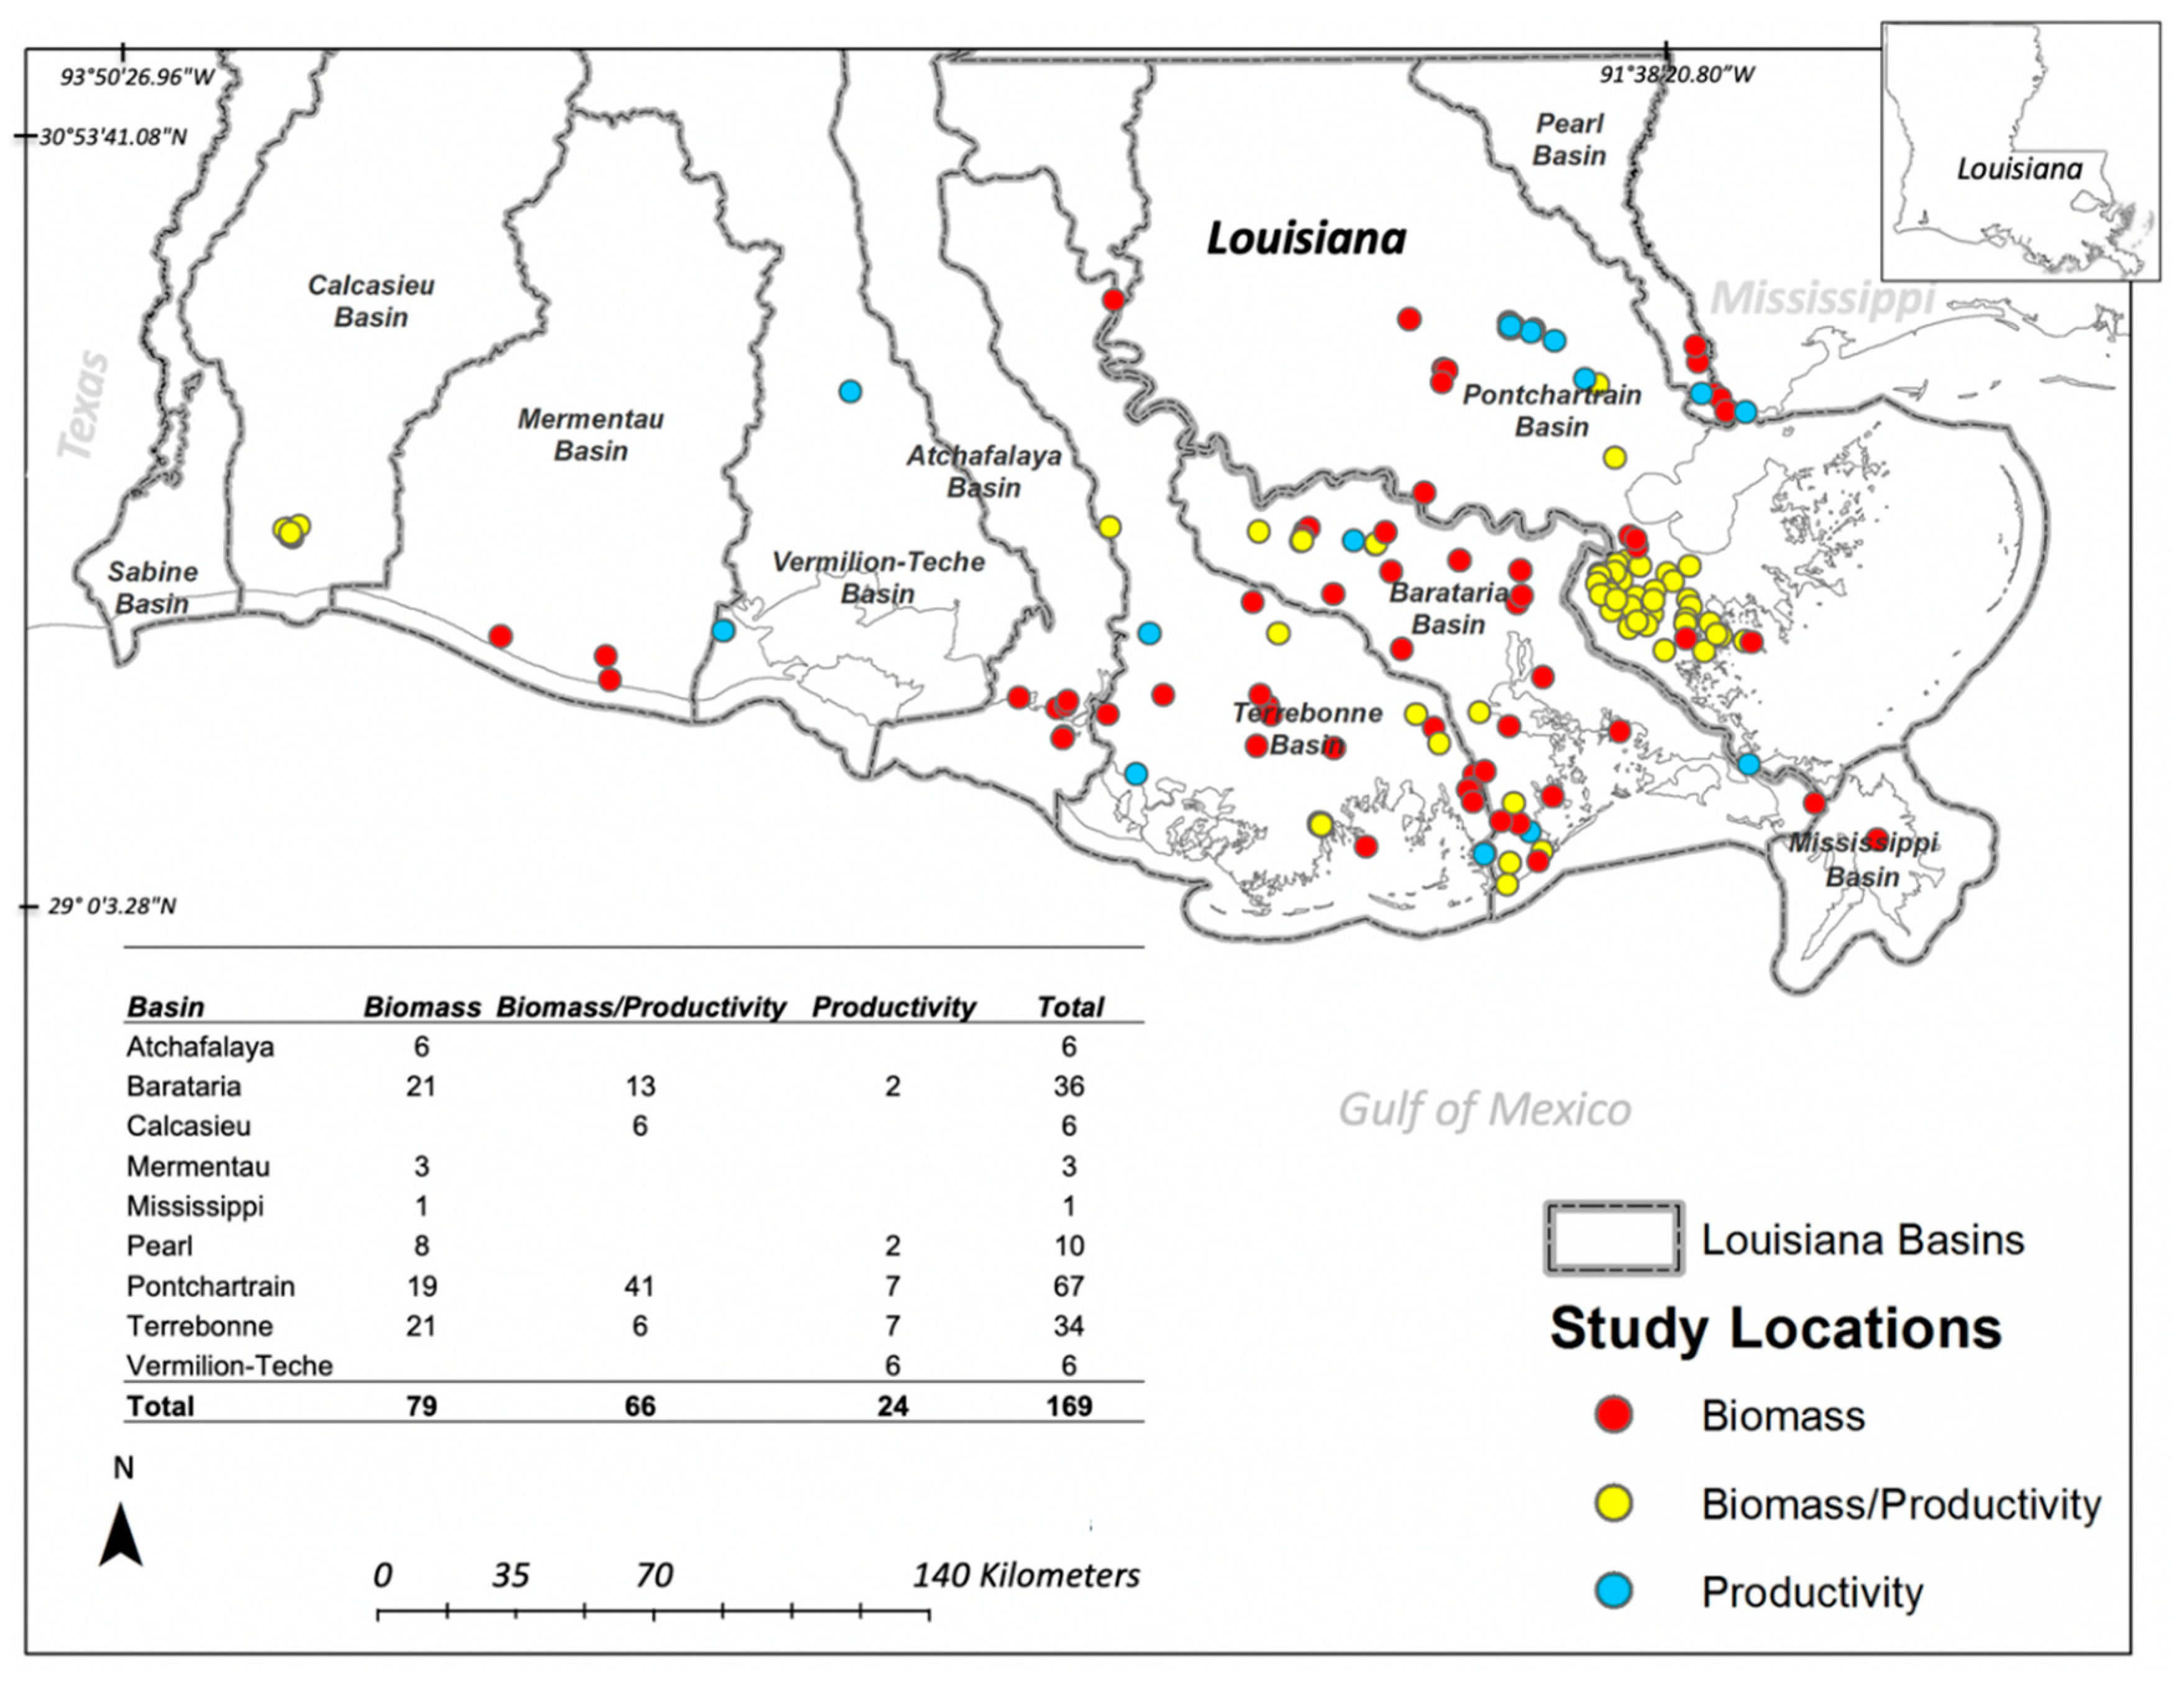
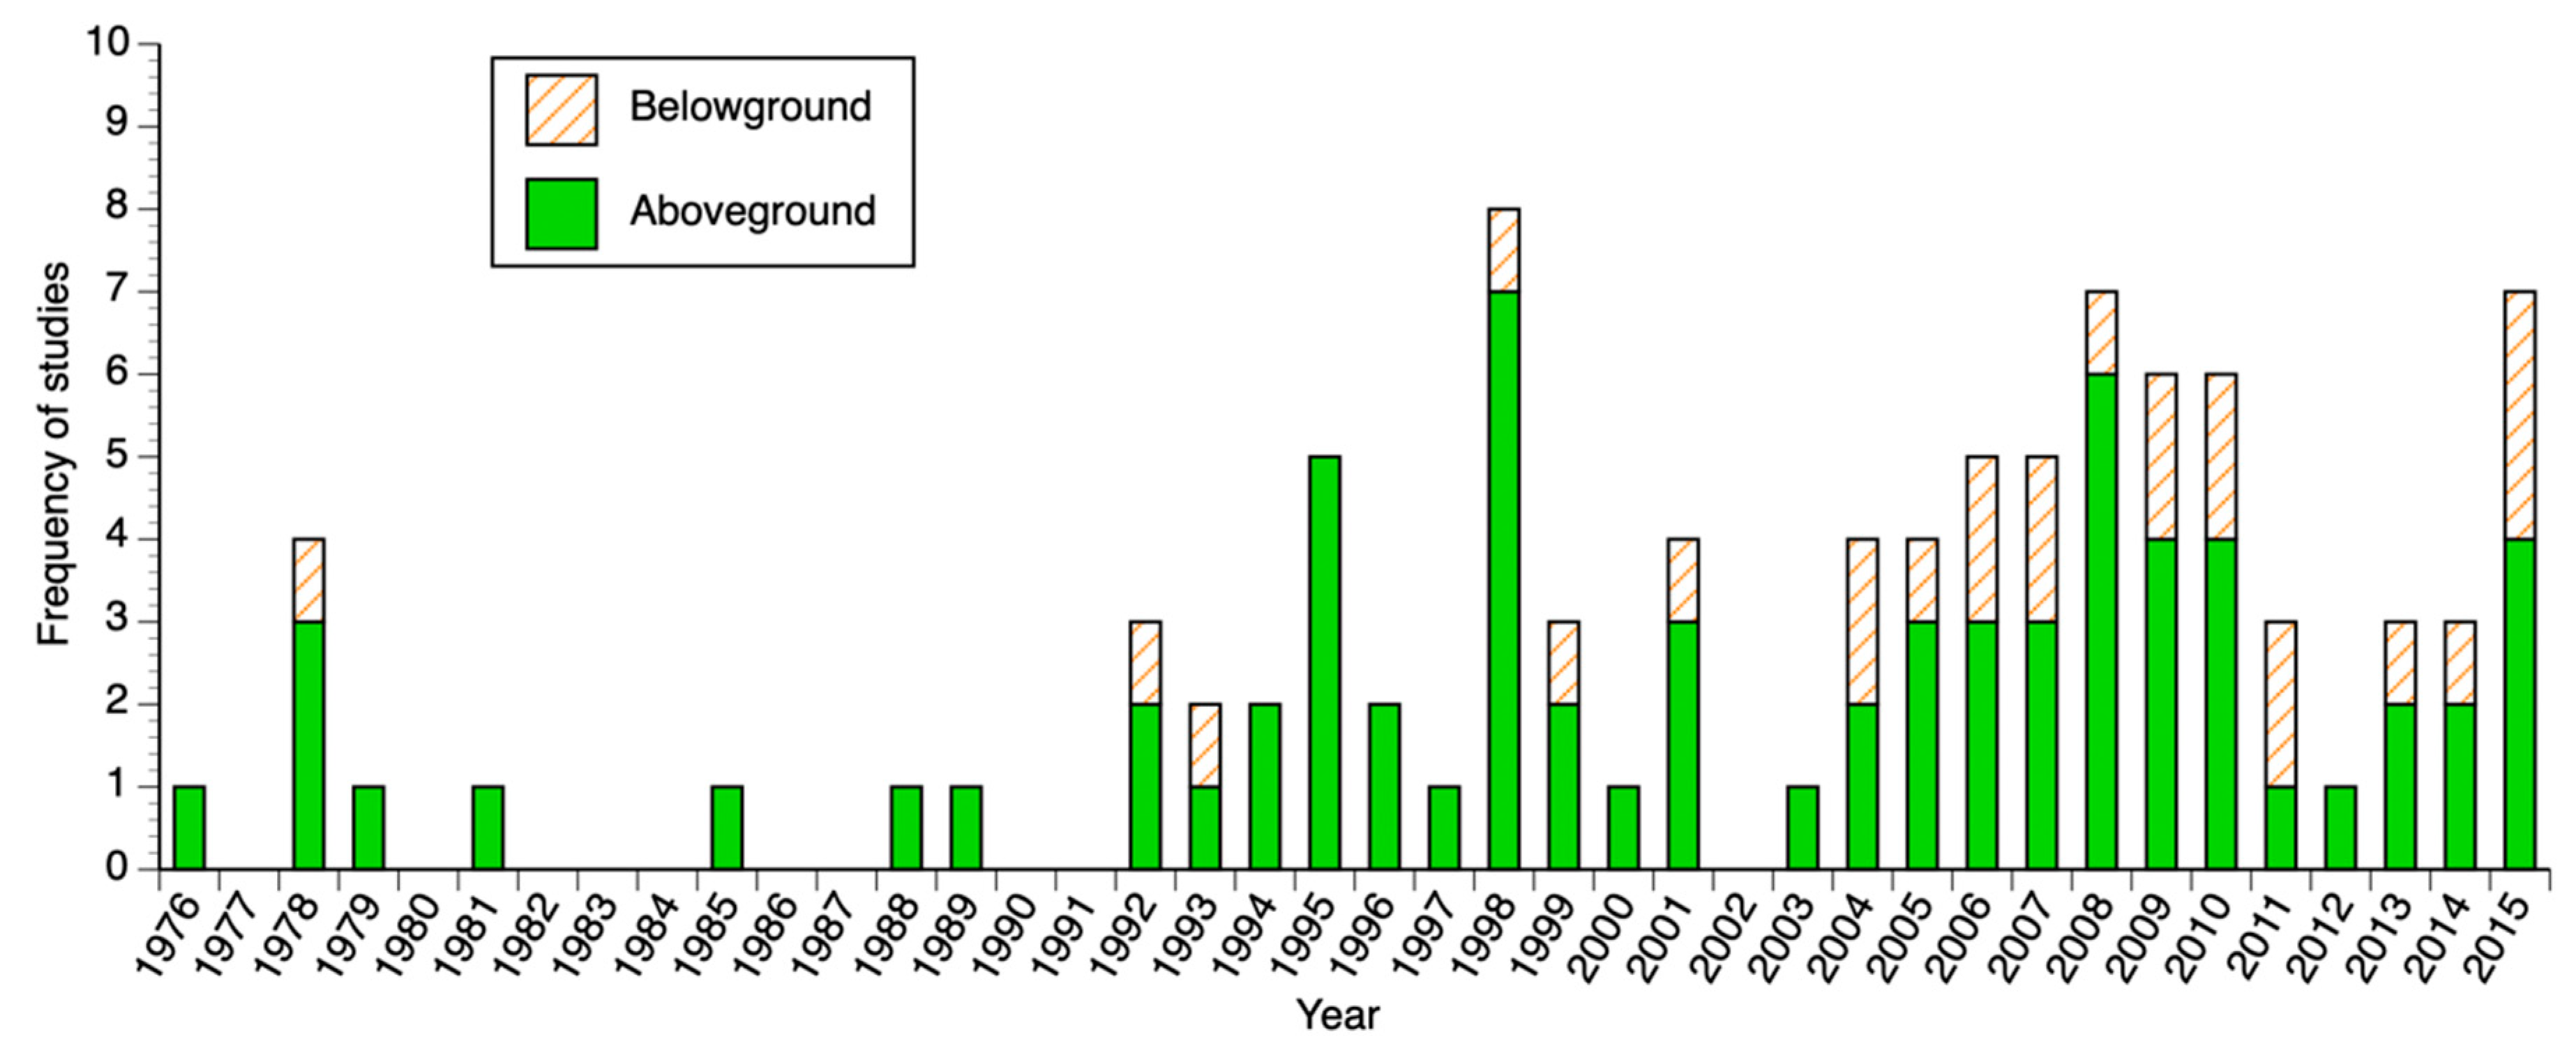
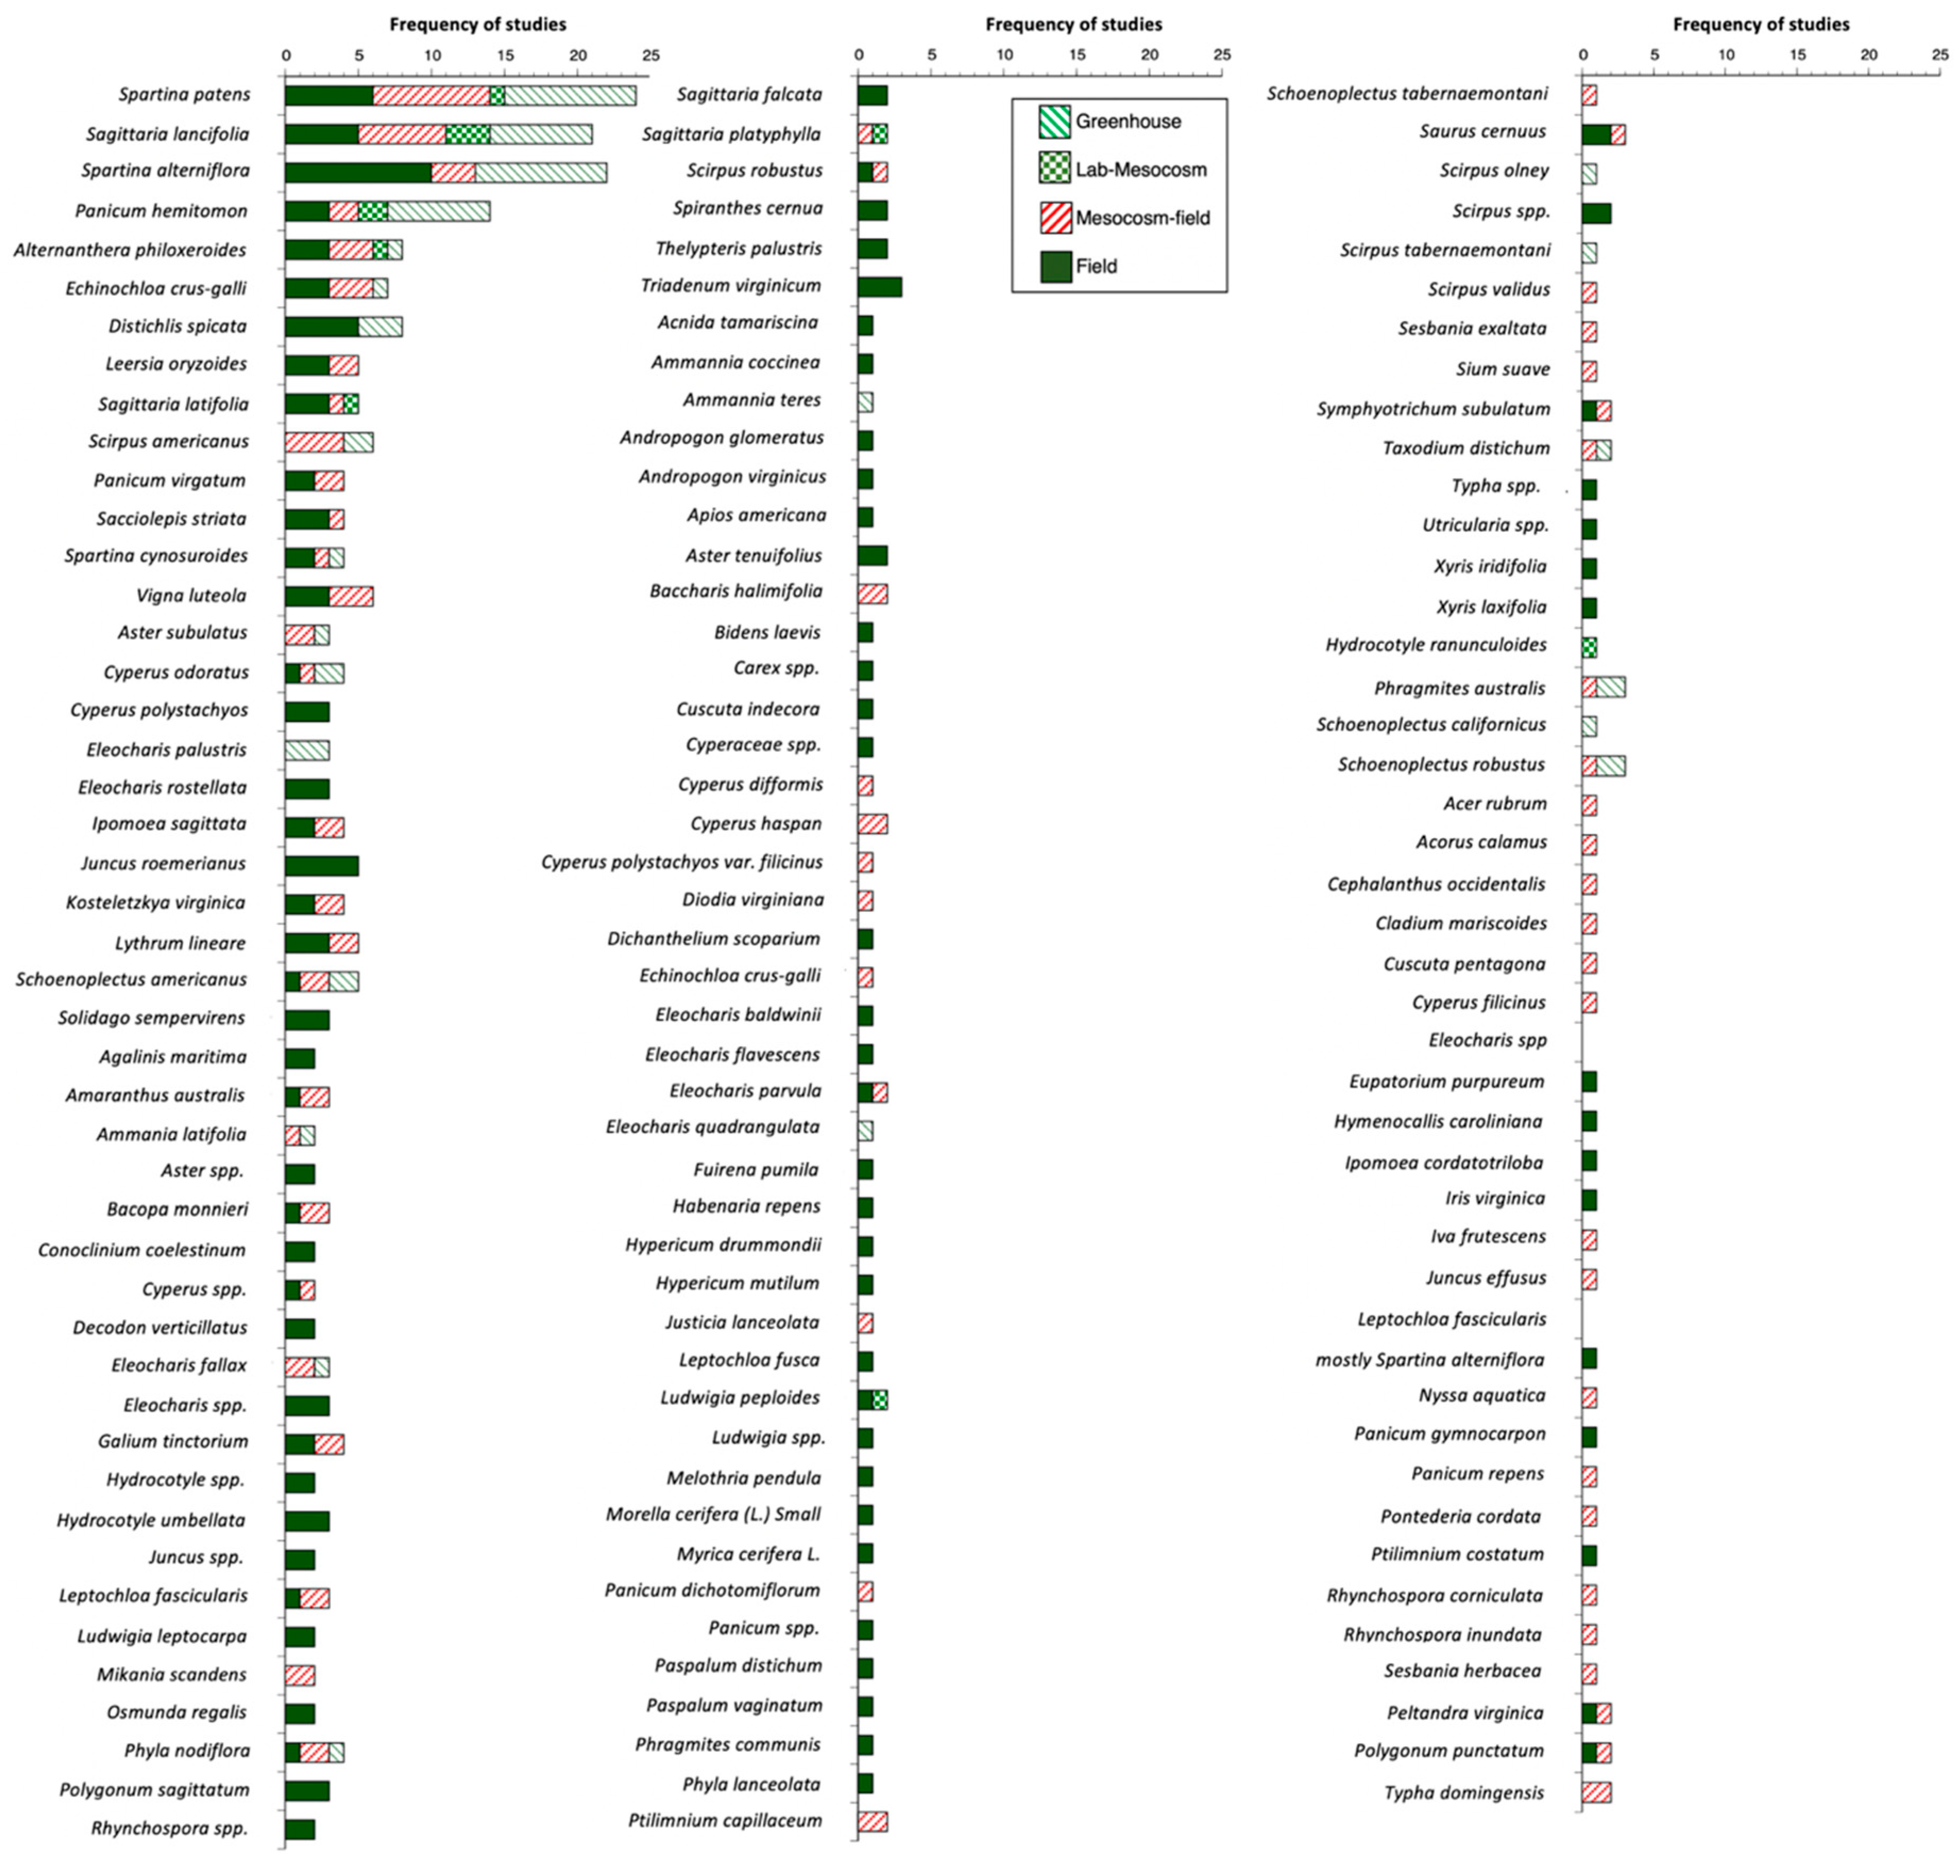
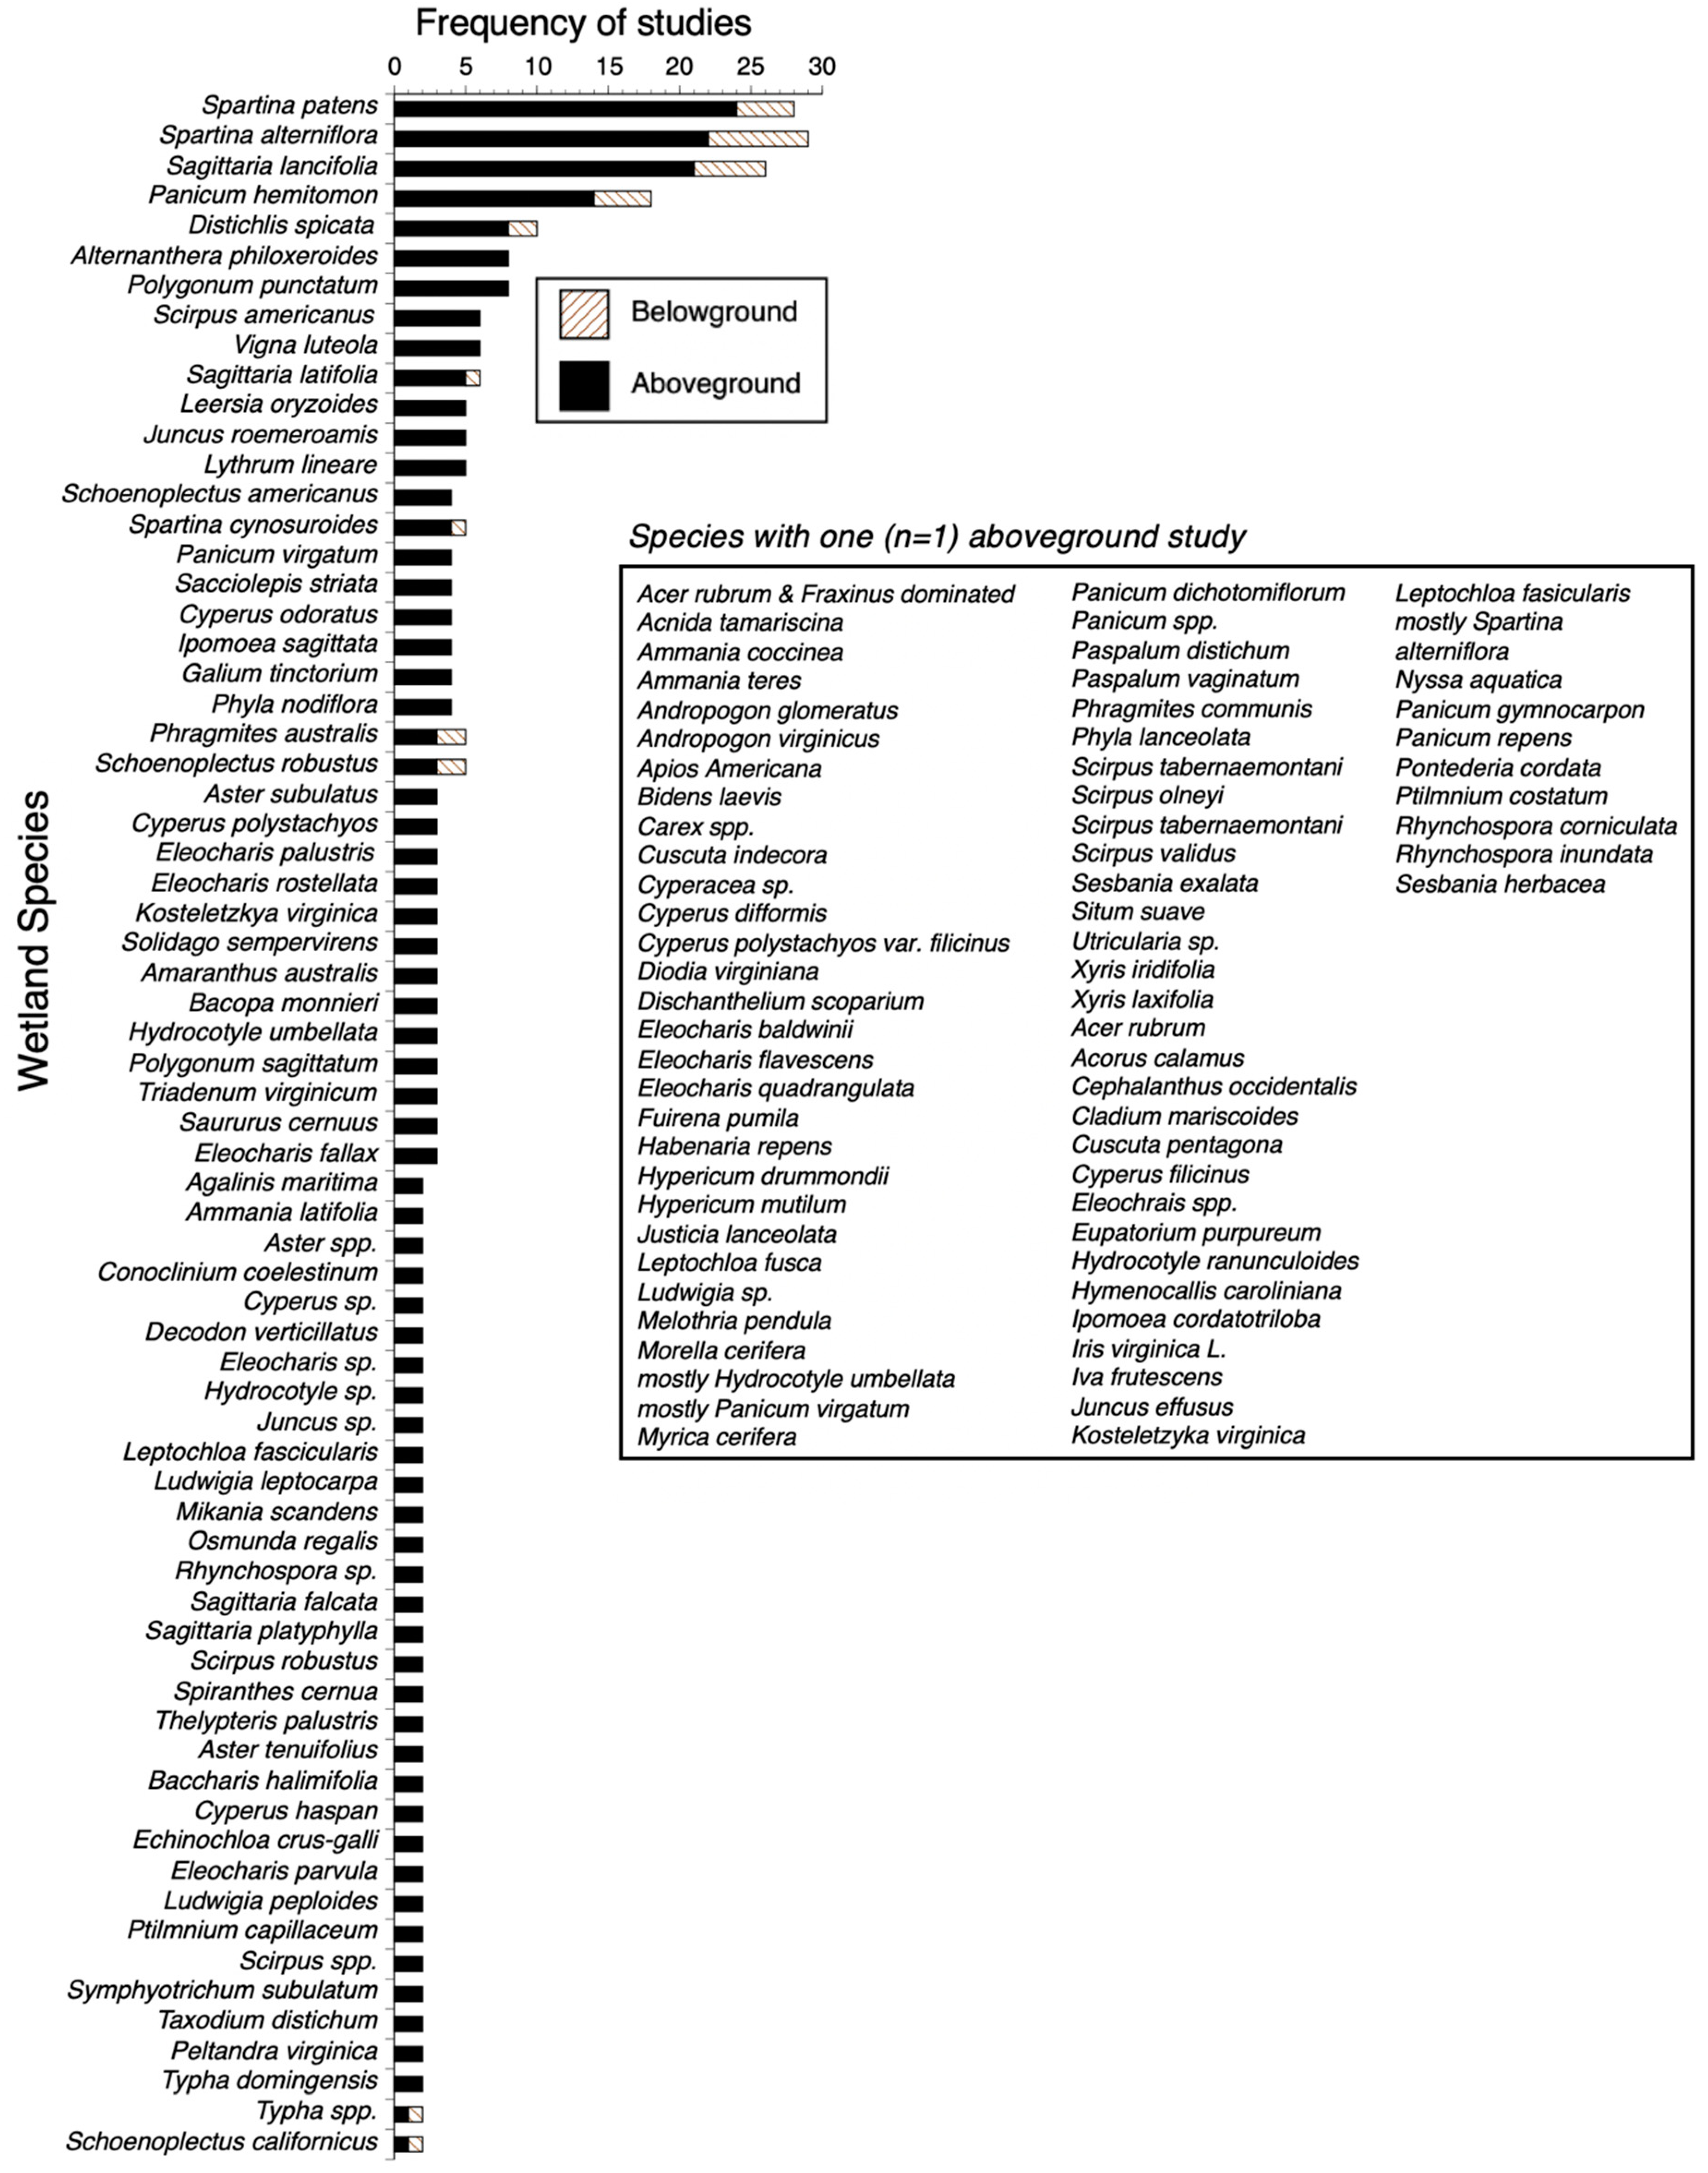
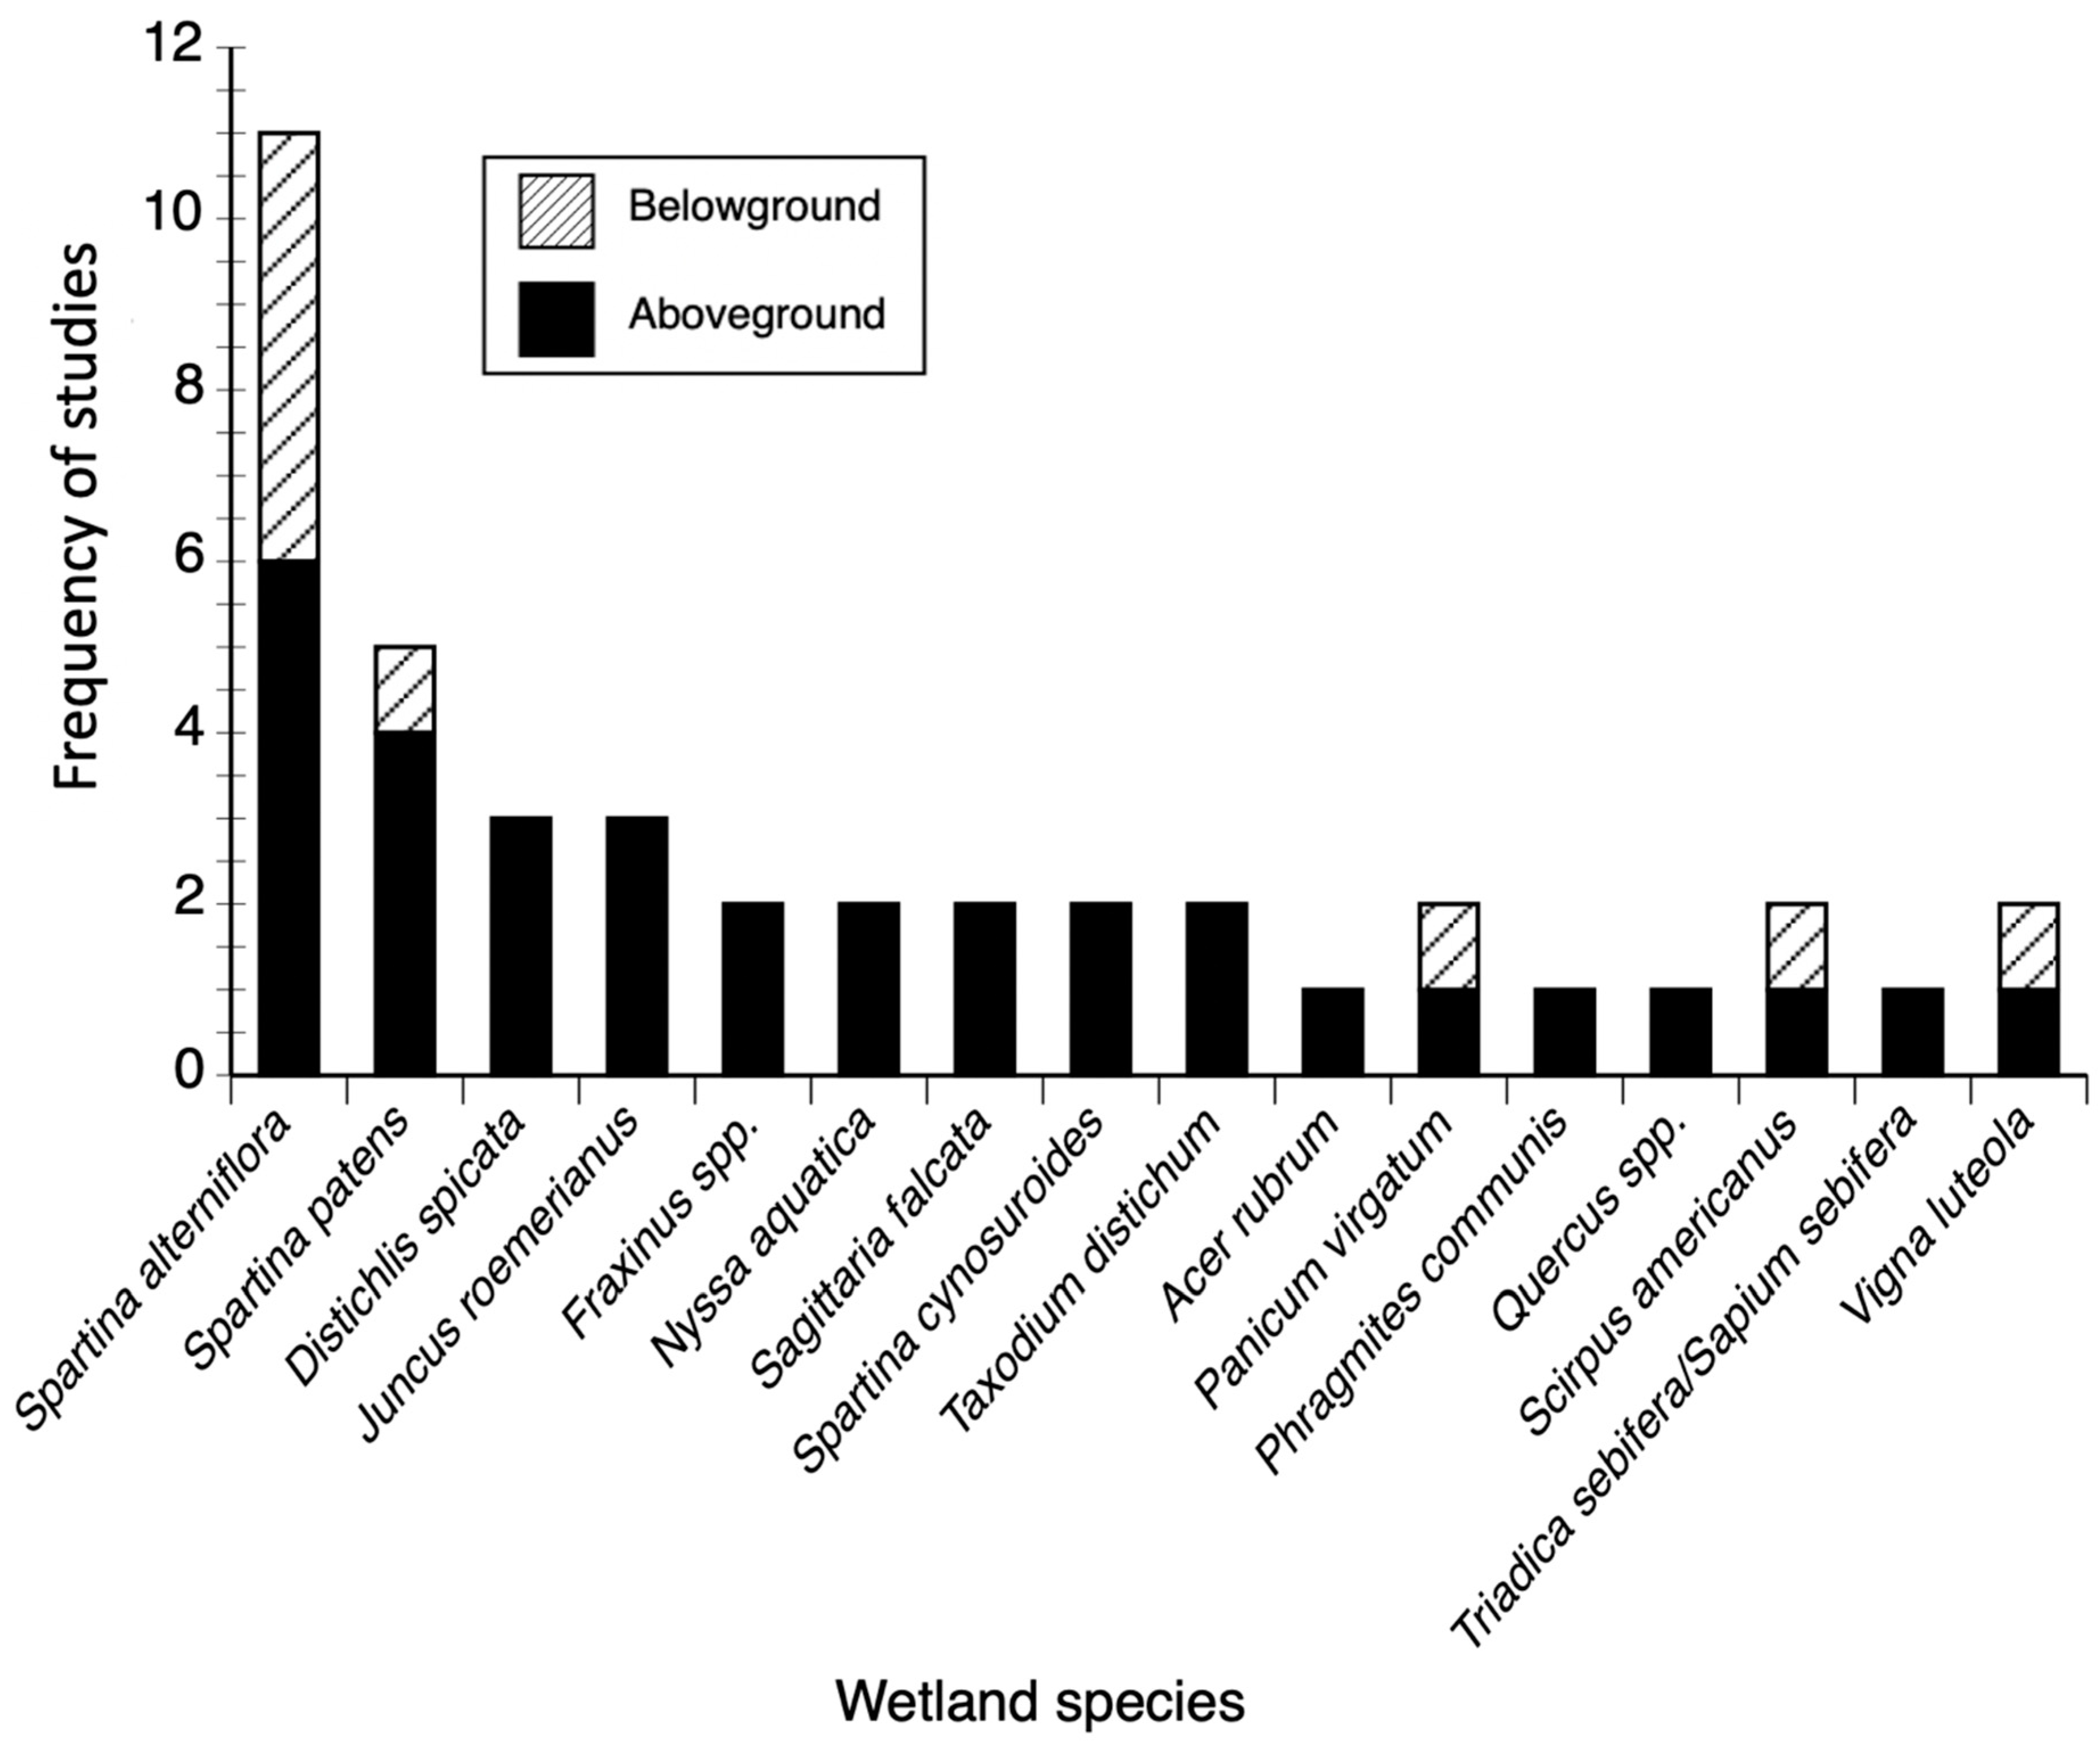
3.1. Biomass and Productivity Studies Frequency and Spatial Distribution

Our analysis, encompassing 39 years (1976–2015) of wetland studies in coastal Louisiana, revealed discontinuous temporal and spatial patterns in the frequency and spatial coverage of both biomass and productivity studies. The lack of long-term studies in each hydrological basin/bay is apparently associated with shifts in research priorities in plant vegetation studies over time for both coastal and inland wetlands (Figure 1, Table S1). Indeed, the first peer review published vegetation studies, beginning in the late 1970s (e.g., [59,60,61,62]) were performed mainly in areas undergoing both wetland loss and net gain (Figure 1 and Figure 3). These contrasting regions are the Barataria Bay, an area with major wetland loss (23 km2 year−1 from 1974–1990) [14], and the Atchafalaya Delta, which, along with Wax Lake Delta, is the only coastal region where wetlands continue to emerge and expand as result of hydrological alterations for flood protection upstream in the Mississippi River Basin [63,64,65,66]. Wetlands in those regions are impacted by oil and gas exploration/transport activities (Figure 2) that are magnified by their interactions with the regulatory effect of local (i.e., salinity, hydrology, hydroperiod) and regional (i.e., subsidence, sea level rise) environmental drivers [67,68].
One of the main objectives of this review was to evaluate the total number of studies and range of biomass and productivity values of wetland vegetation under field/natural conditions, to identify potential differences among species and across regions. We classified all articles in four categories of experimental set up (field, field-fertilization, greenhouse, and mesocosm implemented in laboratory and field settings) to facilitate the interpretation of biomass and productivity ranges. Figure 4 shows the frequency of aboveground biomass (AGB) studies per category and for 136 species. Although we identified a substantial number of actual biomass values (n = 347) for those plant species in the context of field or greenhouse/mesocosm studies, the species most studied (>3 values, Figure 4) in the period 1976–2015 represent a small fraction (n = 25, 24%) of the total species registered in our literature search, including: Spartina patens, Sagittaria lancifolia, Spartina alterniflora, Panicum hemitomon, Alternanthera philoxeroides, Distichlis spicata, Leersia oryzoides, Sagittaria latifolia, Scirpus americanus, Panicum virgatum, Sacciolepis striata, Spartina cynosuroides, and Vigna luteola, Aster subulatus, Cyperus odoratus, Cyperus polystachyo, Eleocharis palustris, Eleocharis rostellata, Ipomoea sagittata, Juncus roemerianis, Kosteletzkya virginica, Lythrum lineare, Schoenoplectus americanus, and Solidago sempervirens. Overall, the evaluation of AGB using all types of experimental approaches (field, mesocosm, greenhouse) was identified for only five species: Spartina patens, Sagittaria lancifolia, Spartina alterniflora, Panicum hemitomon, and Alternanthera philoxeroides (Figure 4). Most of the AGB values were obtained in field conditions for most of the species, although in very low frequency (n < 4) during 1976−2015 (Figure 3 and Figure 4). The number of belowground biomass (BGB) studies was even lower and with an emphasis on 12 species; most of the studies in the field were performed in habitats dominated by Sagittaria lancifolia, Spartina alterniflora, Spartina patens, and Typha domingensis (Figure 5). BGB studies under greenhouse settings were performed for the species Distichlis spicata, Phragmites australis, Schoenoplectus californicus, Schoenoplectus robustus, and Spartina cynosuroides (Figure 5).
AGB studies in the 1970s focused on the dominant salt/brackish marsh species (S. alterniflora and S. patens; n = 50), whereas studies on Sagittaria lancifolia started in the mid-1980s, although not at the frequency observed for Spartina sp. (Figure 6). Despite the spatial extension and dominance of Sagittaria lancifolia [69], the total number of studies is small (n = 21) and lacking during some periods (e.g., 1990–1994; 2002–2004; 2010–2013) in the last two decades. This lack of consistent field or greenhouse AGB studies is surprising because S. lancifolia is a dominant species generally included as the most representative of the freshwater category in modeling studies [32,70,71].
The number of published values assessing wetland BGB (n = 30) is lower than those for AGB (n = 348) in our literature search (Figure 6). Belowground data are currently reported for the following species: Spartina patens (n = 4), Spartina alterniflora (n = 7), Sagittaria lancifolia (n = 5), Panicum hemitomon (n = 4), Distichlis spicata (n = 2), Sagittaria latifolia (n = 1), Spartina cynosuroides (n = 1), Phragmites australis (n = 2), Schoenoplectus robustus (n = 1), Typha spp (n = 1), Schoenoplectus californicus (n = 1) (Figure 6). Most of these studies were performed during the last 14 years (2001–2015), although there are studies assessing below ground biomass in 1978, 1992, 1993, and 1998 (Figure 3). This large difference between the number of studies evaluating AGB and BGB (n = 30) limits species-specific comparisons among different regions (e.g., Delta versus Chenier Plain) as well as the estimation of total plant biomass values at the landscape level in freshwater, brackish, intermediate, or saline habitats. In addition, BGB studies in forested wetlands are limited and usually explicitly comprise one root category. The most common experimental setting to evaluate BGB was using greenhouse experiments (n = 18) for all species listed above, except for S. latifolia and Sagittaria platyphylla, when only laboratory-mesocosm set-ups were used; field-based experiments accounted for 20% of the total number of belowground studies (i.e., n = 7) (Figure 5).
The frequency of field studies reporting both above and belowground wetland productivity in coastal Louisiana is comparatively lower than published work in biomass assessments in other coastal regions (Figure 7). Published aboveground productivity values include the following species: Spartina alterniflora (n = 6), Spartina patens (n = 4), Distichlis spicata (n = 3), Juncus roemerianus (n = 3), Fraxinus spp. (n = 2), Nyssa aquatic (n = 2), Sagittaria lancifolia (sv. Sagittaira falcata) (n = 2), Spartina cynosuroides (n = 2), Taxodium distichum (n = 2), Acer rubrum (n = 1), Panicum virgatum (n = 1), Phragmites communis (n = 1), Quercus sp (n = 1), Schoenoplectus americanus (sy. Scirpus americanus) (n = 1), Triadica sebifera/Sapium sebifera (n = 1), and Vigna luteola (n = 1). Similar to biomass estimations, belowground productivity studies are also scarce and currently performed in the field in habitats dominated by the species Spartina alterniflora (n = 5), Spartina patens (n = 1), Panicum virgatum (n = 1), Schoenoplectus americanus (sy. Scirpus americanus) (n = 1), and Vigna luteola (n = 1) (Figure 7).

3.2. Biomass and Productivity Values

The range in biomass and productivity values is variable and largely represents a specific methodological approach (e.g., field versus greenhouse) used in each study. Supplemental Tables S2 and S3 show the biomass and productivity values reported for field studies across different locations and habitats (freshwater, intermediate, brackish, saline, swamp) to help evaluate absolute magnitudes under natural conditions for all species. We also included other type of studies (e.g., greenhouse) to underscore the year when such studies were performed during 1976–2015. Furthermore, these values also include a treatment category labeled as control, particularly in field/mesocosm experimental work, to increase the sample size and facilitate the comparison and assessment of both productivity and biomass ranges available for each species. Due to seasonality, most of the studies included in this analysis were performed during the growing season (March–October). Because these field-based values represent the combined interaction of complex environmental drivers, they could potentially be used in the calibration of statistical and mechanistic models. Below, we discuss biomass and productivity values for the species more frequently studied in the period 1976–2015 (Figure 6 and Figure 7; Tables S2 and S3).

3.2.1. Spartina alterniflora

As mentioned before, Spartina alterniflora (smooth cordgrass) had the highest frequency of biomass and productivity studies. This species is a key species conforming to the category/community/class “saline” [32,39,69] or “oystergrass” [32] in the general classifications of wetland habitats currently proposed for coastal Louisiana [72]. AGB values can reach maximum values ranging from 801 to 2178 g m−2 (Table S2) (e.g., [62,73,74,75,76]). A field study altering the frequency of inundation shows that in situ biomass values could reach values up to 5900 g m−2 when the percentage of flooding is low (~10%) [77]. Overall, average aboveground biomass values range from 344 to 641 g m−2 (Table S2) (e.g., [78]). The low number of BGB values under field conditions in the Cocodrie–Terrebonne Bay region [79] indicate that mean BGB can be two–three times higher than AGB (e.g., 1207 g m−2; [80]). Maximum values reported for in situ experiments altering relative elevation in the Breton Sound area show that by reducing flooding duration, BGB could reach up to 13,500 g m−2 [77].
Aboveground productivity (AGP) rates show similar ranges across different locations, although a spatial statistical analysis is not feasible due to the lack of enough studies for a comprehensive regional comparison. Reported ranges and mean values include 1527–2895 g m−2 year−1 (Bayou Terre aux Boeufs–Mississippi River Delta; [81]), 2658 g m−2 year−1 (Bayou Lafourche; [59]), 1803–3573 g m−2 year−1 (Hog Island Gully area–Sabine National Wildlife Refuge; [82]), 1654–2399 g m−2 year−1 (Hog Island Gully area–Sabine National Wildlife Refuge; [82]), 1821 g m−2 year−1 (Cocodrie–Terrebonne Bay region; [80]), 275 g m−2 year−1 (Bay Jimmy–northern Barataria Bay: [83]), 1123 g m−2 year−1 (Breton Sound; [84]). These values were published in the period 1978–1990 (e.g., [85]) and then from 2005 to 2013 (e.g., [86]). Our literature search did not produce studies for S. alterniflora AGP from 1981 to 1990 (9 years) and from 1991 to 2005 (14 years) (Table S3); considering the ecological importance and spatial extent of S. alterniflora, these are large gaps. The number of belowground productivity (BGP) studies are low in number overall (149 g m−2 year−1; Bayou Terre aux Boeufs–Mississippi River Delta; [81]), particularly in the late 1980s, but with more comprehensive studies in the years 2005 (2331–2917 g m−2 year−1; [82]), 2008 (145–365 g m−2 year−1; [87]) and 2013 (4776 g m−2 year−1; [84]). The high BGP rates reported in these studies underscore the critical role of belowground production contribution in soil formation and the functional role in maintaining soil elevation in the long term (e.g., [75,88]).

3.2.2. Spartina cynosuroides

Spartina cynosuroides (big cordgrass) studies are sparse and only two published productivity studies were identified. These studies were performed in the Terrebonne/Port Fourchon region, where Hopkinson et al. [59] reported a mean value of 1355 g m−2 year−1, while Hopkinson et al. [89] obtained a range of values from 398 to 1700 g m−2 year−1 as part of a study to determine AGP using different methods. No further productivity values have been reported for this marsh species in the last 30 years.

3.2.3. Spartina patens

Similar to Spartina alterniflora, Spartina patens (saltmeadow cordgrass) is a key species in the classification of wetland habitats. Commonly known as wiregrass, S. patens is part of the Brackish and Brackish mixture (with Distichlis spicata) class [39,69,90,91,92]. AGB maximum values ranged from 500 to 7500 g m−2 (Table S2). Maximum values were obtained when altering hydroperiod under field conditions (Breton Sound; [77]). We identified 13 studies, directly assessing biomass under different locations and with variable mean values within the same order of magnitude: 900 g m−2 (Bayou Lafourche; [59,89]), 290 g m−2 (Pearl River; [93]), 833.2 g m−2 and 583.3 g m−2 (Three Bayou, Barataria Bay; Johnson and Foote [94], 300 g m−2 (Pearl River Wildlife Management Area; [95] and 316 g m−2 (Chenier Plain; [96]) (Table S2). In contrast to AGB, BGB values for this species are sparse. We identified two studies performed in greenhouse settings [97,98] and only one study in the field, where aboveground (7500 g m−2) and BGB were relatively high (17,000 g m−2) in response to changes in the frequency of inundation (Breton Sound; [77]).
There are few S. patens productivity field studies (Supplemental Table S3) [98]. AGP field studies in Bayou Lafourche [59] reported mean values of 6043 g m−2 year−1, while in the Bayou Terre aux Boeufs–Mississippi River Delta region, values ranged from 1342 to 1428 g m−2 year−1. The highest reported values ranged from 2000 to 5810 g m−2 year−1 and were obtained in Bayou Lafourche [59]; these values were derived from a comparative analysis of productivity methods that could affect actual values in the field depending on the method assumptions and study length [59,89]. More recent mean AGP and BGP values reported for this species in the Breton Sound region are 1158 g m−2 year−1 and 5776 g m−2 year−1, respectively [84].

3.2.4. Sagittaria lancifolia (sy. S. falcata) and Sagittaria latifolia

Sagittaria lancifolia (sy. Sagittaria falcata) (bulltongue arrowhead) and Sagittaria latifolia (broadleaf arrowhead) studies are scarce despite the species’ wide spatial extent and presence in freshwater wetlands (i.e., Delta Splay class) [99]. All the studies identified for both were performed within an experimental set up in the field (e.g., [100,101]) or laboratory (e.g., [102,103]) in contrasting environments (floating marsh and delta lobes) [104]. S. lancifolia is included in the intermediate class/community classification (e.g., [69]) and is also highly productive, although intolerant of high soil salinities (>20 ppt) [105,106]. Most of the AGB field-oriented studies started in the mid-1980s and have been performed sporadically from the 1990s onward. Maximum AGB range and mean values were 106.1 g m−2 (Log Island–Atchafalaya Bay: [107]), 98.5–420.6 g m−2 (Pearl River mouth–Lake Ponchartrain; [108]), 0–106.9 g m−2 (Baldford Bayou–Tchenfuncte River; [109]), 400–500 g m2 (Pearl River Wildlife Management area; [110]), and 200 g m−2 (Mandalay National Wildlife Refuge; [111]) (Table S2). There is large variability in mean and range values within each study. For example, studies performed in the late 1990s evaluating disturbance regimes reported (i.e., in control plots) ranges from 400 to 500 g m−2 [110], while other studies showed ranges from 0 to 106.9 g m−2 [109]. The maximum AGB value reported for this species is 950 g m−2 (mesocosm laboratory experiment) [112]. One study showed high BGB values ranging from 1900 to 2750 g m−2 under eutrophic and impacted conditions [113], while other studies reported an AGP mean value of 1501 g m−2 year−1 [59] and a range from 800 to 2310 g m−2 year−1 [89] (Table S3).
S. latifolia is also considered part of the fresh marsh class. AGB is substantially affected by salinity and flooding gradients; thus, natural settings have a wide range based on few available values. Mean reported field values (including controls) range from 5.3 to 854.2 g m−2 (Table S2 [114,115,116,117]. Only one study reported BGB in the range of 0–160 g m−2 (control treatment) under experimental conditions while varying salinity regime and soil type [112].

3.2.5. Panicum hemitomon and Panicum virgatum

Panicum hemitomon (maidencane) is typically found in freshwater marshes and therefore is a key species characterizing this class [118]. Although AGB values have been estimated in all experimental set-ups since the mid-1980s (Table S2), there are few studies directly assessing biomass in field conditions (e.g., [119]). Current studies show high AGB values with similar magnitude in mean values: 320 g m−2 (Barataria Bay; [120]), 636.2 g m−2 (Lake Boeuf; [114]), and 567.9 g m−2 (Lake Boeuf; [117]) and range: 337–441 g m−2 (Barataria and Penchant basins; [121]). Interestingly, BGB studies for this species are recent, sporadic, and obtained only under greenhouse and laboratory-mesocosm experimental set-ups to determine the interactions among salinity, hydroperiod, and nutrient regimes [47,97,122,123] (Table S2). However, no field studies have been performed (Table S2), which is surprising given maidencane’s extension and persistence across freshwater wetlands [124,125]. The only productivity study reported was for P. virgatum (switchgrass) in the Breton Sound estuary, where the mean AGP and BGP were 872 g m−2 year−1 and 14,485 g m−2 year−1, respectively [84] (Table S3).

3.2.6. Distichlis spicata

Distichlis spicata (“saltgrass”) is a dominant species in saline environments, and together with Spartina alterniflora, Juncus roemerianus (needlegrass rush), and the mangrove species, Avicennia germinans (black mangrove), conform to the wetland class saline [69], or, when just grouped with S. alterniflora, is labeled the “mesohaline mixture” class [39]. Distichlis spicata is one of the few species with information collected since the 1970s, although the frequency of studies is very low; the most recent estimates were obtained in 2006 [126] and 2010 [127] under experimental conditions (Table S2). Estimated mean AGB values were 560 g m−2 (Bayou Lafourche; [59,89]), 404.2 g m−2 (Bayou Terre aux Boeufs; [81]) and 146.3 g m−2 (Rockefeller State Wildlife Refuge; [96]). There are no BGB or BGP estimates fields available for this species (Tables S2 and S3), although there is experimental work (greenhouse) showing the relative allocation of above and BGB in pots under different salinity (0, 10, 25 ppt) and depth of inundation (−1, 10 cm) treatments [126]. Reported mean AGP values were 3237 g m−2 year−1 (Port Fourchon; [59]) and 1291 g m−2 year−1 (Bayou Terre aux Boeufs; [81]), while Hopkinson et al. [89] reported a range from 720 to 2750 g m−2 year−1 in Bayou Lafourche.

3.2.7. Alternanthera philoxeroides (Mart.) griseb.

Alternanthera philoxeroides (alligatorweed) is one of the species used as an indicator in the “intermediate” or “deltaic roseau cane” wetland category, according to Visser et al. [39,69]. This is an invasive species introduced from South America (Parana River region; [128]. AGB obtained in the field was low and mean values ranged from 0.9 to 14.1 g m−2 [99,114,116,117]. The number of greenhouse/mesocosm studies (n = 3) is almost equivalent to the number of field studies (n = 5) observed for this species; experiments have assessed the interaction of salinity and hydroperiod or herbivory [47,109,115,129]. There were no available BGB or productivity studies for this species; vegetation studies reporting information for this species started in the mid-1990s.

3.2.8. Polygonum punctatum

Polygonum punctatum (dotted smartweed) is a high indicator species of fresh or “delta splay” categories [32,39]. Other typical species in these groups are Colocasia esculenta (wild taro), Sagittaria latifolia, and Schoenoplectus deltarum (delta bulrush). Most of the AGB are from field studies [100,109,110,115,116,117,118], although we identified one greenhouse study [109]. The range of AGB values is shown in Table S2 and overall varies from 0 to 72.7 g m−2. No BGB and productivity (above or belowground) studies were identified.

3.2.9. Schoenoplectus americanus (Syn.Scirpus americanus)

Although Schoenoplectus americanus (chairmaker’s bulrush) is also identified as Scirpus americanus, we separated the search results to facilitate the identification of the original published material (Tables S2 and S3). Despite its wide spatial distribution, we only found field AGB information for this species in studies performed in the late 1990s and late 2000s (Table S2) (e.g., [130,131]). Field and mesocosm studies showed a wide range in AGB (15.8–72.8 g m−2; [94]) (0–9.8 g m−2 and 125 g m−2; [95,131]) (20 g m−2; [48]) (0–0.1 g m−2; [116]); no BGB values for this species have been reported. We located only one productivity study, reporting mean values of 561 g m−2 year−1 and 6506 g m−2 year−1 for AGP and BGP, respectively [84]. This species is considered a key indicator of the species grouped within the oligohaline and mesohaline wiregrass class and the mesohaline mixture class [39,69,76].

3.2.10. Leersia oryzoides

Leersia oryzoides (rice cutgrass) is part of the freshwater class, and given its functional role, it is also included in other vegetation classes, such as deltaic and freshwater mixtures (e.g., maidencane, bulltongue) [39]. The range in AGB was wide and included mean values from 12 to 450 g m−2 [114,115,117,120]. Low minimum values were also reported in control treatments of field experimental work (0–0.4 g m−2) [116] (Table S2). BGB and productivity data were not currently reported for this species.

3.2.11. Vigna luteola

Vigna luteola (hairypod cowpea) can be found in freshwater and brackish environments and therefore is included in the deltaic mixture, oligohaline wiregrass, and in both the meshohaline wiregrass and meshohaline mixture classes [39]. AGB reported mean field values were 33.5 g m−2 [114], 2.2 g m−2 [99], and 25.4 g m−2 [117], while the published ranges were 0.5–256 g m−2 [108], 32–65 g m−2 [93], and 0.2–1.4 g m−2 [109] (Table S2). No BGB values are available and the only productivity study reported AGP and BGP values of 964 g m−2 year−1 and 6028 g m−2 year−1, respectively [84] (Table S3).

3.2.12. Juncus roemerianus

Juncus roemerianus (needlegrass rush) is included in the vegetation class saline and is the key species characterizing this group along with S. alterniflora [32,39]. J. roemerianus is also included in a wide range of classes from oligohaline wiregrass to polyhaline oystergrass [39]. Because of its wide range of dispersion across salinity gradients, AGB mean values reported in different localities under natural conditions were variable, including 21 g m−2 [108], 440 g m−2 [83], 827 g m−2 [59], and 1306 g m−2 [81]. No BGB values were published for this species in coastal Louisiana; two AGP studies in natural conditions in the late 1970s and 1980 reported a mean value of 3416 g m−2 year−1 and ranges obtained by different productivity assessment methods ranged from 1740 to 1806 g m−2 year−1 [81] and from 1200 to 3295 g m−2 year−1 [89].

3.2.13. Lythrum lineare

Lythrum lineare (wand lythrum) is included in the oligohaline/mesohaline wiregrass and mesohaline mixture [39] due to its tolerance to salinity. It shows the highest indicator value for the category “same” (Schoenoplectus americanus, Lythrum lineare, Eleocharis parvula (dwarf spikerush), Baccharis halimifolia (eastern baccharis), Amaranthus australis (southern amaranth) proposed by Snedden and Steyer [70] using a combination of salinity and tidal amplitude values. Published information indicated mean low AGB values in comparison to other species, including 0.6 g m−2 [108], 2.4 g m−2 [99], and 0.4 g m−2 [117]. Using an experimental set up in the field, the control or reference conditions supported AGB values ranging from 0.0 to 0.88 g m−2 [109]. However, these studies did not report any BGB values; productivity studies for this species were not identified in our literature search.

3.2.14. Swamp (Taxodium distichum, Nyssa aquatica, Fraxinus spp)

The swamp category in the Visser et al. [132] classification scheme includes several forest species, although Taxodium distichum (baldcypress) generally represents the indicator species for this class [133]. This species was found to be associated with Nyssa aquatica L., another dominant species in this category; together these species inhabit lower elevations and are subject to long hydroperiods [134,135,136]. Although there are several publications assessing forest structural properties (e.g., tree density, basal area) for swamps (e.g., [137,138,139]) and bottomland hardwood tree species (Sugarberry, Celtis laevigata Willd; sweetgum, Liquidambar styraciflua L.; oaks, Quercus nigra L., Q. phellos L., and Q. nuttallii E.J. Palmer; green ash, Fraxinus pennsylvanica Marsh.; water hickory, Carya aquatica (F. Michx.); American elm, Ulmus americana L.), here we only report productivity (NPP, stem production) for T. distichum, Nyssa aquatica, and Fraxinus spp. (Table S3). Early work in the 1980s (i.e., [140,141]) determined a range of stem production for T. distichum in both natural flooding (646 g m−2 year−1) and permanently-flooded (209.9 g m−2 year−1) conditions, while in controlled conditions the mean NPP value was 387.8 g m−2 year−1 (Lac des Allemands swamp, upper end of the Barataria Bay estuary) (Table S3). Conner et al. [140] also reported mean NPP (steam) values for Nyssa aquatica in natural flooding (57.9 g m−2 year−1), permanently flooded (149.1 g m−2 year−1), and controlled flooding (57.8 g m−2 year−1) conditions; in the case of Fraxinus spp., mean reported NPP values were 48.6 and 453.1 g m−2 year−1 for the permanently flooded and controlled flooded treatments, respectively [140] (Table S3). Considering the contribution of stem and litter productivity to total NPP for the swamp class, this value ranged from 886.7 to 1779.9 g m−2 year−1 (e.g., T. distichum, Nyssa aquatic, Fraxinus spp.). Using long-term experimental plots (1986–2008), Conner et al. [134] reported T. distichum NPP (stem production) ranges for different locations along an elevation gradient in the Lake Verret watershed in south-central LA; these localities included a transition area (70–240 g m−2 year−1) and the swamp association proper (100–600 g m−2 year−1). Overall, mean the AGBs reported for both bottomland hardwood and swamp forests were 16,100 g m−2 and 37,500 g m−2, respectively [61]. We did not identify studies estimating BGB and BGP for the swamp category.

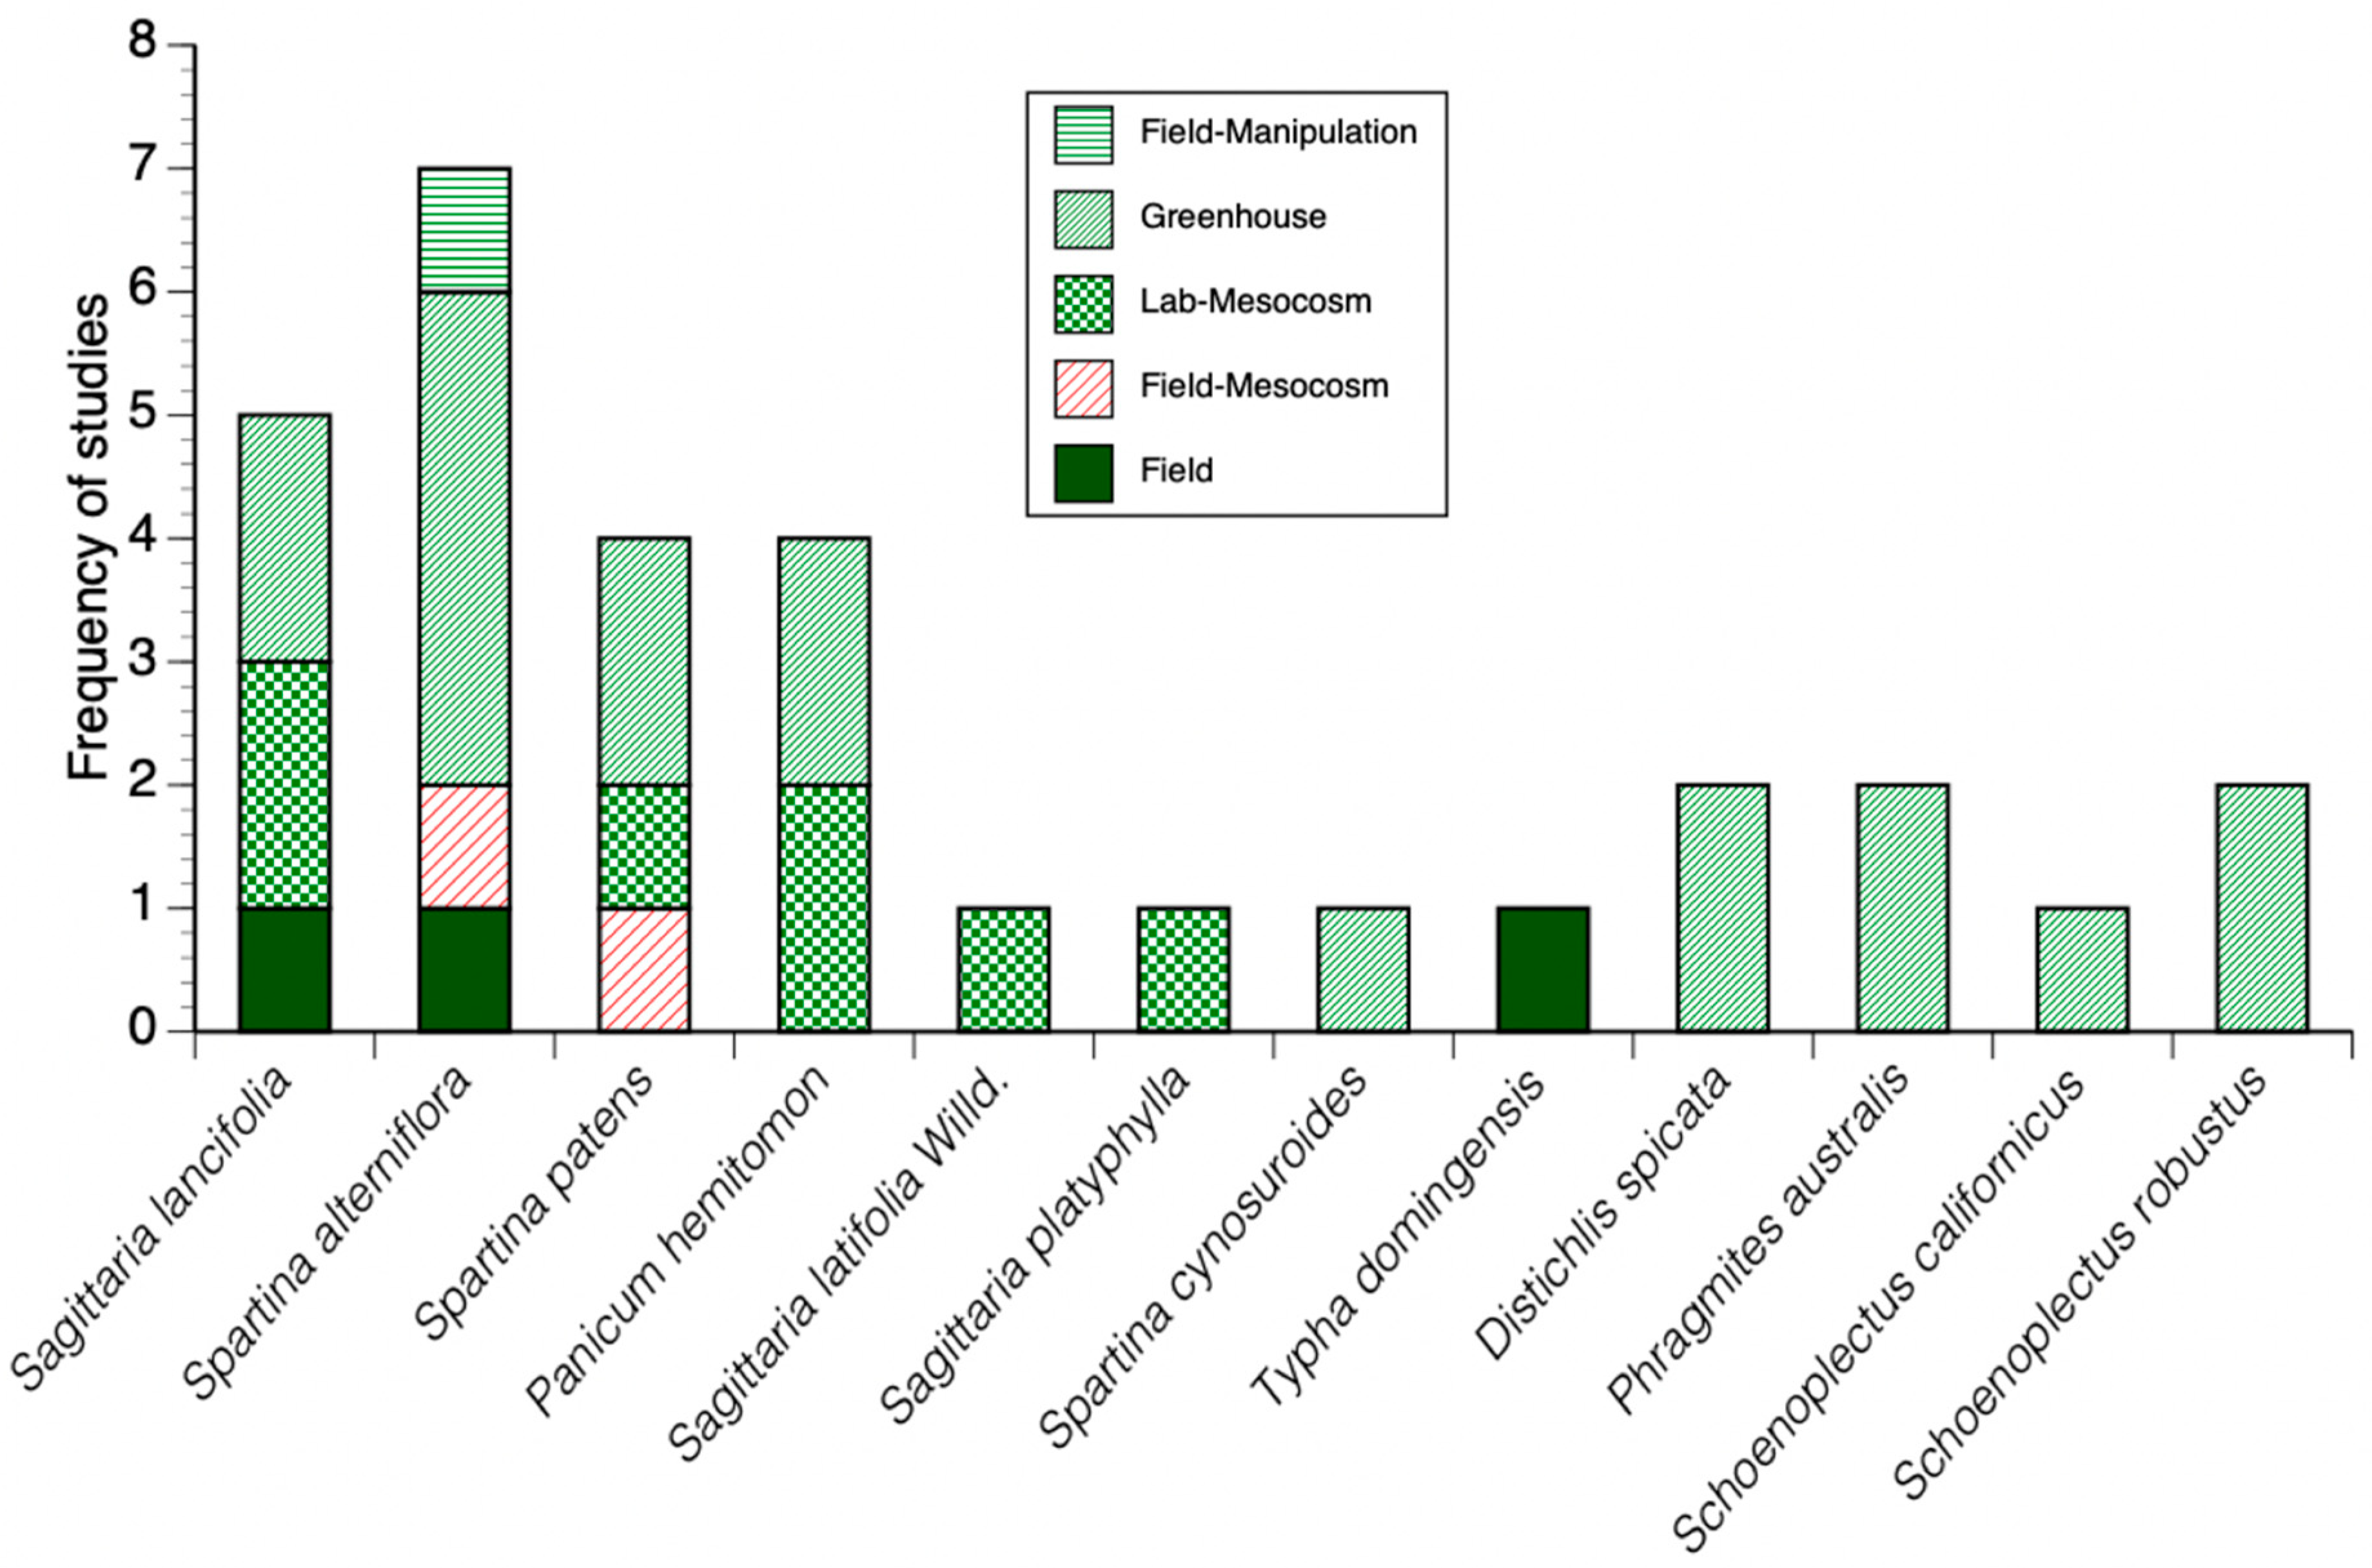
3.3. Data Availability in Vegetation Modeling

Spatially explicit mechanistic models to evaluate potential changes in spatial distribution and productivity of wetlands in coastal Louisiana have been previously developed [20,21,22]. However, the utility of these models to project habitat changes as a result of hydrological and sediment load alterations has been limited due to the lack of data for model calibration and validation. This is the case when attempting to develop process-based models that require the inclusion of parameters in ecological functions representing species-specific eco-physiological processes (e.g., carbon sequestration, respiration, nutrient uptake, net production rates) (e.g., [21]) or species interaction (e.g., competition, niche dimension) [142,143], which are key components in spatially explicit models to simulate vegetation biomass or net primary productivity at large spatial scales (>5 km2) [144,145]. For instance, in addition to S. alterniflora, S. patens and S. lancifolia, which are the most frequently studied species (Table S2), other species have been used as “characteristic” or “indicator” species to group vegetation types to model vegetation communities at the landscape level [32].
The classification of wetland communities into vegetation zones has substantially evolved since the initial scheme proposed by Chabreck [146], where four categories, namely, fresh, intermediate, brackish, and saline wetlands, were included. Visser et al. [69] further advanced the number of classes using field surveys of species’ presence/absence for two large basins (Barataria and Terrebonne Basins) at larger scales (e.g., airborne—helicopter) with simultaneous ground-truthing to enhance spatial coverage [69]. Furthermore, the swamp class was added to the marsh-dominated classification to differentiate the structural and productivity properties characteristic of forested wetlands. When comparing the listing of species in each of those categories with the number of biomass studies (either in field or greenhouse settings) registered from 1976 to 2015, it is apparent that the total number of AGB studies of key indicator species is extremely low, and in some cases no more than four studies per species have been completed (Figure 1) (e.g., Panicum virgatum, Sacciolepis striata, Spartina cynosuroides, Vigna luteola), or three (e.g., Eleocharis palustris, Eleocharis rostellata, Juncus roemerianis, Schoenoplectus americanus), two (Hydrocotyle umbellata), or one (Baccharis halimifolia, Bidens laevis, Morella cerifera, Paspalum distichum, Paspalum vaginatum, Phragmites communis). We listed the knowledge gaps for those species representing community associations of ecological importance; this listing could be used to evaluate the type of field/mesocosms studies needed to parametrize both existing mechanistic and statistical models (Supplemental Table S4).
Although previous classifications have recognized the functional interactions of salinity and hydrology as major environmental variables regulating species zonation and dominance, it was not until recently that spatially explicit information was incorporated to improve wetland classification schemes for coastal Louisiana wetlands. For example, Snedden and Steyer [70] identified nine plant communities using a combination of salinity and tidal amplitudes collected at 173 sites throughout coastal Louisiana in the period 2007–2008. This statistical modeling approach (e.g., clustering, detrended correspondence analysis, multinomial logistic regression, neural network) shows how robust field-based measurements of plant structural attributes (diversity, coverage) and hydroperiod (e.g., tidal amplitude, flood duration) can provide good estimates to characterize plant species assemblages along complex hydrological and stressor (e.g., salinity) gradients. Furthermore, this study shows the tremendous utility of long term acquired in situ environmental data, as presently collected by the Coastwide Reference Monitoring System (CRMS) program since 2006 (https://www.lacoast.gov/crms2/home.aspx), and with more consistent data acquisition since 2008 in 390 sites across Louisiana; this environmental network [29] is advancing the predictive capability of models to assess vegetation communities’ structural properties at a large scale in the near future (e.g., [71]).
Unfortunately, functional vegetation variables, such as biomass and productivity data sets, were not acquired at the same sampling intensity, periodicity, and spatial extent as other vegetation structural variables (e.g., dominance, height, species composition). Simultaneous measurements are needed to forecast the spatiotemporal changes in plant communities, not only under future hydrological changes, but also by the expected changes induced by the combination of subsidence and SLR affecting the duration and depth of inundation [25,147]. Most of the AGB values were obtained in field conditions for most of the species from 1979 to 2015, yet in very low frequencies (n = 2). Recently, Stagg et al. [148] sampled 24 sites that included fresh, intermediate, brackish, and saline wetland across two coastal Louisiana hydrologic basins (Terrebonne, Barataria; Figure 1). This study indicated that BGP was substantially higher than aboveground production across a salinity gradient and that belowground production was more sensitive to stressors, indicating that belowground production could potentially be used as an indicator of ecosystem health. After ~40 year of studies assessing both in situ wetland productivity and biomass across coastal Louisiana, this was the first study to measure both above- and belowground production simultaneously at the landscape level. Similar studies assessing the interaction of other stressors (e.g., hydrogen sulfide) and resources (e.g., nitrogen, phosphorus) with hydroperiod at different spatial scales are needed in the short term, given the current issues in forecasting the potential effectiveness and impact of freshwater diversion on halting wetland loss [149].
Because of the ecological importance of wetlands biomass and productivity in regulating a number of ESs (e.g., carbon and nitrogen cycling, fish habitat and food, storm surge reduction, wave attenuation, sediment trapping), the current approaches to incorporate these variables in vegetation models are based on both data collected in Louisiana coastal wetlands and information from other coastal systems in the US and other locations [32]. For example, Visser et al. [32] listed biomass values for 19 emergent vegetation types for coastal Louisiana during the development of a computer model simulating annual net change in vegetation composition (LAVegMod), where values assigned for 10 of those types were obtained from other locations (e.g., needlerush: Florida, USA; paspalum: Spain; bullwhip; Argentina). The assignation of values from other locations is a good approximation not only to evaluate allometric relationships among species and vegetation types (e.g., height versus biomass) to obtain robust general models, but also to obtain first-rate estimates to advance the validation of spatially explicit models. The current probabilistic models proposed by Snedden and Steyer [70] and the LAVeg Model [32] represent examples of this incremental development in vegetation models that explicitly incorporate in situ measurements that reflect local and regional ecological processes and environmental variable interactions (e.g., salinity, tidal amplitude, percentage of time flooded) that are relevant to management decisions in coastal Louisiana. More recently, Snedden [71] used artificial neural networks to evaluate marsh vegetation assemblages across coastal Louisiana and found that this approach was comparable to statistics-based classification schemes. Given the dominance of spatially skewed vegetation and outliers, this approach could potentially be linked to high-resolution spatial information to delineate zonation and functional attributes, such as biomass and productivity.

3.4. Basin-Level Vegetation Data Availability and Human Impacts

One of the major drivers contributing to the reduction in wetland area is the extensive coverage of oil and gas infrastructure throughout coastal Louisiana [150,151,152]. The pipeline network is extensive and covers a substantial portion of coastal wetlands, particularly in the Mississippi, Barataria, and Terrebonne Basins, where most of the wetland biomass studies have been performed [57] (Figure 2B). Moreover, there is a contrast in the number of studies and ecological data in both coastal plains, with the lowest number of studies observed in the Chenier Plain (n = 15; Figure 1; Sabine Basin, Calcasieu, Mermentau, Vermillio-Teche) during the selected period (1976–2015). Although the specific contribution of oil and gas infrastructure to net wetland loss in Louisiana has been under discussion and litigation over the last three decades [63,153,154], it is acknowledged that this industry has contributed to wetland fragmentation, subsidence, and erosion at large spatial scales [155,156]. Figure 2 shows the current spatial pipelines coverage and location of natural gas infrastructure (terminals, storage, processing), refineries, and electric generators [57]. Due to flooding risks and transportation logistics, most of the facilitates (e.g., refineries) are found inland, with some exceptions (e.g., natural gas processing plants, electric generators). Although there have been a number of studies assessing area loss in the delta plain [157,158,159,160], there is a lack of studies directly evaluating the impact of pipelines on spatiotemporal changes in net primary productivity and wetland community structure (e.g., species succession) in both coastal regions, especially under climate change and increasing sea level rise [58].
In addition to the environmental impacts of oil/gas infrastructure, there is also the risk of oil spills, which can have long term negative effects on ecosystems, health, and sustainability from the open ocean to coastal wetlands [161,162]. Given the ecological, economic, and social impacts of this spill, there is an increasing interest in systematically assessing the oil and gas industry impact in the long term (decadal) [151,154,163], not only in the coastal ocean, but also in coastal and inland wetlands, where damage is cumulative and observed over long periods after impact [156,162,164]. However, there is still a need to develop a research initiative to document and assess long-term changes in wetland functional attributes and economic impact as a result of the sustaining effect of oil and gas extraction based on future energy demands, not only in coastal Louisiana, but also along other states in the Gulf of Mexico [58,161].
In this context, the freshwater diversions currently planned and partially constructed (e.g., mid-Barataria Bay) along the Mississippi River [25,165] to restore wetland area also represent a unique opportunity to deploy long term (decadal) permanent plots explicitly established for ecological model calibrations to assess both biomass and productivity measurements. Indeed, a comprehensive, comparative, and simultaneous sampling study across these sites (seasonal, annual), particularly for plant productivity assessments, is warranted. Of critical importance is the inclusion of the Chenier Plain, where AGB and BGB studies are historically scarce, despite the higher vulnerability of this coastal regions to relative sea-level rise [39,166] than the deltaic plain (Figure 1). Additionally, the complementary use of a local/regional network of monitoring stations, such as the CRMS [29,70,148] and the use of high-resolution remote sensing tools [26,167], is urgently needed. This will accelerate our assessment and understanding of the utility and effectiveness of current and future freshwater and sediment diversion structures across coastal Louisiana, which aim to reduce wetland loss in the context of the Louisiana Coastal Master Plan (2017) in the next 50 years [165].

4. Conclusions

Our analysis of the number and spatial extent of published data on wetland biomass and productivity information (magnitude, range, and spatial variability) in coastal Louisiana during the last four decades (1976–2015) focused on data availability acquired in field studies originally designed to obtain in situ data for comparative purposes among sites and species. We identified a low number of belowground (biomass and primary productivity) studies for most of the wetland species, including those scoring the larger number of aboveground studies during the last four decades (1976–2015). Our analyses also showed that since the early 2000s, studies estimating belowground biomass (BGB) have increased, although in a limited number of locations. A comprehensive, long-term systematic effort is urgently needed to increase the number of paired BGB and productivity studies across different basins under different hydrological conditions and management regimes. Priority study sites should include those undergoing freshwater diversion (e.g., Davis Pond–Barataria Bay, Caernarvon–Breton Sound) and areas under different levels of wetland deterioration (Mississippi River Delta) and formation (Wax Lake and Atchafalaya Deltas). The urgency in projecting future changes in vegetation communities as a result of current and future freshwater and sediment diversions is in contrast to the current availability of field data (biomass and productivity) and information (e.g., eco-physiological constraints) on plant population and community dynamics and associated productivity spatiotemporal patterns. We underscored the knowledge gaps to select research priorities for both field and greenhouse/mesocosm studies to expand data sets to advance not only vegetation models calibration and validation, but also our understanding of plant biomass and net primary productivity spatiotemporal successional trends for most of the species that belong to freshwater, intermediate, brackish, and saline wetlands in coastal Louisiana. This comprehensive sampling will accelerate our assessment and understanding of the utility and effectiveness of current and future freshwater and sediment diversion structures across coastal Louisiana, which aim to reduce wetland loss in the context of the Louisiana Coastal Master Plan (2017) in the next 50 years.

Supplementary Materials

The following are available online at https://www.mdpi.com/2073-4441/11/10/2054/s1.

Author Contributions

Conceptualization, V.H.R.-M., C.E., S.N., E.M., H.W., X.M., Z.X. and F.J.; Methodology, V.H.R.-M., C.E., Z.X., C.E.S., J.M.V., and H.W.; Formal analysis, V.H.R.-M., C.E., X.Z., S.N., J.M.V.; Investigation, V.H.R.-M., C.E., E.M., E.W.; Resources, C.E., X.Z., H.W., X.M., Z.X., F.J; Data curation, C.E., X.Z., C.E.S., J.M.V.; Writing—original draft preparation, all co-authors.; Writing—review and editing, V.H.R.-M., C.E.S., J.M.V., C.E., H.W., F.J.; Visualization, C.E., S.N., X.Z.; Supervision, V.H.R.-M.; Project administration, V.H.R.-M., S.N.; Funding acquisition, V.H.R.-M.

Funding

This work was supported by the National Science Foundation (NSF)-Coupled Natural and Human Systems program under Grant No. DCNH 1212112. CE participation was supported by a Louisiana-Sea Grant-NOAA Coastal Science Assistantship. Partial support to VHRM was also provided by the Department of the Interior South-Central Climate Adaptation Science Center (Cooperative Agreement Grant#G12AC00002), the NOAA-Sea Grant Program- Louisiana (Grant 2013R/E-24), the NSF-Coupled Natural and Human Systems program under Grant No. DCNH 1518471and NASA-EPSCoR (Grant # GR-00002922).

Acknowledgments

We thank all the researchers who have performed wetland productivity studies in coastal Louisiana over the years; their effort, commitment, and findings have contributed to advance our understanding of the complex interactions between natural and human impacts on coastal wetland productivity and sustainability, not only in coastal Louisiana, but in other locations around the world. Any use of trade, firm, or product names is for descriptive purposes only and does not imply endorsement by the U.S. Government. Comments and suggestions by Brady Couvillion (USGS) and two anonymous reviewers greatly improved the scope and content of the paper.

Conflicts of Interest

The authors declare no conflict of interest.

References

  1. Davidson, N.C. How much wetland has the world lost? Long-term and recent trends in global wetland area. Mar. Freshw. Res. 2014, 65, 934–941. [Google Scholar] [CrossRef]
  2. Church, J.A.; White, N.J. A 20th century acceleration in global sea-level rise. Geophys. Res. Lett. 2006, 33. [Google Scholar] [CrossRef]
  3. Nicholls, R.J. Coastal flooding and wetland loss in the 21st century: Changes under the SRES climate and socio-economic scenarios. Glob. Environ. Chang. 2004, 14, 69–86. [Google Scholar] [CrossRef]
  4. Hu, S.; Niu, Z.; Chen, Y.; Li, L.; Zhang, H. Global wetlands: Potential distribution, wetland loss, and status. Sci. Total Environ. 2017, 586, 319–327. [Google Scholar] [CrossRef] [PubMed]
  5. Coleman, J.M.; Huh, O.K.; Braud, D., Jr. Wetland loss in world deltas. J. Coast. Res. 2008, 24, 1–14. [Google Scholar] [CrossRef]
  6. Day, J.W.; Barras, J.; Clairain, E.; Johnston, J.; Justic, D.; Kemp, G.P.; Ko, J.-Y.; Lane, R.; Mitsch, W.J.; Steyer, G.; et al. Implications of global climatic change and energy cost and availability for the restoration of the Mississippi delta. Ecol. Eng. 2005, 24, 253–265. [Google Scholar] [CrossRef]
  7. Williams, S.J.; Stone, G.W.; Burruss, A.E. A perspective on the Louisiana wetland loss and coastal erosion problem. J. Coast. Res. 1997, 13, 593–594. [Google Scholar]
  8. Barbier, E.B.; Georgiou, I.Y.; Enchelmeyer, B.; Reed, D.J. The Value of Wetlands in Protecting Southeast Louisiana from Hurricane Storm Surges. PLoS ONE 2013, 8, e58715. [Google Scholar] [CrossRef]
  9. LCWCRTF. Louisiana coastal wetlands restoration plan. In Coastal Wetlands Planning Protection and Restoration Act; US Army Corps of Enginners: New Orleans, LA, USA, 1993. [Google Scholar]
  10. Couvillion, B.R.; Beck, H.; Schoolmaster, D.; Fischer, M. Land Area Change in Coastal Louisiana 1932 to 2016; U.S. Geological Survey Reston: Reston, VA, USA, 2017; p. 16.
  11. Meckel, T.A.; Brink, U.S.T.; Williams, S.J. Current subsidence rates due to compaction of Holocene sediments in southern Louisiana. Geophys. Res. Lett. 2006, 33. [Google Scholar] [CrossRef]
  12. Mitsch, W.J.; Day, J.W. Restoration of wetlands in the Mississippi–Ohio–Missouri (MOM) River Basin: Experience and needed research. Ecol. Eng. 2006, 26, 55–69. [Google Scholar] [CrossRef]
  13. Peyronnin, N.; Green, M.; Richards, C.P.; Owens, A.; Reed, D.; Chamberlain, J.; Groves, D.G.; Rhinehart, W.K.; Belhadjali, K. Louisiana’s 2012 coastal master plan: Overview of a science-based and publicly informed decision-making process. J. Coast. Res. 2013, 1–15. [Google Scholar] [CrossRef]
  14. Evers, D.E.; Gosselink, J.G.; Sasser, C.E.; Hill, J.M. Wetland loss dynamics in southwestern Barataria basin, Louisiana (USA), 1945–1985. Wetl. Ecol. Manag. 1992, 2, 103–118. [Google Scholar] [CrossRef]
  15. Stone, G.W.; Grymes, J.M.; Dingler, J.R.; Pepper, D.A. Overview and significance of hurricanes on the Louisiana coast, USA. J. Coast. Res. 1997, 13, 656–669. [Google Scholar]
  16. McFalls, T.B.; Keddy, P.A.; Campbell, D.; Shaffer, G. Hurricanes, Floods, Levees, and Nutria: Vegetation Responses to Interacting Disturbance and Fertility Regimes with Implications for Coastal Wetland Restoration. J. Coast. Res. 2010, 265, 901–911. [Google Scholar] [CrossRef]
  17. Day, J.W.; Boesch, D.F.; Clairain, E.J.; Kemp, G.P.; Laska, S.B.; Mitsch, W.J.; Orth, K.; Mashriqui, H.; Reed, D.J.; Shabman, L.; et al. Restoration of the Mississippi Delta: Lessons from Hurricanes Katrina and Rita. Science 2007, 315, 1679–1684. [Google Scholar] [CrossRef] [Green Version]
  18. Liu, K.B.; Li, C.; Bianchette, T.A.; McCloskey, T.A.; Yao, Q.; Weeks, E. Storm deposition in a coastal backbarrier lake in Louisiana caused by hurricanes Gustav and Ike. J. Coast. Res. 2011, SI64, 1866–1870. [Google Scholar]
  19. Bianchette, T.A.; Liu, K.B.; Qiang, Y.; Lam, N.S.N. Wetland accretion rates along coastal Louisiana: Spatial and temporal variability in light of hurricane Isaac’s impacts. Water 2016, 8, 1. [Google Scholar] [CrossRef]
  20. Martin, J.F.; White, M.L.; Reyes, E.; Kemp, G.P.; Mashriqui, H.; Day, J.W. Evaluation of coastal management plans with a spatial model: Mississippi delta, Louisiana, USA. Environ. Manag. 2000, 26, 117–129. [Google Scholar] [CrossRef]
  21. Reyes, E.; White, M.L.; Martin, J.F.; Kemp, G.P.; Day, J.W.; Aravamuthan, V. Landscape modeling of coastal habitat change in the mississippi delta. Ecology 2000, 81, 2331–2349. [Google Scholar] [CrossRef]
  22. Reyes, E.; Georgiou, I.; Reed, D.; McCorquodale, A. Using models to evaluate the effects of barrier islands on estuarine hydrodynamics and habitats: A numerical experiment. J. Coast. Res. 2005, SI44, 176–185. [Google Scholar]
  23. Reyes, E.; Day, J.W.; White, M.L.; Yáñez-Arancibia, A. Ecological and resource management information transfer for Laguna de Terminos, Mexico: A computerized interface. Coast. Manag. 1993, 21, 37–51. [Google Scholar] [CrossRef]
  24. Habib, E.; Nuttle, W.K.; Rivera-Monroy, V.H.; Gautam, S.; Wang, J.; Meselhe, E.; Twilley, R.R. Assessing Effects of Data Limitations on Salinity Forecasting in Barataria Basin, Louisiana, with a Bayesian Analysis. J. Coast. Res. 2007, 233, 749–763. [Google Scholar] [CrossRef]
  25. Wang, H.; Steyer, G.D.; Couvillion, B.R.; Rybczyk, J.M.; Beck, H.J.; Sleavin, W.J.; Meselhe, E.A.; Allison, M.A.; Boustany, R.G.; Fischenich, C.J.; et al. Forecasting landscape effects of Mississippi River diversions on elevation and accretion in Louisiana deltaic wetlands under future environmental uncertainty scenarios. Estuar. Coast. Shelf Sci. 2014, 138, 57–68. [Google Scholar] [CrossRef]
  26. Meselhe, E.; McCorquodale, J.A.; Shelden, J.; Dortch, M.; Brown, T.S.; Elkan, P.; Rodrigue, M.D.; Schindler, J.K.; Wang, Z. Ecohydrology component of Louisiana’s 2012 coastal master plan: Mass-balance compartment model. J. Coast. Res. 2013, 67, 16–28. [Google Scholar] [CrossRef]
  27. Allison, M.A.; Meselhe, E.A. The use of large water and sediment diversions in the lower Mississippi River (Louisiana) for coastal restoration. J. Hydrol. 2010, 387, 346–360. [Google Scholar] [CrossRef]
  28. Twilley, R.R.; Couvillion, B.R.; Hossain, I.; Kaiser, C.; Owens, M.S.; Steyer, G.; Visser, J. Coastal Louisiana ecosystem assessment and restoration program: The role of ecosystem forecasting in evaluating restoration planning in the mississippi river deltaic plain. Trans. Am. Fish. Soc. 2008, 64, 29–46. [Google Scholar]
  29. Steyer, G.D.; Sasser, C.E.; Visser, J.M.; Swenson, E.M.; Nyman, J.A.; Raynie, R.C. A Proposed Coast-Wide Reference Monitoring System for Evaluating Wetland Restoration Trajectories in Louisiana. Coast. Monit. Through Partnersh. 2003, 81, 107–117. [Google Scholar]
  30. Morris, J.T.; Sundareshwar, P.V.; Nietch, C.T.; Kjerfve, B.; Cahoon, D.R. Responses of coastal wetlands to rising sea level. Ecology 2002, 83, 2869–2877. [Google Scholar] [CrossRef]
  31. Kirwan, M.L.; Guntenspergen, G.R. Influence of tidal range on the stability of coastal marshland. J. Geophys. Res. Space Phys. 2010, 115. [Google Scholar] [CrossRef]
  32. Visser, J.M.; Duke-Sylvester, S.M.; Carter, J.; Broussard, W.P. A computer model to forecast wetland vegetation changes resulting from restoration and protection in coastal Louisiana. J. Coast. Res. 2013, 67, 51–59. [Google Scholar] [CrossRef]
  33. Gough, L.; Grace, J.B.; Taylor, K.L. The Relationship between Species Richness and Community Biomass: The Importance of Environmental Variables. Oikos 1994, 70, 271–279. [Google Scholar] [CrossRef]
  34. Visser, J.M.; Duke-Sylvester, S.M. Lavegmod v2: Modeling coastal vegetation dynamics in response to proposed coastal restoration and protection projects in Louisiana, USA. Sustainability 2017, 9, 1625. [Google Scholar] [CrossRef]
  35. Fisher, R.; McDowell, N.; Purves, D.; Moorcroft, P.; Sitch, S.; Cox, P.; Huntingford, C.; Meir, P.; Woodward, F.I. Assessing uncertainties in a second-generation dynamic vegetation model caused by ecological scale limitations. New Phytol. 2010, 187, 666–681. [Google Scholar] [CrossRef] [PubMed] [Green Version]
  36. Habib, E.; Reed, D. Parametric uncertainty analysis of predictive models in Louisiana’s 2012 coastal master plan. J. Coast. Res. 2013, 67, 127–146. [Google Scholar] [CrossRef]
  37. Li, H.; Wu, B. Uncertainty analysis in ecological studies: An overview. In Scaling and Uncertainty Analysis in Ecology: Methods and Applications; Wu, J., Jones, K.B., Li, H., Loucks, O.L., Eds.; Springer: Dordrecht, The Netherlands, 2006; pp. 45–66. [Google Scholar]
  38. Liang, W.; Lam, N.S.-N.; Qin, X.; Ju, W. A Two-level Agent-Based Model for Hurricane Evacuation in New Orleans. J. Homel. Secur. Emerg. Manag. 2015, 12, 407–435. [Google Scholar] [CrossRef]
  39. Visser, J.M.; Sasser, C.E.; Linscombe, R.G.; Chabreck, R.H. Marsh Vegetation Types of the Chenier Plain, Louisiana, USA. Estuaries 2000, 23, 318–327. [Google Scholar] [CrossRef]
  40. Parrondo, R.T.; Gosselink, J.G.; Hopkinson, C.S. Effects of Salinity and Drainage on the Growth of Three Salt Marsh Grasses. Int. J. Plant. Sci. 1978, 139, 102–107. [Google Scholar] [CrossRef]
  41. Hester, M.W.; Mendelssohn, I.A.; McKee, K.L. Species and population variation to salinity stress in Panicum hemitomon, Spartina patens, and Spartina alterniflora: Morphological and physiological constraints. Environ. Exp. Bot. 2001, 46, 277–297. [Google Scholar] [CrossRef]
  42. Broome, S.W.; Mendelssohn, I.A.; McKee, K.L. Relative growth of Spartina patens (Ait.) Muhl. andScirpus olneyi gray occurring in a mixed stand as affected by salinity and flooding depth. Wetlands 1995, 15, 20–30. [Google Scholar] [CrossRef]
  43. La Peyre, M.K.G.; Grace, J.B.; Hahn, E.; Mendelssohn, I.A. The Importance of Competition in Regulating Plant Species Abundance along a Salinity Gradient. Ecology 2001, 82, 62–69. [Google Scholar] [CrossRef]
  44. Merino, J.H.; Huval, D.; Nyman, A.J. Implication of nutrient and salinity interaction on the productivity of spartina patens. Wetl. Ecol. Manag. 2010, 18, 111–117. [Google Scholar] [CrossRef]
  45. Howard, R.J.; Mendelssohn, I.A. Salinity as a constraint on growth of oligohaline marsh macrophytes. I. Species variation in stress tolerance. Am. J. Bot. 1999, 86, 785–794. [Google Scholar] [CrossRef] [PubMed]
  46. Howard, R.J.; Mendelssohn, I.A. Salinity as a constraint on growth of oligohaline marsh macrophytes. II. Salt pulses and recovery potential. Am. J. Bot. 1999, 86, 795–806. [Google Scholar] [CrossRef] [PubMed]
  47. Mayence, C.E.; Hester, M.W. Assessment of a Multi-Species Planting Approach for Restoring Thick-Mat Floating Marsh, Louisiana, U.S.A. Restor. Ecol. 2011, 19, 216–224. [Google Scholar] [CrossRef]
  48. Geho, E.M.; Campbell, D.; Keddy, P.A. Quantifying ecological filters: The relative impact of herbivory, neighbors, and sediment on an oligohaline marsh. Oikos 2007, 116, 1006–1016. [Google Scholar] [CrossRef]
  49. Mayence, C.E.; Hester, M.W. Growth and allocation by a keystone wetland plant, Panicum hemitomon, and implications for managing and rehabilitating coastal freshwater marshes, Louisiana, USA. Wetl. Ecol. Manag. 2010, 18, 149–163. [Google Scholar] [CrossRef]
  50. Jeng, H.; Hong, Y.-J. Assessment of a Natural Wetland for Use in Wastewater Remediation. Environ. Monit. Assess. 2005, 111, 113–131. [Google Scholar] [CrossRef]
  51. McKee, K.L.; Cherry, J.A. Hurricane Katrina sediment slowed elevation loss in subsiding brackish marshes of the Mississippi River delta. Wetlands 2009, 29, 2–15. [Google Scholar] [CrossRef]
  52. U.S. Energy Information Administration. Energy Information Administration: Maps: Layer Information for Interactive State Maps. Available online: https://www.eia.gov/maps/map_data/NaturalGas_ProcessingPlants_US_EIA.zip (accessed on 1 December 2017).
  53. U.S. Energy Information Administration. Maps: Layer Information for Interactive State Maps. Available online: https://www.eia.gov/maps/map_data/NaturalGas_UndergroundStorage_US_EIA.zip (accessed on 1 December 2017).
  54. U.S. Energy Information Administration. Maps: Layer Information for Interactive State Maps. Available online: https://www.eia.gov/maps/map_data/Petroleum_Refineries_US_EIA.zip (accessed on 1 December 2017).
  55. U.S. Energy Information Administration. Maps: Layer Information for Interactive State Maps. Available online: https://www.eia.gov/maps/map_data/PowerPlants_US_EIA.zip (accessed on 1 December 2017).
  56. LSU Center for Energy Studies. Mapsearch: Louisiana Natural Gas and Petroleum Pipelines Baton Rouge, 70803. 2013. Available online: https://www.lsu.edu/ces/energydata/index.php (accessed on 1 December 2017).
  57. Dismukes, D.E.; Narra, S. Identifying the vulnerabilities of working coasts supporting critical energy infrastructure. Water 2016, 8, 8. [Google Scholar] [CrossRef]
  58. Wiegman, A.R.; Day, J.W.; D’Elia, C.F.; Rutherford, J.S.; Morris, J.T.; Roy, E.D.; Lane, R.R.; Dismukes, D.E.; Snyder, B.F. Modeling impacts of sea-level rise, oil price, and management strategy on the costs of sustaining Mississippi delta marshes with hydraulic dredging. Sci. Total Environ. 2018, 618, 1547–1559. [Google Scholar] [CrossRef]
  59. Hopkinson, C.S.; Gosselink, J.G.; Parrando, R.T. Aboveground production of seven marsh plant species in coastal Louisiana. Ecology 1978, 59, 760–769. [Google Scholar] [CrossRef]
  60. Kirby, C.J.; Gosselink, J.G. Primary production in a Louisiana gulf coast spartina-alterniflora marsh. Ecology 1976, 57, 1052–1059. [Google Scholar] [CrossRef]
  61. Conner, W.H.; Day, J.W. Productivity and Composition of a Baldcypress-Water Tupelo Site and a Bottomland Hardwood Site in a Louisiana Swamp. Am. J. Bot. 1976, 63, 1354–1364. [Google Scholar] [CrossRef]
  62. Delaune, R.; Buresh, R.; Patrick, W. Relationship of soil properties to standing crop biomass of Spartina alterniflora in a Louisiana marsh. Estuar. Coast. Mar. Sci. 1979, 8, 477–487. [Google Scholar] [CrossRef]
  63. Rivera-Monroy, V.H.; Delaune, R.D.; Owens, A.B.; Visser, J.; White, J.R.; Twilley, R.R.; Hernandez-Trejo, H.; Benitez, J.A. Removal of physical materials from systems: Loss of space, area, and habitats. In Treatise on Estuarine and Coastal Science; Wolanski, E., McLusky, D.S., Eds.; Academic Press: Waltham, MA, USA, 2011; Volume 8, pp. 185–215. [Google Scholar]
  64. Blum, M.D.; Roberts, H.H. The Mississippi Delta Region: Past, Present, and Future. Annu. Rev. Earth Planet. Sci. 2012, 40, 655–683. [Google Scholar] [CrossRef]
  65. Bevington, A.E.; Twilley, R.R. Bevington Island Edge Morphodynamics along a Chronosequence in a Prograding Deltaic Floodplain Wetland. J. Coast. Res. 2018, 344, 806–817. [Google Scholar] [CrossRef]
  66. Hiatt, M.; Castañeda-Moya, E.; Twilley, R.; Hodges, B.R.; Passalacqua, P. Channel-Island Connectivity Affects Water Exposure Time Distributions in a Coastal River Delta. Water Resour. Res. 2018, 54, 2212–2232. [Google Scholar] [CrossRef]
  67. Blum, M.D.; Roberts, H.H. Drowning of the Mississippi Delta due to insufficient sediment supply and global sea-level rise. Nat. Geosci. 2009, 2, 488–491. [Google Scholar] [CrossRef]
  68. Morton, R.A.; Bernier, J.C.; Barras, J.A. Evidence of regional subsidence and associated interior wetland loss induced by hydrocarbon production, Gulf Coast region, USA. Environ. Earth Sci. 2006, 50, 261–274. [Google Scholar] [CrossRef]
  69. Visser, J.M.; Sasser, C.E.; Chabreck, R.H.; Linscombe, R.G. Marsh Vegetation Types of the Mississippi River Deltaic Plain. Estuaries 1998, 21, 818–828. [Google Scholar] [CrossRef]
  70. Snedden, G.A.; Steyer, G.D. Predictive occurrence models for coastal wetland plant communities: Delineating hydrologic response surfaces with multinomial logistic regression. Estuar. Coast. Shelf Sci. 2013, 118, 11–23. [Google Scholar] [CrossRef]
  71. Snedden, G.A. Patterning emergent marsh vegetation assemblages in coastal Louisiana, USA, with unsupervised artificial neural networks. Appl. Veg. Sci. 2019, 22, 213–229. [Google Scholar] [CrossRef]
  72. Mendelssohn, I.A.; McKee, K.L. Spartina Alterniflora Die-Back in Louisiana: Time-Course Investigation of Soil Waterlogging Effects. J. Ecol. 1988, 76, 509–521. [Google Scholar] [CrossRef]
  73. Ramsey, E.; Rangoonwala, A.; Chi, Z.; Jones, C.E.; Bannister, T. Marsh Dieback, loss, and recovery mapped with satellite optical, airborne polarimetric radar, and field data. Remote Sens. Environ. 2014, 152, 364–374. [Google Scholar] [CrossRef]
  74. Turner, R.E.; Swenson, E.M.; Milan, C.S.; Lee, J.M.; Oswald, T.A. Below-ground biomass in healthy and impaired salt marshes. Ecol. Res. 2004, 19, 29–35. [Google Scholar] [CrossRef]
  75. Mendelssohn, I.A.; Kuhn, N.L. Sediment subsidy: Effects on soil–plant responses in a rapidly submerging coastal salt marsh. Ecol. Eng. 2003, 21, 115–128. [Google Scholar] [CrossRef]
  76. La Peyre, M.K.; Gossman, B.; Piazza, B.P. Short- and long-term response of deteriorating brackish marshes and open-water ponds to sediment enhancement by thin-layer dredge disposal. Estuaries Coasts 2009, 32, 390–402. [Google Scholar] [CrossRef]
  77. Snedden, G.A.; Cretini, K.; Patton, B. Inundation and salinity impacts to above- and belowground productivity in Spartina patens and Spartina alterniflora in the Mississippi River deltaic plain: Implications for using river diversions as restoration tools. Ecol. Eng. 2015, 81, 133–139. [Google Scholar] [CrossRef]
  78. Tong, C.; Baustian, J.J.; Graham, S.A.; Mendelssohn, I.A. Salt marsh restoration with sediment-slurry application: Effects on benthic macroinvertebrates and associated soil–plant variables. Ecol. Eng. 2013, 51, 151–160. [Google Scholar] [CrossRef]
  79. Reed, D.J.; Cahoon, D.R. The relationship between marsh surface-topography, hydroperiod, and growth of spartina-alterniflora in a deteriorating Louisiana salt-marsh. J. Coast. Res. 1992, 8, 77–87. [Google Scholar]
  80. Darby, F.A.; Turner, R.E. Below- and aboveground spartina alterniflora production in a Louisiana salt marsh. Estuaries Coasts 2008, 31, 223–231. [Google Scholar] [CrossRef]
  81. White, D.A.; Weiss, T.E.; Trapani, J.M.; Thien, L.B. Productivity and decomposition of the dominant salt marsh plants in Louisiana. Ecology 1978, 59, 751–759. [Google Scholar] [CrossRef]
  82. Edwards, K.R.; Mills, K.P. Aboveground and belowground productivity of Spartina alterniflora (Smooth Cordgrass) in natural and created Louisiana salt marshes. Estuaries 2005, 28, 252–265. [Google Scholar] [CrossRef]
  83. Lin, Q.; Mendelssohn, I.A. Impacts and Recovery of the Deepwater Horizon Oil Spill on Vegetation Structure and Function of Coastal Salt Marshes in the Northern Gulf of Mexico. Environ. Sci. Technol. 2012, 46, 3737–3743. [Google Scholar] [CrossRef] [PubMed]
  84. Day, J.; Lane, R.; Moerschbaecher, M.; Delaune, R.; Mendelssohn, I.; Baustian, J.; Twilley, R. Vegetation and Soil Dynamics of a Louisiana Estuary Receiving Pulsed Mississippi River Water Following Hurricane Katrina. Chesap. Sci. 2013, 36, 665–682. [Google Scholar] [CrossRef]
  85. Kaswadji, R.F.; Gosselink, J.G.; Turner, R.E. Estimation of primary produdction using five different methods in a spartina alterniflora salt marsh. Wetl. Ecol. Manag. 1990, 1, 57–64. [Google Scholar] [CrossRef]
  86. Stagg, C.L.; Mendelssohn, I.A. Restoring Ecological Function to a Submerged Salt Marsh. Restor. Ecol. 2010, 18, 10–17. [Google Scholar] [CrossRef]
  87. McKee, K.L.; Rooth, J.E. Where temperate meets tropical: Multi-factorial effects of elevated CO2, nitrogen enrichment, and competition on a mangrove-salt marsh community. Glob. Chang. Biol. 2008, 14, 971–984. [Google Scholar] [CrossRef]
  88. Nyman, J.A.; Walters, R.J.; Delaune, R.D.; Patrick, W.H. Marsh vertical accretion via vegetative growth. Estuar. Coast. Shelf Sci. 2006, 69, 370–380. [Google Scholar] [CrossRef]
  89. Hopkinson, C.S.; Gosselink, J.G.; Parrondo, R.T. Production of Coastal Louisiana Marsh Plants Calculated from Phenometric Techniques. Ecology 1980, 61, 1091–1098. [Google Scholar] [CrossRef]
  90. Ewing, K.; McKee, K.; Mendelssohn, I.; Hester, M. A comparison of indicators of sublethal salinity stress in the salt marsh grass, Spartina patens (Ait.) Muhl. Aquat. Bot. 1995, 52, 59–74. [Google Scholar] [CrossRef]
  91. Pezeshki, S.; Delaune, R. Effects of soil Hypoxia and salinity on gas exchange and growth of Spartina patens. Mar. Ecol. Prog. Ser. 1993, 96, 75–81. [Google Scholar] [CrossRef]
  92. Graham, S.A.; Mendelssohn, I.A. Functional assessment of differential sediment slurry applications in a deteriorating brackish marsh. Ecol. Eng. 2013, 51, 264–274. [Google Scholar] [CrossRef]
  93. Taylor, K.L.; Grace, J.B. The effects of vertebrate herbivory on plant community structure in the coastal marshes of the Pearl River, Louisiana, USA. Wetlands 1995, 15, 68–73. [Google Scholar] [CrossRef]
  94. Johnson, L.A.; Foote, A. Vertebrate herbivory in managed coastal wetlands: A manipulative experiment. Aquat. Bot. 1997, 59, 17–32. [Google Scholar] [CrossRef]
  95. Gough, L.; Grace, J.B. Herbivore effects on plant species density at varying productivity levels. Ecology 1998, 79, 1586–1594. [Google Scholar] [CrossRef]
  96. Gabrey, S.W.; Afton, A.D. Plant Community Composition and Biomass in Gulf Coast Chenier Plain Marshes: Responses to Winter Burning and Structural Marsh Management. Environ. Manag. 2001, 27, 281–293. [Google Scholar] [CrossRef] [PubMed]
  97. Spalding, E.A.; Hester, M.W. Interactive effects of hydrology and salinity on oligohaline plant species productivity: Implications of relative sea-level rise. Chesap. Sci. 2007, 30, 214–225. [Google Scholar] [CrossRef]
  98. Cramer, G.W.; Day, J.W.; Conner, W.H. Productivity of Four Marsh Sites Surrounding Lake Pontchartrain, Louisiana. Am. Midl. Nat. 1981, 106, 65–72. [Google Scholar] [CrossRef]
  99. Slocum, M.G.; Mendelssohn, I.A. Effects of three stressors on vegetation in an oligohaline marsh. Freshw. Biol. 2008, 53, 1783–1796. [Google Scholar] [CrossRef]
  100. Webb, E.C.; Mendelssohn, I.A. Factors Affecting Vegetation Dieback of an Oligohaline Marsh in Coastal Louisiana: Field Manipulation of Salinity and Submergence. Am. J. Bot. 1996, 83, 1429–1434. [Google Scholar] [CrossRef]
  101. Nolfo-Clements, L.E. Habitat Selection by Nutria in a Freshwater Louisiana Marsh. Southeast. Nat. 2012, 11, 183–204. [Google Scholar] [CrossRef]
  102. Howard, R.J.; Mendelssohn, I.A. Structure and composition of oligohaline marsh plant communities exposed to salinity pulses. Aquat. Bot. 2000, 68, 143–164. [Google Scholar] [CrossRef]
  103. Lin, Q.; Mendelssohn, I.A. A comparative investigation of the effects of south Louisiana crude oil on the vegetation of fresh, brackish and salt marshes. Mar. Pollut. Bull. 1996, 32, 202–209. [Google Scholar] [CrossRef]
  104. Cahoon, D.R.; White, D.A.; Lynch, J.C. Sediment infilling and wetland formation dynamics in an active crevasse splay of the Mississippi River delta. Geomorphology 2011, 131, 57–68. [Google Scholar] [CrossRef]
  105. Graham, S.A.; Mendelssohn, I.A. Coastal wetland stability maintained through counterbalancing accretionary responses to chronic nutrient enrichment. Ecology 2014, 95, 3271–3283. [Google Scholar] [CrossRef]
  106. Brewer, J.S.; Grace, J.B. Plant community structure in an oligohaline tidal marsh. Vegetatio 1990, 90, 93–107. [Google Scholar] [CrossRef]
  107. Fuller, D.A.; Sasser, C.E.; Johnson, W.B.; Gosselink, J.G. The effects of herboviry on vegetation on islands in atchafalaya bay, Louisiana. Wetlands 1985, 4, 105–114. [Google Scholar] [CrossRef]
  108. White, D.A.; Simmons, M.J. Productivity of the marshes at the mouth of the Pearl River, Louisiana. Castanea 1988, 53, 215–224. [Google Scholar]
  109. Baldwin, A.H.; Mendelssohn, I.A. Response of two oligohaline marsh communities to lethal and nonlethal disturbance. Oecologia 1998, 116, 543–555. [Google Scholar] [CrossRef]
  110. Ford, M.A.; Grace, J.B. The interactive effects of fire and herbivory on a coastal marsh in Louisiana. Wetlands 1998, 18, 1–8. [Google Scholar] [CrossRef]
  111. Tobin, E.J.; Visser, J.M.; Peterson, J.K.; Leberg, P.L. Small-Mammal Occupancy in Freshwater Marshes of Mandalay National Wildlife Refuge, Louisiana. Southeast. Nat. 2014, 13, 463–474. [Google Scholar]
  112. Martin, S.B.; Shaffer, G.P. Sagittaria Biomass Partitioning Relative to Salinity, Hydrologic Regime, and Substrate Type: Implications for Plant Distribution Patterns in Coastal Louisiana, United States. J. Coast. Res. 2005, 211, 167–174. [Google Scholar] [CrossRef]
  113. Shaffer, G.P.; Day, J.W.; Hunter, R.G.; Lane, R.R.; Lundberg, C.J.; Wood, W.B.; Hillmann, E.R.; Day, J.N.; Strickland, E.; Kandalepas, D. System response, nutria herbivory, and vegetation recovery of a wetland receiving secondarily-treated effluent in coastal Louisiana. Ecol. Eng. 2015, 79, 120–131. [Google Scholar] [CrossRef]
  114. Sasser, C.E.; Visser, J.M.; Evers, D.E.; Gosselink, J.G. The role of environmental variables on interannual variation in species composition and biomass in a subtropical minerotrophic floating marsh. Can. J. Bot. 1995, 73, 413–424. [Google Scholar] [CrossRef]
  115. Evers, D.E.; Sasser, C.E.; Gosselink, J.G.; Fuller, D.A.; Visser, J.M. The Impact of Vertebrate Herbivores on Wetland Vegetation in Atchafalaya Bay, Louisiana. Estuaries 1998, 21, 1–13. [Google Scholar] [CrossRef]
  116. Carpenter, K.; Sasser, C.E.; Visser, J.M.; Delaune, R.D. Sediment input into a floating freshwater marsh: Effects on soil properties, buoyancy, and plant biomass. Wetlands 2007, 27, 1016–1024. [Google Scholar] [CrossRef]
  117. Visser, J.M.; Sasser, C.E. The effect of environmental factors on floating fresh marsh end-of-season biomass. Aquat. Bot. 2009, 91, 205–212. [Google Scholar] [CrossRef]
  118. Visser, J.M.; Sasser, C.E.; Cade, B.S. The effect of multiple stressors on salt marsh end-of-season biomass. Chesap. Sci. 2006, 29, 328–339. [Google Scholar] [CrossRef]
  119. Izdepski, C.W.; Day, J.W.; Sasser, C.E.; Fry, B. Early floating marsh establishment and growth dynamics in a nutrient amended wetland in the lower Mississippi delta. Wetlands 2009, 29, 1004–1013. [Google Scholar] [CrossRef]
  120. McKee, K.L.; Mendelssohn, I.A. Response of a freshwater marsh plant community to increased salinity and increased water level. Aquat. Bot. 1989, 34, 301–316. [Google Scholar] [CrossRef]
  121. Swarzenski, C.M.; Doyle, T.W.; Fry, B.; Hargis, T.G. Biogeochemical response of organic-rich freshwater marshes in the Louisiana delta plain to chronic river water influx. Biogeochemistry 2008, 90, 49–63. [Google Scholar] [CrossRef]
  122. Willis, J.M.; Hester, M.W. Interactive effects of salinity, flooding, and soil type on Panicum hemitomon. Wetlands 2004, 24, 43–50. [Google Scholar] [CrossRef]
  123. Visser, J.M.; Peterson, J.K. The Effects of Flooding Duration and Salinity on Three Common Upper Estuary Plants. Wetlands 2015, 35, 625–631. [Google Scholar] [CrossRef]
  124. Roberts, H.H.; Delaune, R.D.; White, J.R.; Li, C.; Sasser, C.E.; Braud, D.; Weeks, E.; Khalil, S. Floods and Cold Front Passages: Impacts on Coastal Marshes in a River Diversion Setting (Wax Lake Delta Area, Louisiana). J. Coast. Res. 2015, 315, 1057–1068. [Google Scholar] [CrossRef]
  125. Holm, G.O.; Sasser, C.E. The management and ecology of the wetland grass, maidencane. J. Aquat. Plant Manag. 2008, 46, 51–60. [Google Scholar]
  126. Howard, R.J.; Rafferty, P.S. Clonal variation in response to salinity and flooding stress in four marsh macrophytes of the northern gulf of Mexico, USA. Environ. Exp. Bot. 2006, 56, 301–313. [Google Scholar] [CrossRef]
  127. Howard, R.J. Intraspecific variation in growth of marsh macrophytes in response to salinity and soil type: Implications for wetland restoration. Estuaries Coasts 2010, 33, 127–138. [Google Scholar] [CrossRef]
  128. Julien, M.H.; Skarratt, B.; Maywald, G.F. Potential geographical-distribution of alligator weed and its biological-control by agasicles hygrophila. J. Aquat. Plant Manag. 1995, 33, 55–60. [Google Scholar]
  129. Baldwin, A.H.; Mendelssohn, I.A. Effects of salinity and water level on coastal marshes: An experimental test of disturbance as a catalyst for vegetation change. Aquat. Bot. 1998, 61, 255–268. [Google Scholar] [CrossRef]
  130. Baustian, J.; Mendelssohn, I.; Lin, Q.; Rapp, J. In Situ Burning Restores the Ecological Function and Structure of an Oil-Impacted Coastal Marsh. Environ. Manag. 2010, 46, 781–789. [Google Scholar] [CrossRef] [PubMed]
  131. Gough, L.; Grace, J.B. Effects of flooding, salinity and herbivory on coastal plant communities, Louisiana, United States. Oecologia 1998, 117, 527–535. [Google Scholar] [CrossRef] [PubMed]
  132. Visser, J.M.; Steyer, G.D.; Shaffer, G.P.; Höppner, S.S.; Hester, M.W.; Reyes, E.; Keddy, P.; Mendelssohn, I.A.; Sasser, C.E.; Swarzenski, C. Habitat Switching Module, Chapter 9; Universtity of Louisiana at Lafayette: Baton Rouge, LA, USA, 2003; p. 319. [Google Scholar]
  133. Allen, J.A.; Chambers, J.L.; McKinney, D. Intraspecific variation in the response of Taxodium distichum seedlings to salinity. For. Ecol. Manag. 1994, 70, 203–214. [Google Scholar] [CrossRef]
  134. Conner, W.H.; Duberstein, J.A.; Day, J.W.; Hutchinson, S. Impacts of Changing Hydrology and Hurricanes on Forest Structure and Growth Along a Flooding/Elevation Gradient in a South Louisiana Forested Wetland from 1986 to 2009. Wetlands 2014, 34, 803–814. [Google Scholar] [CrossRef]
  135. Day, J.W.; Westphal, A.; Pratt, R.; Hyfield, E.; Rybczyk, J.; Kemp, G.P.; Day, J.N.; Marx, B. Effects of long-term municipal effluent discharge on the nutrient dynamics, productivity, and benthic community structure of a tidal freshwater forested wetland in Louisiana. Ecol. Eng. 2006, 27, 242–257. [Google Scholar] [CrossRef]
  136. Day, J.; Ko, J.-Y.; Rybczyk, J.; Sabins, D.; Bean, R.; Berthelot, G.; Brantley, C.; Cardoch, L.; Conner, W.; Day, J.; et al. The use of wetlands in the Mississippi Delta for wastewater assimilation: A review. Ocean. Coast. Manag. 2004, 47, 671–691. [Google Scholar] [CrossRef]
  137. Conner, W.H.; Day, J.W.; Slater, W.R. Bottomland hardwood productivity: Case study in a rapidly subsiding, Louisiana, USA, watershed. Wetl. Ecol. Manag. 1993, 2, 189–197. [Google Scholar] [CrossRef]
  138. Brantley, C.G.; Day, J.W.; Lane, R.R.; Hyfield, E.; Day, J.N.; Ko, J.-Y. Primary production, nutrient dynamics, and accretion of a coastal freshwater forested wetland assimilation system in Louisiana. Ecol. Eng. 2008, 34, 7–22. [Google Scholar] [CrossRef]
  139. Hunter, R.G.; Day, J.W.; Lane, R.R.; Lindsey, J.; Day, J.N.; Hunter, M.G. Impacts of secondarily treated municipal effluent on a freshwater forested wetland after 60 years of discharge. Wetlands 2009, 29, 363–371. [Google Scholar] [CrossRef]
  140. Conner, W.H.; Gosselink, J.G.; Parrondo, R.T. Comparison of the vegetation of three Louisiana swamp sites with different flooding regimes. Am. J. Bot. 1981, 68, 320–331. [Google Scholar] [CrossRef]
  141. Conner, W.H.; Day, J.W. Water Level Variability and Litterfall Productivity of Forested Freshwater Wetlands in Louisiana. Am. Midl. Nat. 1992, 128, 237–245. [Google Scholar] [CrossRef]
  142. DeAngelis, D.L.; Mooij, W.M. Individual-Based Modeling of Ecological and Evolutionary Processes. Annu. Rev. Ecol. Evol. Syst. 2005, 36, 147–168. [Google Scholar] [CrossRef]
  143. Grimm, V.; Railsback, S.F. Individual-Based Modeling and Ecology; Princeton Universtiy Press: Princenton, NJ, USA, 2005. [Google Scholar]
  144. Crookston, N.L.; Dixon, G.E. The forest vegetation simulator: A review of its structure, content, and applications. Comput. Electron. Agric. 2005, 49, 60–80. [Google Scholar] [CrossRef]
  145. Kirwan, M.L.; Murray, A.B. A coupled geomorphic and ecological model of tidal marsh evolution. Proc. Natl. Acad. Sci. USA 2007, 104, 6118–6122. [Google Scholar] [CrossRef] [PubMed] [Green Version]
  146. Chabreck, R.H. Marsh Zones and Vegetative Types in the Louisiana Coastal Marshes. Ph.D. Thesis, Louisiana State University, Baton Rouge, LA, USA, May 1970. [Google Scholar]
  147. Allison, M.A.; Ramirez, M.T.; Meselhe, E.A. Diversion of Mississippi River Water Downstream of New Orleans, Louisiana, USA to Maximize Sediment Capture and Ameliorate Coastal Land Loss. Water Resour. Manag. 2014, 28, 4113–4126. [Google Scholar] [CrossRef]
  148. Stagg, C.L.; Schoolmaster, D.R.; Piazza, S.C.; Snedden, G.; Steyer, G.D.; Fischenich, C.J.; McComas, R.W. A landscape-scale assessment of above- and belowground primary production in coastal wetlands: Implications for climate change-induced community shifts. Estuaries Coasts 2017, 40, 856–879. [Google Scholar] [CrossRef]
  149. Wang, H.Q.; Steyer, G.D.; Couvillion, B.R.; Beck, H.J.; Rybczyk, J.M.; Rivera-Monroy, V.H.; Krauss, K.W.; Visser, J.M. Predicting landscape effects of mississippi river diversions on soil organic carbon sequestration. Ecosphere 2018, 8. [Google Scholar] [CrossRef]
  150. Turner, R.E. Wetland Loss in the Northern Gulf of Mexico: Multiple Working Hypotheses. Estuaries 1997, 20, 1–13. [Google Scholar] [CrossRef]
  151. Safford, T.G.; Ulrich, J.D.; Hamilton, L.C. Public perceptions of the response to the Deepwater Horizon oil spill: Personal experiences, information sources, and social context. J. Environ. Manag. 2012, 113, 31–39. [Google Scholar] [CrossRef]
  152. Scaife, W.W.; Turner, R.E.; Costanza, R. Coastal Louisiana recent land loss and canal impacts. Environ. Manag. 1983, 7, 433–442. [Google Scholar] [CrossRef]
  153. McClenachan, G.; Tweel, A.W.; Turner, R.E. Effects of oil on the rate and trajectory of Louisiana marsh shoreline erosion. Environ. Res. Lett. 2013, 8, 044030. [Google Scholar] [CrossRef] [Green Version]
  154. Perrons, R.K. Assessing the damage caused by Deepwater Horizon: Not just another Exxon Valdez. Mar. Pollut. Bull. 2013, 71, 20–22. [Google Scholar] [CrossRef] [PubMed]
  155. Ko, J.-Y.; Day, J.W. A review of ecological impacts of oil and gas development on coastal ecosystems in the Mississippi Delta. Ocean. Coast. Manag. 2004, 47, 597–623. [Google Scholar] [CrossRef]
  156. Turner, R.E.; McClenachan, G.; Tweel, A.W. Islands in the oil: Quantifying salt marsh shoreline erosion after the Deepwater Horizon oiling. Mar. Pollut. Bull. 2016, 110, 316–323. [Google Scholar] [CrossRef]
  157. Couvillion, B.R.; Barras, J.A.; Steyer, G.D.; Sleavin, W.; Fischer, M.; Beck, H.; Trahan, N.; Griffin, B.; Heckman, D. Land Area Change in Coastal Louisiana from 1932 to 2010; U.S. Geological Survey: Reston, VA, USA, 2011; p. 12.
  158. Visser, J.M.; Sasser, C.E.; Chabreck, R.H.; Linscombe, R.G. Long-term vegetation change in Louisiana tidal marshes, 1968–1992. Wetlands 1999, 19, 168–175. [Google Scholar] [CrossRef]
  159. Barras, J.A.; Beville, S.; Britsch, D.; Hartley, S.; Hawes, S.; Johnston, J.; Kemp, P.; Kinler, Q.; Martucci, A.; Porthouse, J.; et al. Historical and Projected Coastal Louisiana Land Changes: 1978–2050; Usgs Open File Report 03-334; USGS: Baton Rouge, MS, USA, 2003.
  160. Britsch, L.D.; Dunbar, J.B. Land loss rates-Louisiana coastal plain. J. Coast. Res. 1993, 9, 324–338. [Google Scholar]
  161. Beyer, J.; Trannum, H.C.; Bakke, T.; Hodson, P.V.; Collier, T.K. Environmental effects of the Deepwater Horizon oil spill: A review. Mar. Pollut. Bull. 2016, 110, 28–51. [Google Scholar] [CrossRef] [Green Version]
  162. Mendelssohn, I.A.; Andersen, G.L.; Baltz, D.M.; Caffey, R.H.; Carman, K.R.; Fleeger, J.W.; Joye, S.B.; Lin, Q.; Maltby, E.; Overton, E.B.; et al. Oil Impacts on Coastal Wetlands: Implications for the Mississippi River Delta Ecosystem after the Deepwater Horizon Oil Spill. Bioscience 2012, 62, 562–574. [Google Scholar] [CrossRef]
  163. Joye, S.B.; Bracco, A.; Özgökmen, T.M.; Chanton, J.P.; Grosell, M.; Macdonald, I.R.; Cordes, E.E.; Montoya, J.P.; Passow, U. The Gulf of Mexico ecosystem, six years after the Macondo oil well blowout. Deep. Sea Res. Part II Top. Stud. Oceanogr. 2016, 129, 4–19. [Google Scholar] [CrossRef]
  164. Hester, M.W.; Willis, J.M.; Rouhani, S.; Steinhoff, M.A.; Baker, M.C. Impacts of the Deepwater Horizon oil spill on the salt marsh vegetation of Louisiana. Environ. Pollut. 2016, 216, 361–370. [Google Scholar] [CrossRef] [Green Version]
  165. CPRA. Louisiana’s Comprehensive master Plan for a Sustainable Coast, June 2017. Available online: http://coastal.la.gov/our-plan/2017-coastal-master-plan/ (accessed on 29 September 2019).
  166. Jankowski, K.L.; Tornqvist, T.E.; Fernandes, A.M. Vulnerability of Louisiana’s coastal wetlands to present-day rates of relative sea-level rise. Nat. Commun. 2017, 8. [Google Scholar] [CrossRef] [PubMed]
  167. Klemas, V. Remote Sensing of Wetlands: Case Studies Comparing Practical Techniques. J. Coast. Res. 2011, 27, 418–427. [Google Scholar]
Figure 1. Location of wetland vegetation biomass and productivity studies in different basins in the Chenier and Delta Plains from 1976–2015 across coastal Louisiana. Inset table shows the number of studies per basin.
Water 11 02054 g001
Figure 2. Location of wetland vegetation biomass and productivity studies from 1976–2015 relative to (A) natural gas storage, refineries, natural gas processing plants, and electric generators, and (B) the crude oil and natural gas pipeline network. See material and methods section for base map information and source.
Water 11 02054 g002
Figure 3. Frequency distribution of wetland vegetation aboveground and belowground ecological studies per year during the period 1976–2015 in coastal Louisiana.
Water 11 02054 g003
Figure 4. Frequency distribution of ecological studies assessing aboveground vegetation biomass under differential experimental conditions (greenhouse, laboratory-mesocosm, mesocosm-field, and field settings).
Water 11 02054 g004
Figure 5. Frequency distribution of ecological studies assessing vegetation belowground biomass under different experimental conditions (greenhouse, laboratory-mesocosm, mesocosm-field, and field settings).
Water 11 02054 g005
Figure 6. Frequency distribution of ecological studies assessing above and belowground vegetation biomass per species. Wetland species listed inside the frame represent those species with only one (n = 1) aboveground study. Data encompass the period 1976–2015.
Water 11 02054 g006
Figure 7. Frequency distribution of ecological studies assessing above and belowground vegetation productivity per species. Data encompass the period 1976–2015.
Water 11 02054 g007

