Article

Impacts of Climate Change and Human Activities on Runoff Variation of the Intensive Phosphate Mined Huangbaihe River Basin, China

1
College of Hydraulic & Environmental Engineering, China Three Gorges University, Yichang 443002, China
2
Hubei Provincial Collaborative Innovation Center for Water Security, Wuhan 430070, China
3
Comprehensive Law Enforcement Bureau for Protection of Water Resources in the Huangbaihehe River Basin, Yichang, Hubei 443005, China
4
Institute of Groundwater and Earth Sciences, Jinan University, Guangzhou 510632, China
5
Department of Water resources, Faculty of Geo-Information Science and Earth Observation (ITC), University of Twente, Hengelosestraat 99, P.O. Box 217, 7500 AE Enschede, The Netherlands
*
Author to whom correspondence should be addressed.
Water 2019, 11(10), 2039; https://doi.org/10.3390/w11102039
Submission received: 25 August 2019 / Revised: 25 September 2019 / Accepted: 26 September 2019 / Published: 29 September 2019
(This article belongs to the Section Hydrology)

Abstract

:
Natural hydrological processes have been changed under the combined influences of climate change and intensive human activities in the Huangbaihe River Basin, where large-scale phosphate mining has been taking place. Therefore, evaluating the impact of climate change and intensive human activities on runoff variation and detecting the main driving factor leading to the variation are important for more efficient water resource management and more sustainable development of the regional economy. Despite numerous studies having been performed on this topic, little research focused on the impact of mining on runoff variation. The non-parametric Mann-Kendall (MK) trend test and accumulative anomaly methods were applied to identifying basic trends and change points of the hydro-meteorological elements over the period from 1978 to 2016. Then, the Soil Water and Assessment Tool (SWAT) and the Slope Changing Ratio of Accumulative Quantity (SCRAQ) were both used to quantify the contributions of climate change and anthropogenic activities on runoff variation. In this step, the runoff data were restored to their natural state before the construction of Xuanmiaoguan (XMG) dam. Due to the lack of locally observed evapotranspiration data, Global Land Evaporation Amsterdam Model and an empirical equation applied to obtain the evapotranspiration data. The results revealed that the change points are in 1985 and 2006. Therefore, the total period was divided into three periods, that is, the baseline period Ta (1978–1984), change period Tb (1985–2005) and change period Tc (2006–2016). Compared with the baseline period Ta, climate change dominates the runoff variation in the period Tb and is responsible for 60.5 and 74.4% of runoff variation, while human activities contribute the most to runoff variation for the period Tc (79.3 and 86.1%). Furthermore, an analysis of the underlying mechanism of underground phosphate mining indicates that mining can affect overland flow and baseflow simultaneously. This study can provide some information in determining the contributions of climate change and human activities in intensive phosphate mined basins and areas lack of evapotranspiration data.

1. Introduction

Climate change and anthropogenic activities are considered two major factors driving changes in hydrological processes; including precipitation; evapotranspiration; infiltration and runoff [1,2,3]. Human activities are considered an important factor driving changes in hydrological, ecological and geochemical processes around the world at different spatial scales and the impact of anthropogenic activities commonly consist of direct and indirect ones [2,3,4,5]. Direct impacts include water conservancy construction and operation [6], irrigation [7,8], underground mining activities [9] and other human modifications; while; the indirect influences are mainly through the changes of land cover [10], such as urbanization; industrialization; soil and water conservation and so on [11,12]. Underground mining activities can significantly affect hydrological cycles in a region where larger-scale and intensive underground mining activities exited. Since underground mining could alter the interactions between overland flow and groundwater; and the groundwater flow regime [13], such as quantity of groundwater resources (discharge and recharge) and groundwater level. Thus; an understanding of how underground mining affects the flow regime is critically needed to implement regional water resources conservation. As the main component of hydrological variables; runoff undergoes variation that is put down to the combined effects of direct human interactions; climate change and land use/cover change [8,10,14].
In recent years, quantifying the impacts of human interactions and climate change on variation of runoff has attracted widespread attention in hydrologic and climatic studies [6,12,15]. Previous research has indicated that anthropogenic activities and climate change have changed the water cycle in many catchments globally [16,17]. A number of approaches have been applied to evaluate the impacts of climate change and human interactions on runoff changes [14,18,19]. To analyze the individual impact of the two drivers in runoff, it is most important to identify the abrupt change point (time) of these influences. Consequently, there are enormous literatures focusing on the changes in runoff in different rivers throughout the world, which tries to identify the timing characteristics of these abrupt changes and then ascertain the influences of climate change and human interactions [20,21,22]. The hydrological modeling method and quantitative assessment method are the main approaches for determine the contributions of the two factors at basin scale [18].
In this study, the methods of Slope Changing Ratio of Accumulative Quantity (SCRAQ) [23] and SWAT model [10] were applied to investigate the individual influence of climate change and human interactions. SCRAQ is a quantitative assessment method, which can eliminate the noise and inter-annual fluctuations of the measured data to a great extent. The major advantage of the SWAT model is that it explicitly considers the impact of land use/land cover change on water yield and has been successfully applied in many catchments under a diverse range of climatic conditions across the globe. The trends and magnitude of the trends of hydro-meteorological data series were analyzed by using the Mann-Kendall (MK) trend test together with the Sen’s Slope method, which can show detailed changing trends and does not require the data to be normally distributed [8,24]. Accumulative anomaly method was used to accurately identify the change point of hydro-meteorological data series, which can avoid the defect of double mass curve of precipitation and runoff and multi-point change points by using the non-parametric MK detection [25].
The Huangbaihe River, a first-order tributary of the Yangtze River, is the primary drinking water source of Yichang city. The Huangbaihe River Basin is rich in phosphate rock resources, which has attracted multiple phosphate mine companies to build factories here. Extensive large-scale phosphate mining activities have changed the region’s geology and water environment. Some studies reported that the wet season runoff significantly declined after 2008, during the period from 1978 to 2014, in the up reach of Tianfumiao (TFM) dam [26] and deduced the phosphate mining activities driving the decline of the runoff. However, as far as we know, no study has quantified the relative contributions of climate change and anthropogenic activities to the variation in runoff in the Huangbaihe River Basin.
Therefore, the principal purposes of this paper are: (1) to analyze the trends of annual precipitation, evapotranspiration and runoff time series during the period of 1978–2016 using MK test method together with Sen’s slope detection; (2) to identify the change points via the accumulative anomaly method and separate the whole period into the baseline period and assessment periods; and (3) to quantitatively evaluate the impacts of anthropogenic activities and climate change on runoff variation based on the SWAT hydrological model and the SCRAQ method in the assessment periods in the Huangbaihe River Basin. This work would provide insights into the impact of phosphate mining activities to runoff variation and are helpful to water resources management.

2. Materials

2.1. Introduction of the Huangbaihe River Basin

The Huangbaihe River Basin (Figure 1) is in the Hubei province; the main river channel length is 162 km and the drainage area is 1923.5 km2. In this paper, the study area is upstream of the Tianfumiao dam, covering an area of 553.6 km2, which has experienced large-scale phosphate mining activities. This area has the typical continental monsoon climate. The mean annual precipitation is approximately 1005.9 mm from 1978 to 2016 (Table 1), of which approximately 60% is received during wet season (May–October). The mean annual temperature is 16.9 °C. There are four dams, namely, Xuanmiaoguan (hereafter referred to as XMG), Tianfumiao (TFM), Xibeikou (XBK) and Shangjiahe (SJH), which were constructed from upstream to downstream in 2005, 1978, 1991 and 1971, respectively.
In the Huangbaihe River Basin, abundant phosphate resources have been recognized and explored. The proven reserves are about 1.137 billion tons. Since the last ten years, mining activities have continuously intensified [27]. The phosphate mining areas are primarily distributed in the watershed of the middle and upper courses of the Huangbaihe River, such as the Yuantou, Dongjia, Xicha, Lilin, Shenlong and Shaiqi Rivers in the upper reach of TFM Reservoir.

2.2. Data

In this paper, a digital elevation model (DEM), soil map, land use/cover type map and hydro-meteorological time series are needed. In addition to the observed precipitation data, the other meteorological data were generated applying SWAT’s weather generator (WGEN). The data for constructing WGEN was obtained from National Centers for Atmospheric Prediction (NCEP) Climate Forecast System Reanalysis (CFSR). Weather stations w3231134 and w3261138 were included to calculate the statistical parameters of WGEN for the study basin (https://globalweather.tamu.edu/). The Digital Elevation Model (DEM) was obtained from Computer Network Information Center, Chinese Academy of Sciences (http://www.gscloud.cn/), with a spatial resolution of 90 m, which was applied to delineate the study basin and gain sub-basin, flow accumulation and flow direction. Land Cover/ Land Use Data map was extracted from datasets (1:100000 scale) for 1980, 2000 and 2008 provided by Resource and Environment Data Cloud Plat From, Institute of Geographic Sciences and Natural Resources Research of Chinese Academy of Sciences (CAS) (http://www.resdc.cn/). Soil map (1:1000000 scale) was selected from the Harmonized World Soil Database (HWSD) version 1.1 (http://westdc.westgis.ac.cn/data/tag/key/HWSD).
The evapotranspiration data was obtained from Global Land Evaporation Amsterdam model (GLEAM) (https://www.gleam.eu/), which was proved more accurate in China [28]. However, the data begins from the year 1980. Therefore, the evapotranspiration of other two years (1978 and 1979) were spanned using the correlation equation between precipitation and actual evapotranspiration.
Streamflow and precipitation time series at the TFM gauging station over a period of 39 years (1978 to 2016) were collected from the Huangbaihe Catchment Authority. Daily precipitation data is measured by a weather station, which is located at TFM dam site. The daily inflow data, water level data and outlet data of the TFM and XMG reservoirs were recorded after the construction of the dams. After the construction of the dams, the hydrological processes have been altered [29]. In this paper, the dam construction is not included here. In order to identify the effect of climate change and direct human interactions, a new runoff time series was calculated.
The inflows to the TFM reservoir have been altered due to the construction of the XMG reservoir. To eliminate the influence, the inflows into the TFM reservoir are restored to the original condition using the water balance equation. Therefore, the inflows into the TFM reservoir in their natural state are calculated by:
Q o T = Q i n T Q o u t X + Q i n X ,
where, Q o T and Q in T are the inflows at the natural condition and the observed inflows to the TFM reservoir, respectively. Q out X and Q in X are the observed outflow from and inflow to the XMG reservoir, respectively.

3. Methods

3.1. Trend Test and Change Point Analysis

3.1.1. Trend Test

The Mann-Kendall (MK) test [30] is a non-parametric method, which does not require the data to be normally distributed and can display the detailed trends over the study period. The method is widely applied to detect the monotonic trend in hydro-meteorological elements, such as runoff, precipitation, temperature and evapotranspiration [31,32,33]. The detailed expressions could be referred to Burn and Elnur (2002) [34] and Tabari et al. (2015) [35]. However, the assumption of this method is uncorrelated time series. Therefore, autocorrelation was examined using the autocorrelation and partial autocorrelation function for hydrological data series. If there is a serial correlation in data series, the method given by Yue et al. (2002) [36] and Hamed and Ramachandra Rao (1998) [37] can be applied to test the monotonic trend. In this study, there are no significant autocorrelation in hydrological elements.
The MK method is always used together with the Sen’s Slope method to estimate the magnitude of the trend., The Sen’s Slope method is established by Sen (1968) [38] and Hirsch et al. (1982) [39] and has been widely used in investigating the slope of the trend in many recent studies [40,41,42].

3.1.2. Change Points Analysis

Accumulative anomaly method is commonly applied to determine the change points of precipitation runoff and evapotranspiration data [12,25,43]. Since the runoff generation can be affected by evapotranspiration and precipitation, change points for a long period of these two hydro-meteorological components also affect the change points of streamflow data in the nature condition. In order to be more confident to select the more reasonable change points in the annual runoff time series, it is suggested that change points of annual precipitation and evapotranspiration data are to be assessed simultaneously [18].

3.2. Hydrological Model Simulation Method

We used the SWAT model to evaluate the effects of climate variation and anthropogenic activities on runoff variation. SWAT model is a watershed-scale, continuous time and semi-distributed hydrological model, which incorporates meteorological elements, soil characteristics, land cover/use to simulate the effects of land management practices on the hydrological processes [44]. In SWAT model, the whole basin is divided into a certain number of sub-basins, then each sub-basin is further separated into multiple hydrologic response units (HRUs), which is composed by homogenous soils properties, land cover and slopes. In each HRU, the hydrological processes are calculated by the water balance method. A detailed explanation about SWAT model are given in the SWAT theoretical documentation [45] and http://swatmodel.tamu.edu. In this study, we used the Soil Conservation Service curve number (SCS-CN) method to estimate surface runoff, kinematic storage routing to lateral flow, creating a shallow aquifer to return flow, Penman-Monteith to potential evapotranspiration and variable storage routing method to channel routing.
The sequential uncertainty fitting Version 2 (SUFI-2) algorithm [46], incorporated into SWAT Calibration Uncertainty Procedure (SWAT-CUP) program [47], was applied for parameter sensitivity, model calibration, validation and uncertainty analysis. The twenty-six parameters related to streamflow simulation were conduct for parameter sensitivity applying global sensitivity method. The sensitive parameters based on their sensitivity ranks are selected to calibrate the SWAT model.
Numerous evaluation criteria are available to determine the performance of hydrological models. Here, the performance of the SWAT model is determined by three widely-used statistical indicators, which are the Nash-Sutcliffe efficiency (NSE) [48], the root mean square error (RMSE)-observations standard deviation ratio (RSR) [49] and percent bias (PBIAS) [50], respectively. The three criteria are relative independent and have different interpretations for the differences between observations and simulations. The NSE measures the overall goodness of fit between the observations and simulations. The RMSE measures how concentrate the simulated data around the line of best fit and is directly interpretable in terms of measurement units. The PBIAS measures the water balance error between the total simulated and observed values over the entire modeling period, with the optimal value of zero. According to the performance criteria of Moriasi et al. [51], the monthly runoff simulation could be as satisfactory if NSE>0.5, RSR≤0.7 and PBIAS is within <±25% in the calibration and validation periods.

3.3. Evaluation of the Contribution of Climate Change and Human Activities to Runoff Variation

Both climate change and anthropogenic activities could alter the runoff in the study basin. The total difference (△Q) between the period of before and after the change point is attributed to the impacts of both climate change (△QC) and human activities (△QH).
Δ Q = Δ Q C + Δ Q H = O i O b ,
Δ Q H = R i O i ,
Δ Q C = Δ Q Δ Q H ,
where, Oi and Ob denote the observed mean annual runoff for the assessment periods and the baseline period (m3/s). Ri denotes the simulated annual runoff for the assessment periods (m3/s). Therefore, the contribution of human activities (CH) and climate change (CC) to total variation of runoff are defined as:
C H = | Δ Q H | | Δ Q H | + | Δ Q C | × 100 % ,
C C = | Δ Q C | | Δ Q H | + | Δ Q C | × 100 % ,

3.4. Slope Change Ratio of Accumulative Quantity Method

The SCRAQ method developed by Wang et al. (2012) [23] was applied to calculate the contribution rates of anthropogenic activities and climate factors on the variation of runoff. The contribution rate of precipitation (CP, unit: %) is expressed as follows:
C P = 100 × ( | S P a / S P b | 1 ) / ( | S R a / S R b | 1 ) ,
where S R a and S R b are the linear relationship slopes between time (i.e., year) and accumulative runoff, after and before the inflection points (mm/year); S P a and S P b are the linear relation slopes between time (i.e., year) and accumulative precipitation, after and before the inflection point (mm/year).
The contribution ratio of the evapotranspiration (CET, unit: %) is calculated by:
C E T = 100 × ( | S E T a / S E T b | 1 ) / ( | S R a / S R b | 1 ) ,
where S E T a and S E T b are the linear relation slopes between time (i.e., year) and accumulative evapotranspiration, after and before the inflection point (mm/year).
The contribution rate of anthropogenic activities (CH, unit: %) on the runoff variation is computed by:
C H = 100 C P C E T ,
There were no evapotranspiration and temperature data series in the study basin. In this study, we have modified the method proposed by Wang et al. (2012) [43], inwhich the annual evapotranspiration in every year was not needed, only including the mean annual evapotranspiration Therefore, the contribution of evapotranspiration was given by:
C E T = 100 × ( ( E ¯ a E ¯ b ) / E ¯ b ) / ( ( R ¯ a R ¯ b ) / R ¯ b ) ,
where, E ¯ a and E ¯ b are the mean annual evapotranspiration after and before the inflection point (mm).
The mean annual evapotranspiration in different period can be calculated based on the evapotranspiration (ET) model provided by Zhang et al. (2001) [52]. The evapotranspiration (ET) model has been used in large number of basins around the word. When the annual precipitation ranges from 500 and 1500 mm, the evapotranspiration is the same as the Budyko method. Furthermore, the precipitation in the study basin is in the interval between 500 and 1500 mm. Therefore, in this study, the mean annual evapotranspiration in different period was estimated as:
E T = ( f 1 + 2 1410 p 1 + 2 1410 p + p 1410 + ( 1 f ) 1 + 0.5 1100 p 1 + 0.5 1100 p + p 1100 ) × p ,
where, f is the mean fraction of forest cover (%) in baseline period and assessment periods; p is the mean annual precipitation (mm) in corresponding period; 1410 mm is the assumption of evapotranspiration when the forest is the main land use and plant-available water coefficient is 2.0; 1100 mm is the assumption of evapotranspiration when the herbaceous plants is the main land use and plant-available water coefficient is 0.5.

4. Results

4.1. Trends Test

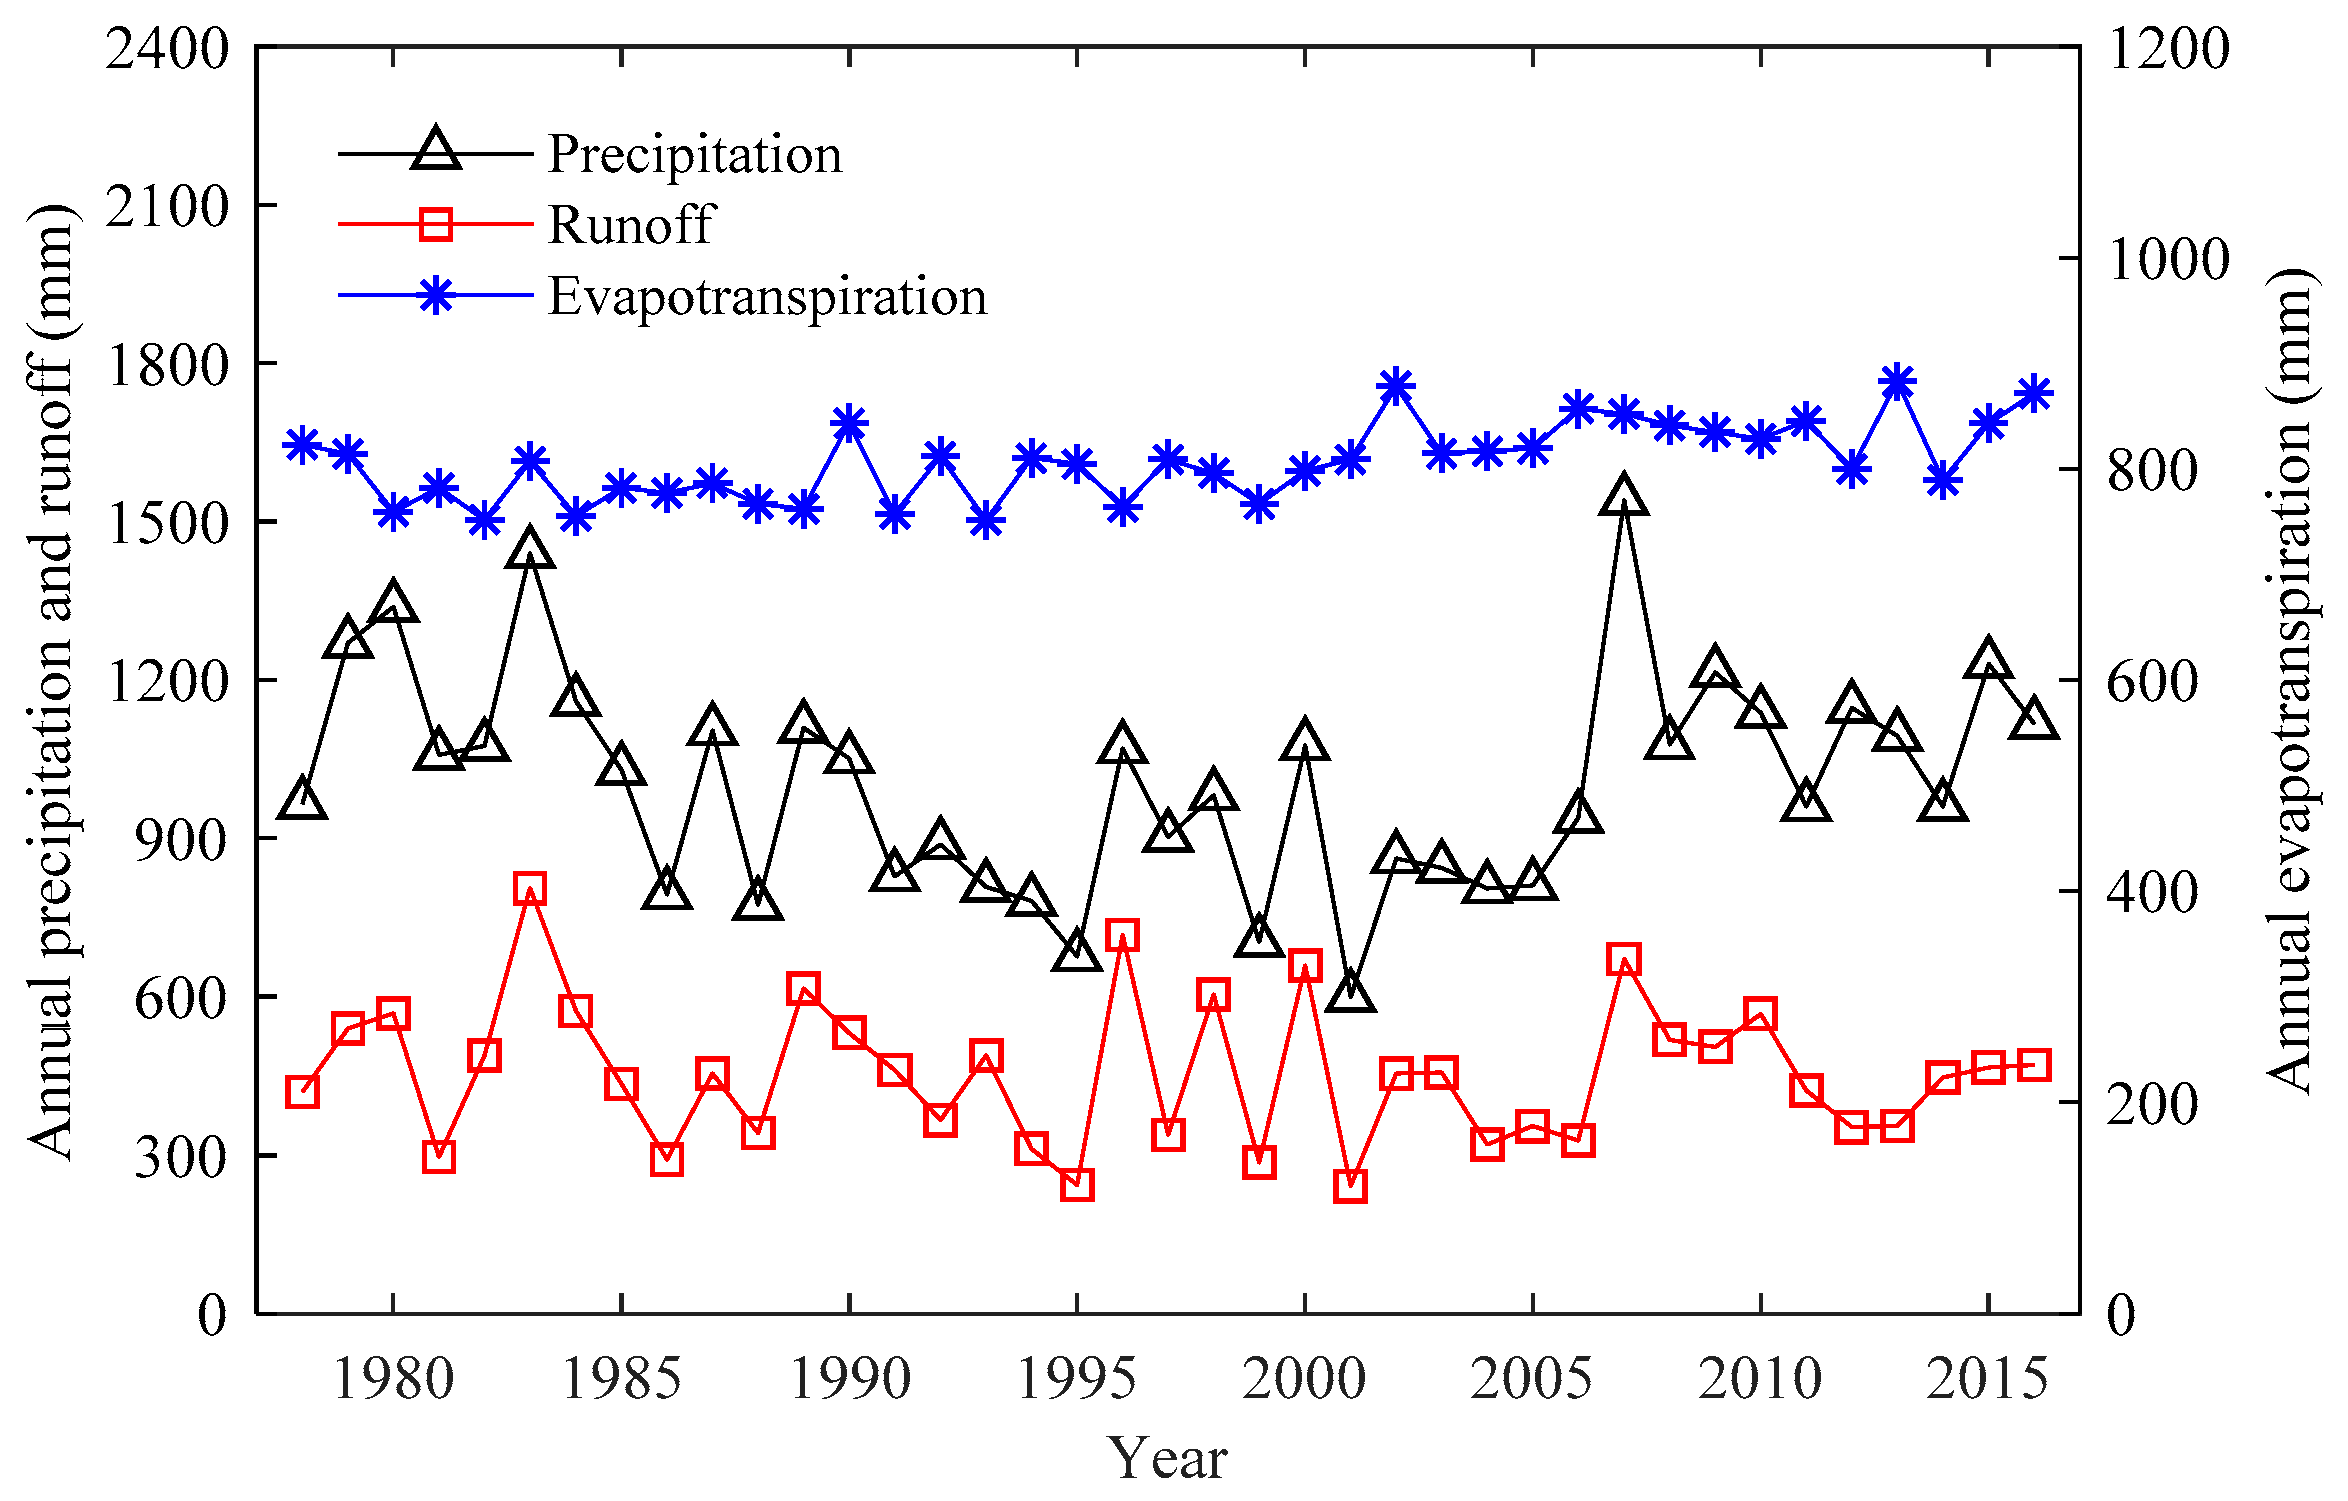
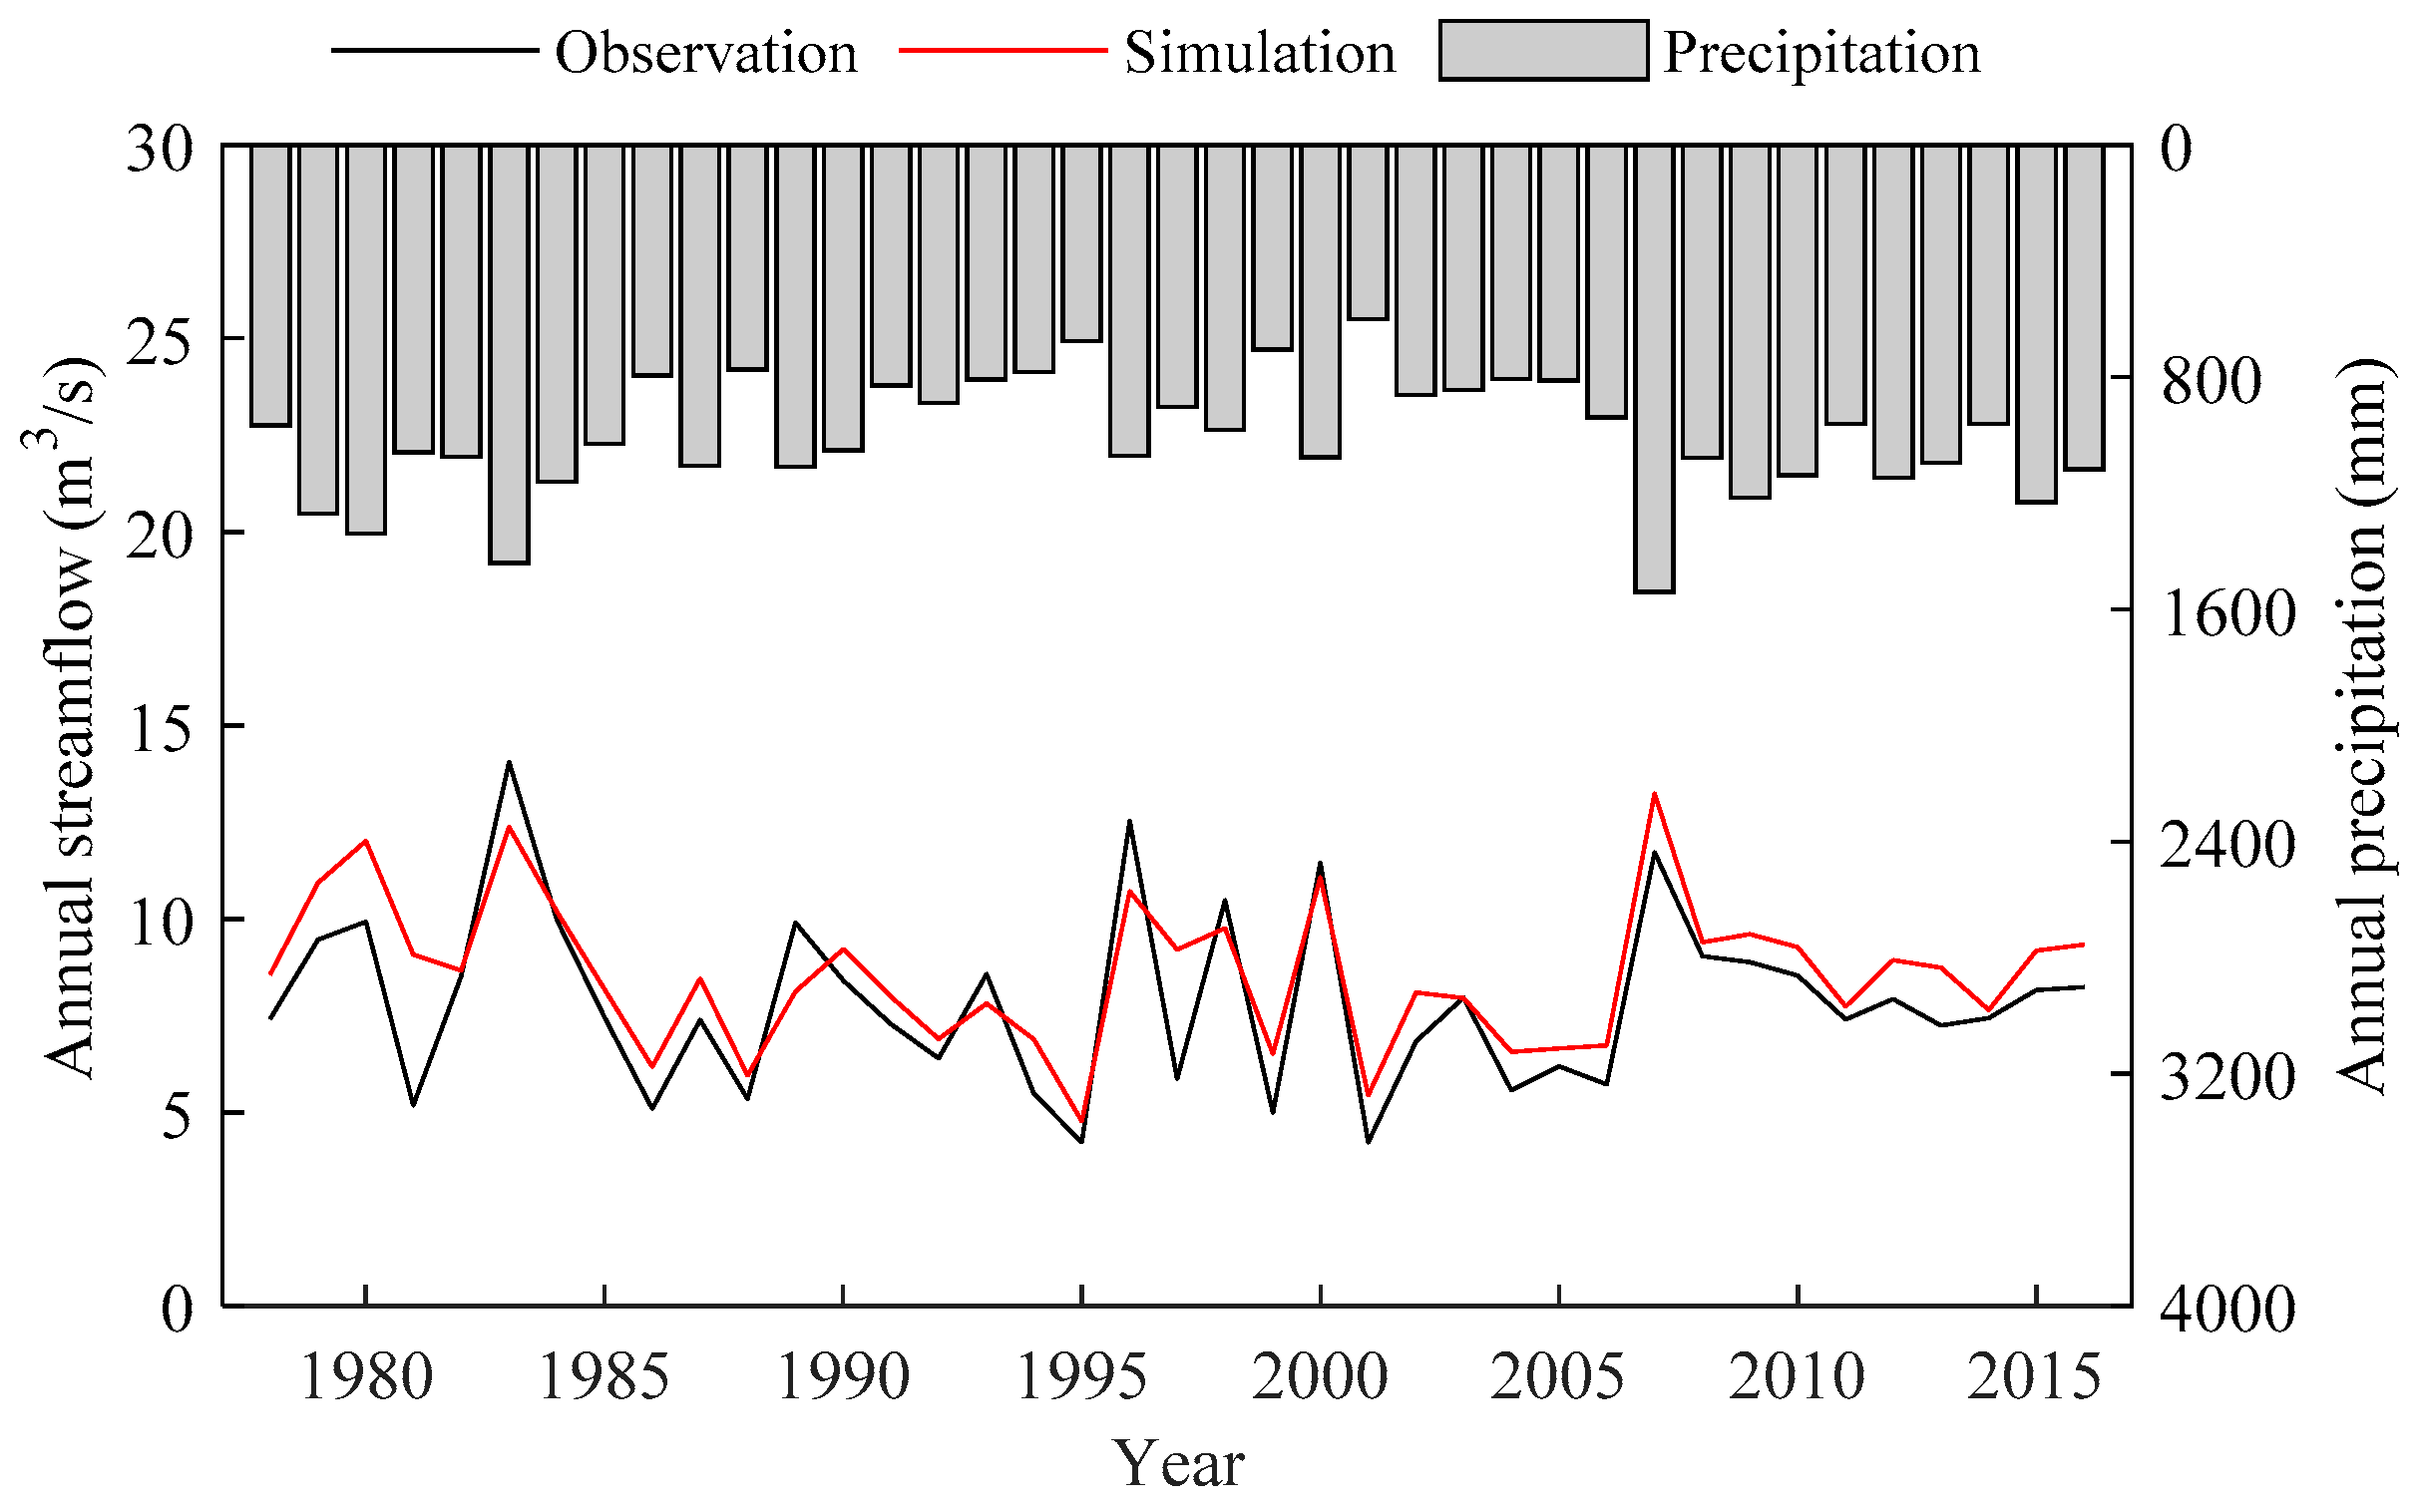
The annual precipitation, runoff and evapotranspiration of the upper areas of TFM dam are shown in Figure 2. The annual runoff declines at the rate of −1.1 mm/year. The lower values of annual runoff are in 1995 (243.2 mm) and 2001 (241.2 mm). The highest runoff occurs in 1983, which is up to 805.7 mm. Furthermore, the remarkably continuous dry years from 1985 to 2006 are found. The decreasing rate of annual precipitation is −0.5 mm/year between 1978 and 2016. The maximum annual precipitation occurs in 2007, achieving 1540.4 mm and the second highest is in 1983 (1440.3 mm). The annual evapotranspiration significantly increases at the rate of 1.96 mm/year. The maximum annual evapotranspiration occurs in 2013, achieving 882.7 mm and the second highest is in 2002 (878.4 mm). However, compared with the corresponding annual runoff data in 2007 and 1983, the annual runoff in 2007 (675.9 mm) is significantly smaller than that in 1983 (805.7 mm). Even though the annual evapotranspiration in 2007 (852.0 mm) is larger than that in 1983 (807.1 mm), the increasing rate of annual evapotranspiration (5.3%) is significantly smaller that of annual runoff (19.2%). That is to say, the more precipitation occurs in 2007 than that in 1983 but on the contrary, less runoff produces in 2007. The runoff coefficient (0.44) in 2007 is significantly smaller than that (0.56) in 1983. Therefore, it implies that the runoff in 2007 is remarkably affected by other factors.
The decadal of mean annual precipitation, runoff and runoff coefficient are then shown in Table 1. During the period of 1978–2009, the values of distance to mean in runoff data are consistent with that in precipitation data, however, during the period the 2010 to 2016, the value is opposite. This phenomenon indicates that the relationship between precipitation and runoff is weaker, in other words, the same precipitation produces less runoff. Furthermore, the runoff coefficient (0.41) is the smallest in this period (Table 1).
The change in trend and magnitude of annual runoff, precipitation, evapotranspiration and runoff coefficient are listed in Table 2. The results showed that only the Z value (3.79) in annual evapotranspiration is larger than the threshold of Z1−a/2 (i.e., Z1−a/2=±1.96 at a=5% significance level), indicating that the increasing trend of annual evapotranspiration is significant. However, the decreasing trend of annual runoff, precipitation and runoff coefficient are all not significant because of the Z values of −0.44, −0.17 and −0.82 for the whole period (1978–2016), respectively. The trend magnitude of annual runoff coefficient is larger than that of both annual precipitation and runoff and the change rate of annual precipitation is much weaker than that of annual runoff.

4.2. Change Point Analysis

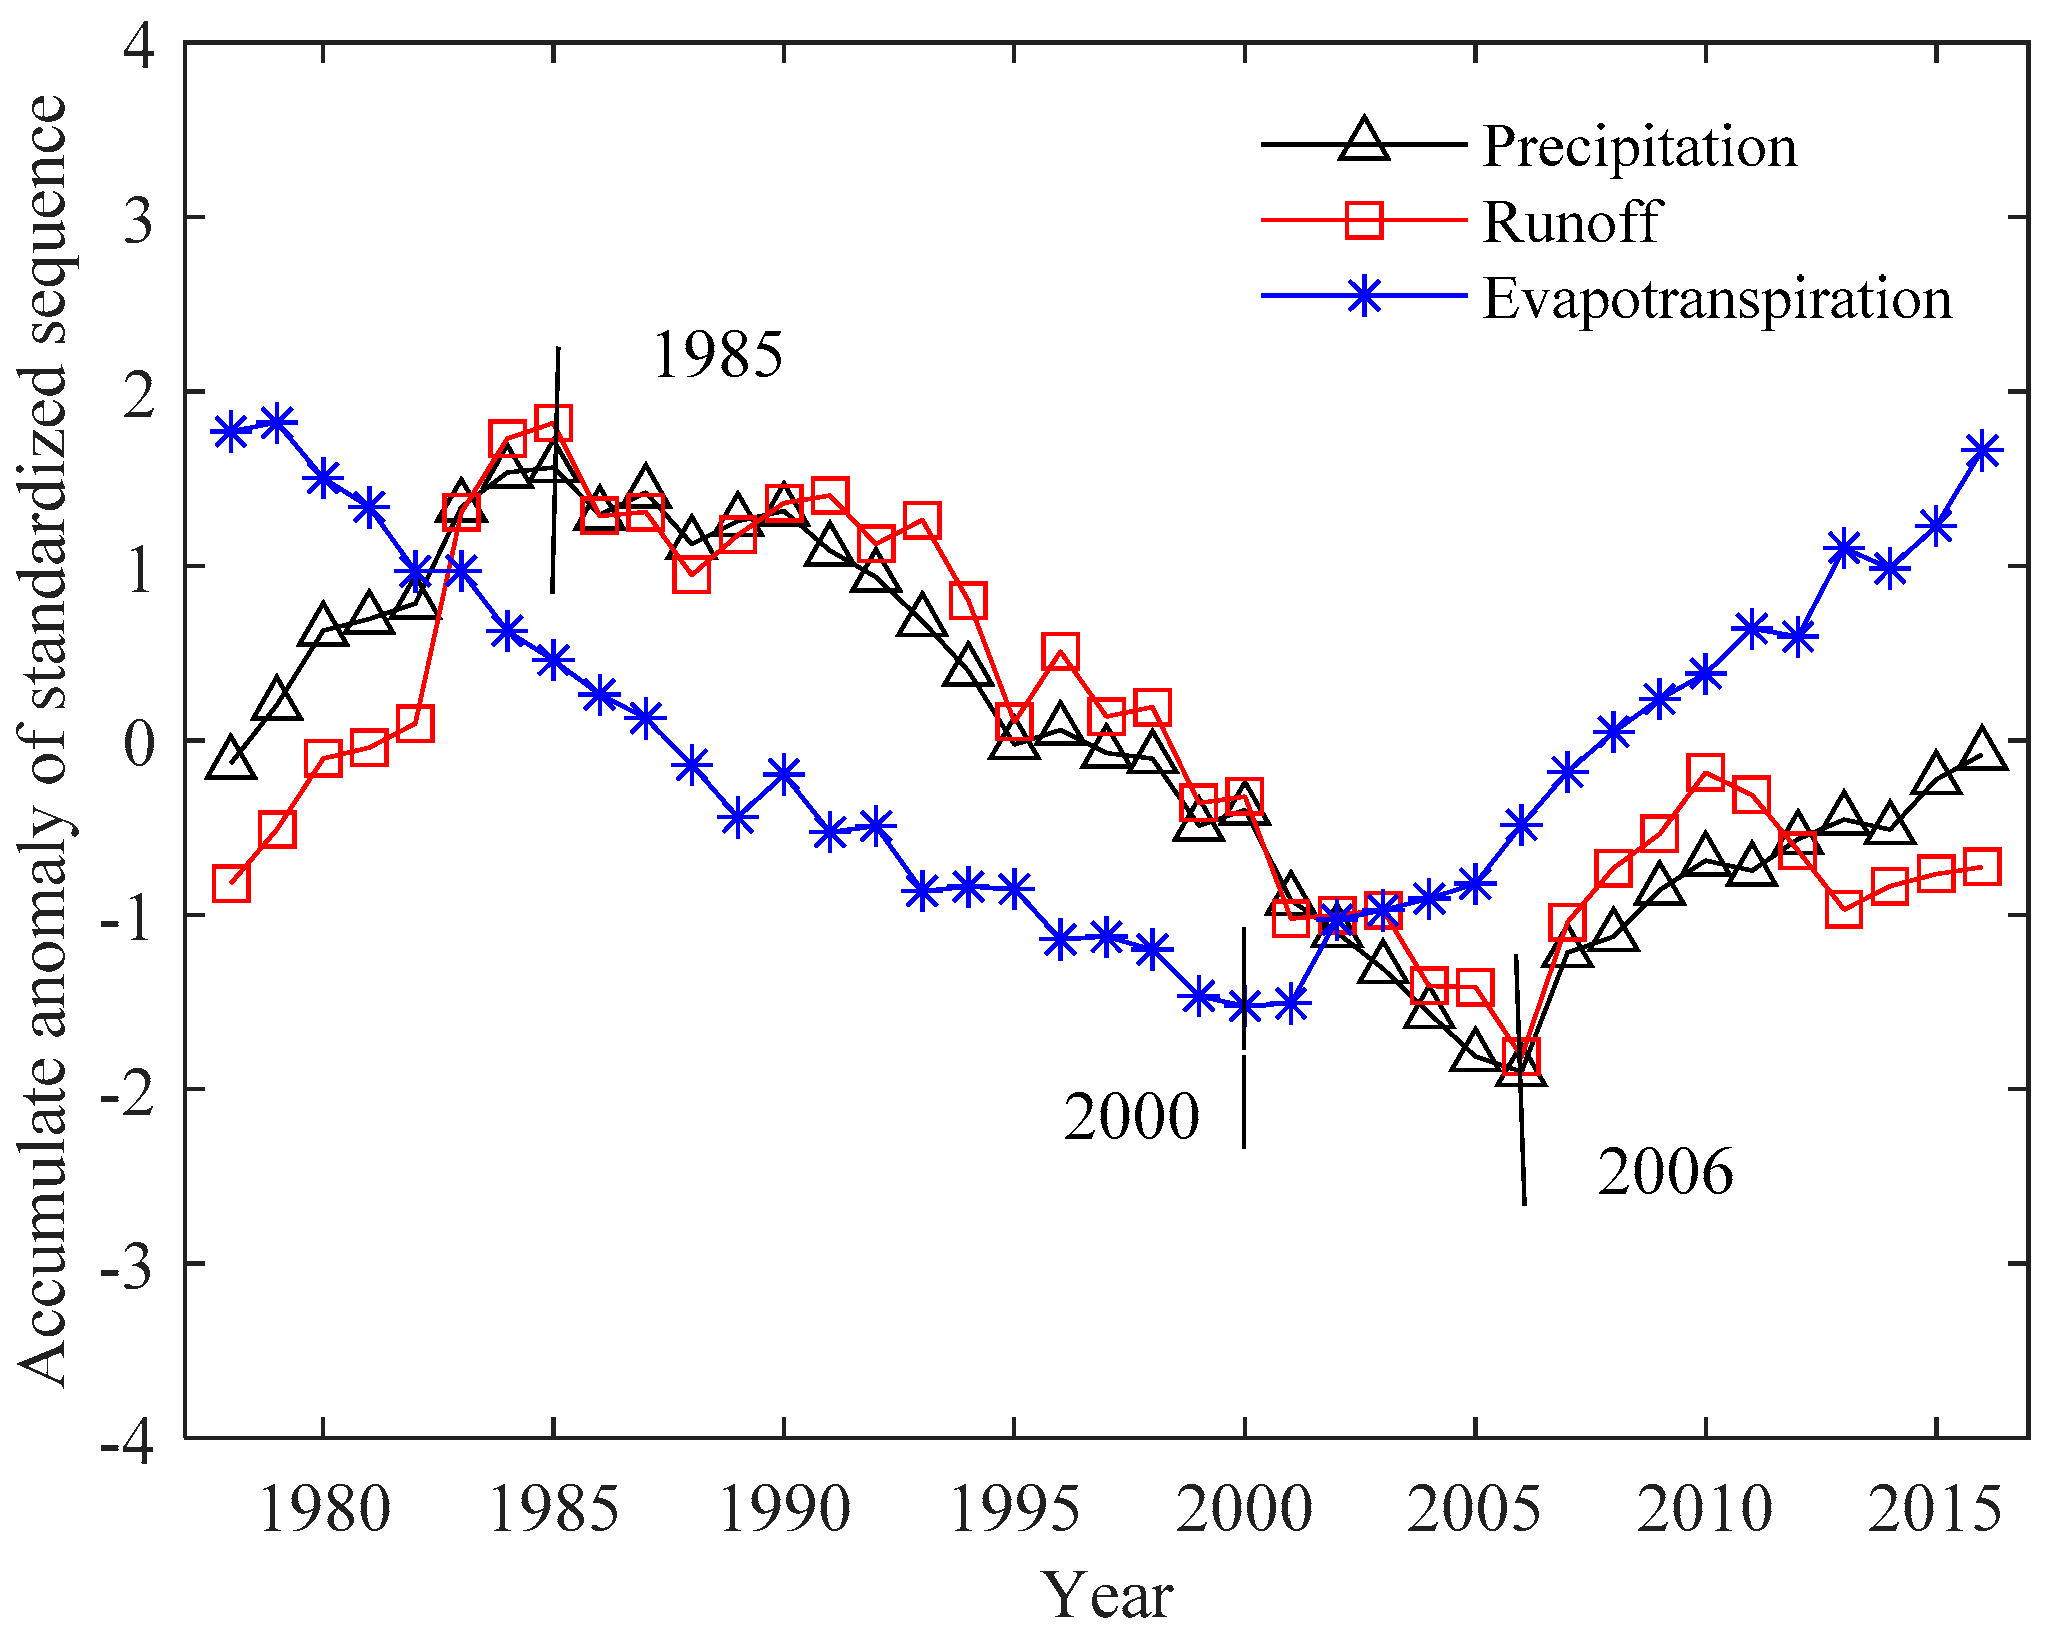
The accumulate anomaly curve of the annual runoff data series for the whole period of 1978–2016 is displayed in Figure 3. The highest value of the accumulative anomaly curve of runoff is in 1985 and the lowest value is in 2006 and second higher in 2010, second lower in 2013. There is a rising trend and decreasing trend before and after 1985, respectively and there is also an upward and downward trend before and after 2006. Furthermore, the accumulative anomaly curves of annual precipitation and evapotranspiration are also calculated and presented in Figure 3. There are two significant change points in 1985 and 2006 in annual precipitation data, which are the same as that of the annual runoff data. However, there is only one change point in annual evapotranspiration data (2000). According to the research by Dey and Mishra, (2017) [18], the change points of runoff should be in the interval of that of precipitation and evapotranspiration. Therefore, the change points (1985 and 2006) were selected as the final change points for the total 39 years.
In the upper reach of TFM dam, the variation of runoff before 1985 had been majorly impacted by the variation of precipitation, due to in this period there were few human activities. Since the year of 1985, human activities have gradually intensified and influenced the variation of runoff to some extent. To determine the contributions of climate change and human interactions to variation of annual runoff, the period of 1978–1984 is considered the reference period Ta, the other two change periods (i.e., Tb (1985–2005) and Tc (2006–2016)) are treated as measurement periods.
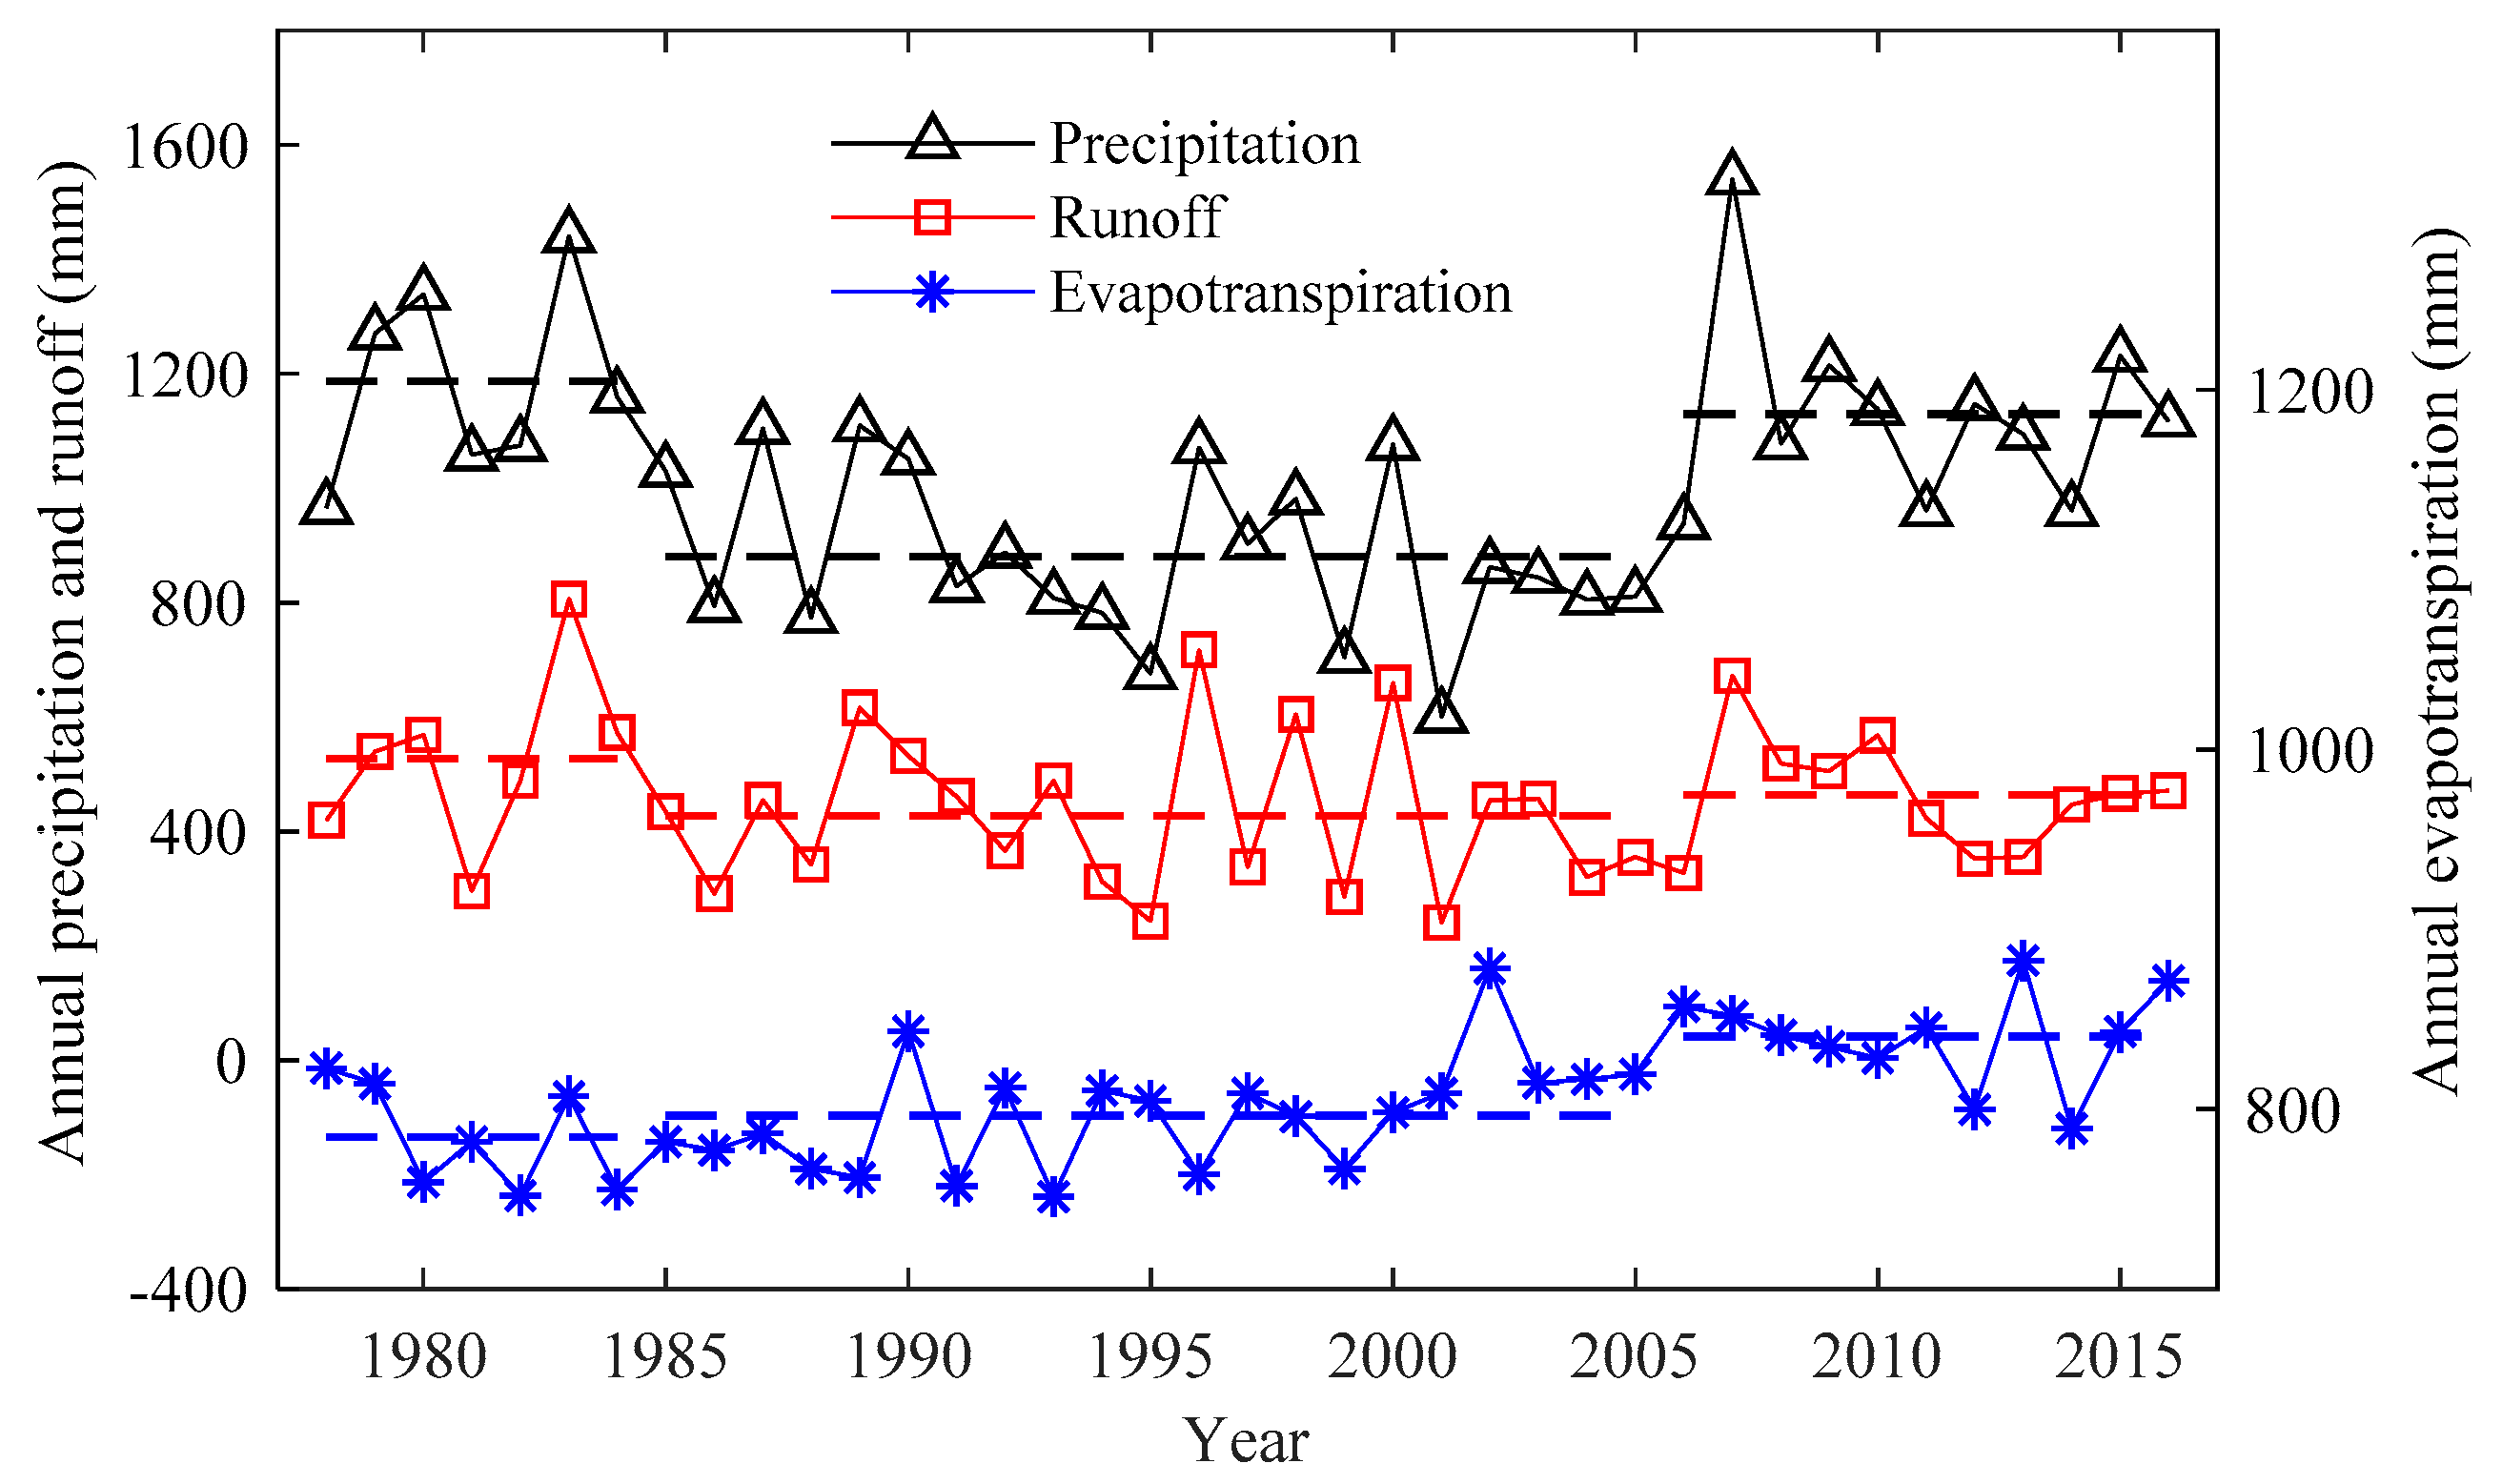
Based on the change points of annul runoff time series, the mean annual values of runoff, precipitation and evapotranspiration data in the three periods are listed in Table 3 and graphically displayed in Figure 4. Due to the lack of observed evapotranspiration data, two data sources are included in this paper. The evapotranspiration data were obtained from GLEAM, however. due to the area of the study basin is smaller, the evapotranspiration map only includes a small percentage of GLEAM map. The other method is that the mean annual evapotranspiration in every period was calculated using the Equation (11). In this equation, the fraction of forest cover (f) is the most important parameter. In this study, the mean fraction of forest cover for the baseline period Ta (1978–1984) is obtained from the land use map in 1980 (0.886). For the change period Tb (1985–2005), mean fraction of forest cover is calculated based on the two land use maps (1995 and 2000), which is the mean of the values of two forest coverages. A fraction of the forest cover of the land use map 2008 is used for the change period Tc (2006–2016), respectively. The mean fraction of forest cover in every period is listed in Table 3 and the calculated value of mean annual evapotranspiration in every period is also shown in Table 3.
Based on the GLEAM evapotranspiration and compared with the baseline period Ta, the mean annual of precipitation during the change period Tb, decreases by 25.8% (1186.8 mm in Ta vs. 881.1 mm in Tb) and evapotranspiration increases by 1.5% (784.7 mm in Ta vs. 796.4 mm in Tb), while that of runoff decreases by 19% (532.7 mm in Ta vs. 431.7 mm in Tb). The mean annual of precipitation during the change period Tc reduces by 4.9% (1186.8 mm in Ta vs. 1129.2 mm in Tc) and evapotranspiration increases by 7.1% (840.5 mm in Ta vs. 784.7 mm in Tc), whereas that of runoff reduces by 12.4% (532.7 mm in Ta vs. 466.8 mm in Tc).
However, based on the evapotranspiration calculated by Equation (11) and compared with the baseline period Ta, the mean annual evapotranspiration decreases by 18.7% (919.5 mm in Ta vs. 747.7 mm in Tb). The mean annual evapotranspiration reduces by 3.3% (919.5 mm in Ta vs. 889.2 mm in Tc).
Generally speaking, it could be seen that the change rate annual runoff in change period Tc is larger that the sum of that of precipitation and evapotranspiration, indicating human activities in this period is intensive and might be the most important influencing factor of the decline in runoff.
Furthermore, the mean runoff coefficients are 0.45 (532.7 mm/1186.8 mm) in the reference period Ta, 0.49 (431.7 mm /881.1 mm) in the the change period Tb and 0.41 (466.8 mm/1129.2 mm) in the change period Tc, respectively. Therefore, the value of runoff coefficient during the period Tc is the minimum compared with other two periods, indicating that the correlation beween precipitation and runoff is weakest, in other words, runoff variation might be less influenced by precipitation in this period Tc.

4.3. SCRAQ Method

4.3.1. Relationships between Year and Precipitation and between Year and Runoff

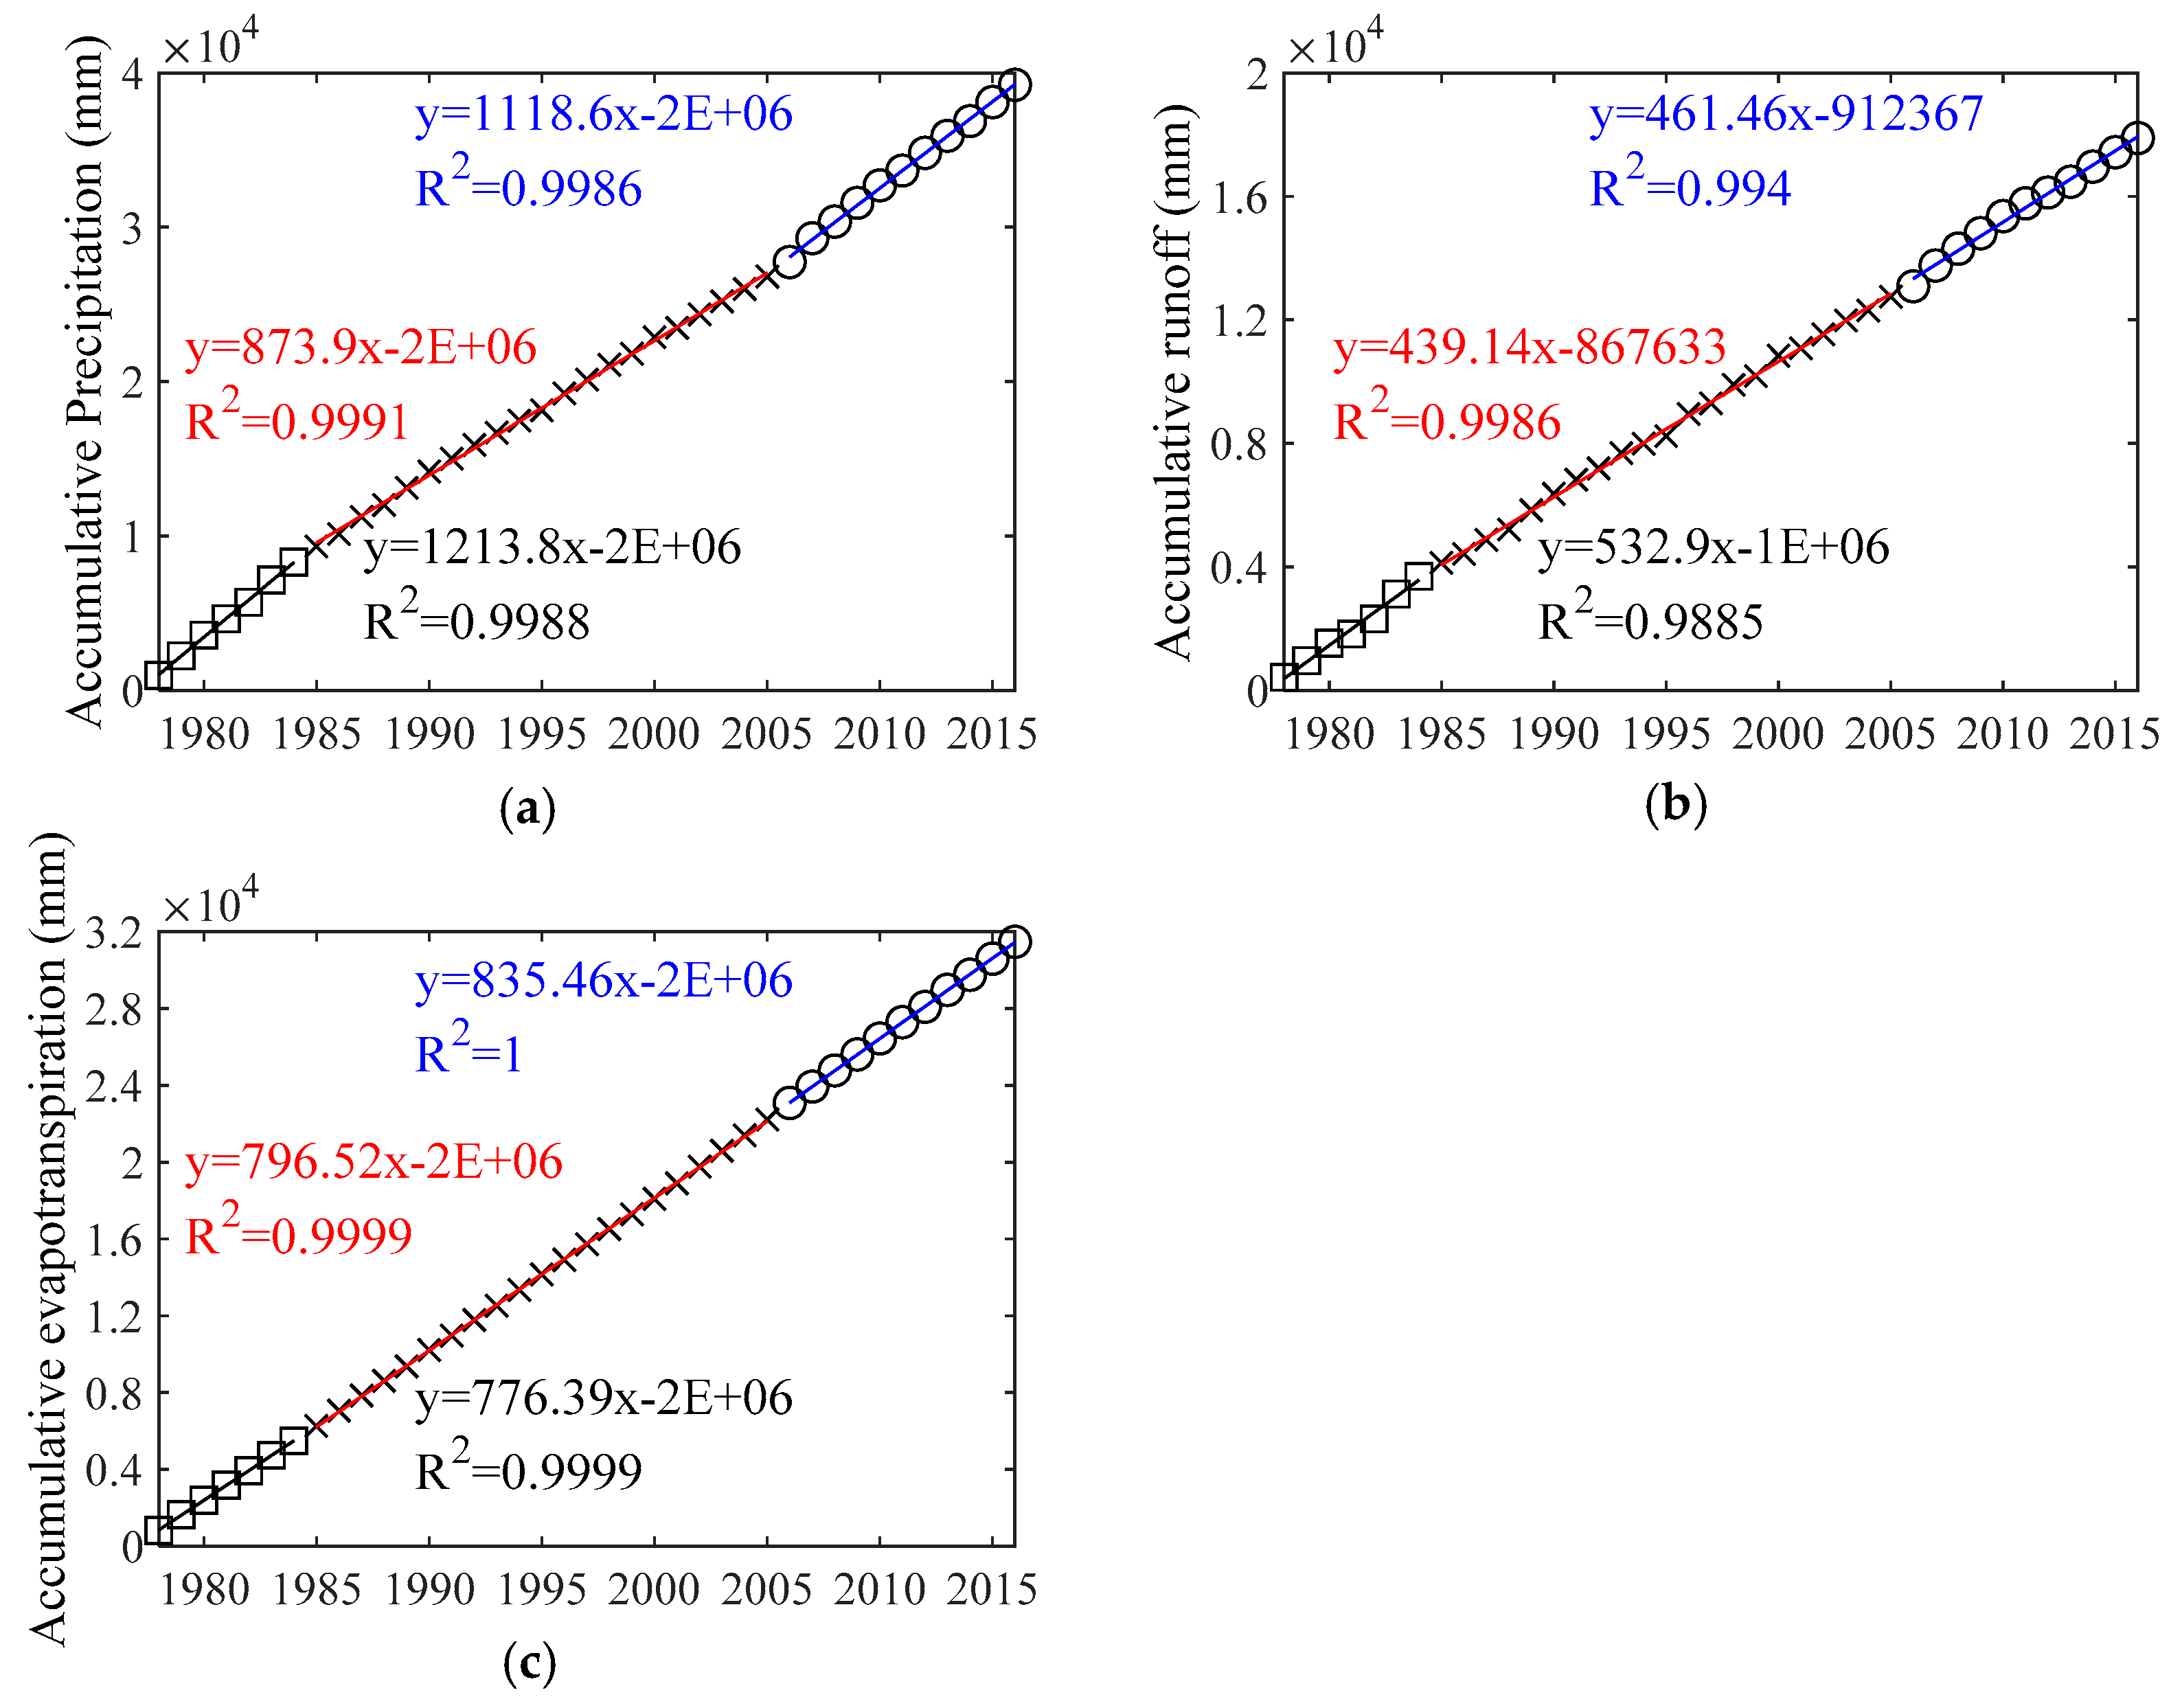
The scatter distributions, fitted lines by linear regression between accumulative runoff and year, accumulative precipitation and year and accumulative evapotranspiration and year, for the every period (Ta: 1978–1984, Tb: 1985–2005 and Tc: 2006–2016) are graphically displayed in Figure 5. It could be seen that the correlation coefficients of R2 values are all high for the three periods, even exceeding 0.98. At the same time, the confidence levels of P values are less than 0.0001. Therefore, correlation of accumulative streamflow and year is good in every period. The parameters of slope extracted for every period are also listed in Table 4.

4.3.2. Quantification of the Impacts of Climate Change and Human Interactions

Based on the parameters shown in Table 3 and Table 4, the results of contribution rates of precipitation, evapotranspiration and human activities to the runoff variation are listed in Table 5. It could be seen that the impact of precipitation to the variation of runoff is positive, while that of evapotranspiration is negative (Table 5).
When the period Ta (1978–1984) is treated as reference period, the contributions of precipitation on the runoff variation for the period Tb (1985–2006) and Tc (2006–2016) are 159% and 58.5%, respectively.
When the evapotranspiration data were obtained from GLEAM, the contributions on the runoff variation for the periods Tb and Tc are 13.9% and 56.7%, respectively. Hence, the contribution of climate variabilities (precipitation plus evapotranspiration) to runoff changes are 173% and 115.2%, respectively. Therefore, in the change period Tb and Tc, the climate change is the main driving factor. However, the climate change is less influenced in the change period Tc, implying the contribution of anthropogenic activities gradually increase.
When the evapotranspiration data were calculated using the Equation (11), it can be seen that the contribution of evapotranspiration to the runoff variation for the measurement periods Tb and Tc are −98.6% and −37.8%, respectively. In the whole, the contributions of climate change (precipitation plus evapotranspiration) to runoff variation are 60.5% and 20.7%, respectively. Therefore, the contribution of anthropogenic activities to the variation in runoff are 39.5% and 79.3%, respectively.
In general, in the change period Tb, the climate change is the main driving factor, whereas, in the change period Tc, the human activities are increasing, which can be the dominant influencing factor.

4.4. SWAT Model

4.4.1. Calibration and Validation of the SWAT Model

Based on the result of change points, the SWAT model was calibrated for the baseline period of 1979–1984 and validated for the change period from 1985 to 2005. The land use map in 1980 was used. The optimal parameters are listed in Table 6. The most sensitive parameter is SOL_BD, which is the important parameter to characterize soil properties and is closely related to soil porosity and spatiotemporal distribution of precipitation.
The simulation and observation of streamflow during the calibration and validation period is presented in Figure 6. The SWAT model is performed well with the observed streamflow and the calibrated SWAT model could predict runoff well for the validation period. However, some overestimates are found particularly for the high flows during the year of 1981 (Figure 6). We speculate that might because of the overestimated precipitation.
The performance values of the SWAT model for the calibration and validation periods are summarized in Table 7. For the calibration period, the values of NSE and R2 reach up to 0.86 and 0.88, respectively and simultaneously RSR is lower than 0.5 but the absolute value of PBIAS is higher than 10%. Therefore, the simulation result can be regarded as “good” [51,54]. Compared with calibration period, the performance indicators during the validation period are lower (NSE=0.74). However, the overall performance of the SWAT model is “very good” in terms of NSE (0.78), PBIAS (−6.49%), R2 (0.79) and RSR (0.46). Therefore, the calibrated model is suitable to simulate the natural runoff and estimate the impacts of climate change and human interactions in the study basin. Then the meteorological data for the change period Tc (2006–2016) are applied as inputs to predict natural streamflow. The other input factors including basin characteristics, land use and so on are kept constant. Based on the calibrated parameters, the impacts of anthropologic activities and climate change could be quantitatively assessed.

4.4.2. Quantification of the Impacts of Climate Change and Human Interactions

The comparison between observed and simulated runoff based on SWAT model for the whole period is presented in Figure 7. Compared with the runoff during the baseline period, there are obvious difference between observed and simulated runoff in change period Tc (2006–2016), indicating that runoff generation in this period can be influenced by intensive anthropologic activities. The individual contribution of climate change and anthropogenic activities on runoff variation is listed in Table 8. It can be seen that for the change period Tb, the climate change is responsible for 74.4% to runoff variation and the percentage resulting from human activities is 25.6%. Whereas for the change period Tc, the human activities the main driving factor, accounting for 86.1%.

5. Discussion

5.1. The Possible Causes for the Alteration of the Influence of Human Interactions and Climate Change

The principal purpose of this paper was to investigate and quantify the contribution rate of human interactions and climate change on runoff variation in the Huangbaihe River Basin. The results showed that runoff variation was the consequence of combination of human interactions and climate change. The influence of climate change gradually decreased, whereas, the influence of anthropogenic activities exhibited a gradually increasing trend. That is to say, human activities have become the dominant driving factor to runoff variation, along with the intensification of human activities. Climate change dominates the runoff variation in the period 1978–2005, while human activities contributes the most to runoff variation for the period 2006–2016.
The human activities include direct and indirect influencing factors. The indirect human activities are mainly influenced by the land use change. The land use areas of the study basin in 1980, 1995 and 2008 are listed in Table 9. The forest is main land cover for the three land use maps. The change rate is little (−0.41% from 1980 to 2008). The percentage of other land use types is small. Overall, the land use change is not the main human activities to runoff variation during the study period (1978–2016). The direct human activities mainly include dam operation and other water resource management and so on. In this study, the dam construction is not considered and the streamflow data have been restored to natural condition. There are only intensive large-scale phosphate mining activities in this basin, which have affected the hydrological processes [26]. Compared with no-mining and less mining period (Ta and Tb, namely pre-mining period: P1), the correlation between precipitation and runoff during large scale phosphate mining activities period (Tc, post-mining period: P2) is weaker (Figure 8). The R2 for P1 is larger than that of P2, implying that in P2, the precipitation is not the major factor driving the variation of runoff. Therefore, runoff could be more influenced by phosphate mining activities. Furthermore, the regression line for P2 lies below that of P1, which illustrates the fact that with the same annual precipitation, runoff generation in P2 is smaller than that in P1, which also can be concluded that phosphate mining activity is the main reason leading to the runoff decreasing. In the Huangbaihe River Basin, the percentage of phosphate mining pits area is from 0.32% to 63% (mean 26%) of the areas of he investigated phosphate mining sites. Only approximately 0.5% of areas of the phosphate mining pits are directly exposed to the outside and the others are under the ground. During the large-scale phosphate mining and construction of the pits in the Huangbaihe River Basin, trinitrotoluene (TNT) was used to explore the phosphate rocks. When the TNT explosions occur in the mining sites, the water infiltration capacity could be increased due to fracture development located above the pits. Meanwhile, most of the abandoned goafs were not backfilled, leading to runoff retention and precipitation capture. Just when the precipitation falls to the surface ground, large amount of precipitation firstly runs into the underground river channels through the cracks. Then the underground water flows into other basins. In general, runoff declined because of the flow running through cracks and the interception by goafs [53,55,56]. The principle of runoff variation caused by phosphate mining is the same as the runoff reduction influenced by coal mining activities, which was analyzed in these papers [24,57]. Therefore, during the phosphate mining period, the measures should be put forward and implemented to prevent the reduction of the runoff.

5.2. Uncertainty Analysis of the Research Methods

Quantitative evaluation of the influences of anthropologic activities and climate change on runoff variation has been a hot topic around the world. Quantitative assessment method and hydrological modeling method are good approaches [10,18,23]. In this study, uncertainty exited in the two methods and the sources of uncertainty were analyzed, include the evapotranspiration data, the model inputs and an assumption used in this study.
Due to the lack of the temperature and observed evapotranspiration data, two sources of evapotranspiration data were used and analyzed. One data is downloaded from the GLEAM. The resolution of GLEAM data is (0.25° × 0.25°), which is too coarse for the study basin. In addition, the time span of GLEAM data is from 1980 to 2016, which is relative short to our study (1978–2016). Therefore, the evapotranspiration data has relatively large uncertainty influenced by these factors. The other data is deduced by empirical Equation (11). The empirical Equation (11) was proved in many watersheds around the word, however, it was not compared with the actual evapotranspiration data in the study basin which also might be different with the natural condition, therefore, uncertainty was existed.
The SWAT model could provide the detailed information of hydrological processes but its limitations are also existed. Because the SWAT model structure is complex and there are large number of parameters and input data, it would take a lot of time and effort to study the model structure, collect input data and calibrate the parameters. In this study, the data obtained from the only one weather station are used as the meteorological input, which is located near to the TFM Reservoir Dam. However, one station is not enough to force the model, because in a mountainous area, the distribution precipitation is uneven [58]. Furthermore, there are also no observed temperature, wind speed and other the meteorological elements, only precipitation data was used to drive SWAT model.
The assumption of method to evaluate the contribution of climate change and anthropologic activities is that the impact of anthropologic activities is independent with the climate change. However, climate change could change the anthropologic activities to some extent, including land use change and then change the streamflow [59]. On the contrary, the rising population might cause the temperature increase [60]. Therefore, these uncertainties should be considered in the further studies.

6. Conclusions

The purpose of this study is to assess the impacts of climate change and human activities to variation in runoff in the intensive large-scale phosphate mining areas (Huangbaihe River Basin). We analyze the trends and change points of annual runoff, precipitation and evapotranspiration from 1978 to 2016 based on Mann-Kendall trend test with Sen’s slope detection and accumulative anomaly method and then identify the contribution rates of climate change and anthropologic activities to variation of runoff using SWAT hydrological model and SCRAQ method. In this study, due to the lack of observed evapotranspiration data, two sources of evapotranspiration data were used and analyzed. The main conclusions are drawn as follows:
(1) During the research period (1978–2016), there are no significant decreasing trends in annual precipitation and runoff time series. However, there is a significant increasing trend in annual evapotranspiration data. Furthermore, the change rate of annual precipitation is larger than that of annual runoff data.
(2) Runoff and precipitation time series showed similar change features and the change points were detected in 1985 and 2006. Based on the result of change points, the whole period was separated into baseline period Ta (1978–1984), change period Tb (1985–2005) and change period Tc (2006–2016).
(3) For the change period Tb, the climate change is the main influencing factor resulting in the runoff variation based on the results of both SCRAQ, method and SWAT model. Whereas during the change period Tc, human interactions is the dominant driving factor using both two methods. Therefore, compared with the contribution of climate change, the impact of anthropologic activities has increased along with the intensification of phosphate mining activities.
Finally, due to the lack of the actual observed evapotranspiration data, two sources of evapotranspiration data were used and analyzed. However, due to the low resolution of remote sensed data and the difficulty in calibrating the empirical equation, the uncertainty of the evapotranspiration data may not to be ignored. Therefore, more reliable observation of basin-scale evapotranspiration will be preferable for such kind of research.

Author Contributions

Methodology, H.B., X.D. and X.H.; resources, Z.L.; data curation, H.B. and G.R.; writing—original draft preparation, H.B.; writing—review and editing, H.B.; visualization, C.W.; supervision, X.D.; project administration, X.D. and B.X.; funding acquisition, X.D.

Funding

This paper was supported by the Natural Science Foundation of China (40701024, 41101511, 51409152), the Nonprofit Industry Financial Program of Ministry of Water Resources of China (No. 201301066), the PhD Thesis Foundation of China Three Gorges University (2018BSPY003) and the Hubei Provincial Collaborative Innovation Center for Water Security.

Acknowledgments

We thank the Protection of Water Resources in the Huangbaihe River Basin for providing the runoff and precipitation data.

Conflicts of Interest

The authors declare no conflict of interest.

References

  1. Dettinger, M.D.; Diaz, H.F. Global Characteristics of Stream Flow Seasonality and Variability. J. Hydrometeorol. 2000, 1, 289–310. [Google Scholar] [CrossRef] [Green Version]
  2. Farahani, M.A.; Khalili, D. Seasonality Characteristics and Spatio-temporal Trends of 7-day Low Flows in a Large, Semi-arid Watershed. Water Resour. Manag. 2013, 27, 4897–4911. [Google Scholar] [CrossRef]
  3. Milliman, J.D.; Farnsworth, K.L.; Jones, P.D.; Xu, K.H.; Smith, L.C. Climatic and anthropogenic factors affecting river discharge to the global ocean, 1951–2000. Glob. Planet. Chang. 2008, 62, 187–194. [Google Scholar] [CrossRef]
  4. Foley, J.A.; Ruth, D.; Asner, G.P.; Carol, B.; Gordon, B.; Carpenter, S.R.; Stuart, F.C.; Coe, M.T.; Daily, G.C.; Gibbs, H.K. Global consequences of land use. Science 2005, 309, 570–574. [Google Scholar] [CrossRef]
  5. Roosmalen, L.V.; Sonnenborg, T.O.; Jensen, K.H. Impact of climate and land use change on the hydrology of a large-scale agricultural catchment. Water Resour. Res. 2009, 45, 150–164. [Google Scholar] [CrossRef]
  6. Han, Z.; Long, D.; Fang, Y.; Hou, A.; Hong, Y. Impacts of climate change and human activities on the flow regime of the dammed Lancang River in Southwest China. J. Hydrol. 2019, 570, 96–105. [Google Scholar] [CrossRef]
  7. Dechmi, F.; Burguete, J.; Skhiri, A. SWAT application in intensive irrigation systems: Model modification, calibration and validation. J. Hydrol. 2012, 470–471, 227–238. [Google Scholar] [CrossRef]
  8. Zhao, G.; Li, E.; Mu, X.; Wen, Z.; Rayburg, S.; Tian, P. Changing trends and regime shift of streamflow in the Yellow River basin. Stoch. Environ. Res. Risk Assess. 2015, 29, 1331–1343. [Google Scholar] [CrossRef]
  9. Galván, L.; Olías, M.; Villarán, R.F.D.; Santos, J.M.D.; Nieto, J.M.; Sarmiento, A.M.; Cánovas, C.R. Application of the SWAT model to an AMD-affected river (Meca River, SW Spain). Estimation of transported pollutant load. J. Hydrol. 2009, 377, 445–454. [Google Scholar] [CrossRef]
  10. Zhang, A.; Fu, G.; Wang, B.; Bao, Z.; Zheng, H. Assessments of Impacts of Climate Change and Human Activities on Runoff with SWAT for the Huifa River Basin, Northeast China. Water Resour. Manag. 2012, 26, 2199–2217. [Google Scholar] [CrossRef]
  11. Liang, K.; Liu, C.; Liu, X.; Song, X. Impacts of climate variability and human activity on streamflow decrease in a sediment concentrated region in the Middle Yellow River. Stoch. Environ. Res. Risk Assess. 2013, 27, 1741–1749. [Google Scholar] [CrossRef]
  12. Wu, L.; Wang, S.; Bai, X.; Luo, W.; Tian, Y.; Zeng, C.; Luo, G.; He, S. Quantitative assessment of the impacts of climate change and human activities on runoff change in a typical karst watershed, SW China. Sci. Total Environ. 2017, 601–602, 1449. [Google Scholar] [CrossRef]
  13. Hawkins, J.W. Predictability of surface mine spoil hydrologic properties in the Appalachian Plateau. Ground Water 2004, 42, 119–125. [Google Scholar] [CrossRef]
  14. Guo, Y.; Li, Z.; Amo-Boateng, M.; Deng, P.; Huang, P. Quantitative assessment of the impact of climate variability and human activities on runoff changes for the upper reaches of Weihe River. Stoch. Environ. Res. Risk Assess. 2014, 28, 333–346. [Google Scholar] [CrossRef]
  15. Yuan, Y.; Zhang, C.; Zeng, G.; Liang, J.; Guo, S.; Huang, L.; Wu, H.; Hua, S. Quantitative assessment of the contribution of climate variability and human activity to streamflow alteration in Dongting Lake, China. Hydrol. Process. 2016, 30, 1929–1939. [Google Scholar] [CrossRef]
  16. Mohammadi Ghaleni, M.; Ebrahimi, K. Effects of Human Activities and Climate Variability on Water Resources in the Saveh Plain, Iran. Environ. Monit. Assess. 2015, 187, 4243. [Google Scholar] [CrossRef] [PubMed]
  17. Zhao, G.; Tian, P.; Mu, X.; Jiao, J.; Wang, F.; Gao, P. Quantifying the impact of climate variability and human activities on streamflow in the middle reaches of the Yellow River basin, China. J. Hydrol. 2014, 519, 387–398. [Google Scholar] [CrossRef]
  18. Dey, P.; Mishra, A. Separating the impacts of climate change and human activities on streamflow: A review of methodologies and critical assumptions. J. Hydrol. 2017, 548, 278–290. [Google Scholar] [CrossRef]
  19. Xin, Z.; Li, Y.; Zhang, L.; Ding, W.; Ye, L.; Wu, J.; Zhang, C. Quantifying the relative contribution of climate and human impacts on seasonal streamflow. J. Hydrol. 2019, 574, 936–945. [Google Scholar] [CrossRef]
  20. Chen, Y.; Guan, Y.; Shao, G.; Zhang, D. Investigating Trends in Streamflow and Precipitation in Huangfuchuan Basin with Wavelet Analysis and the Mann-Kendall Test. Water 2016, 8, 77. [Google Scholar] [CrossRef]
  21. Rougé, C.; Ge, Y.; Cai, X. Detecting gradual and abrupt changes in hydrological records. Adv. Water Resour. 2013, 53, 33–44. [Google Scholar] [CrossRef] [Green Version]
  22. Villarini, G.; Smith, J.A.; Serinaldi, F.; Ntelekos, A.A. Analyses of seasonal and annual maximum daily discharge records for central Europe. J. Hydrol. 2011, 399, 299–312. [Google Scholar] [CrossRef]
  23. Wang, S.; Yan, Y.; Yan, M.; Zhao, X. Quantitative estimation of the impact of precipitation and human activities on runoff change of the Huangfuchuan River Basin. J. Geogr. Sci. 2012, 22, 906–918. [Google Scholar] [CrossRef]
  24. Ye, X.; Zhang, Q.; Liu, J.; Li, X.; Xu, C.Y. Distinguishing the relative impacts of climate change and human activities on variation of streamflow in the Poyang Lake catchment, China. J. Hydrol. 2013, 494, 83–95. [Google Scholar] [CrossRef]
  25. Ran, L.; Wang, S.; Fan, X. Channel change at Toudaoguai Station and its responses to the operation of upstream reservoirs in the upper Yellow River. J. Geogr. Sci. 2010, 20, 231–247. [Google Scholar] [CrossRef]
  26. Wang, K.; Lin, Z.; Zhang, R. Impact of phosphate mining and separation of mined materials on the hydrology and water environment of the Huangbai River basin, China. Sci. Total Environ. 2016, 543, 347. [Google Scholar] [CrossRef]
  27. Liu, Y.; Ruan, L.; Qin, P. Study on Water Resources Protection Measures in the East Branch of Huangbaihe River Basin. China Rural Water and Hydropower 2017, 7, 129–131. (In Chinese) [Google Scholar]
  28. Bai, P.; Liu, X. Intercomparison and evaluation of three global high-resolution evapotranspiration products across China. J. Hydrol. 2018, 566, 743–755. [Google Scholar] [CrossRef]
  29. Yang, T.; Zhang, Q.; Chen, Y.D.; Tao, X.; Xu, C.Y.; Chen, X. A spatial assessment of hydrologic alteration caused by dam construction in the middle and lower Yellow River, China. Hydrol. Process. 2010, 22, 3829–3843. [Google Scholar] [CrossRef]
  30. Kendall, M.G. Rank Correlation Methods, 4th ed.; Charles Griffin: London, UK, 1975; p. 202. [Google Scholar]
  31. Partal, T.; Kahya, E. Trend analysis in Turkey precipitation Data. Hydrol. Process. 2006, 20, 2011–2026. [Google Scholar] [CrossRef]
  32. Some’e, B.S.; Ezani, A.; Tabari, H. Spatiotemporal trends and change point of precipitation in Iran. Atmos. Res. 2012, 113, 1–12. [Google Scholar]
  33. Zhang, X.; Harvey, K.D.; Hogg, W.D.; Yuzyk, T.R. Trends in Canadian streamflow. Water Resour. Res. 2001, 37, 987–998. [Google Scholar] [CrossRef]
  34. Burn, D.H.; Elnur, M.A.H. Detection of hydrologic trends and variability. J. Hydrol. 2002, 255, 107–122. [Google Scholar] [CrossRef]
  35. Tabari, H.; Taye, M.T.; Willems, P. Statistical assessment of precipitation trends in the upper Blue Nile River basin. Stoch. Environ. Res. Risk Assess. 2015, 29, 1751–1761. [Google Scholar] [CrossRef]
  36. Yue, S.; Pilon, P.; Phinney, B.; Cavadias, G. The influence of autocorrelation on the ability to detect trend in hydrological series. Hydrol. Process. 2002, 16, 1807–1829. [Google Scholar] [CrossRef]
  37. Hamed, K.H.; Ramachandra Rao, A. A modified Mann-Kendall trend test for autocorrelated data. J. Hydrol. 1998, 204, 182–196. [Google Scholar] [CrossRef]
  38. Sen, P.K. Estimates of the Regression Coefficient Based on Kendall’s Tau. J. Am. Stat. Assoc. 1968, 63, 1379–1389. [Google Scholar] [CrossRef]
  39. Hirsch, R.M.; Slack, J.R.; Smith, R.A. Techniques of trend analysis for monthly water quality data. Water Resour. Res. 1982, 18, 107–121. [Google Scholar] [CrossRef] [Green Version]
  40. Dinpashoh, Y.; Jhajharia, D.; Fakheri-Fard, A.; Singh, V.P.; Kahya, E. Trends in reference crop evapotranspiration over Iran. J. Hydrol. 2011, 399, 422–433. [Google Scholar] [CrossRef]
  41. Zhang, A.; Zheng, C.; Wang, S.; Yao, Y. Analysis of streamflow variations in the Heihe River Basin, northwest China: Trends, abrupt changes, driving factors and ecological influences. J. Hydrol. 2015, 3, 106–124. [Google Scholar] [CrossRef] [Green Version]
  42. Tabari, H.; Aghajanloo, M.-B. Temporal pattern of aridity index in Iran with considering precipitation and evapotranspiration trends. Int. J. Climatol. 2013, 33, 396–409. [Google Scholar] [CrossRef]
  43. Wang, S.; Yan, M.; Yan, Y.; Shi, C.; He, L. Contributions of climate change and human activities to the changes in runoff increment in different sections of the Yellow River. Quat. Int. 2012, 282, 66–77. [Google Scholar] [CrossRef]
  44. Arnold, J.G.; Srinivasan, R.; Muttiah, R.S.; Williams, J.R. Large area hydrologic modeling and assessment-Part I: Model development. J. Am. Water Resour. Assoc. 1998, 34, 73–89. [Google Scholar] [CrossRef]
  45. Neitsch, S.L.; Arnold, J.G.; Kiniry, J.R.; Williams, J.R. Soil and Water Assessment Tool-Theoretical Documentation Version 2009; Texas Water Resources Institute: College Station, TX, USA, 2011. [Google Scholar]
  46. Yang, J.; Reichert, P.; Abbaspour, K.C.; Xia, J.; Yang, H. Comparing uncertainty analysis techniques for a SWAT application to the Chaohe Basin in China. J. Hydrol. 2008, 358, 1–23. [Google Scholar] [CrossRef]
  47. Abbaspour, K.C. SWAT-CUP: SWAT Calibration and Uncertainty Programs—A User Manual; Swiss Federal Institute of Aquatic Science and Technology: Dübendorf, Switzerland, 2015. [Google Scholar]
  48. Nash, J.E.; Sutcliffe, J.V. River flow forecasting through conceptual models part I—A discussion of principles. J. Hydrol. 1970, 10, 282–290. [Google Scholar] [CrossRef]
  49. Vazquez-Amábile, G.G.; Engel, B.A. Use of SWAT to Compute Groundwater Table Depth and Streamflow in the Muscatatuck River Watershed. Trans. ASAE Am. Soc. Agric. Eng. 2005, 48, 991–1003. [Google Scholar] [CrossRef]
  50. Gupta, H.V.; Sorooshian, S.; Yapo, P.O. Status of automatic calibration for hydrologic models: Comparison with multilevel expert calibration. J. Hydrol. Eng. 1999, 4, 135–143. [Google Scholar] [CrossRef]
  51. Moriasi, D.N.; Arnold, J.G.; Liew, M.W.V.; Bingner, R.L.; Harmel, R.D.; Veith, T.L. Model Evaluation Guidelines for Systematic Quantification of Accuracy in Watershed Simulations. Trans. ASABE 2007, 50, 885–900. [Google Scholar] [CrossRef]
  52. Zhang, L.; Dawes, W.R.; Walker, G.R. Response of mean annual evapotranspiration to vegetation changes at catchment scale. Water Resour. Res. 2001, 37, 701–708. [Google Scholar] [CrossRef]
  53. Yang, J.U.; Zhang, Q.G.; Yang, Y.M.; Xie, H.P.; Gao, F.; Wang, H.J. An experimental investigation on the mechanism of fluid flow through single rough fracture of rock. Sci. China Technol. Sci. 2013, 56, 2070–2080. [Google Scholar]
  54. Abbaspour, K.C.; Yang, J.; Maximov, I.; Siber, R.; Bogner, K.; Mieleitner, J.; Zobrist, J.; Srinivasan, R. Modelling hydrology and water quality in the pre-alpine/alpine Thur watershed using SWAT. J. Hydrol. 2007, 333, 413–430. [Google Scholar] [CrossRef]
  55. Bacchus, S.; Masour, J.; Madden, M.; Jordan, T.; Meng, Q. Geospatial Analysis of Depressional Wetlands near Peace River Watershed Phosphate Mines, Florida, USA. Environ. Eng. Geosci. 2011, 17, 391–415. [Google Scholar] [CrossRef] [Green Version]
  56. Pigati, E.; López, D.L. Effect of subsidence on recharge at abandoned coal mines generating acidic drainage: The Majestic Mine, Athens County, Ohio. Mine Water Environ. 1999, 18, 45–66. [Google Scholar] [CrossRef]
  57. Li, S.; Chen, Y.F.; Li, Z.J.; Zhang, K. Applying a statistical method to streamflow reduction caused by underground mining for coal in the Kuye River basin. Sci. China Technol. Sci. 2016, 59, 1911–1920. [Google Scholar] [CrossRef]
  58. Carter, J.M.; Driscoll, D.G. Estimating recharge using relations between precipitation and yield in a mountainous area with large variability in precipitation. J. Hydrol. 2006, 316, 71–83. [Google Scholar] [CrossRef]
  59. Zheng, H.X.; Zhang, L.; Zhu, R.R.; Liu, C.M.; Sato, Y.; Fukushima, Y. Responses of streamflow to climate and land surface change in the headwaters of the Yellow River Basin. Water Resour. Res. 2009, 45, 641–648. [Google Scholar] [CrossRef]
  60. Wang, W.; Shao, Q.; Yang, T.; Peng, S.; Xing, W.; Sun, F.; Luo, Y. Quantitative assessment of the impact of climate variability and human activities on runoff changes: A case study in four catchments of the Haihe River basin, China. Hydrol. Process. 2013, 27, 1158–1174. [Google Scholar] [CrossRef]
Figure 1. The locations of the Huangbaihe River Basin, reservoirs, weather stations and phosphate mining sites.
Water 11 02039 g001
Figure 2. Inter-annual variation and general trend of streamflow and precipitation from 1978 to 2016. (a) Annual runoff (b) Annual precipitation.
Water 11 02039 g002
Figure 3. The variations of accumulative anomaly of runoff and precipitation.
Water 11 02039 g003
Figure 4. Comparison of runoff, precipitation and evapotranspiration in different periods.
Water 11 02039 g004
Figure 5. The relationships between year and accumulative runoff (a), between year and accumulative precipitation (b) and between year and accumulative evapotranspiration (c).
Water 11 02039 g005
Figure 6. Simulated and observed streamflow and corresponding monthly precipitation for the calibration (1979–1984) and validation (1985–2005).
Water 11 02039 g006
Figure 7. Comparison between annual observed runoff and simulated by SWAT model for the whole period (1978–2016).
Water 11 02039 g007
Figure 8. Correlation relationship between runoff and precipitation in P1 (pre-mining period) and P2 (post-mining period).
Water 11 02039 g008
Table 1. Summaries of precipitation and runoff in different decades.
Decade1978–19791980–19891990–19992000–20092010–2016Mean
Precipitation (mm)1117.71088.4869.29771092.81005.9
Distance to mean (%)11.18.2−13.6−2.98.6
Runoff (mm)479.8487.1434.9453.0440.3458.8
Distance to mean (%)4.66.2−5.2−1.3−4.0
Runoff coefficient0.430.440.490.470.410.46
Distance to mean (%)−5.63.17.74.1−10.9
Table 2. Statistics of Mann-Kendall trend test with Sen’s slope analysis for annual runoff and precipitation data.
Zβ (mm/year)Significance level
Annual runoff−0.44−0.005ns
Annual precipitation−0.17−0.003ns
Annual evapotranspiration3.790.06y
Annual Runoff coefficient−0.82−0.01ns
Note: Z is the Mann-Kendall statistic; β is the trend magnitude; ns indicates the trend is not significant; y indicates the trend is significant.
Table 3. Summary of the annual precipitation and runoff in different periods.
PeriodsMean Annual Runoff (mm)Mean Annual Evapotranspiration (mm) aMean Annual Precipitation (mm)Mean Fraction of Forest CoverEvapotranspiration (mm) b
Baseline period Ta532.7784.71186.80.886919.5
Change period Tb431.7796.4881.10.891747.7
Change period Tc466.8840.51129.20.882889.2
Note: Baseline period Ta (1978–1984); Change period Tb (1985–2005); Change period Tc (2006–2016). Mean is the mean of precipitation, runoff and evapotranspiration data. a: The evapotranspiration data was obtained from global land evaporation Amsterdam model (GLEAM) (https://www.gleam.eu/). b: Evapotranspiration was calculated by using Equation (11). The mean fraction of forest cover in each period was calculated based on the land use maps in 1980, 1995, 2000 and 2008 provided by Resource and Environment Data Cloud Plat From, Institute of Geographic Sciences and Natural Resources Research of Chinese Academy of Sciences (CAS) (http://www.resdc.cn/). The value of mean fraction of forest cover in Tb is the mean forest cover in 1995 and 2000.
Table 4. Extracted slopes from the relationships between accumulative quantities and year in different periods.
PeriodBaseline Period Ta (1978–1984)Change Period Tb (1985–2005)Change Period Tc (2006–2016)
The slope between accumulative runoff and year (SR: mm/year) 532.9439.1461.5
The slope between accumulative precipitation and year (SP: mm/year)1213.8873.91118.6
The slope between accumulative evapotranspiration and year (SET: mm/year) a776.4796.5835.5
Note: a: Evapotranspiration was calculated using the GLEAM data (https://www.gleam.eu/).
Table 5. Contributions rates of climate change and anthropogenic activities to runoff variation by Slope Change Ratio of Accumulative Quantity (SCRAQ) method.
Influencing FactorContribution Rate to Runoff Change Based on Ta (1978–1984) (%)
Tb (1985–2005)Tc (2006–2016)
Contribution of precipitation (Cp)159.158.5
Contribution of evapotranspiration (CET) a13.956.7
Contribution of evapotranspiration (CET) b−98.6−37.8
Contribution of climate change (Cp+ CET) a173115.2
Contribution of human activities (CH)−73−15.2
Contribution of climate change (Cp+ CET) b60.520.7
Contribution of human activities (CH)39.579.3
a: Evapotranspiration was calculated using the GLEAM data (https://www.gleam.eu/);b: Evapotranspiration was calculated by the Equation (11).
Table 6. Optimal parameters for the Soil Water and Assessment Tool (SWAT) model.
ParameterDescriptionSensitivity RankOriginal ValuesOptimal Value
r__SOL_BD.solMoist bulk density1−0.5~0.50.22
r__CN2.mgtSCS runoff curve number2−0.5~0.5−0.45
v__ESCO.hruSoil evaporation compensation factor30.01~10.7
r__HRU_SLP.hruAverage slope steepness4−0.5~0.50.69
v__ALPHA_BF.gwBaseflow alpha factor (days)50~10.8
r__SOL_K.solSaturated hydraulic conductivity6−0.5~0.50.53
v__RCHRG_DP.gwDeep aquifer percolation fraction70~10.72
r__SLSUBBSN.hruAverage slope length8−0.5~0.5−0.4
r__SOL_Z.solDepth from soil surface to bottom of layer9−0.5~0.5−0.58
r__SOL_AWC.solAvailable water capacity of the soil layer10−0.5~0.5−0.16
v__GWQMN.gwThreshold depth of water in the shallow aquifer required for return flow to occur (mm)110~1000661.51
v__CH_K2.rteEffective hydraulic conductivity in main channel alluvium120~10042.87
v__EPCO.hruPlant uptake compensation factor130.01~10.81
v__SURLAG.bsnSurface runoff lag time141~247.48
Note: v: initial parameter value is replaced by an active value; r: initial value is changed by multiplying (1+ a given value) [53].
Table 7. Performance values of the SWAT model for the calibration and validation periods.
PeriodNSEPBIAS (%)RSRR2p-factorr-factor
Calibration period (1979−1984)0.86−10.750.380.880.840.78
Validation period (1985−2005)0.74−4.880.510.740.690.67
Overall0.78−6.490.460.79
Table 8. Contribution rates of climate change and anthropogenic activities to runoff variations using SWAT model.
PeriodRunoff Observation (m3/s)Runoff Simulation (m3/s)CC (%)CH (%)
Baseline period Ta (1978–1984)9.22
Change period Tb (1985–2005)7.237.7474.425.6
Change period Tc (2006–2016)8.219.0813.986.1
Note: CC and CH represent the contributions of climate change and anthropogenic activities to variation in the runoff, respectively.
Table 9. Land use areas in 1980, 1995 and 2008.
PeriodAreas (km2)
AgricultureForestGrasslandWater
198043.57490.2117.831.99
199532.66498.1315.836.92
200840.58488.2220.803.99
Note: Ta, Tb and Tc represent the periods of 1978–1984, 1985–2005 and 2006–2016, respectively.

