Heterogeneity and Anthropogenic Impacts on a Small Lowland Stream
by
Imre Somlyai
1,5,*, 
Csaba Berta
1,5,
Sándor Alex Nagy
1,
György Dévai
1,
Éva Ács
2,4, 
László József Szabó
1,
János Nagy
3 and
István Grigorszky
1 
1
Department of Hydrobiology, University of Debrecen, Egyetem tér 1., H-4032 Debrecen, Hungary
2
Hungarian Academy of Sciences, Centre for Ecological Research, Danube Research Institute, Karolina út 29-31., H-1113 Budapest, Hungary
3
Department of Land Use, University of Debrecen, Böszörményi út 138., H-4032 Debrecen, Hungary
4
Faculty of Water Sciences, National University of Public Service, Bajcsy-Zsilinszky utca 12-14., H-6500 Baja, Hungary
5
Pál Juhász-Nagy Doctoral School of Biology and Environmental Sciences, University of Debrecen, Egyetem tér 1., H-4032 Debrecen, Hungary
*
Author to whom correspondence should be addressed.
Water 2019, 11(10), 2002; https://doi.org/10.3390/w11102002
Submission received: 2 August 2019
/
Revised: 19 September 2019
/
Accepted: 24 September 2019
/
Published: 26 September 2019
(This article belongs to the Special Issue Chemical and Biochemical Processes of Watershed Ecosystems and Their Impacts on Water Quality)
Abstract
:During our work, we investigated the physical and chemical variables of a small surface watercourse to investigate how different anthropogenic effects affect its water quality. Along this small watercourse, there are well-separated areas that are affected by various anthropogenic effects. In addition to its origin and branches, in many places it is surrounded by agricultural land with insufficient buffer zones, which burdens the small watercourse with nitrogen and phosphorus forms. In the lower stages, artificial damming inhibits the natural flow of the Tócó Canal, thereby creating eutrophicated stagnant water areas. This is further strengthened by, in many cases, illegal communal and used water intake that further burdens the small watercourse. Considering the experience of our investigation, it can be stated that the examined small watercourse could barely suffer human impacts, and it could be described with great heterogeneity using physical and chemical variables. We experienced that this heterogeneity caused by anthropogenic effects appeared in all hydrologic states and seasons. Furthermore, our research showed that these small watercourses had such high heterogeneity that their monitoring and examination should be taken just as seriously as when it comes to larger watercourses.
1. Introduction
Human settlements are typically located alongside the banks of larger and smaller rivers [1]. Often these are the only watercourses or surface waters in the vicinity of the settlement, so they have a much greater value for such a settlement than their size might indicate [2]. The water quality of a small watercourse may further deteriorate in relation to climate change [3], and the decrease in water flow due to the lack of precipitation may mean that it becomes intermittent [4,5,6]. In the case of Mediterranean streams and rivers, Reference [7] found evidence that they become temporary waters or even dry out during drought periods. Some research has proposed that temporary water bodies are the most complex and dynamic ecosystems [8]. For settlements, watercourses are of crucial importance from economic, tourist, recreational, and urban points of view. Because watercourses that affect inhabited areas are exposed to different anthropogenic effects, gaining information about the quality of running water systems is necessary for different purposes, such as irrigation or domestic use [9,10,11,12,13].
Numerous studies have dealt with larger rivers and streams. The processes that take place within them and the events that have affected them, including climate change and various human activities, have been extensively studied [14,15,16,17]. Different types of land use have different effects on water quality in watercourses [18]. Various studies have shown that water pollution is derived from different sources. Human activities also play a significant role in the nutrient cycle of water [19,20], and the accumulation of nutrients often leads to an increase in the trophic level of water [21]. In the case of urban land uses, the most common contamination is caused by detergents, urban and industrial leaching, and surface runoff [22]. Contamination is also caused by agricultural land uses [23], with the most common being caused by chemical and biological fertilizers.
However, little research has been done on smaller watercourses. It is important to know the processes that occur in small watercourses, as their catchment areas are affected by increasing agricultural and forestry utilization [24,25]. Ultimately, small watercourses create the lower sections of streams, so their impact is not negligible [26]. In many cases, small watercourses react more responsively and sooner to the effects that occur only later in our larger waters, so they can play a kind of predictive role. Contamination frequently limits available water resources [27,28,29,30], so the protection of running-water systems from contamination would be cost effective [31]. Deteriorating water quality can also be a damaging process for settlements, adversely affecting water resources and also jeopardizing urban planning processes and recreational opportunities for residents, which can also be seen in declining tourist indicators.
For small watercourses, the European Union Water Framework Directive (EU WFD) considers a comprehensive, large-scale study to be necessary. Often, only one or two sampling points are required to cover the length of the entire watercourse. Since these small watercourses have many and varied effects, which begin at their emergence, the sampling scale recommended by the EU WFD is unable to track and characterize the effects and changes in these small watercourses and their living community. It is particularly important to obtain a finer resolution of the small watercourses whose origins are in near-natural environments, possibly with any anthropogenic effects, and then also in their lower reaches, where they are also affected by metropolitan areas [8,18,23,24]. Current water rating systems attach less importance to small watercourses due to their water flow.
Our research object was a small watercourse, the Tócó Canal, which plays a regionally important role, as there is no large river or other watercourse nearby. Its origin is in an agricultural field, and it flows through several settlements, including a small town, as well as a regional metropolitan area [32,33,34,35,36], which means it collects wastewater (from more than 200,000 people) along with rainwater and then flows into the River Tisza and ultimately into the Danube.
Our goal was to separate sections of a small watercourse with different characteristics and different anthropogenic loads in different seasons based on physical and chemical variables and to detect the changes in anthropogenic effects caused by the water quality change.
2. Materials and Methods
The Tócó Canal is located in a north–south orientation in the eastern region of Hungary. Its catchment area has been hit very hard by climate change due to changes in the annual amount and temporal distribution of precipitation. Its water supply relies heavily on groundwater kit. The region’s major watercourse is the River Tisza, which regularly flooded the area in the past, ensuring a water supply for the wetlands in this area. The wetlands area was reduced by the regulation of the Tisza, and the typical land use of the area has changed, with intensive arable farming becoming more characteristic. Furthermore, the proportion of forest-covered areas has also been reduced, which has had a more negative influence on the balance of soil water. Consequently, in many cases, the remaining wetlands have continued to dry out or shrink. Due to all of these factors, the role of the Tócó Canal has increased, since it has become the only watercourse in the area. Considering the fact that the Tócó Canal’s flow touches the region’s largest settlement, it has always had great economic significance. With regard to climate change, the region is characterized by an increasing lack of precipitation. According to a study dealing with the region’s precipitation and hydrological conditions, in the past 50 years the amount of rainfall has decreased, and because of that, some of the small watercourses have become temporary, such as the Tócó Canal [37]. While the Tócó Canal’s rate of flow in the 19th century provided for three water mills in Debrecen, now the riverbed often dries up, and a constant watercourse has become a periodic one. Today, this small watercourse suffers from agricultural activities in addition to modern urban problems. Consequently, we can say that along the Tócó Canal’s source and flow we can find a great diversity of landscape-use areas, including agricultural areas surrounded by smaller or larger buffer zones, livestock farms, and main roads and highways. In addition, it can flow through a rapidly developing small town—Debrecen-Józsa—and a large city—Debrecen—as well. Debrecen has more than 200,000 inhabitants, while Debrecen-Józsa has only 9500. The fact that it touches several protected natural areas of local significance is also of importance. Moreover, its geographic position and orientation in the region also mean it plays a significant role as a green corridor.
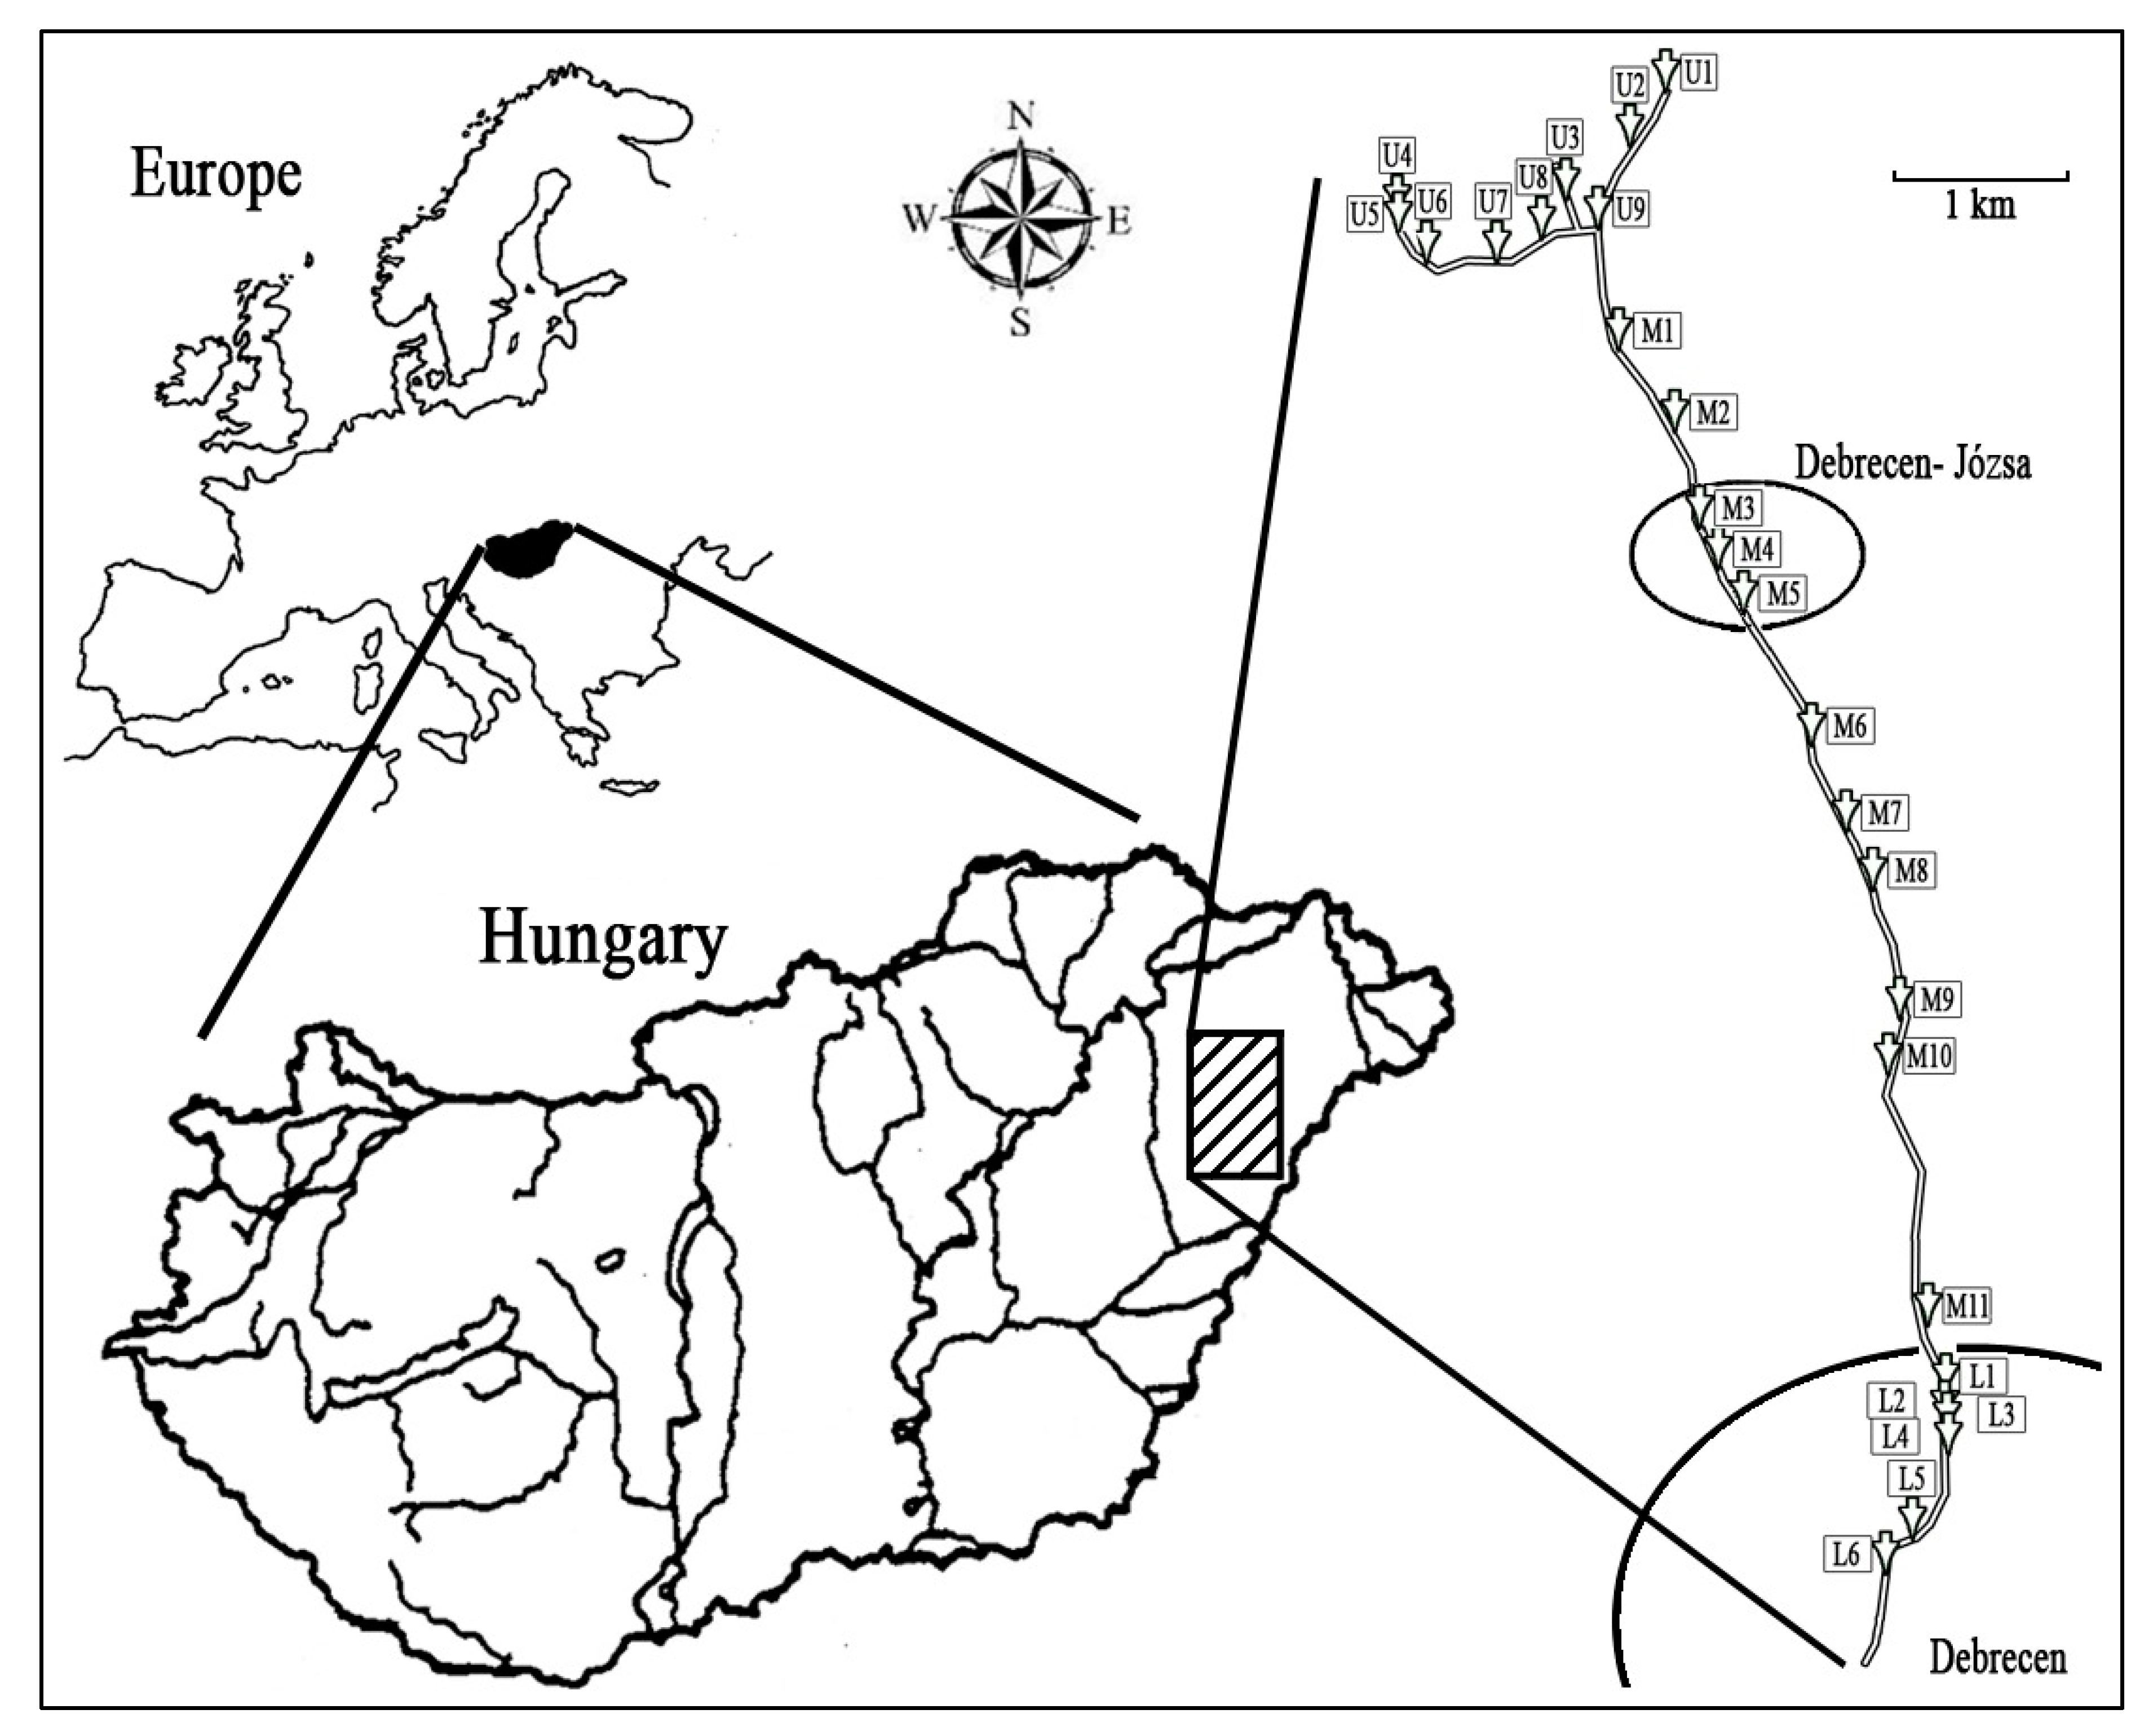
The sampling period lasted from 28 April 2013 to 31 March 2015. During this period, the Tócó Canal was studied in all typical seasons and under typical water conditions. Our sampling times were the following: 28 April 2013, 2 and 5 August 2014, 5 November 2014, and 31 March 2015 (the Tócó Canal dried out in different seasons of the year, and we were not able to track it over one year). We marked out our sampling sites from the source branches of the Tócó Canal—beyond Debrecen-Józsa—to main road No. 33 to Debrecen, a length of about 15 km.
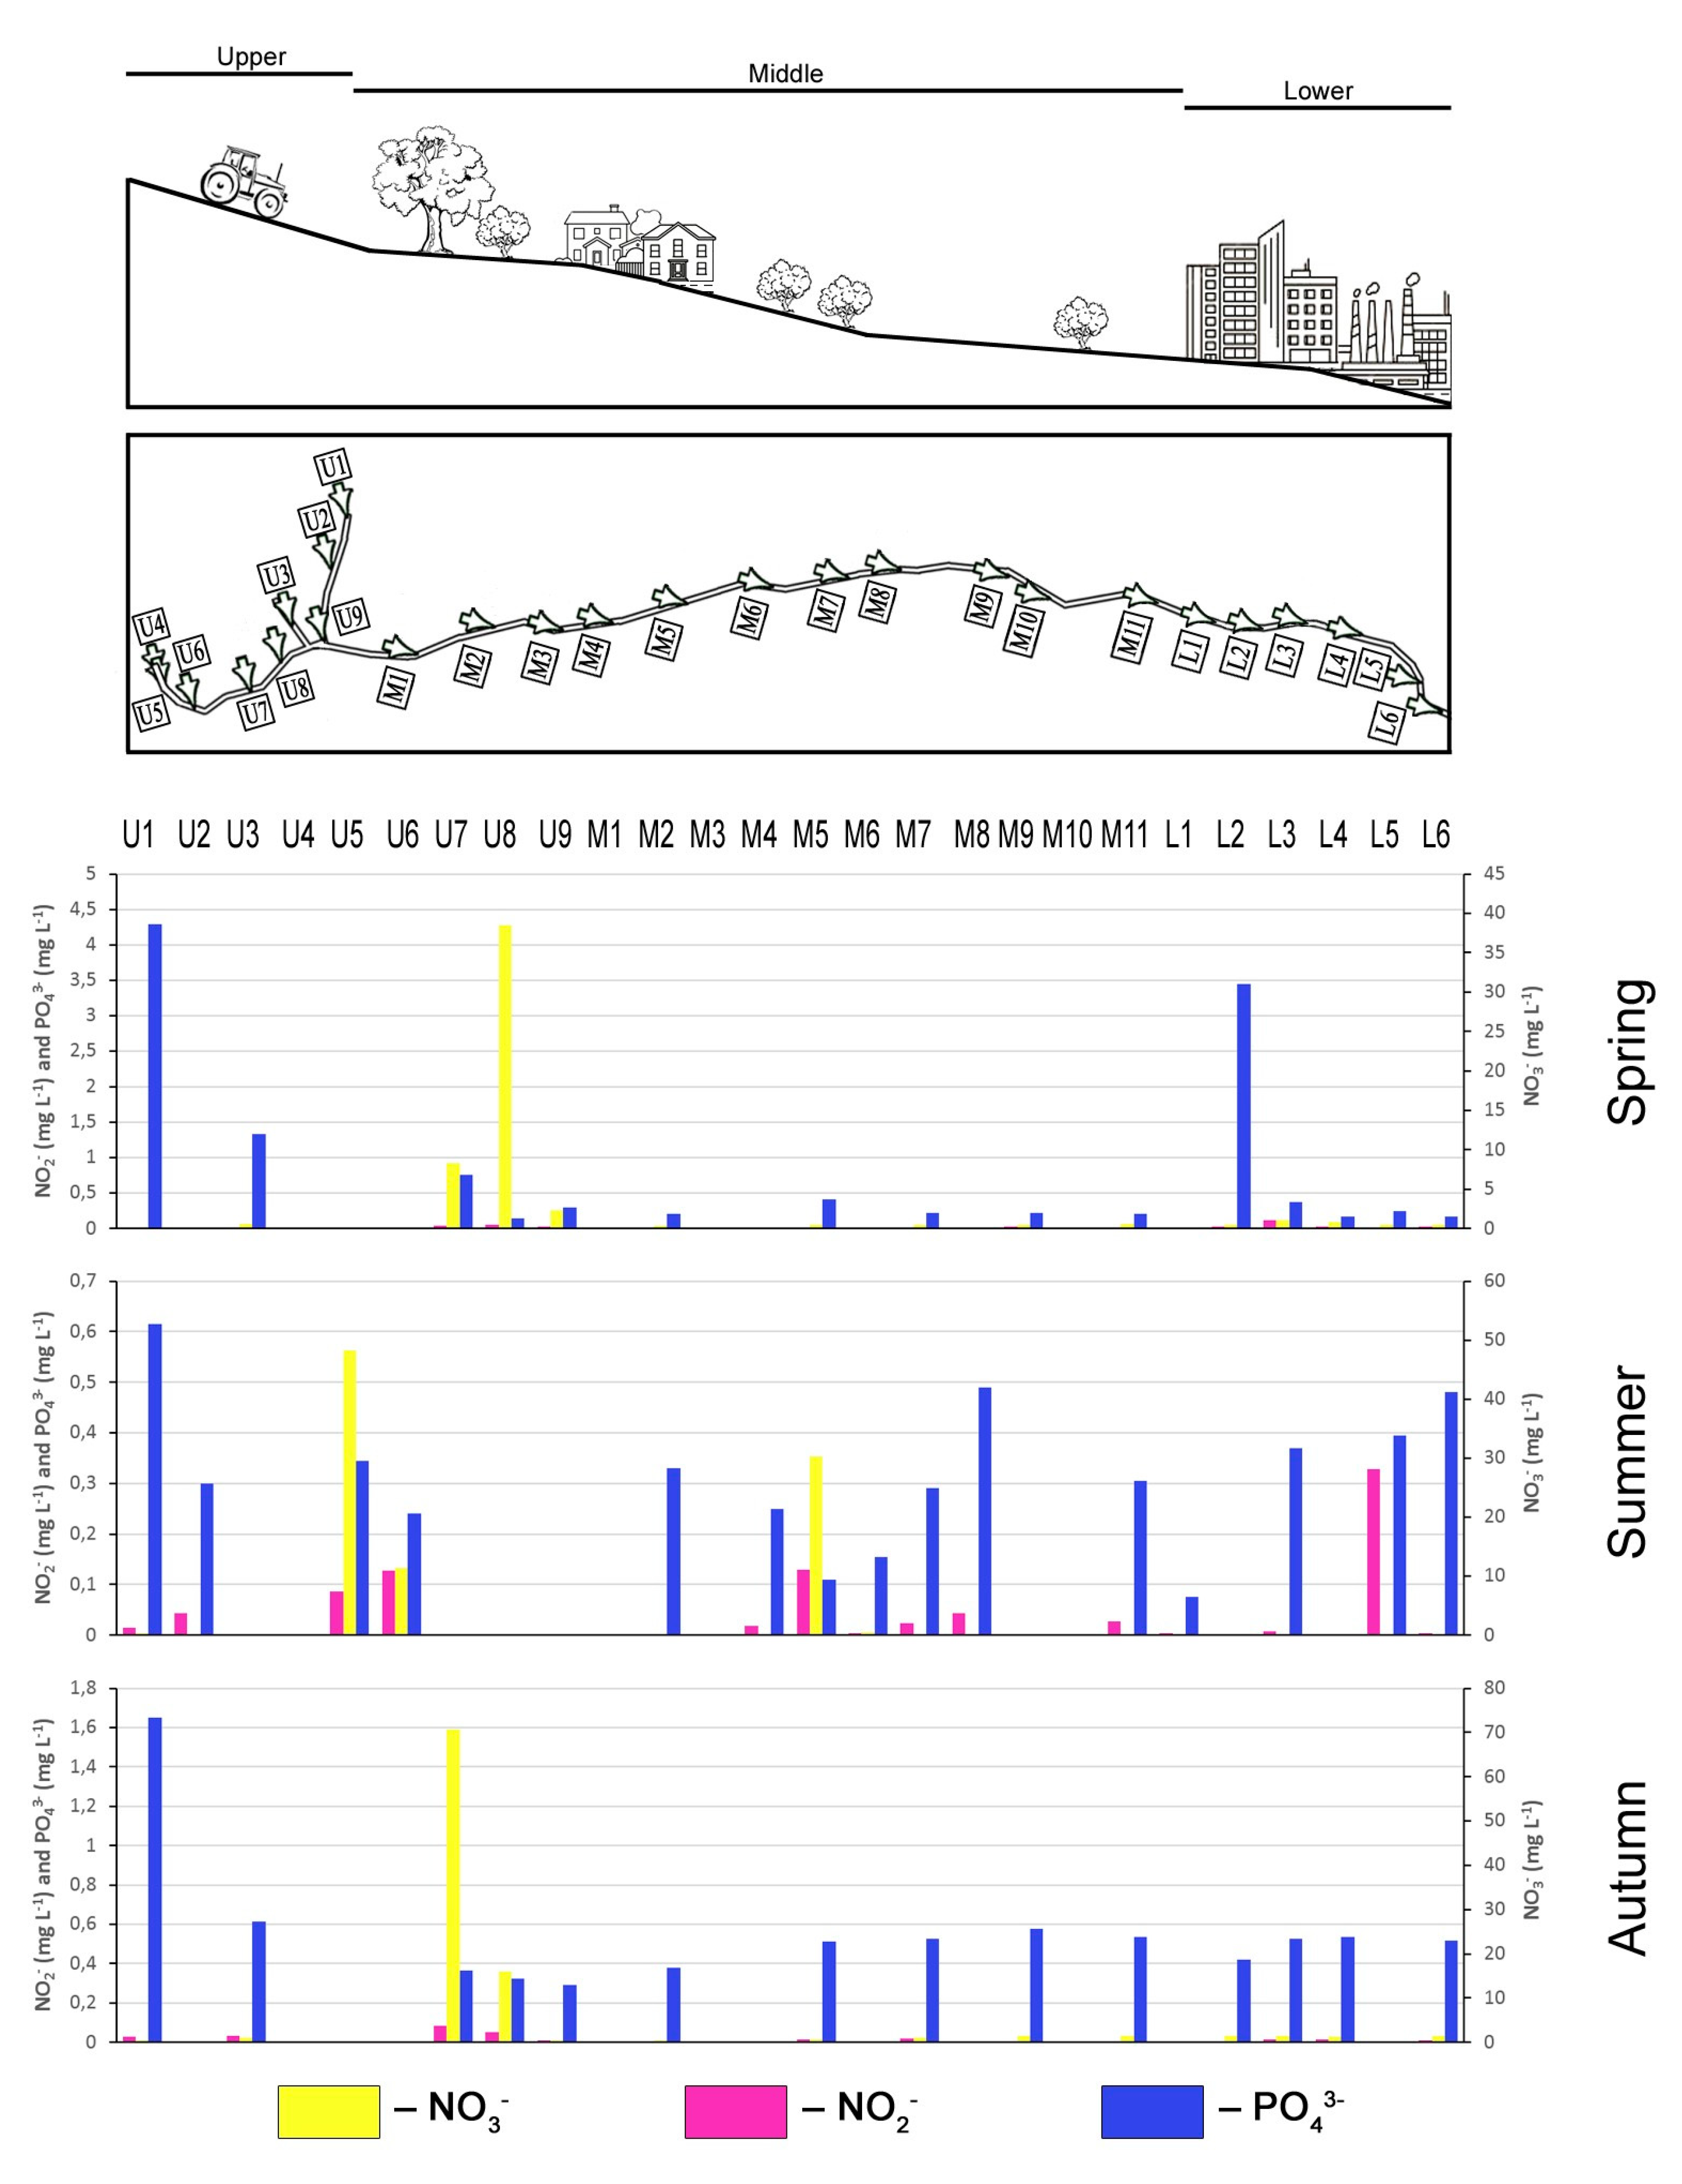
Three distinctly different areas could be distinguished along with the origin and flow of the small watercourse (Figure 1). In the Upper Area, there were the branches of the watercourse and the arable land surrounding them. In the Middle Area, the watercourse flowed through a relatively natural, well-preserved area and then touched a small town. The third area, the Lower Area, was a metropolitan area characterized by urban waterway interventions (damming, tight piercing) and regular rainwater discharge.
The positioning of the sampling point was done by a Garmin eTrex30 type Global Positioning System (GPS) device. At the sampling points (on the spot), we measured the temperature of water bodies, their pH levels, the conductivities, total dissolved solids, optical dissolved oxygen (%), optical dissolved oxygen (mg/l), turbidity (formazin nephelometric unit), chlorophyll-a (µg/l), blue-green algae (µg/l), fluorescent dissolved organic matter (relative fluorescence units), and fluorescent dissolved organic matter (quinine sulfate units) variables with YSI EXO-2-S3 equipment. During the laboratory tests, we detected nitrite ions, nitrate ions, dissolved orthophosphate ions, ammonium ions, and chemical oxygen demand (COD) based on the Methods for Chemical Analysis of Water and Wastes [38]. The determination of the nitrite ion concentration was based on United States Environmental Protection Agency (EPA) method 354.1, the nitrate ion concentration was based on EPA method 352.1, the definition of the orthophosphate ion concentration followed EPA method 365.3, the definition of the ammonium ion concentration was carried out according to EPA method 350.2, and the definition of the COD was carried out on the basis of EPA method 410.3.
Principal component analysis (PCA) was used to determine the key trends between the changes in the environmental variables and the sampling sites. The normal distribution of variables was checked using the Mardia test. Logarithm transformation was used to linearize the dataset. All data analysis was done with PAST (PAleontological STatistics) software.
In this present study, not all results are presented (only those datasets that were characteristic for certain seasons and water regimes), and we drew conclusions by analyzing these sets.
3. Results
3.1. Spring
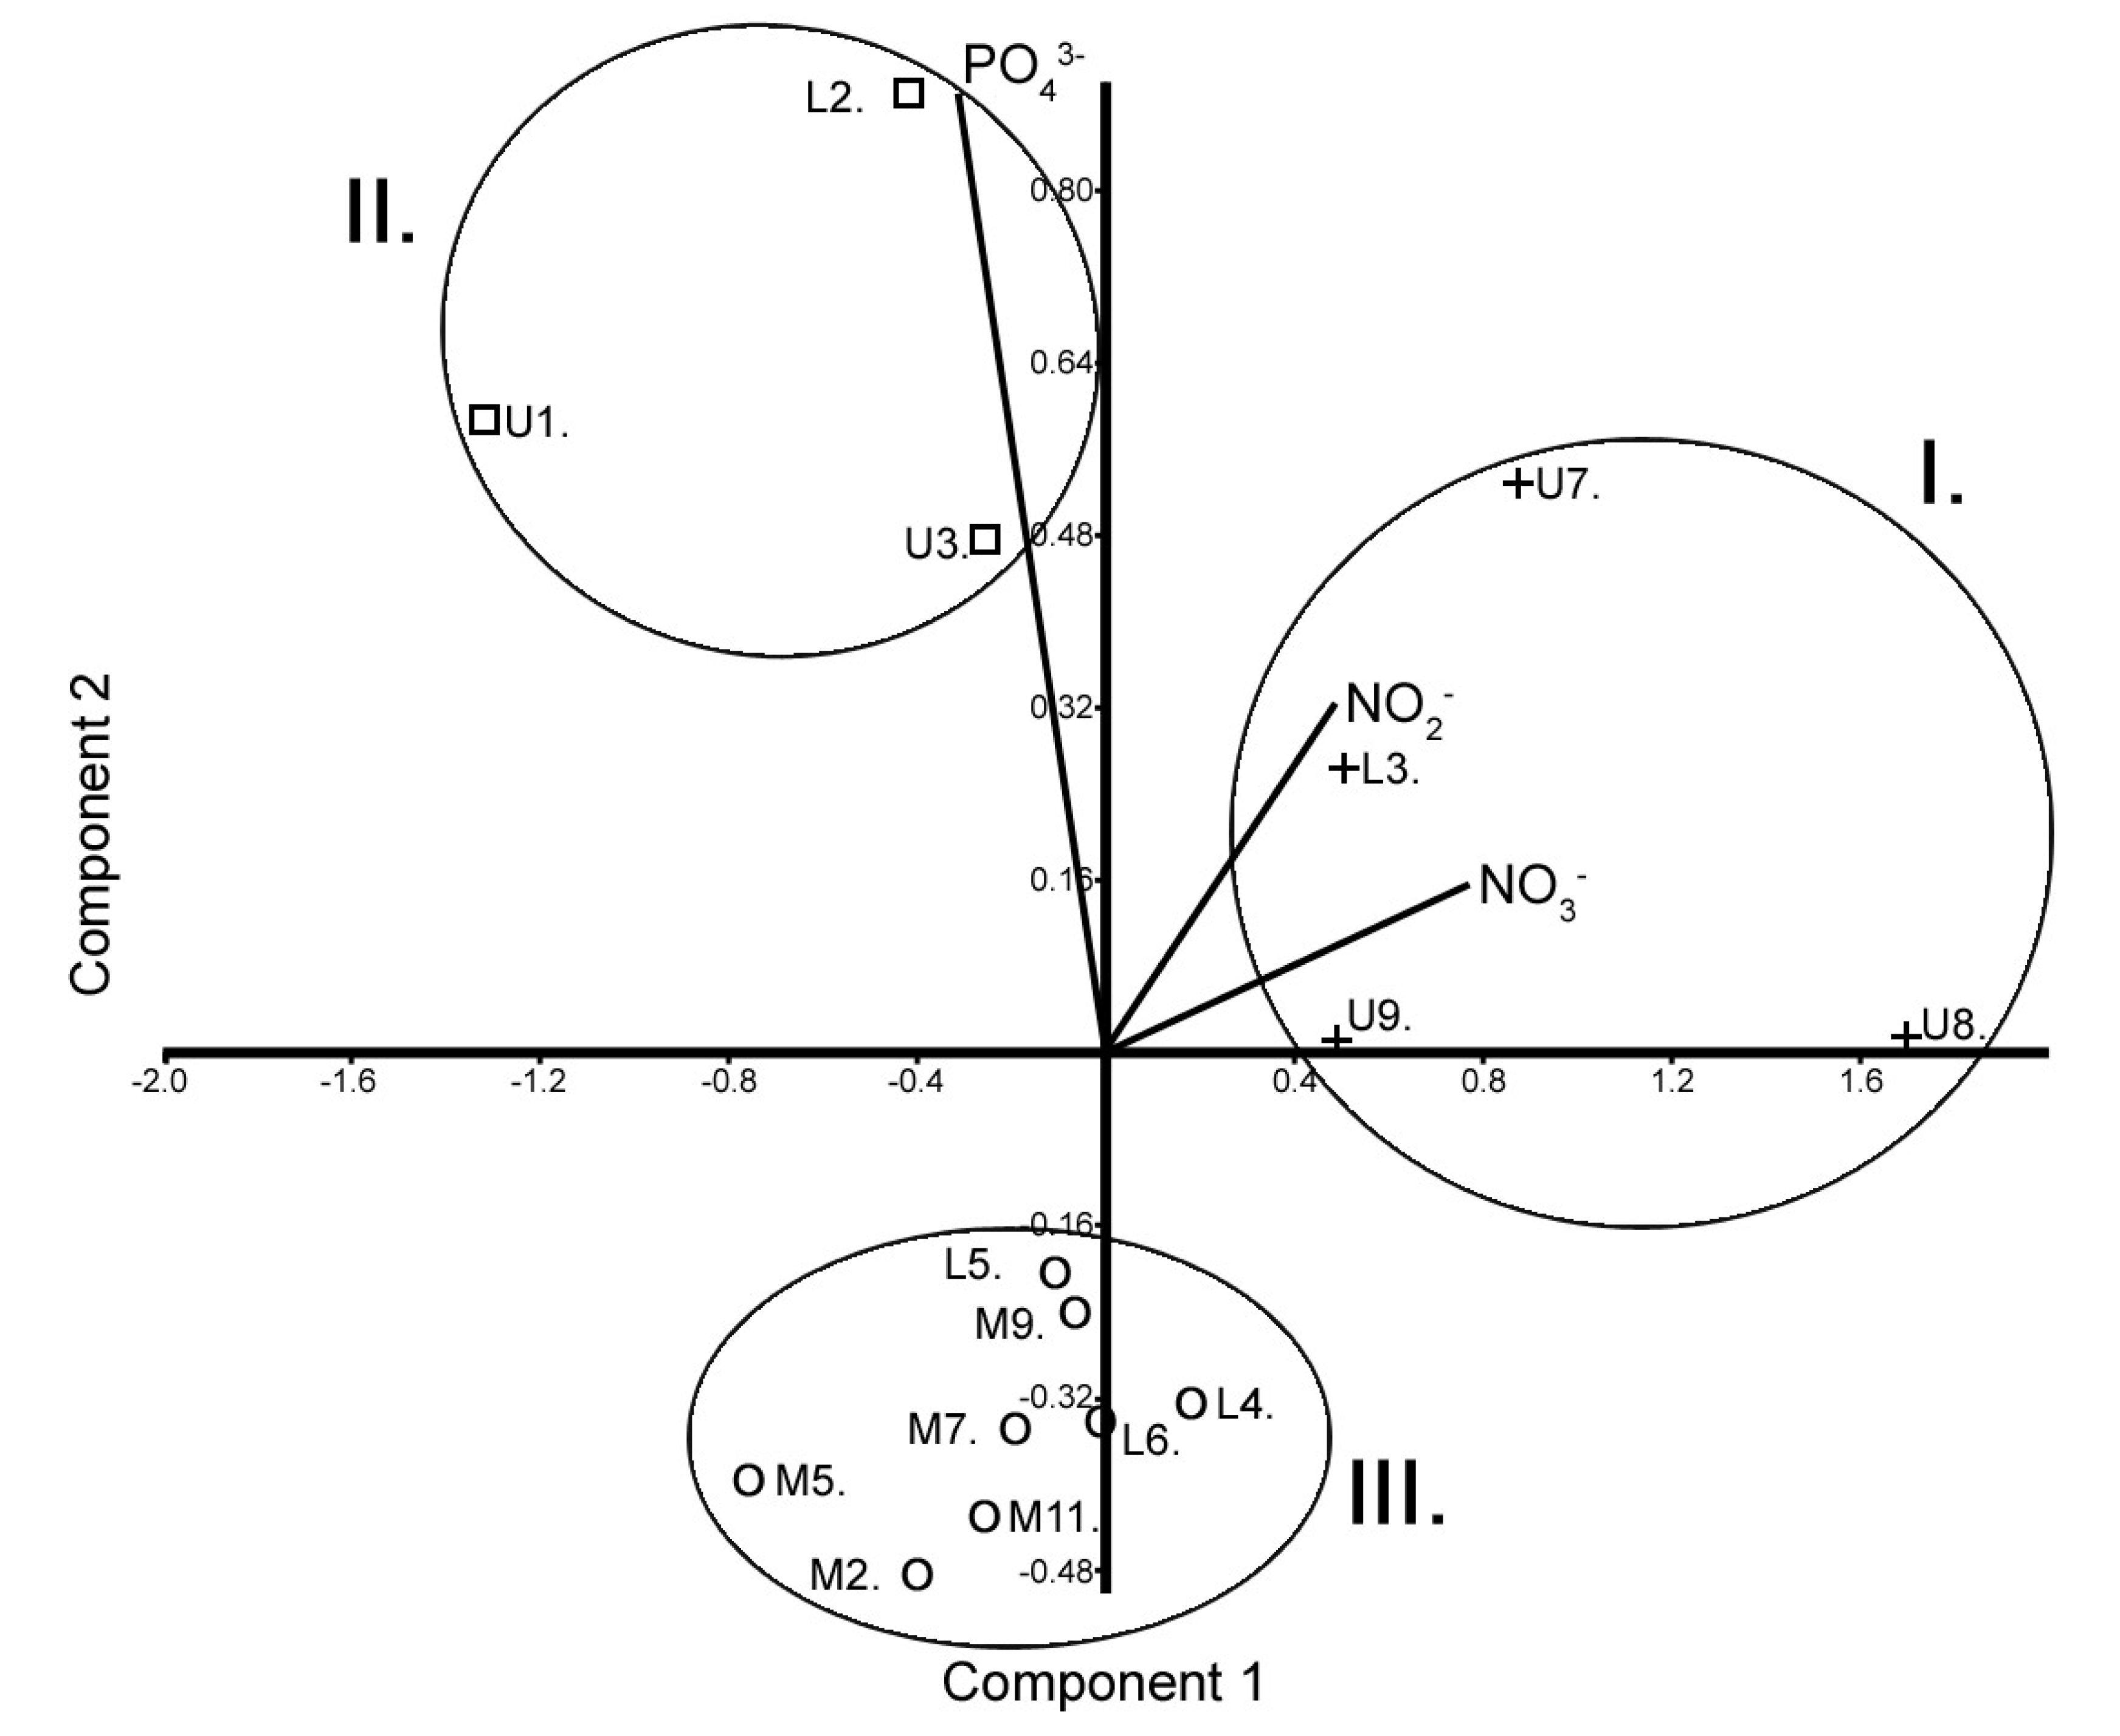
The spring period was characterized by the fact that the sampling points could be divided into three groups based on principal component analysis (Figure 2). The first axis explained 60.92% of the total variance, while the second axis explained 23.78% of the total variance. During the spring period, the sampling points U7, U8, U9, and L3 belonged to Group I due to the very high concentrations of nitrate and nitrite. Based on principal component analysis, the sampling points U1, U3, and L2 belonged to Group II due to the high orthophosphate ion concentrations. The sampling points of Group III were characterized by very low concentrations of nitrite, nitrate, and orthophosphate ion. Many of the points in this group originated from the Middle (small town) Area (M2, M5, M7, M9, and M11) and a smaller proportion from the Lower (metropolitan) Area (L4, L5, and L6).
3.2. Summer
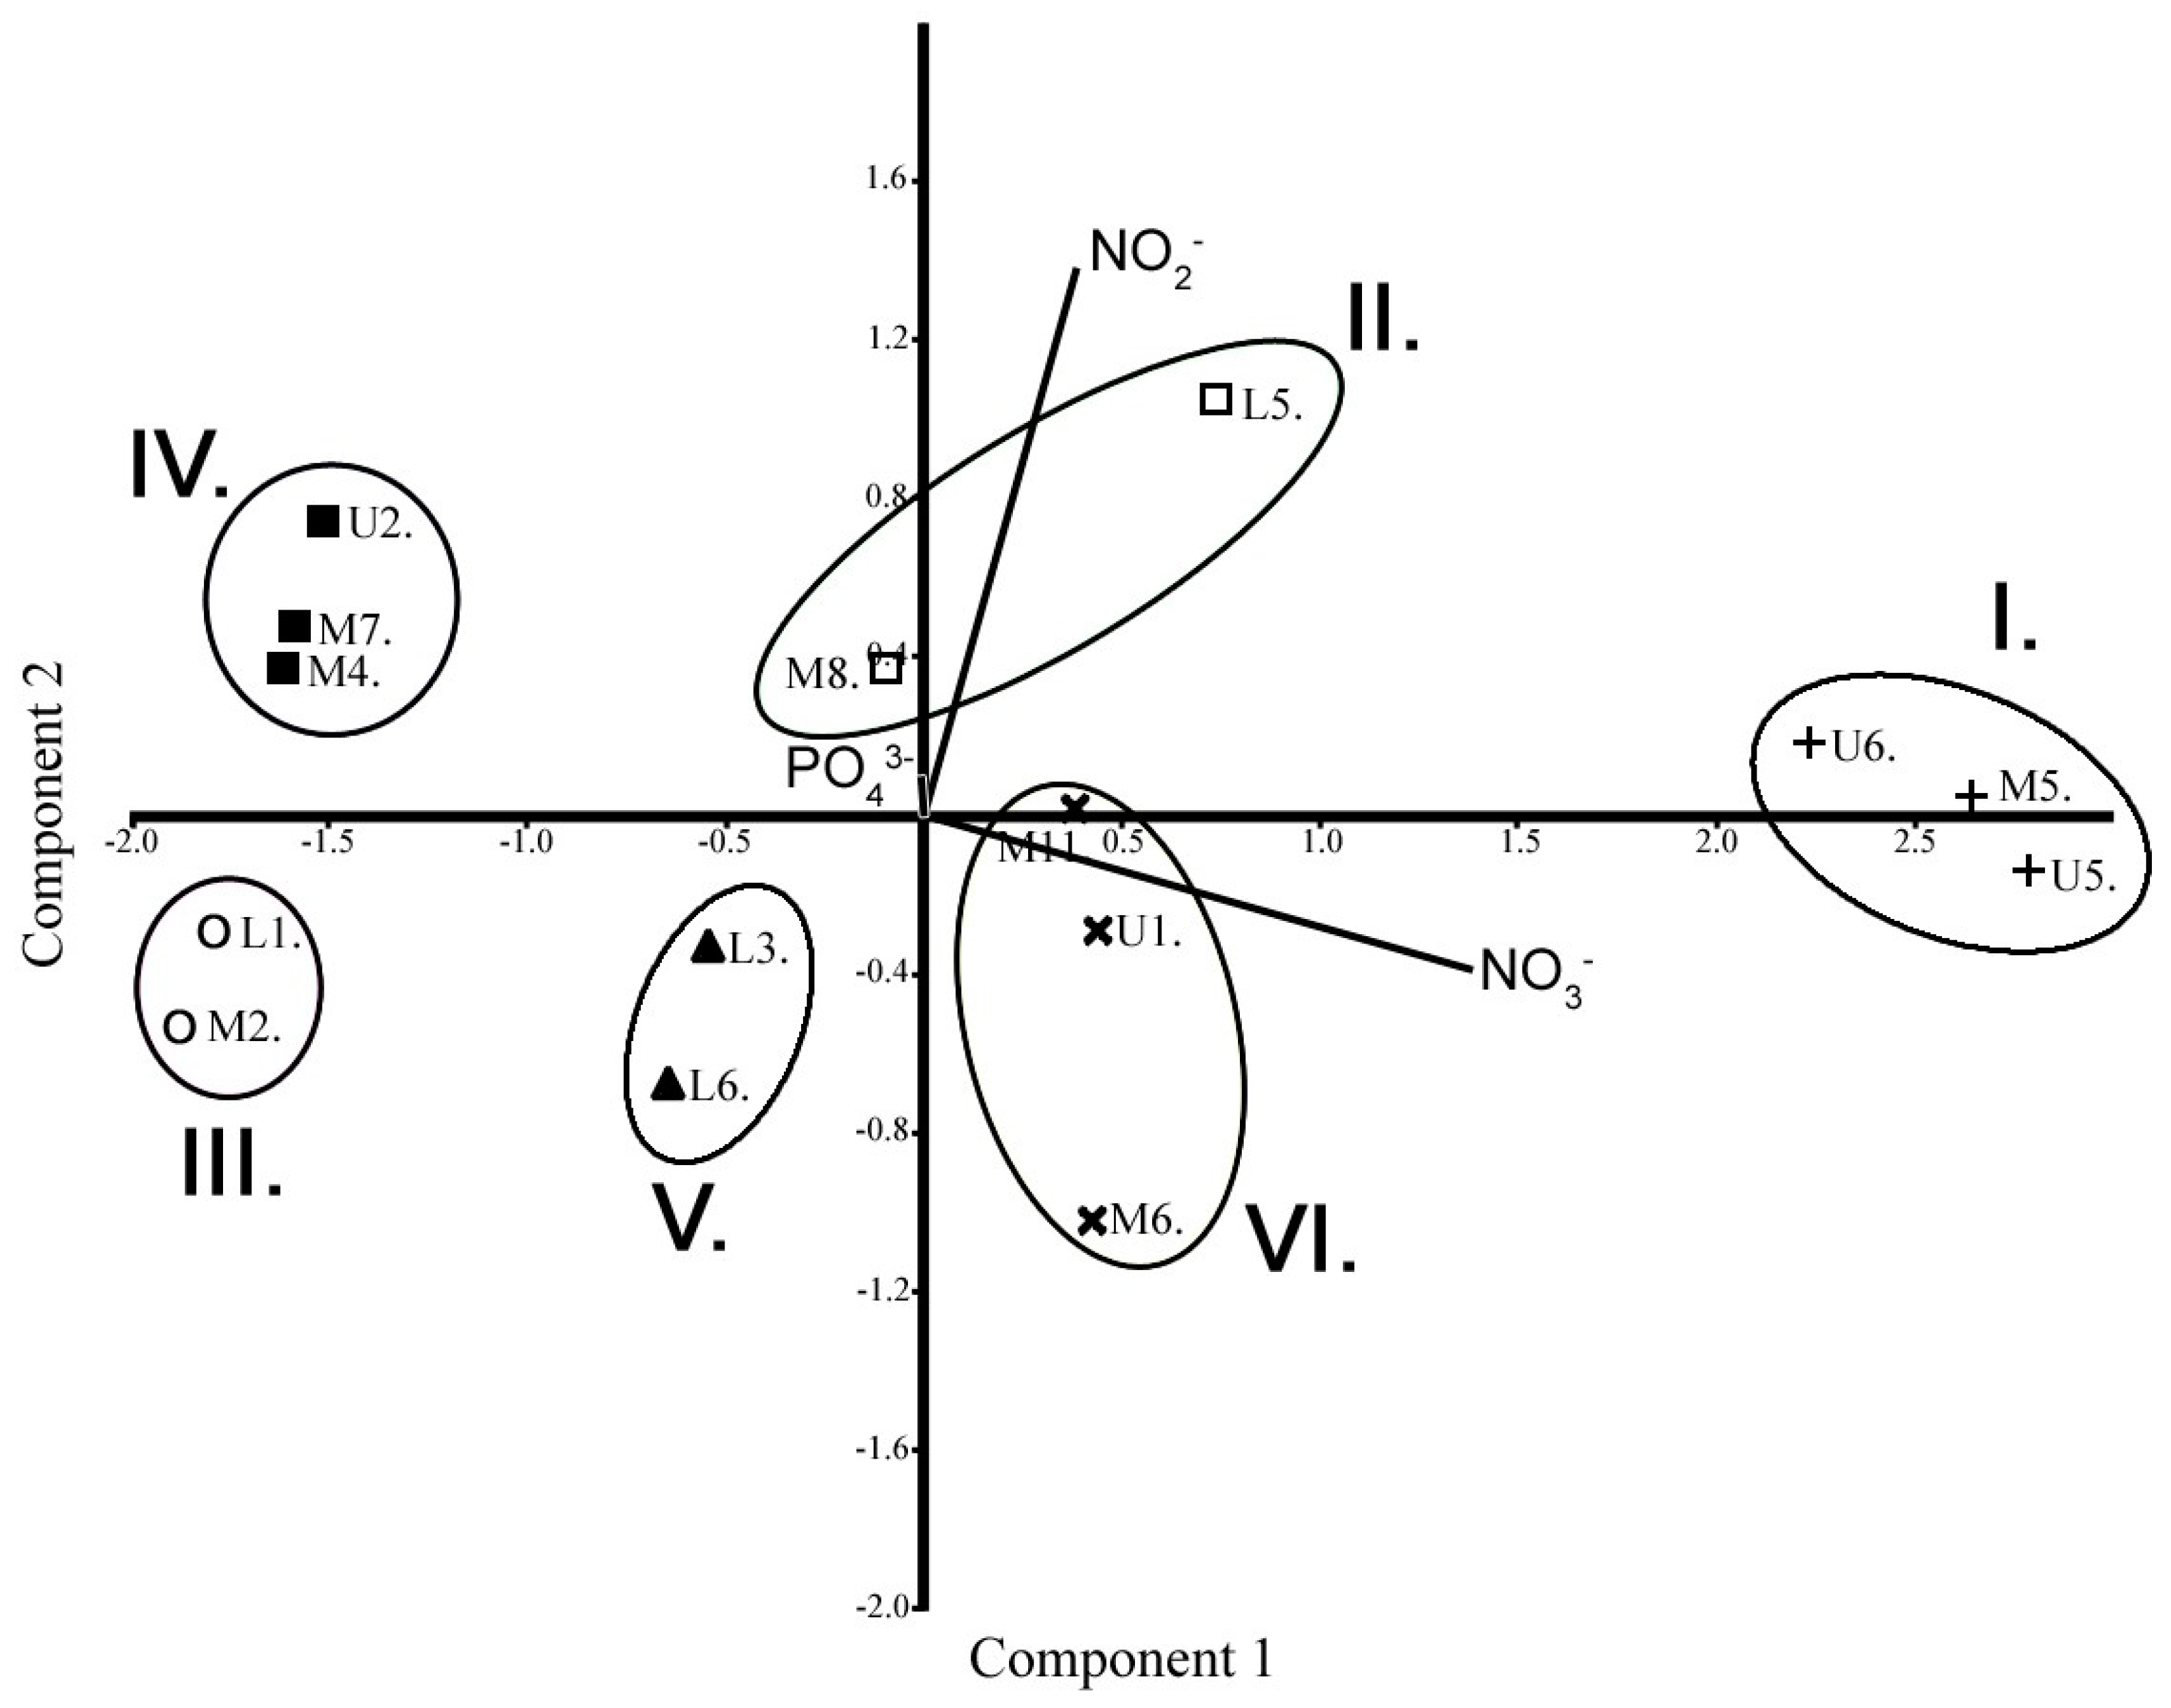
During the summer period, the sampling points could be divided into six groups based on principal component analysis (Figure 3). The first axis explained 87.49% of the total variance, while the second axis explained 10.42% of the total variance. According to the PCA carried out on the basis of the varying concentrations measured at the sampling points, this period was the most heterogeneous of the seasons examined. During the summer, sampling points U5, U8, and M5 belonged to Group I due to the high nitrate and nitrite concentrations. M8 and L5 belonged to Group II due to their high orthophosphate and nitrite concentrations. M2 and L1 belonged to Group III due to their low nitrite and nitrate concentrations. Based on principal component analysis, U2, M4, and M7 belonged to Group IV, which was characterized (in contrast to the previous group) only by a low nitrate ion concentration. Group V included sampling points L3 and L6 and was characterized by a low nitrite concentration. Based on principal component analysis, U1, M6, and M11 were included in Group VI, which was characterized by high nitrate and low nitrite concentrations.
3.3. Autumn
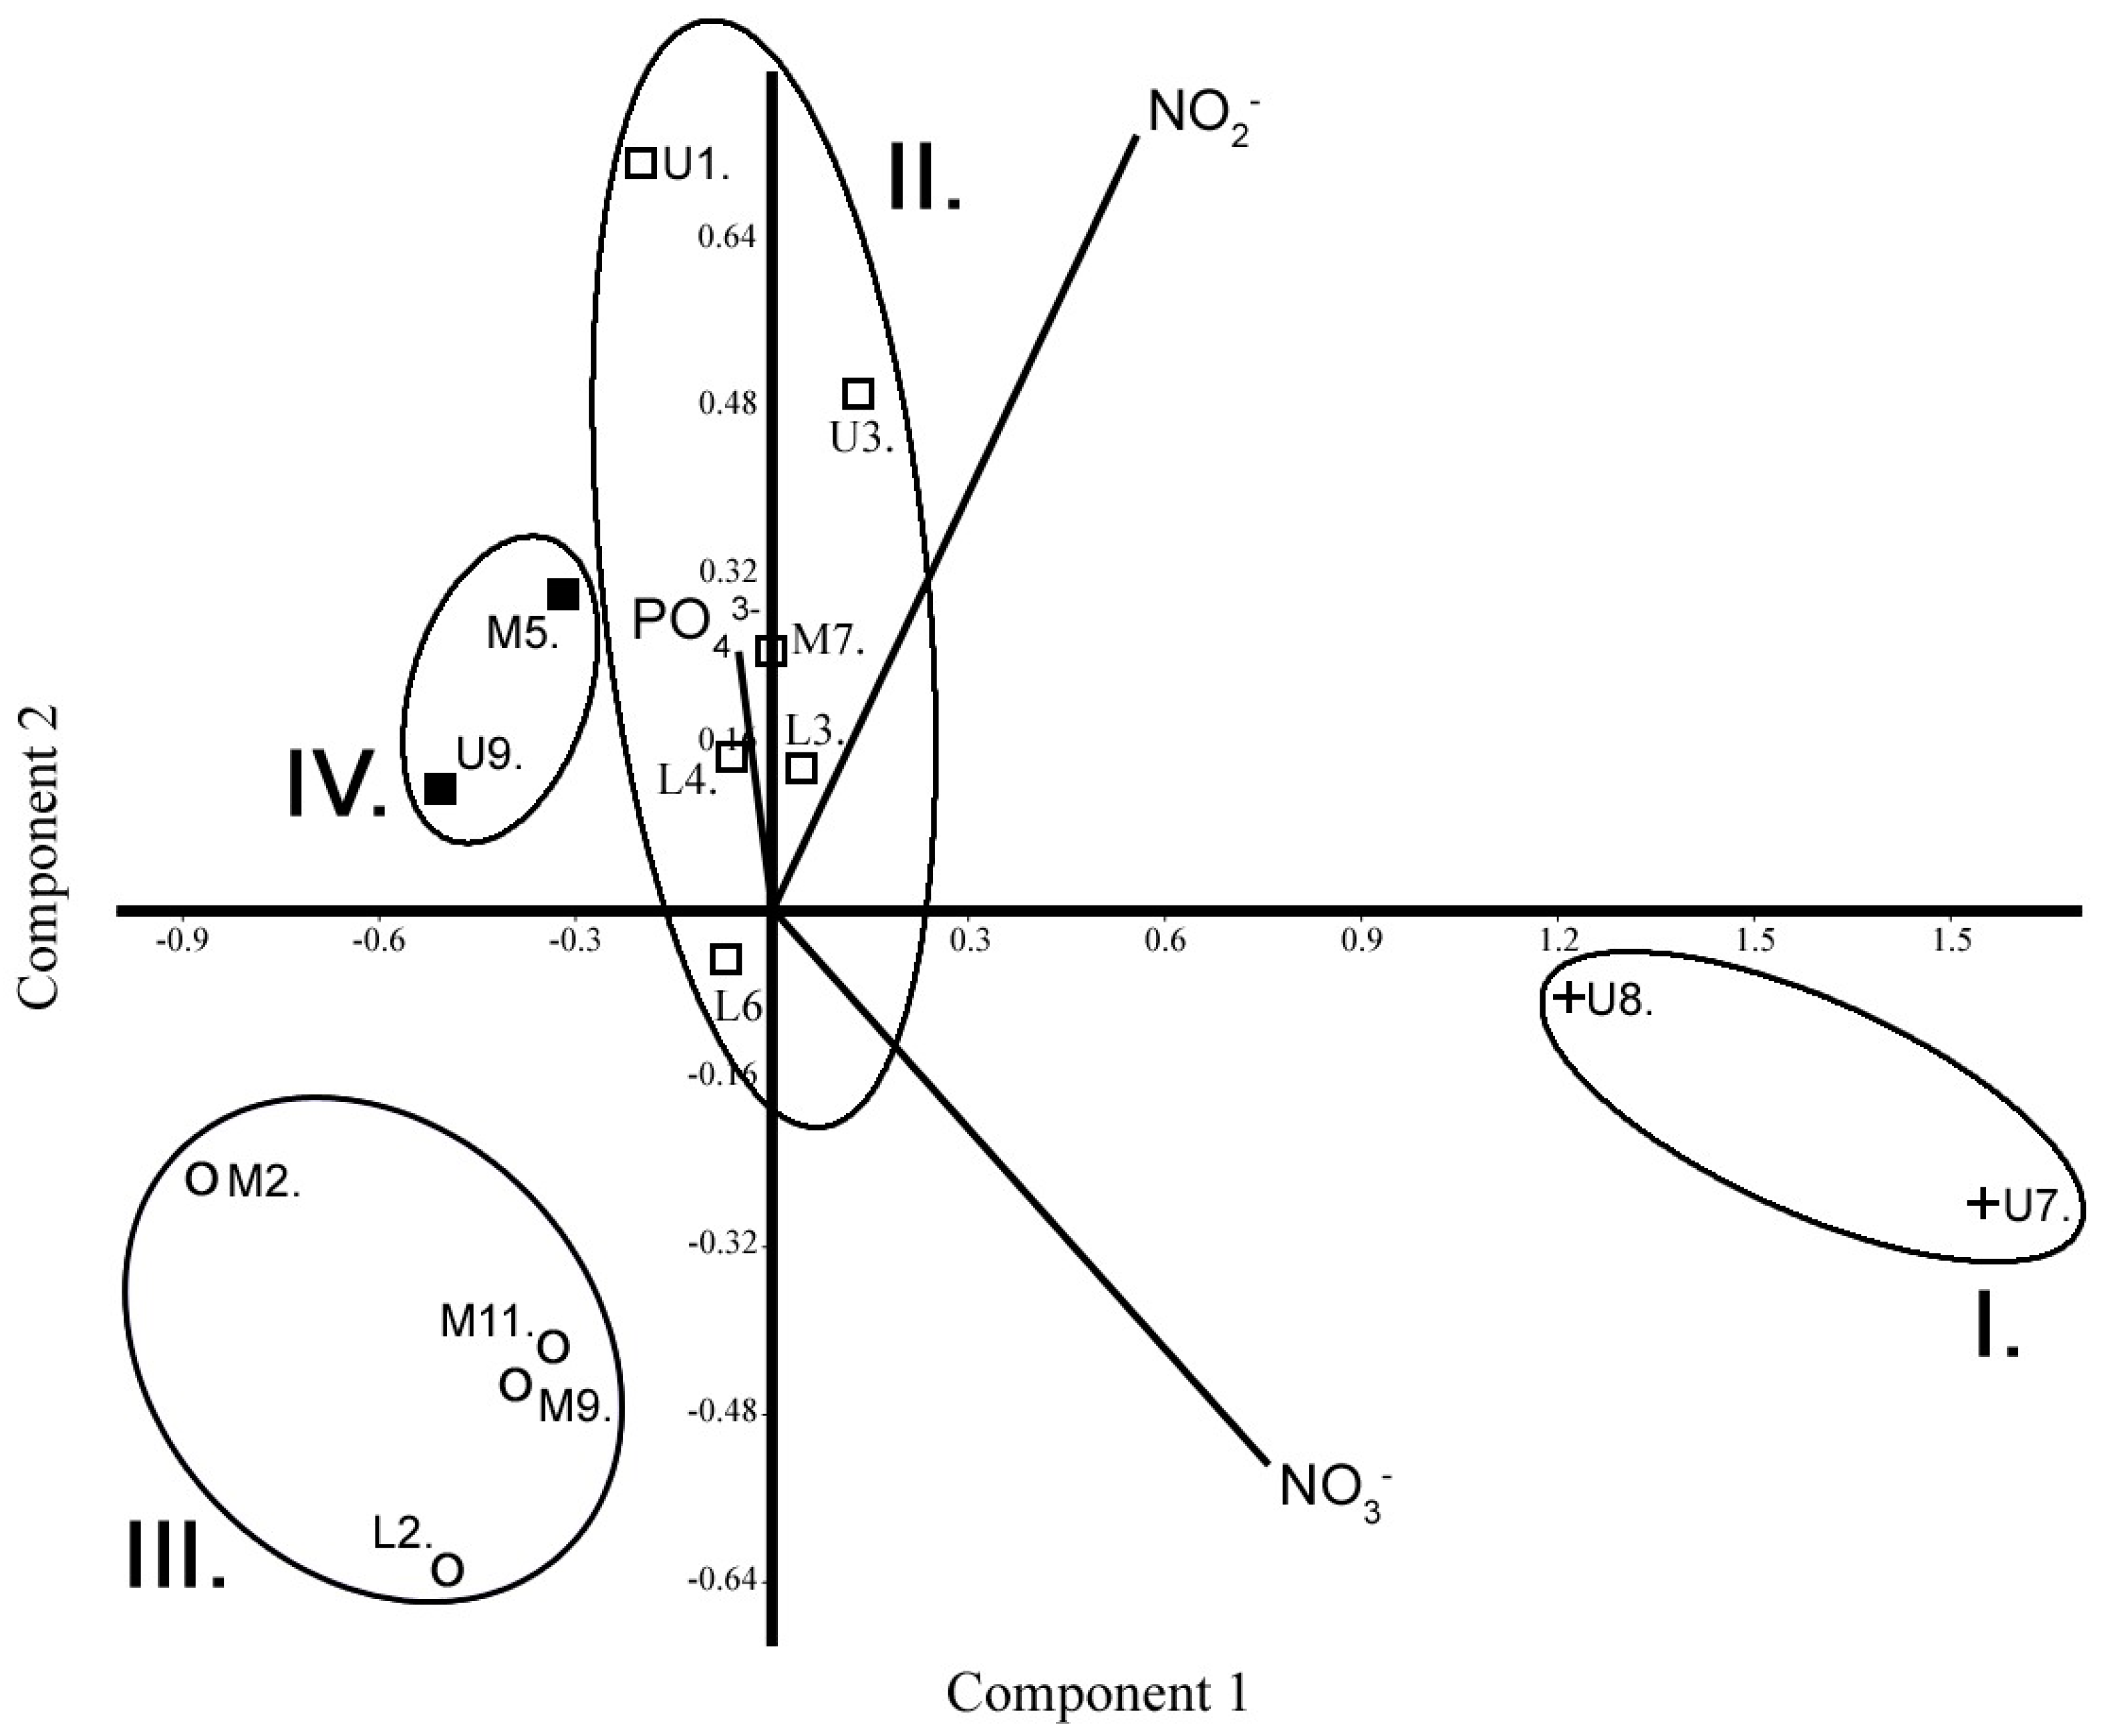
It was characteristic of the autumn period that the sampling points could be divided into four groups based on principal component analysis (Figure 4). The first axis explained 75.04% of the total variance, while the second axis explained 21.46% of the total variance. Group I consisted of U7 and U8 due to the high concentrations of nitrate and nitrite. The sampling points U1, U3, M7, L3, L4, and L6 belonged to Group II. This group was defined by high concentrations of nitrite and orthophosphate ions. M2, M9, M11, and L2 were included in Group III, with low nitrite and orthophosphate concentrations. Sampling sites U9 and M5 constituted Group IV due to their low nitrate concentrations.
4. Discussion
Much research has been done over the years with regard to large watercourses: it has been conducted at a large number of sampling sites and has been supported by long series of observations, often lasting decades [39,40,41,42]. On the other hand, small (even artificial) watercourse research has been very limited [43]. In many cases, a small number of studies have been carried out or classified on the basis of the small size of the watercourse [44]. Often these small watercourses can have a wide variety of effects, and a few samples of these effects can coalesce or in many cases not be detected. Thus we know very little about the characteristics and the operational features of small watercourses, the impurities that reach them, and the extent to which pollution has been eliminated. Considering that larger watercourses are formed from the confluence of smaller watercourses, the effects and contamination of small waters will eventually appear in larger rivers. In addition, we should not ignore the fact that very often small waters are of major importance in a given region, since in many cases these waters are the only watercourses in the area. It is even more important to know the operating mechanisms of the watercourses that affect settlements and large cities in the region, as their relationship is important both for the watercourse and the settlement.
This work addressed human stressors and their impacts on water quality by analyzing single and multiple stressors and their interactions in a canal that originates in a natural environment and flows into an urban area. Based on the patterns of stressors, their combinations and the nature of their interactions were investigated.
Based on our study, the sampling points could be divided into three groups based on the principal component analysis for the spring period (Figure 2). The classification of the sampling points in Group I was based on very high nitrate and nitrite concentrations. The combined presence of nitrite and nitrate forms indicated their origin from external sources, since the ammonia content of ammonia-based fertilizers used in agriculture is converted to nitrite during nitrification [45,46]. The high nitrate content of U7, U8, and U9 can be explained by the use of fertilizers containing nitrate in the agricultural area around the origin (Upper Area), which increases the nitrate content of groundwater and runoff [47,48] and which can be explained by the effect of minimal or nonexistent buffer zones in many places. Buffer zones are bands that mitigate or inhibit protected areas from adverse effects. In this case, the areas between the agricultural land and the watercourse are separated from each other. If there is an appropriately large buffer zone, the ratio of the groundwater absorption of chemicals and fertilizers used in agricultural cultivation is reduced or totally inhibited [49]. The filtering effect of buffer zones is even more pronounced when it has vegetation [50]. The nitrate concentration at the L3 sampling point in the metropolitan area (Lower) was due to the various urban sewer water inlets entering the watercourse, which may contain nitrate-loaded wastewater and airborne nitrogen oxide from industrial activities and transport exhaust [51]. The load on the watercourse can increase significantly during heavy rain [52]. The separation of the sampling points in Group II was caused by the high orthophosphate concentration. Organisms use orthophosphate quickly during their lives, so its concentration can change quickly, but it can be the primary excitatory of eutrophication according to the Liebig minimum principle. The high concentrations of orthophosphate at sampling points U1 and U3 indicate the use of orthophosphate-containing fertilizers related to cultivation in agricultural areas (Upper Area) around the branches of origin, and because there is no buffer zone of appropriate size, concentration of orthophosphate reaches the area with rainwater in a non-point-like, barrier-free manner [53]. The metropolitan L2 sampling point, where rainwater enters the watercourse, was characterized by a high orthophosphate content, which indicated local contamination, since no high orthophosphate concentration was found above or below this sampling point. Phosphorous-free detergents have been available since the 1980s, but the release of phosphorous from households is still significant [54]. The sampling points in Group III were characterized by very small concentrations of nitrite, nitrate, and orthophosphate, which indicated their near-natural state in the small watercourse.
According to the PCA, the summer period was the most heterogeneous among the examined seasons, with six groups emerging (Figure 3). The classification of Group I was caused by high nitrate and nitrite concentrations. The high nitrate content of U5 and U6 indicated the amount of significant and continuous nitrate from fertilizers in the area of origin (Upper Area), which was caused by high rainfall in the summer and the absence of buffer zones. At these points, the high nitrite concentration indicated the presence of anaerobic bacteria in an oxygen-deficient environment, which promoted the formation of nitrite against the nitrate during the denitrification process [55]. M5 was also included in Group I and is located in the small-town area (Middle Area). It was also characterized by a high concentration of nitrites and nitrates, and their combined presence clearly indicated an external source [56]: the introduction of a rainwater collection system in the small town. The classification of the sampling sites of Group II was the result of high concentrations of orthophosphate and nitrite. The two sampling points in Group II were at a greater distance from each other, but the accumulation of a large amount of organic matter due to the slowing flow was characteristic of both points, which explained the higher orthophosphate concentration [57]: a long-lasting oxygen-free period was indicated by the high concentration of nitrite [58]. In addition to a low nitrate concentration, Group III also had a low nitrite concentration, indicating that the load in the vicinity of the sampling points in this group did not reach the watercourse: this low value is the basic characteristic of lowland watercourses [59]. The classification of the sampling points in Group IV was the result of their low nitrate concentration. Particularly high (U5 and U6) and small (U2) nitrite concentrations could be detected in the same area (Upper Area), which indicated that there were significant differences between the relatively close sampling points, and these loads could be detected clearly. Group V was characterized by low nitrite concentrations. Both sampling points in this group were in the metropolitan area. The lack of a reduced form of nitrogen indicated flowing aqueous and oxygenated conditions [60]. Sampling points in Group VI were characterized by high nitrate and low nitrite concentrations. The sampling points in this group were geographically distant, but they could be classified in the same group based on the principal component analysis. An explanation for their similarity was mineral nitrogen intake, which took place in an oxygen-rich, flowing aqueous environment where nitrite is not formed or is rapidly converted into nitrate [61].
In the autumn period, the sampling points could be divided into four groups based on principal component analysis (Figure 4). The classification of Group I was the result of high nitrate and nitrite concentrations. Each of these two points was located on one of the branches of the arable land (Upper Area), where a very small buffer zone separated the land from the watercourse, which explained the high nitrate concentration [62]. Moreover, the groundwater supply of the watercourse runs out, even in the autumn period, so the water bed dries out. In this case, the water remaining in the stationary water will be characterized by an anaerobic condition that favors the formation of nitrite. The classification of Group II was caused by the high concentrations of nitrite and orthophosphate. These two ions appeared in significant amounts in an oxygen-depleted environment during the decomposition of organic matter [63]. The sampling points of the group were located at a very great geographical distance from the branches of origin in the arable land (Upper Area), the area after the small town (Middle Area), and the metropolitan area (Lower Area). The sampling points of Group III were characterized by low concentrations of nitrite and orthophosphate. Many of the sampling points were at a great geographical distance from the rest of the group. Low orthophosphate and nitrite concentrations indicated that the water flows in these places, resulting in oxygen-rich conditions. No great amount of organic matter enrichment would break down under anaerobic conditions. In addition, it does not reach the missing buffer zone as a result of the fertilizer load on the watercourse [64]. All of this indicates typical characteristics of this type of watercourse. The classification of the sampling points in Group IV resulted from low nitrate concentrations, which indicated flowing water in these areas and also indicated favorable conditions.
It can be stated that the concentrations of the main variables (nitrite, nitrate, and orthophosphate), which had the greatest impact on the classification of the sampling points of the studied watercourse, were very diverse at different sampling sites both in the same period and in relation to the three seasons studied (Figure 5). There was no single point that had the same main variable (in all of the seasons examined) influencing its characteristics and water quality. Moreover, the different areas (Upper, Middle, and Lower Areas) could not be classified on the basis of a distinct variable. Even during one season, we found that there were marked differences between the individual sampling points within each area.
5. Conclusions
Based on our results, it can be stated that the concentrations of the main variables (nitrite, nitrate, and orthophosphate), which had the greatest impact on the classification of the sampling points of the studied watercourse, were very diverse at different sampling sites, both in the same period and in relation to the three seasons studied (Figure 5). There was no single point that had the same main variable (in all of the seasons examined) influencing its characteristics and water quality. Moreover, the different areas (Upper, Middle, and Lower Areas) could not be classified on the basis of a distinct variable. Even during one season, we found that there were marked differences between the individual sampling points within each area. The most varied picture was found in summer (Figure 3), when six groups were identified based on the principal component analysis. The fewest groups were found in spring (Figure 2). In almost all cases, the sampling points constituting the groups belonged to at least two of the three large areas (Upper, Middle, and Lower Areas). The water quality of the watercourse was shaped by very diverse conditions and effects in the same area.
Nowadays, water classification systems such as the EU WFD are being used cost-effectively and simply to sample water bodies, taking both sampling and sample numbers into account. This often means only one or two sampling points for small watercourses during monitoring and certification. During our work, we found a great variety between the sampling sites in terms of the water quality in the small watercourse investigated. Often, within a small geographical distance, we identified different loads on the basis of the PCA. The water quality of the watercourse and the load on the water changed not only by areal and geographical distance, but also over time. In many cases, the same sampling point was characterized by different loads in different months. In our study, we tried to point out that in the case of small watercourses, it is important to have more detailed monitoring than can be provided by, e.g., the EU WFD.
Author Contributions
Conceptualization, I.S. and I.G.; methodology, I.S. and É.Á.; software, L.J.S. and C.B; validation, G.D. and J.N.; formal analysis, S.A.N. and É.Á.; investigation, I.S.; resources, S.A.N. and J.N.; data curation, C.B.; writing—original draft preparation, I.S.; writing—review and editing, I.S. and C.B.; visualization, I.S.; supervision, I.G. and G.D.; project administration, S.A.N.; funding acquisition, J.N. and S.A.N.
Funding
This research was financed by the Higher Education Institutional Excellence Program (20428-3/2018/FEKUTSTRAT) of the Ministry of Human Capacities in Hungary within the framework of the 4.thematic program of the University of Debrecen.
Acknowledgments
I would like to express my appreciation toward my colleagues in the Department of Hydrobiology of the University of Debrecen for their great effort and contribution in sampling.
Conflicts of Interest
The authors declare no conflict of interest.
References
- Alexander, R.B.; Smith, R.A.; Schwarz, G.E. Effect of stream channel size on the delivery of nitrogen to the Gulf of Mexico. Nature 2000, 403, 758–761. [Google Scholar] [CrossRef] [PubMed]
- Bencala, K.E. A perspective on stream-catchment connections. J. N. Am. Benthol. Soc. 1993, 12, 44–47. [Google Scholar] [CrossRef]
- Gomi, T.; Sidle, R.C.; Richardson, J.S. Understanding processes and downstream linkages of headwater systems. Bioscience 2002, 52, 905–916. [Google Scholar] [CrossRef]
- Rigby, J.R.; Porporato, A. Precipitation, dynamical intermittency, and sporadic randomness. Adv. Water Resour. 2010, 33, 923–932. [Google Scholar] [CrossRef]
- Georgakakos, K.P.; Kavvas, M.L. Precipitation analysis, modeling, and prediction in hydrology. Rev. Geophys. 1987, 25, 163–178. [Google Scholar] [CrossRef]
- Schertzer, D.; Tchiguirinskaia, I.; Lovejoy, S.; Hubert, P.; Bendjoudi, H.; Larcheveque, M. Discussion of “evidence of chaos in the rainfall-runoff process”. Hydrolog. Sci. J. 2002, 47, 139–148. [Google Scholar] [CrossRef]
- Lake, P.S. Ecological effects of perturbation by drought in flowing waters. Freshwater Biol. 2003, 48, 1161–1172. [Google Scholar] [CrossRef]
- Larned, S.T.; Datry, T.; Arscott, D.B.; Tockner, K. Emerging concepts in temporary river ecology. Freshwater Biol. 2010, 55, 717–738. [Google Scholar] [CrossRef]
- Varol, M.; Gökot, B.; Bekleyen, A.; Şen, B. Spatial and temporal variations in surface water quality of the dam reservoirs in the Tigris River basin, Turkey. Catena 2012, 92, 11–21. [Google Scholar] [CrossRef]
- Tian, Y.; Jiang, Y.; Kiu, Q.; Dong, M.; Xu, D.; Liu, Y.; Xu, X. Using a water quality index to assess the water quality of the upper and middle streams of the Luanhe River, northern China. Sci. Total Environ. 2019, 667, 142–151. [Google Scholar] [CrossRef]
- Diamantini, E.; Lutz, S.R.; Mallucci, S.; Majone, B.; Merz, R.; Bellin, A. Driver detection of water quality trends in three large European river basins. Sci. Total Environ. 2019, 612, 49–62. [Google Scholar] [CrossRef]
- Thompson, J.; Pelc, C.E.; Borgan, W.R., III; Jordan, T.E. The multiscale effects of stream restoration on water quality. Ecol. Eng. 2018, 124, 7–18. [Google Scholar] [CrossRef]
- Yancheva, V.; Georgieva, E.; Stoyanova, S.; Velcheva, I.; Somogyi, D.; Nyeste, K.; Antal, L. A study on the Caucasian dwarf goby (Knipowitschia caucasica Berg, 1916) from an anthropogenically loaded site in Hungary using multiple tissues analyses. Acta Zool-Stockholm. 2009, in press. [Google Scholar] [CrossRef]
- Mainali, J.; Chang, H. Landscape and anthropogenic factors affecting spatial patterns of water quality trends in a large river basin, South Korea. J. Hydrol. 2018, 564, 26–40. [Google Scholar] [CrossRef]
- Bowes, M.J.; House, W.A. Phosphorus and dissolved silicon dynamics in the River Swale catchment, UK: A mass-balance approach. Hydrol. Process. 2001, 15, 261–280. [Google Scholar] [CrossRef]
- Chen, J.; Lu, J. Effects of land use, topography and socio-economic factors on river water quality in a mountainous watershed with intensive agricultural production in East China. PLoS ONE 2014, 9, e102714. [Google Scholar] [CrossRef]
- Tu, J. Spatially varying relationships between land use and water quality across an urbanization gradient explored by geographically weighted regression. Appl. Geogr. 2011, 31, 376–392. [Google Scholar] [CrossRef]
- Sabater, S.; Elosegi, A.; Ludwig, R. Defining Multiple Stressor Implications. In Multiple Stressors in River Ecosystems, 1st ed.; Sabater, S., Elosegi, A., Ludwig, R., Eds.; Elsevier: Amsterdam, The Netherlands, 2019; pp. 1–22. [Google Scholar]
- Grizzetti, B.; Bouraoui, F.; De Marsily, G. Assessing nitrogen pressures on European surface water. Glob. Biogeochem. Cycles 2008, 22, GB4023. [Google Scholar] [CrossRef]
- Markovics, R.; Kanduc, T.; Szramek, K.; Golobocanin, D.; Milacic, R.; Ogrinc, N. Chemical dynamics of the Sava riverine system. J. Environ. Monitor. 2010, 12, 2165–2176. [Google Scholar] [CrossRef]
- Vitousek, P.M.; Aber, J.D.; Howarth, R.W.; Lekens, G.E.; Matson, P.A.; Schindler, D.W.; Schslesinger, W.H.; Tilman, D.G. Human alteration of the global nitrogen cycle: Sources and consequences. Ecol. Appl. 1997, 7, 737–750. [Google Scholar] [CrossRef]
- Korkanç, S.Y.; Kayıkçı, S.; Korkanç, M. Evaluation of spatial and temporal water quality in the Akkaya dam watershed (Niğde, Turkey) and management implications. J. Afr. Earth Sci. 2017, 129, 481–491. [Google Scholar] [CrossRef]
- Weigelhofer, G.; Ramião, J.P.; Pitzl, B.; Bondar-Kunze, E.; O’Keeffe, J. Decoupled water-sediment interactions restrict the phosphorus buffer mechanism in agricultural streams. Sci. Total Environ. 2018, 628–629, 44–52. [Google Scholar] [CrossRef]
- Chesterton, C. Environmental Impacts of Land Management; Nature England: Sheffield, UK, 2009; p. 175. [Google Scholar]
- Elosegi, A.; Díez, J.; Mutz, M. Effects of hydromorphological integrity on biodiversity and functioning of river ecosystems. Hydrobiologia 2010, 657, 199–215. [Google Scholar] [CrossRef]
- Biggs, J.; von Fumetti, S.; Kelly-Quinn, M. The importance of small waterbodies for biodiversity and ecosystem services: Implications for policy makers. Hydrobiologia 2017, 793, 3–39. [Google Scholar] [CrossRef]
- Sherestha, S.; Kazama, F. Assessment of surface water quality using multivariate statistical techniques: A case study of the Fuji river basin, Japan. Environ. Model Softw. 2007, 22, 464–475. [Google Scholar] [CrossRef]
- Gao, J.; Li, S. Detecting spatially non-stationary and scale-dependent relationships between urban landscape fragmentation and related factors using Geographically Weighted Regression. Appl. Geogr. 2011, 31, 292–302. [Google Scholar] [CrossRef]
- Trombulak, S.C.; Frissell, C.A. Review of ecological effects of roads on terrestrial and aquatic communities. Conserv. Biol. 2000, 14, 18–30. [Google Scholar] [CrossRef]
- Munroe, D.K.; Croissant, C.; York, A.M. Land use policy and landscape fragmentation in an urbanizing region: Assessing the impact of zoning. Appl. Geogr. 2005, 27, 121–141. [Google Scholar] [CrossRef]
- Strobl, R.O.; Robillard, P.D. Network design for water quality monitoring of surface freshwaters: A review. J. Environ. Manag. 2008, 87, 639–648. [Google Scholar] [CrossRef]
- Lóczy, D.; Kis, É.; Schweitzer, F. Local flood hazards assessed from channel morphometry along the Tisza River in Hungary. Geomorphology 2009, 113, 200–209. [Google Scholar] [CrossRef]
- Lóczy, D. Human impact on rivers in Hungary as reflected in changes of channel planform. Z. Geomorphol. 1997, 110, 219–231. [Google Scholar]
- Lóczy, D.; Juhász, Á. Hungary. In Geomorphological Hazards of Europe; Embleton, C., Embleton-Hamann, C., Eds.; Elsevier Science Publishers: Amsterdam, The Netherlands, 1997; pp. 243–262. [Google Scholar]
- Hüse, B.; Szabó, S.; Deák, B.; Tóthmérész, B. Mapping an ecological network of green habitat patches and their role in maintaining urban biodiversity in and around Debrecen city (Eastern Hungary). Land Use Policy 2016, 57, 574–581. [Google Scholar] [CrossRef]
- Viktória, B.; Lukács, Á.; Török, P.; Kókai, Z.; Novák, Z.; Enikő, T.; Tóthmérész, B.; Bácsi, I. Combined eco-morphological functional groups are reliable indicators of colonisation processes of benthic diatom assemblages in a lowland stream. Ecol. Indic. 2016, 64, 31–38. [Google Scholar]
- Szabó, S.; Elemér, L.; Kovács, Z.; Püspöki, Z.; Kertész, Á.; Singh, S.K.; Balázs, B. NDVI dynamics as reflected in climatic variables: Spatial and temporal trends – a case study of Hungary. GISci. Remote Sens. 2018, 56, 624–644. [Google Scholar] [CrossRef]
- United States Environmental Protection Agency. Methods for Chemical Analysis of Water and Wastes; Office of Research and Development: Washington, DC, USA, 1983. [Google Scholar]
- Webb, B.W.; Nobilis, F. Long-term changes in river temperature and the influence of climatic and hydrological factors. Hydrolog. Sci. J. 2007, 52, 74–85. [Google Scholar] [CrossRef]
- Peršić, V.; Horvatić, J. Spatial Distribution of Nutrient Limitation in the Danube River Floodplain in Relation to Hydrological Connectivity Society of Wetland Scientists. Wetlands 2011, 31, 933–944. [Google Scholar] [CrossRef]
- Pekárová, P.; Onderka, M.; Pekár, J.; Roncák, P.; Miklánek, P. Prediction of water quality in the Danube River under extreme hydrological and temperature conditions. J. Hydrol. Hydromech. 2009, 57, 3–15. [Google Scholar] [CrossRef]
- Antal, L.; Székely, C.; Molnár, K. Parasitic infections of two invasive fish species the Caucasian dwarf goby and the Amur sleeper in Hungary. Acta Vet. Hung. 2015, 63, 472–484. [Google Scholar] [CrossRef]
- Dorotovicová, C. Man-made canals as a hotspot of aquatic macrophyte biodiversity in Slovakia. Limnologica 2013, 43, 277–287. [Google Scholar] [CrossRef]
- Baattrup-Pedersen, A.; Larsen, S.E.; Andersen, D.K.; Jepsen, N.; Nielsen, J.; Rasmussen, J.J. Headwater streams in the EU Water Framework Directive: Evidence-based decision support to select streams for river basin management plans. Sci. Total Environ. 2018, 613–614, 1048–1054. [Google Scholar] [CrossRef]
- Van Cleemput, O.; Samater, A.H. Nitrite in soils: Accumulation and role in the formation of gaseous N compounds. Fert. Res. 1996, 45, 81–89. [Google Scholar] [CrossRef]
- Yaqoob, M.; Siddiqui, M.A.; Masoom, M. Flow-injection spectrophotometric determination of nitrite in water samples. J. Indian Chem. Soc. 1992, 69, 32–33. [Google Scholar]
- Bouchard, V.C.; Williams, M.K.; Surampalli, R.Y. Nitrate contamination of Groundwater: Sources and potential health effects. Am. Water Work. Assoc. 1992, 84, 85–90. [Google Scholar] [CrossRef]
- Savci, S. An Agricultural Pollutant: Chemical Fertilizer. Int. J. Environ. Sci. Dev. 2012, 3, 77–80. [Google Scholar] [CrossRef]
- Chaplot, V.; Saleh, A.; Jaynes, D.B.; Arnold, J.G. Predicting water, sediment and NO3-N loads under scenarios of land-use and management practices in a flat watershed. Water Air Soil Poll. 2004, 154, 271–293. [Google Scholar] [CrossRef]
- Sahu, M.; Gu, R.R. Modeling the effects of riparian buffer zone and contour strips on stream water quality. Ecol. Eng. 2009, 35, 1167–1177. [Google Scholar] [CrossRef]
- Cole, J.J.; Peierls, B.L.; Caraco, N.F.; Pace, M.L. Nitrogen Loading of Rivers as a Human-Driven Process. In Humans as Components of Ecosystems; Springer: New York, NY, USA, 1993; pp. 141–157. [Google Scholar]
- Buda, A.R.; DeWalle, D.R. Dynamics of stream nitrate sources and flow pathways during stormflows on urban, forest and agricultural watersheds in central Pennsylvania, USA. Hydrol. Process. 2009, 23, 3292–3305. [Google Scholar] [CrossRef]
- Daniel, T.C.; Sharpley, A.N.; Lemunyon, J.L. Agricultural Phosphorus and Eutrophication: A Symposium Overview. J. Environ. Qual. 1998, 27, 251–257. [Google Scholar] [CrossRef] [Green Version]
- Kristensen, P.; Fribourg-Blanc, B.; Nixon, S. Outlook on Nutrient Discharges in Europe from Urban Waste Water Treatment Plants; European Environment Agency: Copenhagen, Denmark, 2005. [Google Scholar]
- Ruiz, G.; Jeison, D.; Rubilar, O.; Ciudad, G.; Chamy, R. Nitrification–denitrification via nitrite accumulation for nitrogen removal from wastewaters. Bioresour. Technol. 2005, 97, 330–335. [Google Scholar] [CrossRef]
- Vrzel, J.; Vuković-Gačić, B.; Kolarević, S.; Gačić, Z.; Kračun-Kolarević, M.; Kostić, J.; Aborgiba, M.; Farnleitner, A.; Reischer, G.; Linke, R.; et al. Determination of the sources of nitrate and the microbiological sources of pollution in the Sava River Basin. Sci. Total Environ. 2016, 573, 1460–1471. [Google Scholar] [CrossRef] [Green Version]
- Patrick, W.H., Jr.; Khalid, R.A. Phosphate Release and Sorption by Soils and Sediments: Effect of Aerobic and Anaerobic Conditions. Science 1974, 186, 53–55. [Google Scholar] [CrossRef]
- Abeling, U.; Seyfried, C.F. Anaerobic-Aerobic Treatment of High-Strength Ammonium Wastewater—Nitrogen Removal via Nitrite. Water Sci. Technol. 1992, 26, 1007–1015. [Google Scholar] [CrossRef]
- Heathwaite, A.L.; Johnes, P.J. Contribution of nitrogen species and phosphorus fractions to stream water quality in agricultural catchments. Hydrol. Process. 1996, 10, 971–983. [Google Scholar] [CrossRef]
- Stratton, F.E.; McCarty, P.L. Prediction of nitrification effects of the dissolved oxygen balance of streams. Environ. Sci. Technol. 1967, 1, 405–410. [Google Scholar] [CrossRef]
- Bansal, M.K. Nitrification in Natural Streams. Water Pollut. Control. 1976, 48, 2380–2393. [Google Scholar]
- Heathwaite, A.L.; Griffiths, P.; Parkinson, R.J. Nitrogen and phosphorus in runoff from grassland with buffer strips following application of fertilizers and manures. Soil Use Manag. 1998, 14, 142–148. [Google Scholar] [CrossRef]
- Meinholda, J.; Arnold, E.; Isaacsa, S. Effect of nitrite on anoxic phosphate uptake in biological phosphorus removal activated sludge. Water Res. 1999, 33, 1871–1883. [Google Scholar] [CrossRef]
- Osborne, L.L.; Kovacic, D.A. Riparian vegetated buffer strips in water-quality restoration and stream management. Freshwater Biol. 1993, 29, 243–258. [Google Scholar] [CrossRef]
Figure 1.
Sampling area of the small watercourse and its sampling points. Upper Area: U1−U9; Middle Area: M1−M11; Lower Area: L1−L6.
Figure 1.
Sampling area of the small watercourse and its sampling points. Upper Area: U1−U9; Middle Area: M1−M11; Lower Area: L1−L6.

Figure 2.
Results for the spring period of the principal component analysis applied to the physical and chemical variables at the sampling points of the sampling area. Group I: cross (+). Group II: empty square (□). Group III: empty circle (o). Upper Area: U1−U9; Middle Area: M1−M11; Lower Area: L1−L6.

Figure 3.
Results for the summer period of the principal component analysis applied to the physical and chemical variables at the sampling points of the sampling area. Group I: cross (+). Group II: empty square (□). Group III: empty circle (o). Group IV: full square (■). Group V: full triangle (▲). Group VI: rotated cross (x). Upper Area: U1−U9; Middle Area: M1−M11; Lower Area: L1−L6.

Figure 4.
The results for the autumn period of the principal component analysis of the physical and chemical variables measured at the sampling points. Group I: cross (+). Group II: empty square (□). Group III: empty circle (o). Group IV: full square (■). Upper Area: U1−U9; Middle Area: M1−M11; Lower Area: L1−L6.

Figure 5.
The concentrations of various ions determined by principal component analysis at different sampling points along the Tócó. The nitrate ion is yellow, the nitrite ion is purple, and the orthophosphate ion is blue.
Figure 5.
The concentrations of various ions determined by principal component analysis at different sampling points along the Tócó. The nitrate ion is yellow, the nitrite ion is purple, and the orthophosphate ion is blue.

© 2019 by the authors. Licensee MDPI, Basel, Switzerland. This article is an open access article distributed under the terms and conditions of the Creative Commons Attribution (CC BY) license (http://creativecommons.org/licenses/by/4.0/).
Share and Cite
MDPI and ACS Style
Somlyai, I.; Berta, C.; Nagy, S.A.; Dévai, G.; Ács, É.; Szabó, L.J.; Nagy, J.; Grigorszky, I. Heterogeneity and Anthropogenic Impacts on a Small Lowland Stream. Water 2019, 11, 2002. https://doi.org/10.3390/w11102002
AMA Style
Somlyai I, Berta C, Nagy SA, Dévai G, Ács É, Szabó LJ, Nagy J, Grigorszky I. Heterogeneity and Anthropogenic Impacts on a Small Lowland Stream. Water. 2019; 11(10):2002. https://doi.org/10.3390/w11102002
Chicago/Turabian StyleSomlyai, Imre, Csaba Berta, Sándor Alex Nagy, György Dévai, Éva Ács, László József Szabó, János Nagy, and István Grigorszky. 2019. "Heterogeneity and Anthropogenic Impacts on a Small Lowland Stream" Water 11, no. 10: 2002. https://doi.org/10.3390/w11102002
Note that from the first issue of 2016, this journal uses article numbers instead of page numbers. See further details here.