Impact of Climate Change and Human Activities on Streamflow Variations Based on the Budyko Framework


Department of Resources of Engineering, National Cheng Kung University, Tainan 701, Taiwan
*
Author to whom correspondence should be addressed.
Water 2019, 11(10), 2001; https://doi.org/10.3390/w11102001
Submission received: 8 August 2019
/
Revised: 16 September 2019
/
Accepted: 23 September 2019
/
Published: 26 September 2019
(This article belongs to the Special Issue Urban Environmental Vulnerability under Climate Change and Anthropogenic Impacts)
Abstract
:In recent years, the influence of climate change and human activity on the global environment have become a concern. It is essential to better understand the hydrologic environment to evaluate water availability and related issues. In this study, we perform a trend and breakpoint analysis on streamflow time series in the Lanyang, Keelung, Dahan, Fengshan, Youluo and Shangping River Basins in northern Taiwan. Furthermore, we apply the Budyko–Fu equation and the Budyko–Mezentsev–Choudhury–Yang equation to evaluate the elasticity of streamflow with respect to climate factors and the catchment characteristics parameter. We discuss the sensitivity of streamflow to climate factors (precipitation and potential evapotranspiration), as well as sensitivity to human activities such as land use changes. We detected breakpoints in the streamflow time series for the Lanyang and Keelung rivers in in 1993 and 1990, respectively. The streamflow of Lanyang River increased by 32.50% during the variation period (1993–2017), with 109.00% of the variation caused by non-climate factors. The Keelung River’s streamflow was reduced by 18.11% during the variation period (1990–2017), and the dominant factor was climate change, accounting for 71.53% of the reduction. Sensitivity analysis showed that precipitation changes were the most sensitive factor of streamflow variation. For every 1% increase in precipitation, the streamflow would increase by 1.05% to 1.37%. These results could serve as a reference for the sustainable development of water resources and territorial policies in northern Taiwan.
1. Introduction
Water resources are essential assets for the development of human society. However, in recent years, changes in the hydrologic environment due to the combination of climate change and other human activities have triggered water resource difficulties in many regions. Events associated with extreme weather and environmental disasters such as heavy rainfall, floods and droughts are being reported more frequently [1,2,3,4]. Therefore, assessing hydrological responses under the influences of human activities and climate change has become an important issue for policy makers.
Human activities, including land use change, water diversion, dam construction, and soil and water conservation policies [5,6,7], cause variation of the environment. The change of streamflow is one of the key factors in understanding the pattern of the hydrological cycle in a watershed [8]. Depending on the source of the environmental disturbance, the cause of the change in streamflow can be divided into climate change and non-climate factors. Climate factors that may affect streamflow include precipitation and potential evapotranspiration variation caused by global warming, and non-climate factors include human activities such as land use and land cover changes in the basin; e.g., dam construction and clear cutting [9,10].
In recent years, due to the frequent variations of water resources and the occurrence of disaster, research evaluating the hydrological response to climate change and human activities has received increased attention. Many scholars have begun to explore this issue from different perspectives [11,12,13,14,15,16]. Hydrological models, empirical statistics, and the elasticity method have been commonly used to assess climate and human factors affecting streamflow changes. Other methods include the paired catchments method [11], the ecohydrology method [17], and the decomposition method [18]. The paired catchment method is an approach which is commonly used in forestry and hydrology to assess the impact of land change on streamflow. However, the paired catchments method is more suitable for small areas, as it is difficult to find practical catchments in medium and large-scale areas [11,19]. The ecohydrology method proposed by Tomer and Schilling [17] is a model which is used to consider the long-term water energy consumption in a basin. This method can distinguish the impact of human activities and land changes on the hydrology of a basin but can only provide a qualitative assessment [20]. Wang and Hejazi [18] proposed the decomposition method based on the Russian scientist Budyko’s hypothesis regarding the atmospheric water energy balance [21,22].
The hydrological model approach is a method used to investigate hydrological processes using conceptual, physical, or black-box numerical models. Siriwardena et al. [23] used the simple conceptual daily rainfall-runoff model (SIMHYD) to assess the impact of climate change and human activities on surface streamflow in the Comet River, Australia. The results of this model indicate that local deforestation caused a 40% increase in streamflow. Zhang et al. [24] used the SWAT (Soil and Water Assessment Tools) model to analyze the factors of streamflow variation in the Sang-Kan River in the Loess Plateau. They found that the impacts of climate change caused a streamflow decline of 39.1%, while changes in water use and land cover increased the streamflow by 2.2% to 3.9%. They also mention that water diversion and dam construction accounted for 63.1% to 64.8% of drought in recent years.
When empirical statistics are used to assess the impact of human activities and climate change on streamflow, they typically consist of time trend analysis, double mass curves, and linear regression. Long-term data series are used to estimate variation and consistency between streamflow and factors of interest such as sediment yield [25,26]. Chang et al. [9] performed a double mass curve analysis of four sections of the Yellow River—at Lanzhou, Toudaoguai, Huayuankou, and Lijin—from 1956 to 2010. The results indicated that after 1990, the streamflow variation caused by human activities in these four sections was 74.87%, 82.20%, 80.63% and 88.71%, respectively. Zhao et al. [10] used linear regression to analyze the streamflow and sediment discharge of the Yangtze River from 1953 to 2013. The study indicated that approximately 72% of the streamflow decrease in the Yangtze River basin could be attributed to climate change, while 71% to 102% of sediment discharge reduction was induced by human activities.
The elasticity method was proposed by Schaake [27] and developed by many scholars [14,15,28,29,30]. This method uses an elasticity coefficient to evaluate the sensitivity of the streamflow to the impact factors. The percentage change of the streamflow caused by climate change can be obtained from the elasticity coefficient of the climatic factor. Schaake [27] defines the elasticity coefficient of streamflow to some variable x as the ratio of the rate of change of streamflow to the rate of change of the variable x:
where Q denotes the streamflow and x is the factor affecting the runoff, such as precipitation (P) or potential evapotranspiration (E0).
Budyko [21,22] assumed that the annual average evapotranspiration and runoff in a region are mainly controlled by the available energy in the atmosphere (demand, often in the form of net radiation (Rn) or potential evapotranspiration (E0)) and available water (supply, represented by precipitation). This relationship can be expressed in an equation over a long-term time scale:
where F(∅) is the equation of the Budyko curve, E is the evapotranspiration, and ∅ is the drought index of the Budyko framework (defined as ∅ = E0/P, if ∅ < 1 represents an arid climate; ∅ > 1 means a humid climate). According to the development and derivations of different scholars, different Budyko curve equations are listed in Table 1. The first four equations in the table belong to the non-parameter method. These models mainly focus on evaluating the impact of climate change. The Fu, Mezentsev–Choudhury–Yang, Milly–Porporato, Zhang, and Wang–Tang models contain parameters related to the watershed characteristics, such as land cover, vegetation, soil properties, and geomorphology.
Under Budyko’s hypothesis, if a basin is extremely arid (i.e., the precipitation is much smaller than E0), the available energy is much greater than the energy required for the evapotranspiration. Under this condition, the annual evaporation will be limited by the available water and approach the precipitation. Conversely, if the basin is extremely humid (i.e., the precipitation is much larger than the potential evapotranspiration), the available energy is much smaller than the evapotranspiration requirement, and thus the annual evapotranspiration is limited by the available energy and approaches the potential evapotranspiration [7,30,31]. The mathematical expressions for extremely arid and humid situations are shown in Equations (3) and (4), respectively:
These two assumptions form a boundary condition on the Budyko curve: the upper boundary represents the water limit, and left boundary represents the energy limit.
Models developed from the Budyko framework have been extended and applied very widely. Many people still propose new models based on the Budyko framework to evaluate the hydrological response of the watershed [7,32,33,34]. In assessing the impact of the hydrological environment, this type of method continues to be applied and developed, because the Budyko analytical method is supported by the physical background and does not require substantial historical data. For example, Sankarasubramanian et al. [28], Arora [30], Roderick and Farquhar [14], Yang and Yang [15], and others propose further analysis and discussion within the Budyko framework. Xu et al. [6] used the Budyko–Mezentsev–Choudhury–Yang equation to estimate the impact of climate change and human activities on runoff reduction in the Haihe River Basin. The data used in this study include precipitation, discharge and other data used to calculate potential evapotranspiration (e.g., temperatures, sunshine duration, wind speed, and relative humidity); thus, the watershed characteristics parameter and Budyko curve can be obtained. Xu et al. [6] show that 73.1% of the runoff reduction in the Haihe River Basin was caused by changes in land use and land cover. Gao et al. [20] used the Budyko–Fu equation to evaluate the effect of climate change and human activities on the hydrology of the Weihe River Basin from 1961 to 2009. They found that climate change accounted for 63.9% of the decrease in runoff in the basin. Xue et al. [35] used the double mass curve method and the elasticity method to quantify the runoff variation in the Tarim River Basin from 1960 to 2015. Their study used the Budyko, Mezentsev–Choudhury–Yang, and Budyko–Fu equations to show that human activities were the main cause of the reduction in runoff in the basin. The results of these studies show that the Budyko framework is a practical and dependable method that can provide assessments consistent with the actual situation.
The precipitation in Taiwan mainly comes from the spring frontal system, tropical cyclones and the heavy rain caused by the southwesterly flow in summer, and the northeast monsoon which brings moisture and rainfall to northern Taiwan in the winter. These climate events have brought abundant rainfall to Taiwan in different seasons, with the average annual precipitation reaching 2510 mm from 1949 to 2018 [48]. However, Taiwan still faces insufficient water resources due to its geography. Because most of Taiwan’s rivers are short and have steep slopes and a high flow velocity, the basin cannot fully conserve water resources, causing most of the precipitation to be lost to runoff. Limited by the innate geographical conditions and the influence of human activities, Taiwan faces multiple water resource problems, such as development difficulties, water quality, availability and flooding. Under climate change, rainfall patterns change over time and space, making it more challenging to manage water usage. At present, the annual precipitation over Taiwan as a whole remains approximately steady, but the precipitation in northern Taiwan is increasing and the precipitation in southern Taiwan is decreasing, indicating that the rain belt has moved northward. In addition, the average number of rainy days across Taiwan has decreased, and the rainfall intensity (the ratio of rainfall to rainy days) has also increased in various regions [49]. This result indicates that we are facing increasingly extreme weather. Northern Taiwan is a densely populated area; thus, the land and water resources are very valuable. In the past, the impact of human activities and land policies on the hydrological environment have not been well quantified, and so the extent of their impact is difficult to determine. Gaining a better understanding of how the hydrological cycle will change in river basins in northern Taiwan due to climate change and human activities and providing quantitative results will be helpful in developing water resource management and soil conservation policies in the future.
2. Study Area
The administrative districts in northern Taiwan include Yilan County, Keelung City, New Taipei City, Taipei City, Taoyuan City, and Hsinchu County. The main basins in the area are Lanyang, Danshui, Fengshan and Touqian river basins, with drainage areas of 978, 2726, 250.1 and 565.9 km2, respectively, among which the Danshui River Basin covers the largest area. From 1949 to 2017, the average annual streamflow of the entire area was 15.15 billion m3. The average annual streamflow during the wet season (May–October) was 9.52 billion m3, and that in the arid season (January–April) was 5.62 billion m3; the difference of streamflow between wet and arid seasons is relatively low compared to other regions of Taiwan. The winter rainfall in the region mainly comes from the northeast monsoon, and typhoons are the dominant source of water in the summer. The average annual precipitation from 1949 to 2017 was 2933.90 mm. Northern Taiwan is a relatively wet area compared to the central, southern and eastern parts of Taiwan [48].
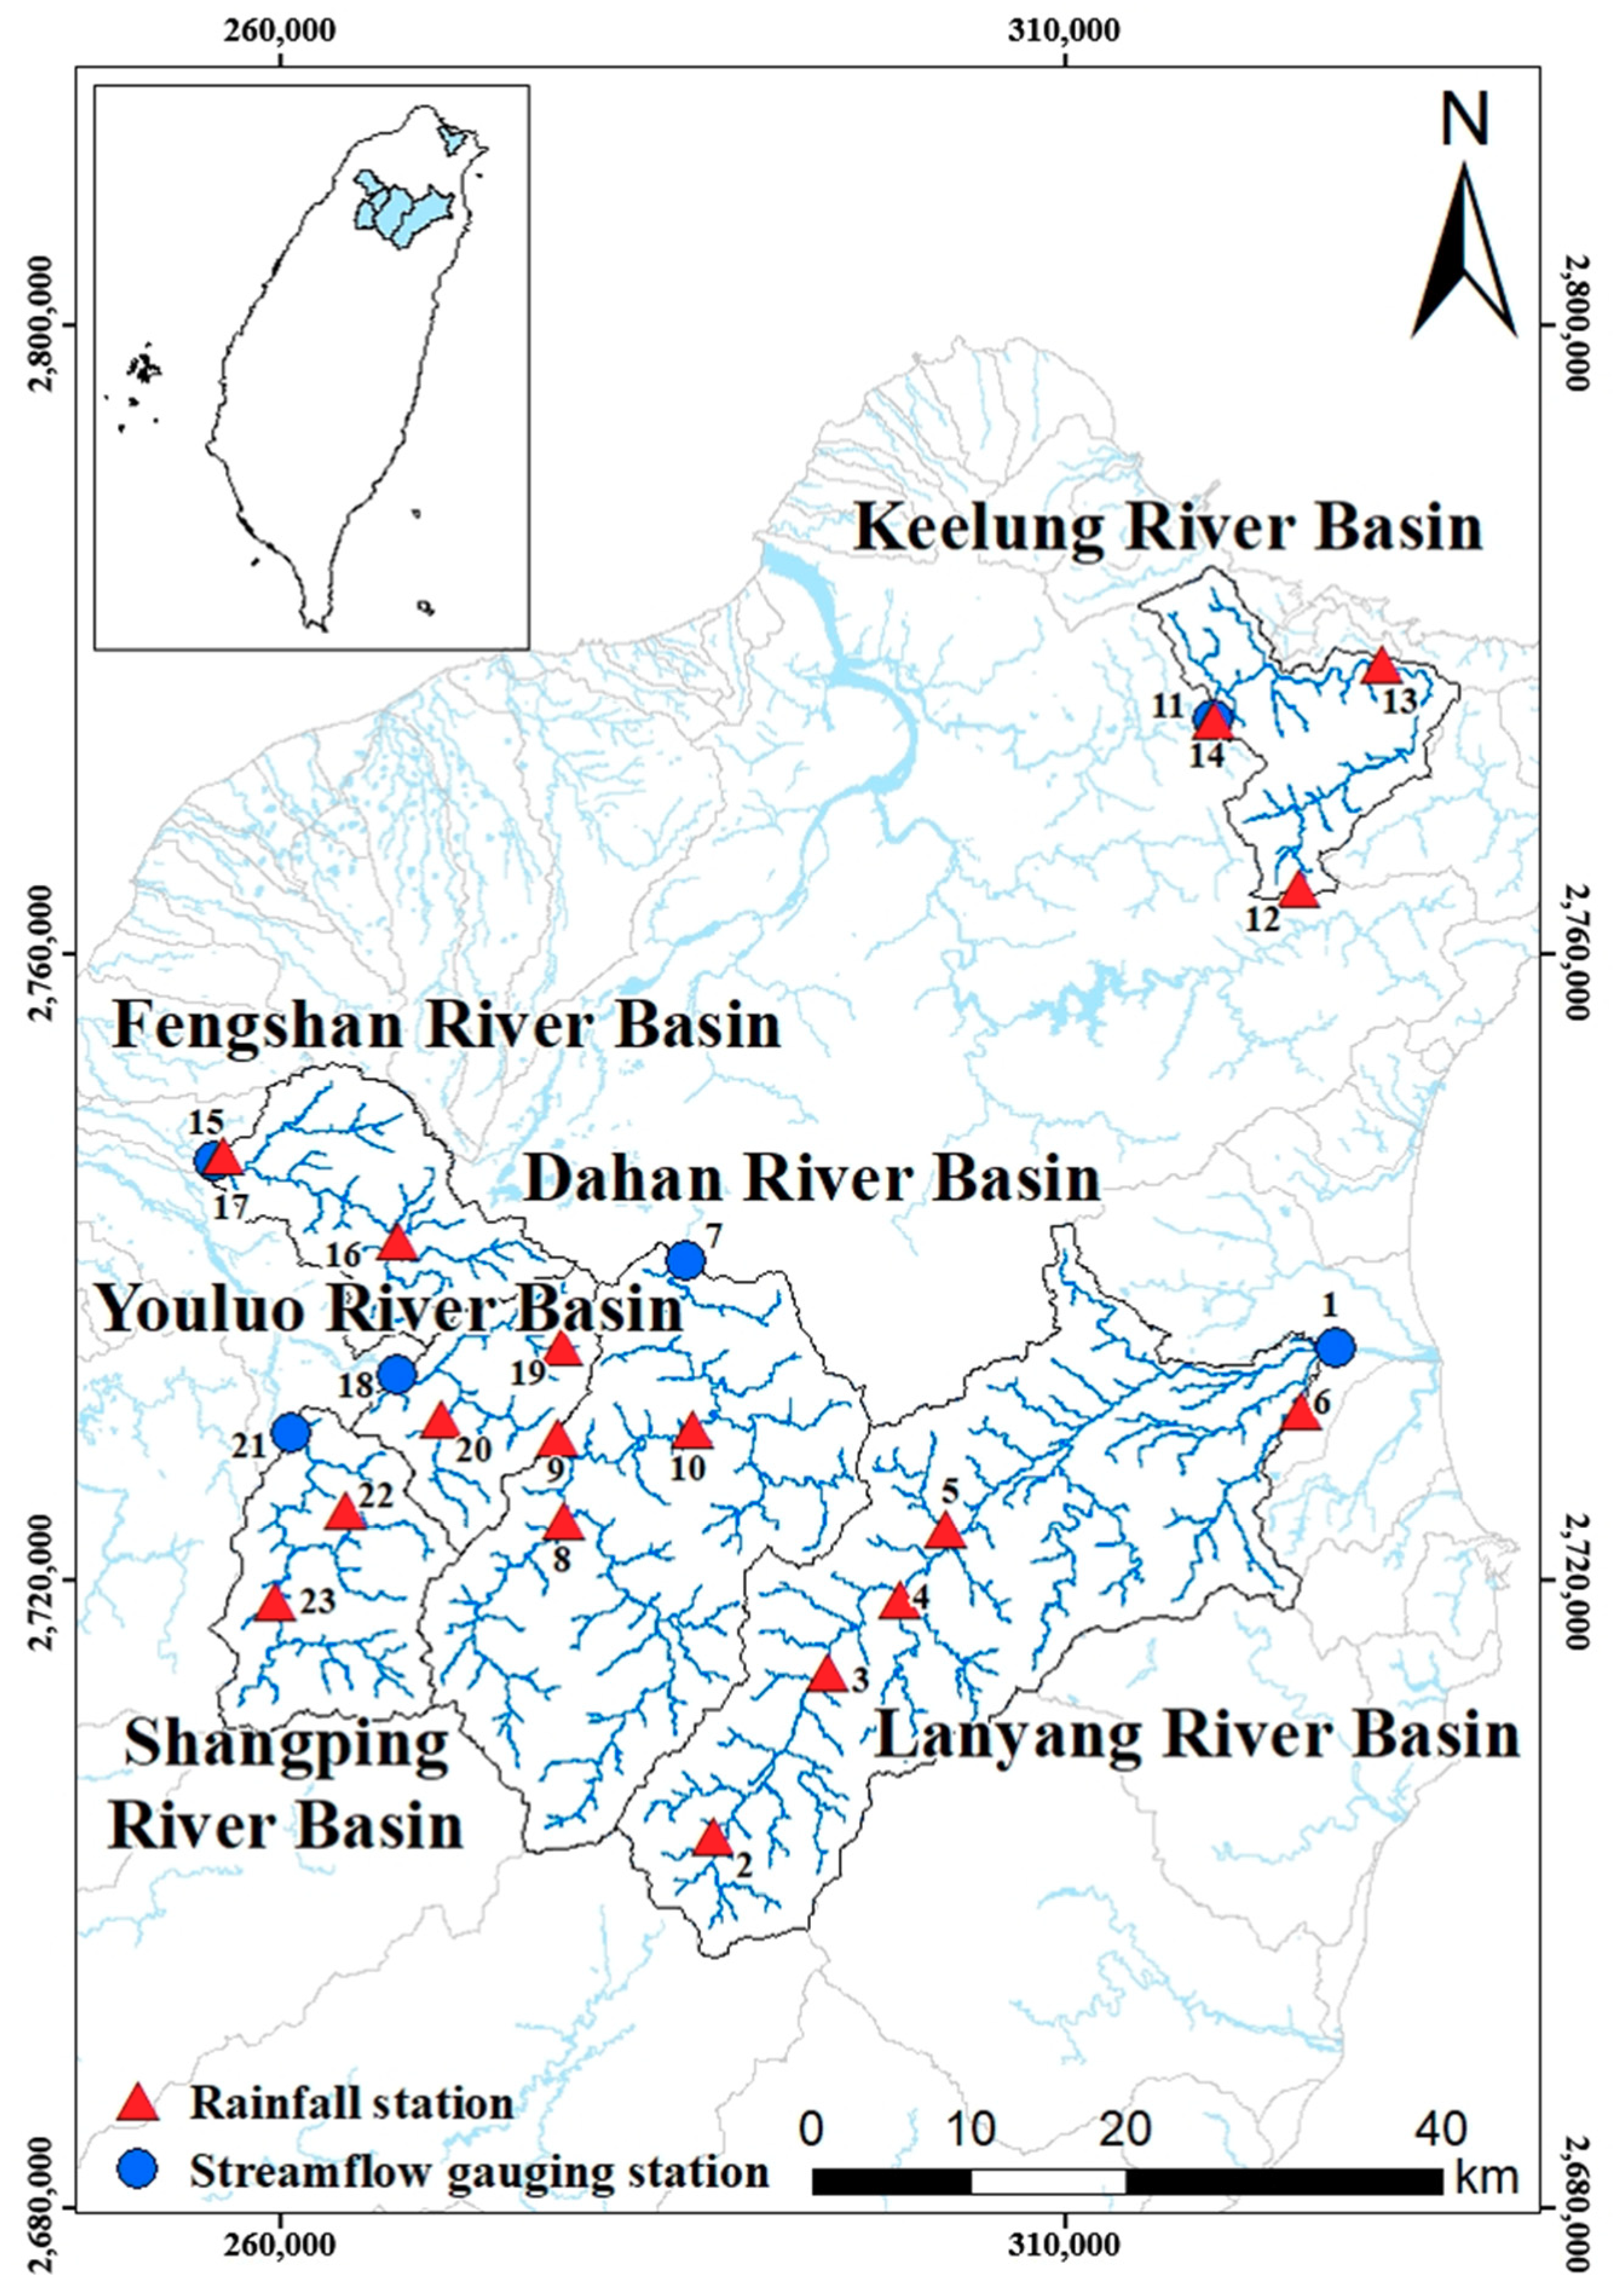
For this study, we selected the Lanyang, Keelung, Dahan, Fengshan, Youluo and Shangping river basins in northern Taiwan as the study area. The Dahan and Keelung Rivers are tributaries of the Danshui River Basin, and Youluo and Shangping Rivers belong to the sub-basin of the Touqian River Basin. This study uses the streamflow gauging station established by the Water Resources Agency of the Ministry of Economic Affairs to define watershed areas of 820.69, 622.8, 204.41, 208.06, 139.07 and 221.73 km2, with average elevations of 955.20, 1614.81, 251.78, 258.84, 977.80 and 1251.48 m, respectively. The map of the basins is shown in Figure 1.
3. Methodology
To evaluate the variation of precipitation and streamflow in northern Taiwan, we selected the rainfall stations and streamflow gauging stations set up by the Water Resources Agency for analysis. The details are shown in Table 2, the coordinate in two–degree zone Transverse Mercator projection is represented in TM2_X and TM2_Y. The average precipitation in each basin is calculated using the Thiessen polygon method [50]. If there are less than three rainfall stations available in the basin, the average precipitation is calculated by the arithmetic average method. This study uses potential evapotranspiration data provided by Global Land Evaporation Amsterdam Model (GLEAM) [51,52]. GLEAM is a database of evapotranspiration based on satellite telemetry data, providing a global raster with a 0.25° × 0.25° resolution between 1980 and 2017, including transpiration, bare-soil evaporation, interception loss, open-water evaporation, sublimation, and potential evapotranspiration calculated based on the Priestley–Taylor equation [53]. According to different datasets used to calculate the forcing variable, GLEAM can be divided into two versions: GLEAM v3.2a and GLEAM v3.2b. The GLEAM v3.2a version provides data from 1980 to 2017, while GLEAM v3.2b version only offers data from 2003 to 2017; accordingly, this study uses data from GLEAM v3.2a.
The data analysis methods used in this study to further evaluate the trends, breakpoints, and variation of hydrological data in northern Taiwan include the Mann–Kendall trend test, Mann–Whitney–Pettit test, and the elasticity method based on the Budyko framework.
3.1. Mann–Kendall Trend Test
The Mann–Kendall trend test [54,55] is a non-parametric analysis that has been widely deployed in various hydrological and meteorological studies, providing tests to determine the statistically significant trend of a data sequence. The Mann–Kendall trend test is remarkable for its high reliability; many studies have proved that it is valid for the trend verification of time series data [56,57]. The test is basically a double-tailed test with a null hypothesis that the data sequence does not have a significant trend. If the null hypothesis is rejected, then the data sequence has a significant trend. A statistic S is defined as
where , are the data arranged in time, and n represents the amount of data. In the case of n ≥ 10, the statistic S will follow a normal distribution, meaning that the variation is as follows, and furthermore that the test statistic Z of the double-tailed test can be obtained:
Under the 90% confidence level, according to the critical value method, if the Z value is larger (smaller) than positive (negative) 1.65, then the null hypothesis is rejected, indicating that the data have a significant trend.
3.2. Mann–Whitney–Pettit Test
The Mann–Whitney–Pettit test [58] has been generally applied in the detection of the existence of a break point in a data sequence. Assuming that there is a break point Xt in the data sequence {X1, X2, X3, …, Xn}, then this sequence can be divided into two unequal paragraphs F1(X) = {X1, X2, X3, …, Xt} and F2(X) = {Xt+1, Xt+2, Xt+3, …, Xn}; therefore, we define a statistic as
If increases with time t, this signifies that the sequence does not have a break point; conversely, if presents a downward trend against time t, this indicates that a break point occurred in the series. Usually, if multiple adjacent break points exist in a series, the maximum value will be determined as the break point:
The formula for calculating the probability of break points is defined as follows:
Considering some data series may have multiple break points, Equation (13) can further determine the probability of a break point.
3.3. Elasticity Method
In an ideal watershed, the water balance equation can be expressed as
where is rainfall, is the actual evapotranspiration is the streamflow, and is the water storage change. When the study period is longer than a decade or uses a long-term scale, the water storage change within a basin can be assumed to be ignored [46]. In order to quantify the hydrological variation in the basin, this study uses streamflow as an indicator. If the break point is detected, the analysis period can be divided into the baseline period and the variation period. It is commonly assumed that the baseline period of the basin is a more undeveloped or less human disturbance; additionally, the variation period represents the basin being disturbed after the period of change in streamflow. The quantity of streamflow variation can be expressed as
where is the total streamflow change, represents the average annual observed streamflow during the variation period, and is the average annual observed streamflow of the baseline period. The variation of streamflow is divided here by the summation of climatic factors and non-climate factors:
where denotes the amount of streamflow variation caused by climate change, and is the amount of streamflow variation caused by non-climate factors. The percentage change caused by climate change and non-climate factors on streamflow can be further determined:
where is the percentage change in streamflow caused by climate change, and is the percentage change caused by non-climate factors. According to Equation (2), the Budyko equation can be expressed as a function of E, P, N, and E0, where N is the watershed characteristic parameter of the equation and is often adjusted to an individual representation according to the model. This study applies the Budyko–Fu and Budyko–Mezentsev–Choudhury–Yang equations which have been commonly used in similar research [6,8,16,20,26,59,60]. The Budyko–Fu equation represents the watershed characteristic parameter as m, while the Budyko–Mezentsev–Choudhury–Yang equation represents watershed characteristics using the variable n. Their equations are shown in Table 1. Combining Equation (2) with Equation (14), the following relationship can be obtained:
Based on the functional form of Equation (19), the change in streamflow caused by climate change and watershed characteristics can be expressed as
According to the definition of elasticity (1), Equation (20) can be rewritten as
where , and are the elasticity coefficients of streamflow to precipitation, potential evapotranspiration, and the watershed characteristic parameter, respectively. They can be obtained from the following formula:
If the value of the elasticity coefficient is a, when the x factor is increased by 1%, the streamflow will increase by a%. Moreover, the quantity of streamflow change caused by climatic factors can be calculated as follows:
where , and are the long-term average annual streamflow, precipitation and potential evapotranspiration, respectively. After is calculated, can be solved by Equation (15); therefore, the change of streamflow contributed by climate change and non-climate factors can be identified.
4. Results and Discussion
4.1. Trend Analysis
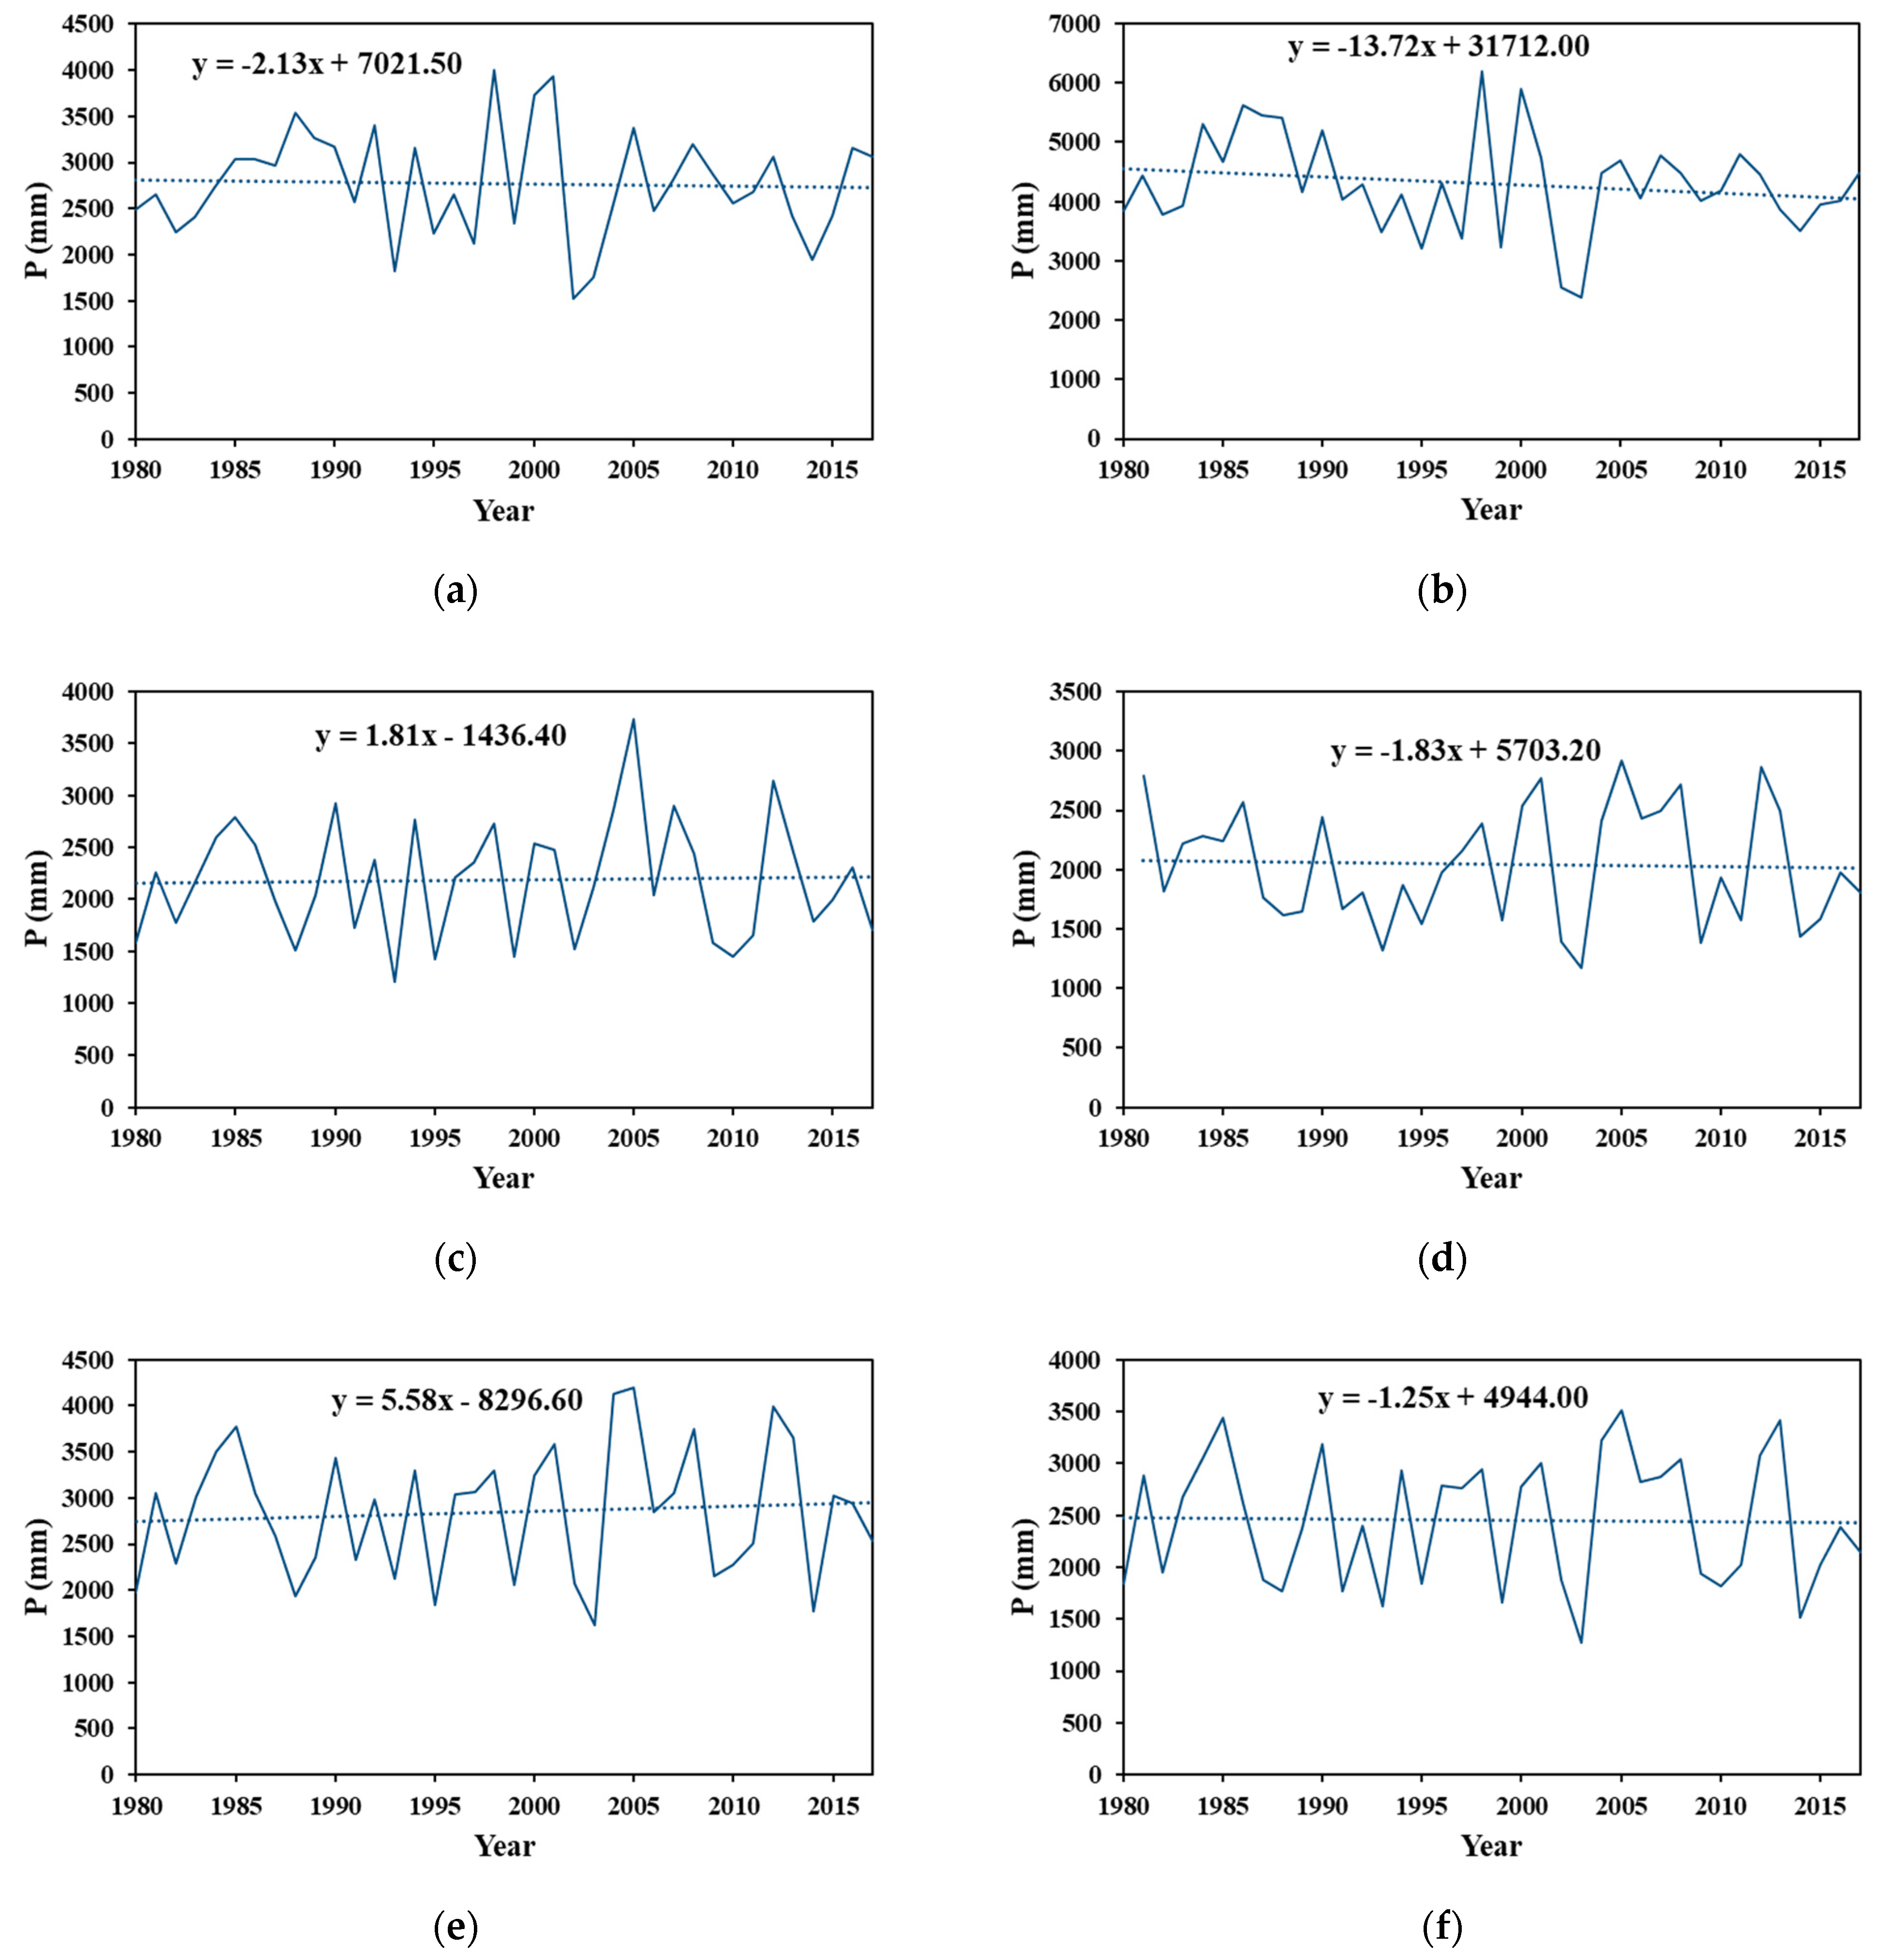
This study conducted trend analyses based on hydrological data of the major river basins in northern Taiwan, including the precipitation, streamflow, and potential evapotranspiration of Lanyang, Keelung, Dahan, Fengshan, Youluo and Shangping river basins. Figure 2 shows the trend of annual precipitation in each catchment. The average annual precipitation in the region during 1980~2017 is between 2043.57 to 4289.96 mm, in which the Keelung River Basin has the highest precipitation and the lowest precipitation is in the Fengshan River Basin. The long-term precipitation of Dahan and Youluo river basins showed an upward trend, with the highest slope of 5.578 mm/year appearing in the Youluo River Basin. Meanwhile, the precipitation in Lanyang, Keelung, Fengshan, and Shangping river basins shows a downward trend; the basin showing the largest slope value is the Keelung River Basin, which decreases at −13.72 mm/year. The Mann–Kendall trend test is applied to analyze the significance of the annual precipitation variation. The results indicate that the Z value of the annual precipitation in the Lanyang, Keelung, Dahan, Fengshan, Youluo, and Shangping river basins is sequentially shown as −0.05, −0.86, 0.11, −0.14, 0.38, and 0.23, as shown in Table 3. According to the trend test, there is no significant trend in the annual precipitation in any of the analyzed basins.
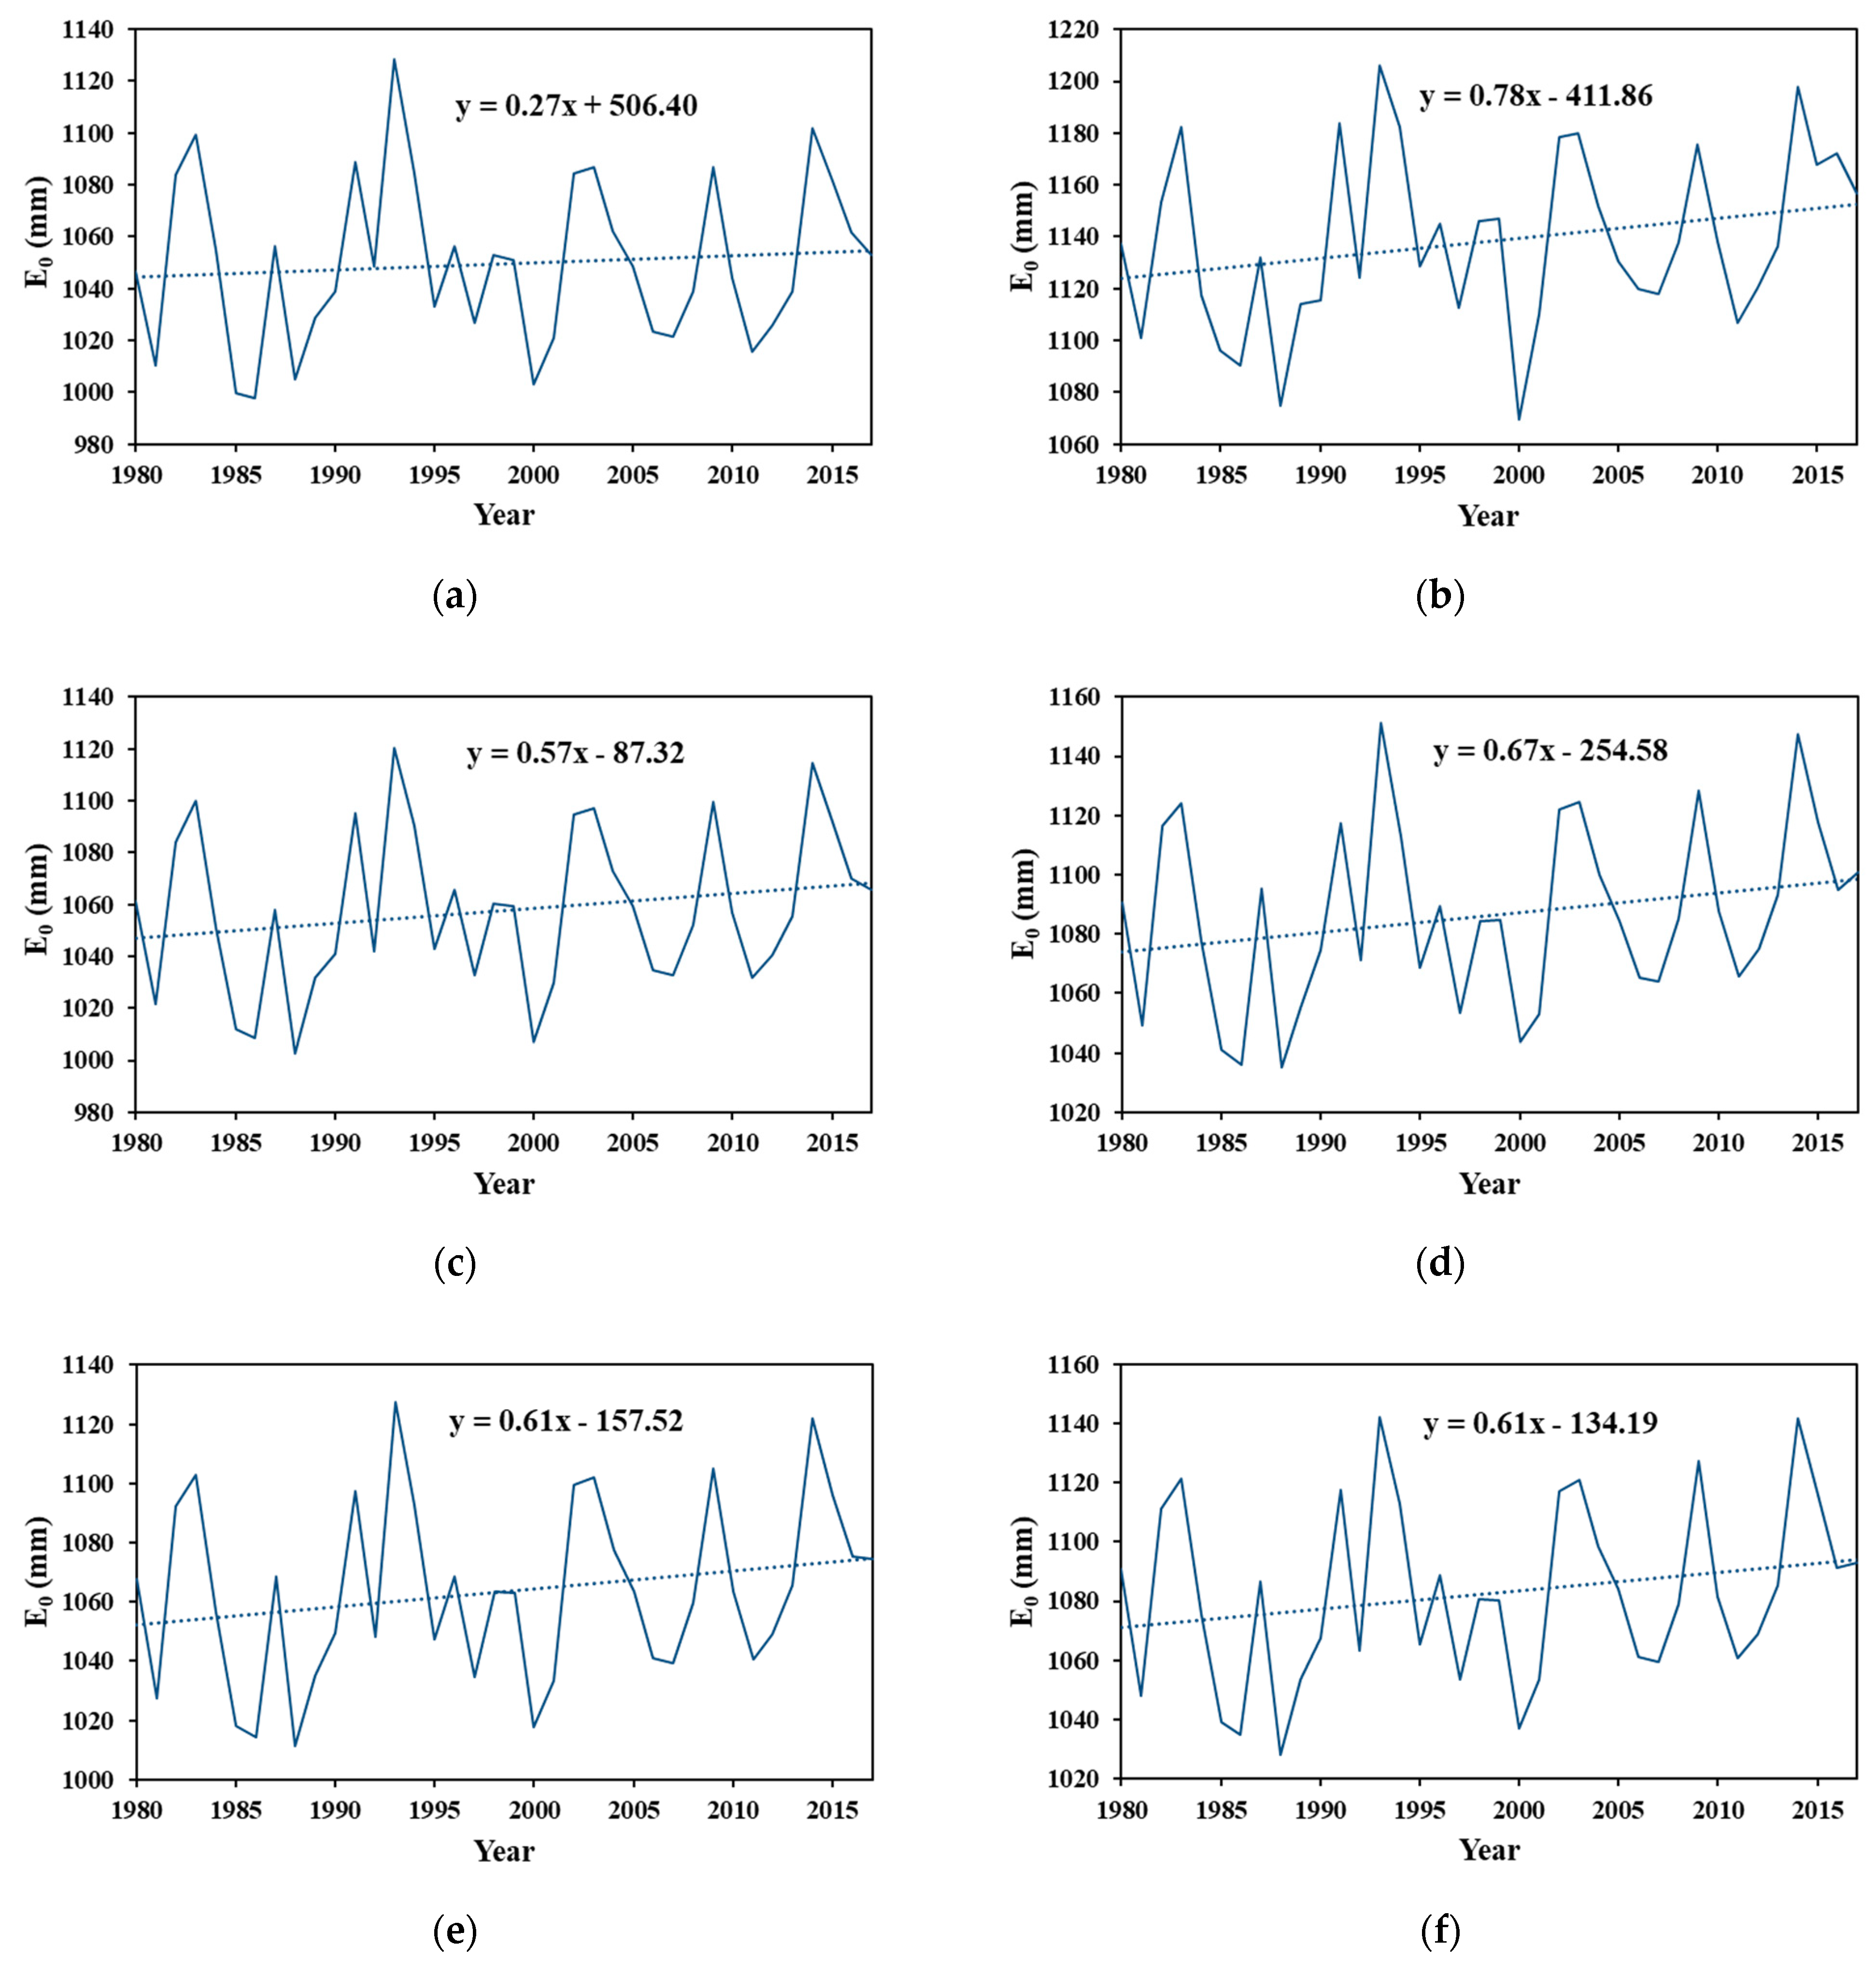
The potential evapotranspiration of each basin is shown in Figure 3. The average annual potential evapotranspiration of the Lanyang, Keelung, Dahan, Fengshan, Youluo and Shangping river basins during 1980~2017 ranged from 1049.77 to 1138.40 mm, and the slope of the long-term data ranged from 0.27 to 0.78 mm/year, in which all the basins showed an upward trend. Among these, the Keelung River Basin has the highest slope, and the Lanyang River Basin has the lowest. The results of analyzing the trend of potential evapotranspiration through the Mann–Kendall trend test are shown in Table 3. The Z values of potential evapotranspiration in Lanyang, Keelung, Dahan, Fengshan, Youluo and Shangping river basins are 0.55, 1.51, 1.11, 1.58, 1.38 and 1.38, respectively, and this indicates that the trends of potential evapotranspiration in all of the study basins are not statistically significant.
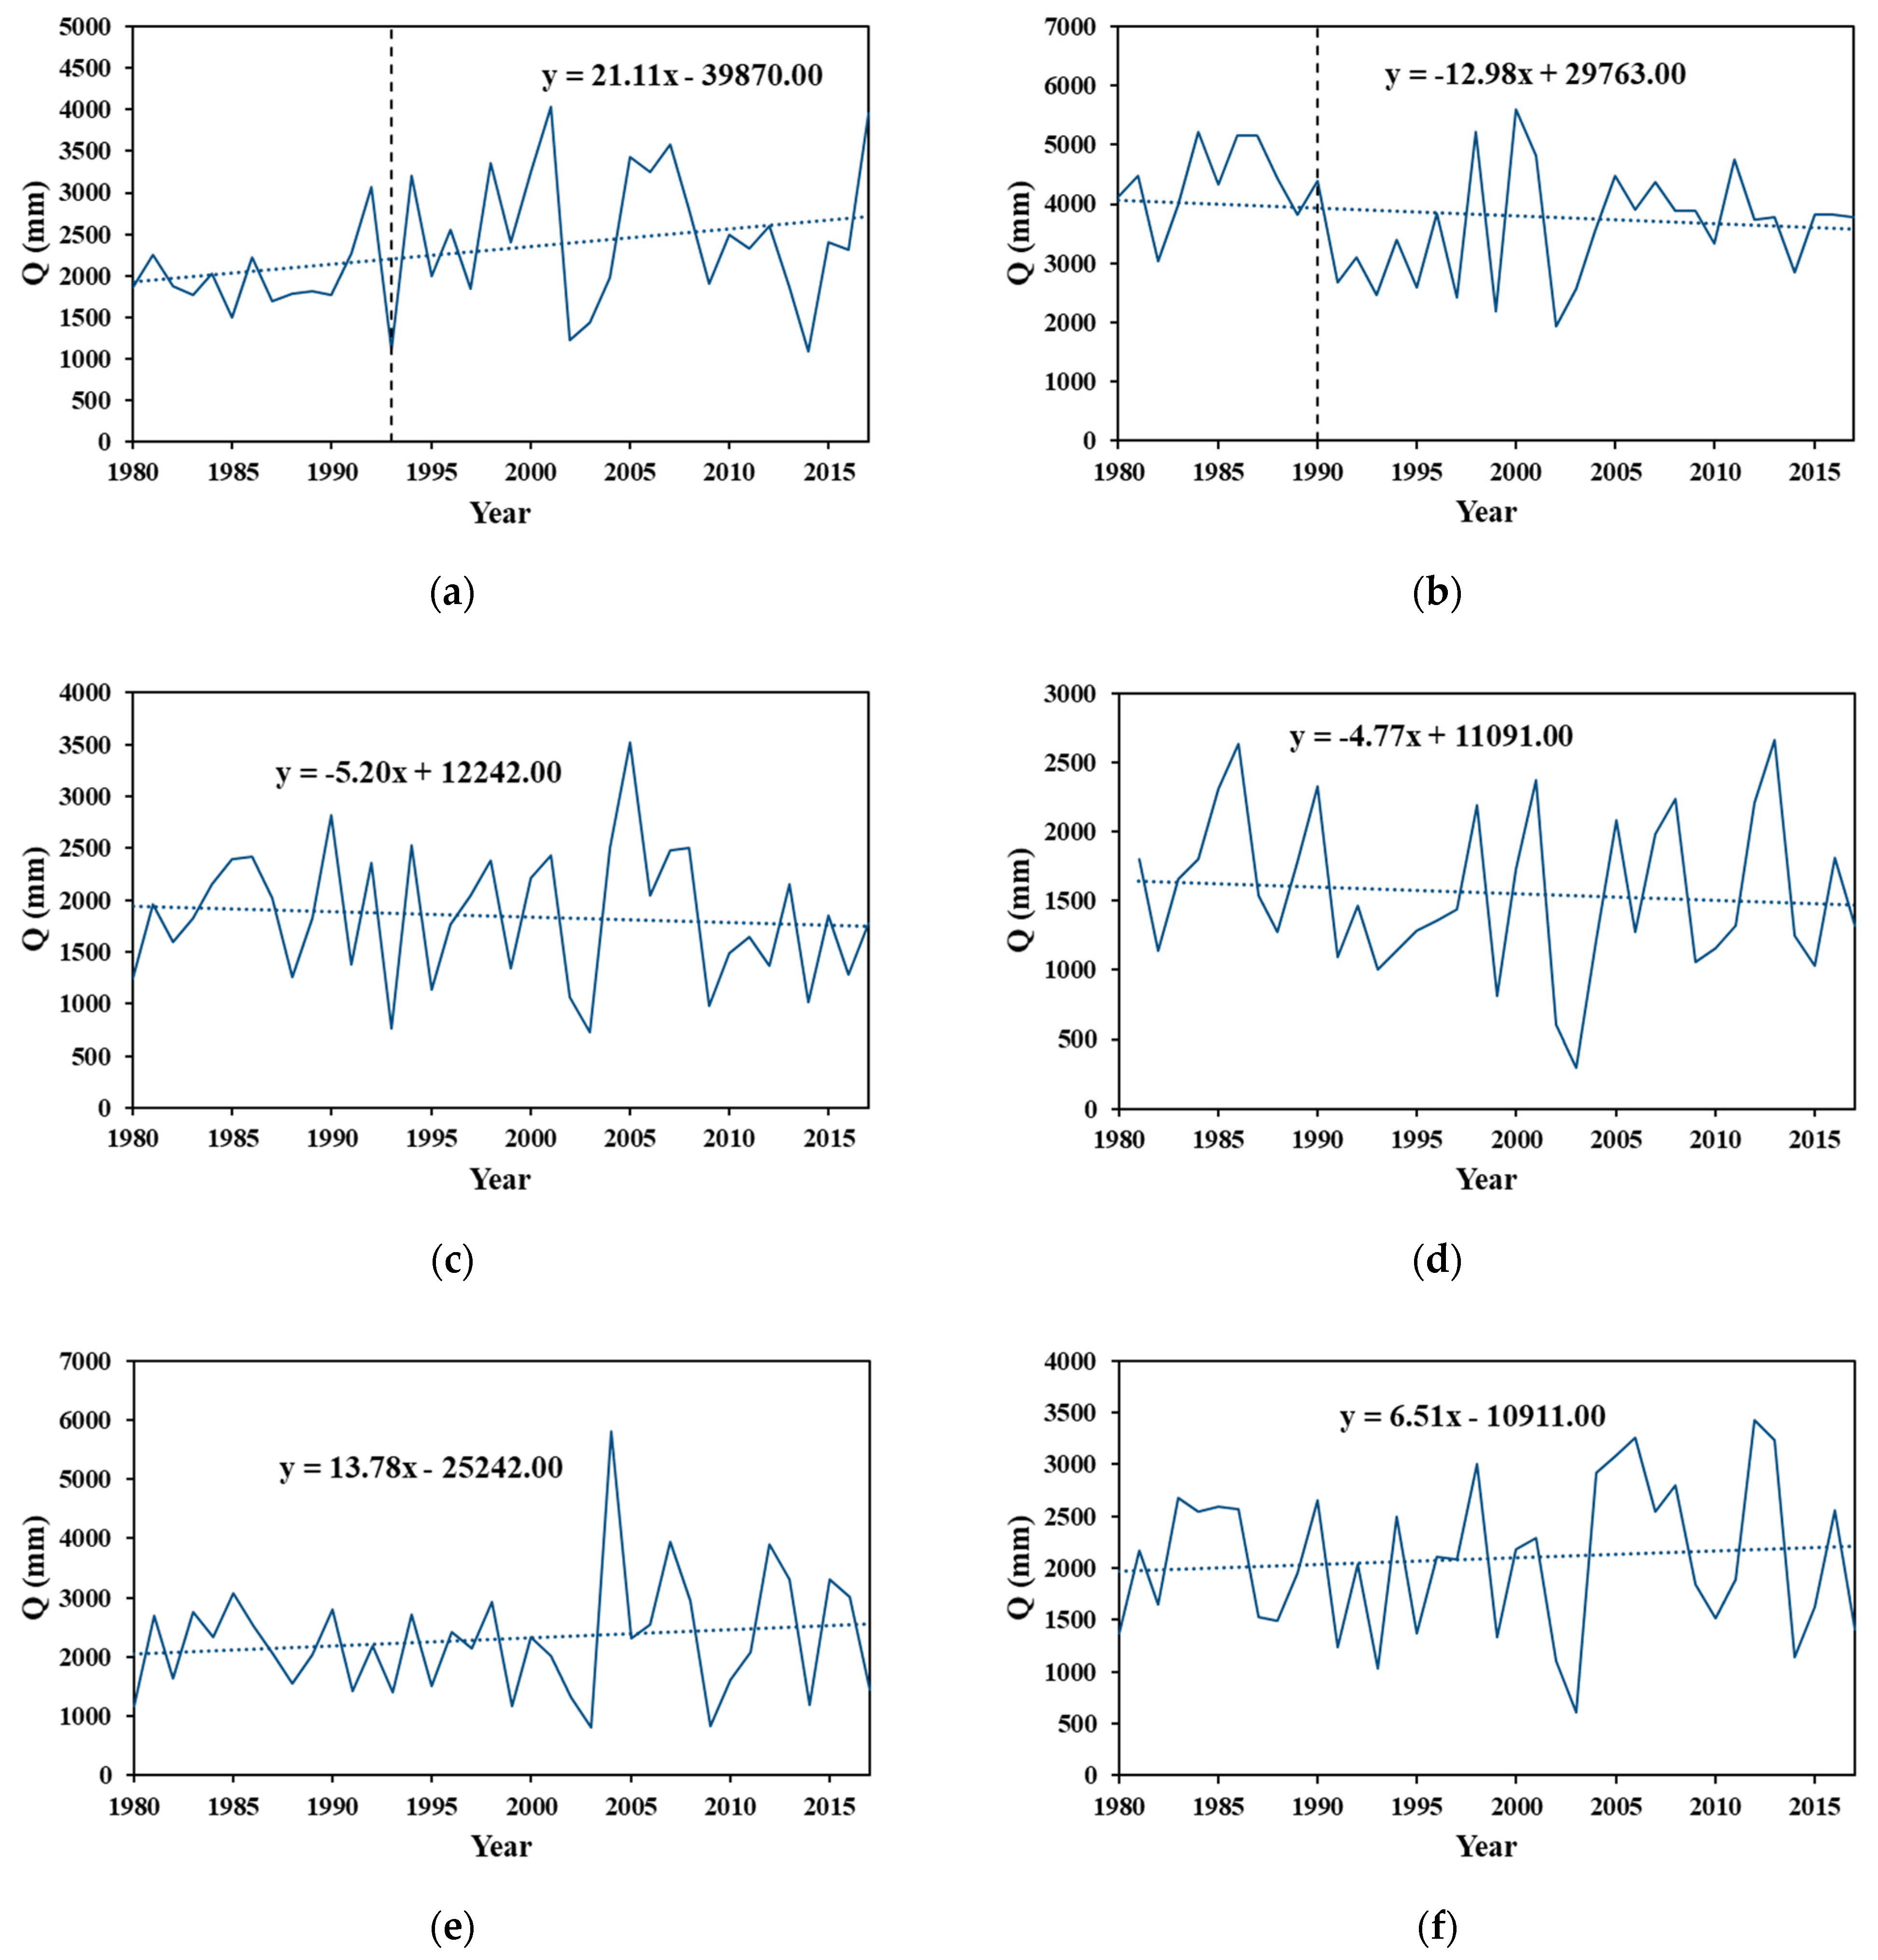
Figure 4 shows the streamflow trends of Lan Yang Bridge Station in the Lanyang River Basin, Wu Tu Station in the Keelung River Basin, Xia Yun Station in the Dahan River Basin, Xsin Pu Station in the Fengshan River Basin, Nei Wan Station in the Youluo River Basin and Shang Ping Station in the Shangping River Basin. The highest average annual streamflow of all stations is 3381.72 mm in the Keelung River Basin, and the lowest is 1559.83 mm in the Fengshan River Basin. Lanyang River Basin, Youluo River Basin and Shangping River Basin all show upward trends in streamflow, with the highest slope being 21.11 mm/year in the Lanyang River Basin. Regarding the streamflow in the Keelung, Dahan and Fengshan river basins, the lowest slope was −12.98 mm/year, in the Keelung River Basin. Between these six streamflow gauging stations, the results for the Mann–Kendall trend test Z value are 2.01, −1.31, −0.40, −0.54, 0.58 and 0.48, which indicates that only the Lan Yang Bridge Station in Lanyang River Basin has a significant (increasing) trend.
In this study, the Mann–Whitney–Pettit test is used to determine the break point, which is the time with the highest probability of abrupt change in hydrological data, and P = 0.90 is defined as the threshold. The results are shown in Table 3. According to the test, the streamflow break points in the Lanyang and the Keelung river basins occurred in 1993 (P = 0.97) and 1990 (P = 0.94), respectively, while the other variables had no significant break point. Based on the abrupt change occurring at the time of the streamflow break point, this study divides the streamflow and climate data into a baseline period and variation period to discuss the hydrological variation occurring between these two periods.
4.2. Impacts of Climate Change and Non-Climate Factors on Streamflow
This study uses the Budyko–Fu and Budyko–Mezentsev–Choundhury–Yang equations to evaluate streamflow trends in the Lanyang and Keelung river basins. The results are shown in Table 4. Compared with the baseline period, the streamflow of the Lanyang River Basin increased by 32.50% during the variation period. The influence of climate change on the streamflow change (ηc1imate) ranged from −9.01% to −8.99%, and the impact of the non-climate factors (ηnon-climate) ranged from 109.01% to 108.99%, revealing that non-climate factors are a dominant factor in increasing streamflow. Conversely, the streamflow in the Keelung River Basin decreased by 18.11% during the variation period, and the impact of climate change was the critical factor of the streamflow variation, accounting for 71.75% to 71.30% of the total change, while non-climate factors accounted for 28.25% to 28.70% of the variation.
The effects of non-climatic factors include terrain changes, vegetation changes and human activities. In 1979, the Lanyang area implemented the “Integrated Conservation and Flood Control Program in Yilan Area and Eastern Taiwan”. This work includes soil–water conservation on slope land, forest management, the treatment of landslides, engineering work on check dams and flood control. Due to the considerable work on soil and water conservation and regulation programs in the Lanyang River Basin during this period, we speculate that the fluvial pattern was changed, affecting the runoff response. We looked at the Normalized Difference Vegetation Index (NDVI) to evaluate the changes of vegetation cover in the Lanyang River Basin before and after the implementation of the program. Considering historical records, seasons, clouds and solar zenith angles, we selected images from Landsat2, Landsat5 and Landsat8 for analysis [61,62]. We analyzed the following cloudless satellite images from August to November: 4 September 1978 (Landsat2); 31 August 1993 (Landsat5); 1 November 2004 (Landsat5); and 13 March 2018 (Landsat8). Because no cloudless image over the Lanyang River Basin could be obtained from August to November after 2010, an image with better quality in March 2018 was selected for analysis. We compared the NDVI images from March 2018 with the NDVI image from 16 November 2015, which was slightly clouded, and the comparison produced similar results, suggesting that NDVI values of March 2018 were representative and credible. The NDVI values and variations in the Lanyang River Basin are shown in Figure 5 and Figure 6. Table 5 lists the NDVI differences of the basin. The NDVI increased by 78.85% of the total area in the Lanyang River Basin between 1978 and 1993. It is notable that the NDVI reduction in the downstream Lanyang Plain originated from the seasonal changes in farming. Figure 6a shows that the vegetation in the basin increased during this period. However, between 1993 and 2004, the NDVI in the Lanyang River Basin shows a downward trend. The proportion of the area where NDVI values decreased in the basin was 71.32%, of which 47.74% was concentrated in the range of 0 to −0.1. From 2004 to 2018, NDVI presents a more strongly declining trend. The area of NDVI reduction reaches 91.76% of the total area, with most of the drop occurring between −0.2 to −0.3, accounting for 44.46% of the area. According to the environmental conservation policy implemented earlier in this region, the increase of NDVI in the baseline period could be evidence of afforestation. Nevertheless, from 1993 to 2018, the NDVI began to decline, revealing that the plant cover was also decreasing throughout the variation period.
Many studies have previously reported the case of large-scale afforestation-induced runoff reduction in this particular basin [8,14]. It is understood that the increase of forests regularly co-occurs with more vigorous evapotranspiration, which leads to the loss of streamflow; on the contrary, the reduction of vegetation coverage by clear cutting or similar behavior will increase runoff [14,63,64]. Due to implementation of the “Integrated Conservation and Flood Control Program in Yilan Area and Eastern Taiwan”, the vegetation of the Lanyang River Basin increased during the baseline period, and, accordingly, the streamflow in the baseline period decreased. Nevertheless, the NDVI data indicate that the vegetation began to decrease in the post-1993 period, creating a breakpoint and causing the streamflow to increase. The results indicate that changes in vegetation are related to hydrological variation in the Lanyang River Basin, but the factors that triggered the decrease in vegetation in the Lanyang River Basin after 1993 may include human activities, natural disasters and climate change, which require further research.
The Keelung River Basin has the most abundant precipitation of all the basins in the study area. Its decrease in streamflow was mainly caused by the decrease of precipitation. Therefore, the future management of the basin should consider the hydrological impact of precipitation changes due to climate change to establish an effective water use and deployment policy. The impacts of climate and non-climate factors on the streamflow changes in the basins of northern Taiwan are quite similar between the two Budyko models, indicating that either the Budyko–Fu model or the Budyko–Mezentsev–Choudhury–Yang model can be used for reliable watershed hydrological analysis.
4.3. Sensitivity Analysis of Streamflow Variation
By analyzing the sensitivity of each basin, the response patterns of hydrological changes in the different basins of northern Taiwan can be understood, helping us to propose further analysis. Table 6 shows the sensitivity analysis of streamflow variation with respect to precipitation, potential evapotranspiration, and watershed characteristic parameters. The elasticities of streamflow to precipitation of the study basin are between 1.05 and 1.37, indicating that for every 1% increase in precipitation, the basins of northern Taiwan will increase their streamflow by 1.05% to 1.37%. Among the climate change factors, the sensitivity of the streamflow to the change of the potential evapotranspiration is not as significant as the precipitation, which has an elasticity between −0.04 and −0.37, suggesting that for each 1% increase in potential evapotranspiration, the streamflow will be reduced by 0.04% to 0.37%. The elasticity of the watershed characteristic parameter m of the Budyko–Fu equation, which represents the sensitivity of streamflow to human-induced changes to the basin, ranged from −0.27 to −0.79. The lowest and highest m elasticity values occurred in the Lanyang and the Dahan river basins during the baseline period, denoting that each 1% increase in the parameter m will reduce the streamflow in the basin by −0.28% to −0.79%. The elasticity of the Budyko–Mezentsev–Choudhury–Yang equation parameter n is between −0.13 and −0.33, and the lowest and highest elasticity values occurred during the baseline period of the Keelung and Fengshan river basins. For every 1% increase in n, the streamflow in the basin will be reduced by −0.13% to −0.33%. The sensitivity of the two equations varies among the basins, indicating that the watershed characteristic parameters perform differently for the variation of the watershed characteristics.
According to the results of the sensitivity analysis, the precipitation elasticity of streamflow in northern Taiwanese basins is higher than the elasticity to either potential evapotranspiration or watershed characteristics. The influence of the change of watershed characteristics is the second most important factor. These results indicate that under climate change, the spatial and temporal changes of precipitation have the most significant impact on water resources in the river basins of northern Taiwan, and anthropological activities will also have a certain degree of impact on the basins. Regardless of whether we examine the past or future, this result is a reminder of the importance of implementing governance policies that cope with environmental changes and keep pace with the times.
5. Conclusions
The river basins in northern Taiwan cover a large area of the original forest and play an important role in supplying water to nearby densely populated metropolitan areas. These river basins are valuable for soil and water conservation. Assessing changes in water resources due to environmental changes has become an important issue. In this study, we analyzed trends and breakpoints in precipitation, potential evapotranspiration and streamflow data in the Lanyang, Keelung, Dahan, Fengshan, Youluo and Shangping river basins from 1980 to 2017 and calculated the elasticity of streamflow to each change factor. We found no significant trend in the precipitation and potential evapotranspiration for any of the basins. The streamflow at the Lan Yang Bridge station, however, showed a significant upward trend. The results of the break point test further showed that the streamflow of the Lanyang River Basin and the Keelung River Basin change abruptly in the years 1993 and 1990. According to the Budyko–Fu equation and Budyko–Mezentsev–Choudhury–Yang equations, the factors affecting the increase of streamflow in the Lanyang River Basin are mainly non-climatic factors, accounting for 109.01% to 108.99% of the total streamflow variation after the baseline period, thus implying that all of the increase in streamflow is due to non-climate factors. The streamflow reduction in the Keelung River Basin is mainly attributed to climate change, accounting for 71.75% to 71.30% of the total change. Among the study basins, only the Lanyang River Basin is covered by the implementation area of the “Integrated Conservation and Flood Control Program in Yilan Area and Eastern Taiwan”. According to the results of the streamflow variation analysis, the afforestation and water conservation engineering implemented within the program are highly correlated with the streamflow abrupt change in 1993; however, the factors affecting forest vegetation are quite complex. The induced factors of the vegetation decrease in the Lanyang River Basin during the variation period may include the impact of human activities, natural disasters or changes in climatic conditions, such as afforestation or land use change. In the case of complex mechanisms, further evidence and a discussion of this phenomenon are required. In any case, this result will be used as a reference for future economic development and environmental conservation policies in northern Taiwan, as a case study of the impact of large-scale watershed remediation on water resources.
We compared elasticity values in each basin and found that precipitation is the most sensitive factor for the change of streamflow in northern Taiwan, suggesting that the basins belong to a more stable hydrological environment which is less sensitive to human activities. The assumptions made in this study include the following: (1) the change of water storage in a basin is considered to be approximately equal to zero over a long-term period; (2) if a period of data is longer than 30 years, it is considered stable; and (3) the mean data value of the baseline period is assumed to represent the early conditions in the basin, which should be less affected by climate change and human activities. These assumptions are widely applied in many studies of Budyko curve and streamflow variation analysis, but how they affect the interpretation of Budyko curve analysis can still be discussed further. In addition, the uncertainty within the Budyko parameters is not discussed in this paper due to data limitation, but it does have an influence on the interpretation of results, which is recommended for discussion in future work.
For the planning and governance of river basins in the future, the impact of climate change on the hydrological environment will remain an important issue for water resources in northern Taiwan. At the same time, to achieve the purpose of the sustainable management and utilization of the environment, in the water sources of large-scale metropolitan and industrial areas, corresponding environmental policies (e.g., advanced investigation of environmental issues and restoration) should be further developed, and continuous attention to the impact of human activities on the watershed is still essential. This result could provide a basis for the quantification of the proposed basin governance policy in the future.
Author Contributions
C.-H.L. contrived the subject of the article, performed the literature review and contributed to the writing of the paper; H.-F.Y. participated in data processing and the elaboration of the statistical analysis and figures.
Funding
This research received no external funding.
Acknowledgments
The authors are grateful for the support from the Headquarters of University Advancement at the National Cheng Kung University, sponsored by the Ministry of Education, Taiwan, ROC.
Conflicts of Interest
The authors declare no conflicts of interest.
References
- Mach, K.; Mastrandrea, M. Climate Change 2014: Impacts, Adaptation, and Vulnerability; Field, C.B., Barros, V.R., Eds.; Cambridge University Press: Cambridge, UK, 2014; Volume 1. [Google Scholar]
- Parry, M.; Lowe, J.; Hanson, C. Overshoot, adapt and recover. Nature 2009, 458458, 1102. [Google Scholar] [CrossRef]
- Huntington, T.G. Evidence for intensification of the global water cycle: Review and synthesis. J. Hydrol. 2006, 319319, 83–95. [Google Scholar] [CrossRef]
- Zhao, Y.; Yang, N.; Wei, Y.; Hu, B.; Cao, Q.; Tong, K.; Liang, Y. Eight Hundred Years of Drought and Flood Disasters and Precipitation Sequence Reconstruction in Wuzhou City, Southwest China. Water 2019, 1111, 219. [Google Scholar] [CrossRef]
- Huntington, T.G.; Billmire, M. Trends in precipitation, runoff, and evapotranspiration for rivers draining to the Gulf of Maine in the United States. J. Hydrometeotol. 2014, 1515, 726–743. [Google Scholar] [CrossRef]
- Xu, X.; Yang, D.; Yang, H.; Lei, H. Attribution analysis based on the Budyko hypothesis for detecting the dominant cause of runoff decline in Haihe basin. J. Hydrol. 2014, 510, 530–540. [Google Scholar] [CrossRef]
- Wang, C.; Wang, S.; Fu, B.; Zhang, L. Advances in hydrological modelling with the Budyko framework: A review. Prog. Phys. Geogr. 2016, 40, 409–430. [Google Scholar] [CrossRef]
- Li, Y.; Liu, C.; Zhang, D.; Liang, K.; Li, X.; Dong, G. Reduced runoff due to anthropogenic intervention in the Loess Plateau, China. Water 2016, 8, 458. [Google Scholar] [CrossRef]
- Chang, J.; Wei, J.; Wang, Y.; Yuan, M.; Guo, J. Precipitation and runoff variations in the Yellow River Basin of China. J. Hydroinform. 2017, 19, 138–155. [Google Scholar] [CrossRef]
- Zhao, Y.; Zou, X.; Liu, Q.; Yao, Y.; Li, Y.; Wu, X.; Wang, T. Assessing natural and anthropogenic influences on water discharge and sediment load in the Yangtze River, China. Sci. Total Environ. 2017, 607, 920–932. [Google Scholar] [CrossRef]
- Brown, A.E.; Zhang, L.; McMahon, T.A.; Western, A.W.; Vertessy, R.A. A review of paired catchment studies for determining changes in water yield resulting from alterations in vegetation. J. Hydrol. 2005, 310, 28–61. [Google Scholar] [CrossRef]
- Sharma, P.J.; Patel, P.L.; Jothiprakash, V. Impact of rainfall variability and anthropogenic activities on streamflow changes and water stress conditions across Tapi Basin in India. Sci. Total Environ. 2019, 687, 885–897. [Google Scholar] [CrossRef] [PubMed]
- Guo, L.P.; Mu, X.M.; Hu, J.M.; Gao, P.; Zhang, Y.F.; Liao, K.T.; Yu, Q. Assessing Impacts of Climate Change and Human Activities on Streamflow and Sediment Discharge in the Ganjiang River Basin (1964–2013). Water 2019, 11, 1679. [Google Scholar] [CrossRef]
- Roderick, M.L.; Farquhar, G.D. A simple framework for relating variations in runoff to variations in climatic conditions and catchment properties. Water Resour. Res. 2011, 47, 1–11. [Google Scholar] [CrossRef]
- Yang, H.; Yang, D. Derivation of climate elasticity of runoff to assess the effects of climate change on annual runoff. Water Resour. Res. 2011, 47, W07526. [Google Scholar] [CrossRef]
- Liang, W.; Bai, D.; Wang, F.; Fu, B.; Yan, J.; Wang, S.; Feng, M. Quantifying the impacts of climate change and ecological restoration on streamflow changes based on a Budyko hydrological model in China’s Loess Plateau. Water Resour. Res. 2015, 51, 6500–6519. [Google Scholar] [CrossRef]
- Tomer, M.D.; Schilling, K.E. A simple approach to distinguish land-use and climate-change effects on watershed hydrology. J. Hydrol. 2009, 376, 24–33. [Google Scholar] [CrossRef]
- Wang, D.; Hejazi, M. Quantifying the relative contribution of the climate and direct human impacts on mean annual streamflow in the contiguous United States. Water Resour. Res. 2011, 47, W00J12. [Google Scholar] [CrossRef]
- Li, Z.; Ning, T.; Li, J.; Yang, D. Spatiotemporal variation in the attribution of streamflow changes in a catchment on China’s Loess Plateau. Catena 2017, 158, 1–8. [Google Scholar] [CrossRef]
- Gao, G.; Fu, B.; Wang, S.; Liang, W.; Jiang, X. Determining the hydrological responses to climate variability and land use/cover change in the Loess Plateau with the Budyko framework. Sci. Total Environ. 2016, 557, 331–342. [Google Scholar] [CrossRef] [PubMed]
- Budyko, M.I. Evaporation under Natural Conditions. Gidrometeorizdat, Leningrad 1948; English Translation by Isreal Program for Scientific Translations; IPST: Jerusalem, Israel, 1963. [Google Scholar]
- Budyko, M.I. Climate and Life; Academic Press: New York, NY, USA, 1974. [Google Scholar]
- Siriwardena, L.; Finlayson, B.L.; McMahon, T.A. The impact of land use change on catchment hydrology in large catchments: The Comet River, Central Queensland, Australia. J. Hydrol. 2006, 326, 199–214. [Google Scholar] [CrossRef]
- Zhang, L.; Karthikeyan, R.; Bai, Z.; Srinivasan, R. Analysis of streamflow responses to climate variability and land use change in the Loess Plateau region of China. Catena 2017, 154, 1–11. [Google Scholar] [CrossRef]
- Gao, P.; Mu, X.M.; Wang, F.; Li, R. Changes in streamflow and sediment discharge and the response to human activities in the middle reaches of the Yellow River. Hydrol. Earth Syst. Sci. 2011, 15, 1. [Google Scholar] [CrossRef]
- Wu, J.; Miao, C.; Zhang, X.; Yang, T.; Duan, Q. Detecting the quantitative hydrological response to changes in climate and human activities. Sci. Total Environ. 2017, 586, 328–337. [Google Scholar] [CrossRef] [PubMed]
- Schaake, J.C. From Climate to Flow, in Climate Change and U.S. Water Resources; Waggoner, P.E., Ed.; John Wiley: Hoboken, NJ, USA, 1990; Chapter 8; pp. 177–206. [Google Scholar]
- Sankarasubramanian, A.; Vogel, R.M.; Limbrunner, J.F. Climate elasticity of streamflow in the United States. Water Resour. Res. 2001, 37, 1771–1781. [Google Scholar] [CrossRef]
- Dooge, J.C. Sensitivity of runoff to climate change: A Hortonian approach. Bull. Am. Mereorol. Soc. 1992, 73, 2013–2024. [Google Scholar] [CrossRef]
- Arora, V.K. The use of the aridity index to assess climate change effect on annual runoff. J. Hydrol. 2002, 265, 164–177. [Google Scholar] [CrossRef]
- Freund, E.R.; Kirchner, J.W. A Budyko framework for estimating how spatial heterogeneity and lateral moisture redistribution affect average evapotranspiration rates as seen from the atmosphere. Hydrol. Earth Syst. Sci. 2017, 21, 217. [Google Scholar] [CrossRef]
- Wang, D.; Zhao, J.; Tang, Y.; Sivapalan, M. A thermodynamic interpretation of Budyko and L’vovich formulations of annual water balance: Proportionality Hypothesis and maximum entropy production. Water Resour. Res. 2015, 51, 3007–3016. [Google Scholar] [CrossRef]
- Greve, P.; Gudmundsson, L.; Orlowsky, B.; Seneviratne, S.I. Introducing a probabilistic Budyko framework. Geophys. Res. Lett. 2015, 42, 2261–2269. [Google Scholar] [CrossRef]
- Lintner, B.R.; Gentine, P.; Findell, K.L.; Salvucci, G.D. The Budyko and complementary relationships in an idealized model of large-scale land–atmosphere coupling. Hydrol. Earth Syst. Sci. 2015, 19, 2119. [Google Scholar] [CrossRef]
- Xue, L.; Yang, F.; Yang, C.; Chen, X.; Zhang, L.; Chi, Y.; Yang, G. Identification of potential impacts of climate change and anthropogenic activities on streamflow alterations in the Tarim River Basin, China. Sci. Rep. 2017, 7, 8254. [Google Scholar] [CrossRef] [PubMed]
- Schreiber, P. Über die Beziehungen zwischen dem Niederschlag und der Wasserführung der Flüsse in Mitteleuropa. Z. Meteorol. 1904, 21, 441–452. [Google Scholar]
- Ol’Dekop, E.M. On evaporation from the surface of river basins. Trans. Meteorol. Obs. 1911, 4, 200. [Google Scholar]
- Turc, L. The water balance of soils. Relation between precipitation, evaporation and flow. Ann. Agron. 1954, 5, 491–569. [Google Scholar]
- Pike, J.G. The estimation of annual run-off from meteorological data in a tropical climate. J. Hydrol. 1964, 2, 116–123. [Google Scholar] [CrossRef]
- Fu, G.; Charles, S.P.; Chiew, F.H. A two-parameter climate elasticity of streamflow index to assess climate change effects on annual streamflow. Water Resour. Res. 2007, 43, W11419. [Google Scholar] [CrossRef]
- Mezentsev, V.S. More on the calculation of average total evaporation. Meteorol. Gidrol. 1955, 5, 23–31. [Google Scholar]
- Choudhury, B. Evaluation of an empirical equation for annual evaporation using field observations and results from a biophysical model. J. Hydrol. 1999, 216, 99–110. [Google Scholar] [CrossRef]
- Yang, H.; Yang, D.; Lei, Z.; Sun, F. New analytical derivation of the mean annual water-energy balance equation. Water Resour. Res. 2008, 44, W03410. [Google Scholar] [CrossRef]
- Milly, P.C.D. An analytic solution of the stochastic storage problem applicable to soil water. Water Resour. Res. 1993, 29, 3755–3758. [Google Scholar] [CrossRef]
- Porporato, A.; Daly, E.; Rodriguez-Iturbe, I. Soil water balance and ecosystem response to climate change. Am. Nat. 2004, 164, 625–632. [Google Scholar] [CrossRef] [PubMed]
- Zhang, L.; Dawes, W.R.; Walker, G.R. Response of mean annual evapotranspiration to vegetation changes at catchment scale. Water Resour. Res. 2001, 37, 701–708. [Google Scholar] [CrossRef]
- Wang, D.; Tang, Y. A one-parameter Budyko model for water balance captures emergent behavior in darwinian hydrologic models. Geophys. Res. Lett. 2014, 41, 4569–4577. [Google Scholar] [CrossRef] [Green Version]
- Water Resources Agency 2017 Hydrological Year Book of Taiwan. Ministry of Economic Affairs; Water Resources Agency 2017 Hydrological Year Book of Taiwan: Taipei, Taiwan, 2017. (In Chinese)
- Wang, C.H. The impacts of climate change on the groundwater environment of Taiwan: Retrospective and prospective views. Cent. Geol. Surv. 2007, 18, 239–255. (In Chinese) [Google Scholar]
- Thiessen, A.H. Precipitation averages for large areas. Mon. Weather Rev. 1911, 39, 1082–1089. [Google Scholar] [CrossRef]
- Martens, B.; Miralles, D.G.; Lievens, H.; van der Schalie, R.; de Jeu, R.A.M.; Fernández-Prieto, D.; Beck, H.E.; Dorigo, W.A.; Verhoest, N.E.C. GLEAM v3: Satellite-based land evaporation and root-zone soil moisture. Geosci. Model Dev. 2017, 10, 1903–1925. [Google Scholar] [CrossRef]
- Miralles, D.G.; Holmes, T.R.H.; de Jeu, R.A.M.; Gash, J.H.; Meesters, A.G.C.A.; Dolman, A.J. Global land-surface evaporation estimated from satellite-based observations. Hydrol. Earth Syst. Sci. 2011, 15, 453–469. [Google Scholar] [CrossRef] [Green Version]
- Priestley, C.H.B.; Taylor, R.J. On the assessment of surface heat flux and evaporation using large-scale parameters. Mon. Weather Rev. 1972, 100, 81–92. [Google Scholar] [CrossRef]
- Mann, H.B. Nonparametric tests against trend. Econom. J. Econom. Soc. 1945, 13, 245–259. [Google Scholar] [CrossRef]
- Kendall, M.G. Rank Correlation Measures [M]; Charles Griffin: London, UK, 1975. [Google Scholar]
- Hamed, K.H.; Rao, A.R. A modified Mann-Kendall trend test for autocorrelated data. J. Hydrol. 1998, 204, 182–196. [Google Scholar] [CrossRef]
- Amirataee, B.; Montaseri, M. The performance of SPI and PNPI in analyzing the spatial and temporal trend of dry and wet periods over Iran. Nat. Hazards 2017, 86, 89–106. [Google Scholar] [CrossRef]
- Pettitt, A.N. A non-parametric approach to the change-point problem. Appl. Stat. 1979, 28, 126–135. [Google Scholar] [CrossRef]
- Yang, H.; Qi, J.; Xu, X.; Yang, D.; Lv, H. The regional variation in climate elasticity and climate contribution to runoff across China. J. Hydrol. 2014, 517, 607–616. [Google Scholar] [CrossRef]
- Wu, J.; Miao, C.; Wang, Y.; Duan, Q.; Zhang, X. Contribution analysis of the long-term changes in seasonal runoff on the Loess Plateau, China, using eight Budyko-based methods. J. Hydrol. 2017, 545, 263–275. [Google Scholar] [CrossRef]
- Choate, M.; Steinwand, D.; Rengarajan, R. Multispectral Scanner (MSS) Geometric Algorithm Description Document; USGS Landsat Project Documentation, LS-IAS: Delhi, India, 2012; Volume 6.
- Engebretson, C. Landsat Thematic Mapper (TM) Level 1 DFCB. USGS Landsat Project Documentation. 2018. Available online: https://prd-wret.s3-us-west-2.amazonaws.com/assets/palladium/production/atoms/files/LSDS-284_Landsat4-5TM-Level1DFCB-v10.pdf (accessed on 26 September 2019).
- Jaramillo, F.; Cory, N.; Arheimer, B.; Laudon, H.; Van Der Velde, Y.; Hasper, T.B.; Uddling, J. Dominant effect of increasing forest biomass on evapotranspiration: Interpretations of movement in Budyko space. Hydrol. Earth Syst. Sci. 2018, 22, 567–580. [Google Scholar] [CrossRef]
- Guzha, A.C.; Rufino, M.C.; Okoth, S.; Jacobs, S.; Nóbrega, R.L.B. Impacts of land use and land cover change on surface runoff, discharge and low flows: Evidence from East Africa. J. Hydrol. Regional Stud. 2018, 15, 49–67. [Google Scholar] [CrossRef]
Figure 1.
Location of study river basins and gauging stations.

Figure 2.
The trend of annual precipitation in northern Taiwan during 1980~2017. (a) Lanyang River Basin. (b) Keelung River Basin. (c) Dahan River Basin. (d) Fengshan River Basin. (e) Youluo River Basin. (f) Shangping River Basin.
Figure 2.
The trend of annual precipitation in northern Taiwan during 1980~2017. (a) Lanyang River Basin. (b) Keelung River Basin. (c) Dahan River Basin. (d) Fengshan River Basin. (e) Youluo River Basin. (f) Shangping River Basin.

Figure 3.
The trend of annual potential evapotranspiration in northern Taiwan during 1980~2017. (a) Lanyang River Basin. (b) Keelung River Basin. (c) Dahan River Basin. (d) Fengshan River Basin. (e) Youluo River Basin. (f) Shangping River Basin.
Figure 3.
The trend of annual potential evapotranspiration in northern Taiwan during 1980~2017. (a) Lanyang River Basin. (b) Keelung River Basin. (c) Dahan River Basin. (d) Fengshan River Basin. (e) Youluo River Basin. (f) Shangping River Basin.

Figure 4.
The trend of annual streamflow in northern Taiwan during 1980~2017. (a) Lanyang River Basin. (b) Keelung River Basin. (c) Dahan River Basin. (d) Fengshan River Basin. (e) Youluo River Basin. (f) Shangping River Basin.
Figure 4.
The trend of annual streamflow in northern Taiwan during 1980~2017. (a) Lanyang River Basin. (b) Keelung River Basin. (c) Dahan River Basin. (d) Fengshan River Basin. (e) Youluo River Basin. (f) Shangping River Basin.

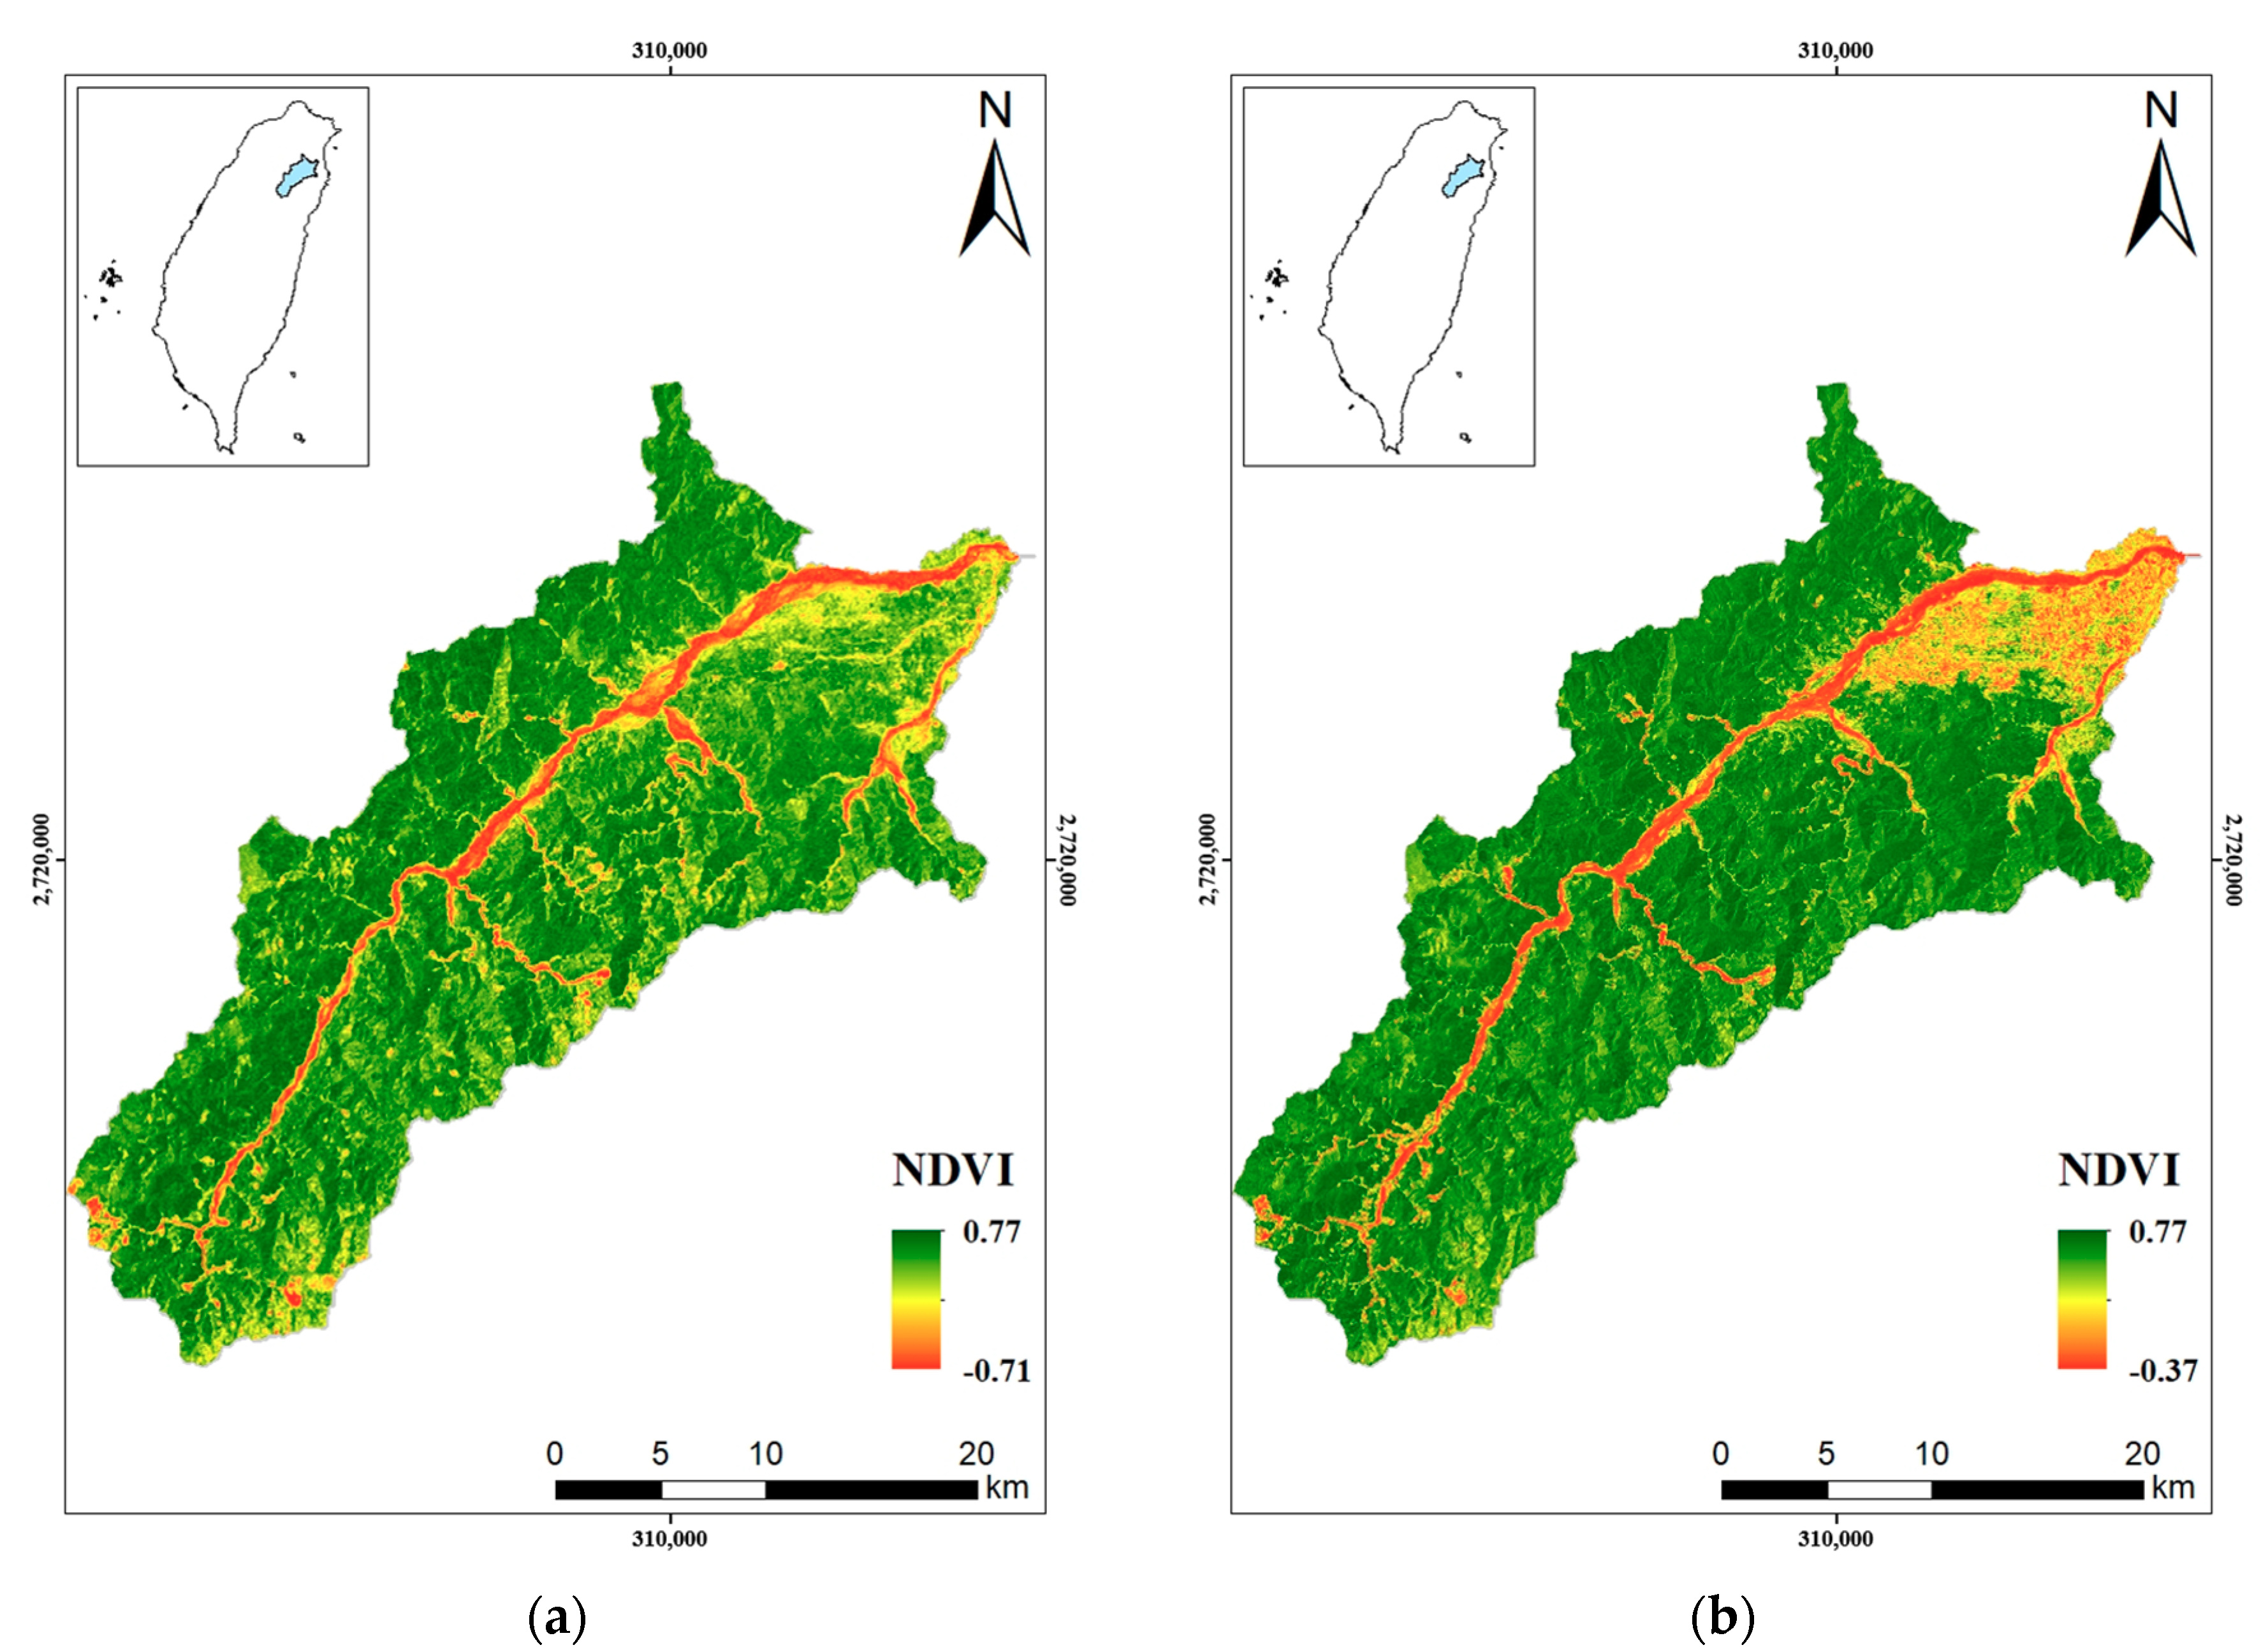
Figure 5.
Spatial distribution of NDVI in Lanyang River Basin. (a) NDVI of Lanyang River Basin in 1978. (b) NDVI of Lanyang River Basin in 1993. (c) NDVI of Lanyang River Basin in 2004. (d) NDVI of Lanyang River Basin in 2018.
Figure 5.
Spatial distribution of NDVI in Lanyang River Basin. (a) NDVI of Lanyang River Basin in 1978. (b) NDVI of Lanyang River Basin in 1993. (c) NDVI of Lanyang River Basin in 2004. (d) NDVI of Lanyang River Basin in 2018.


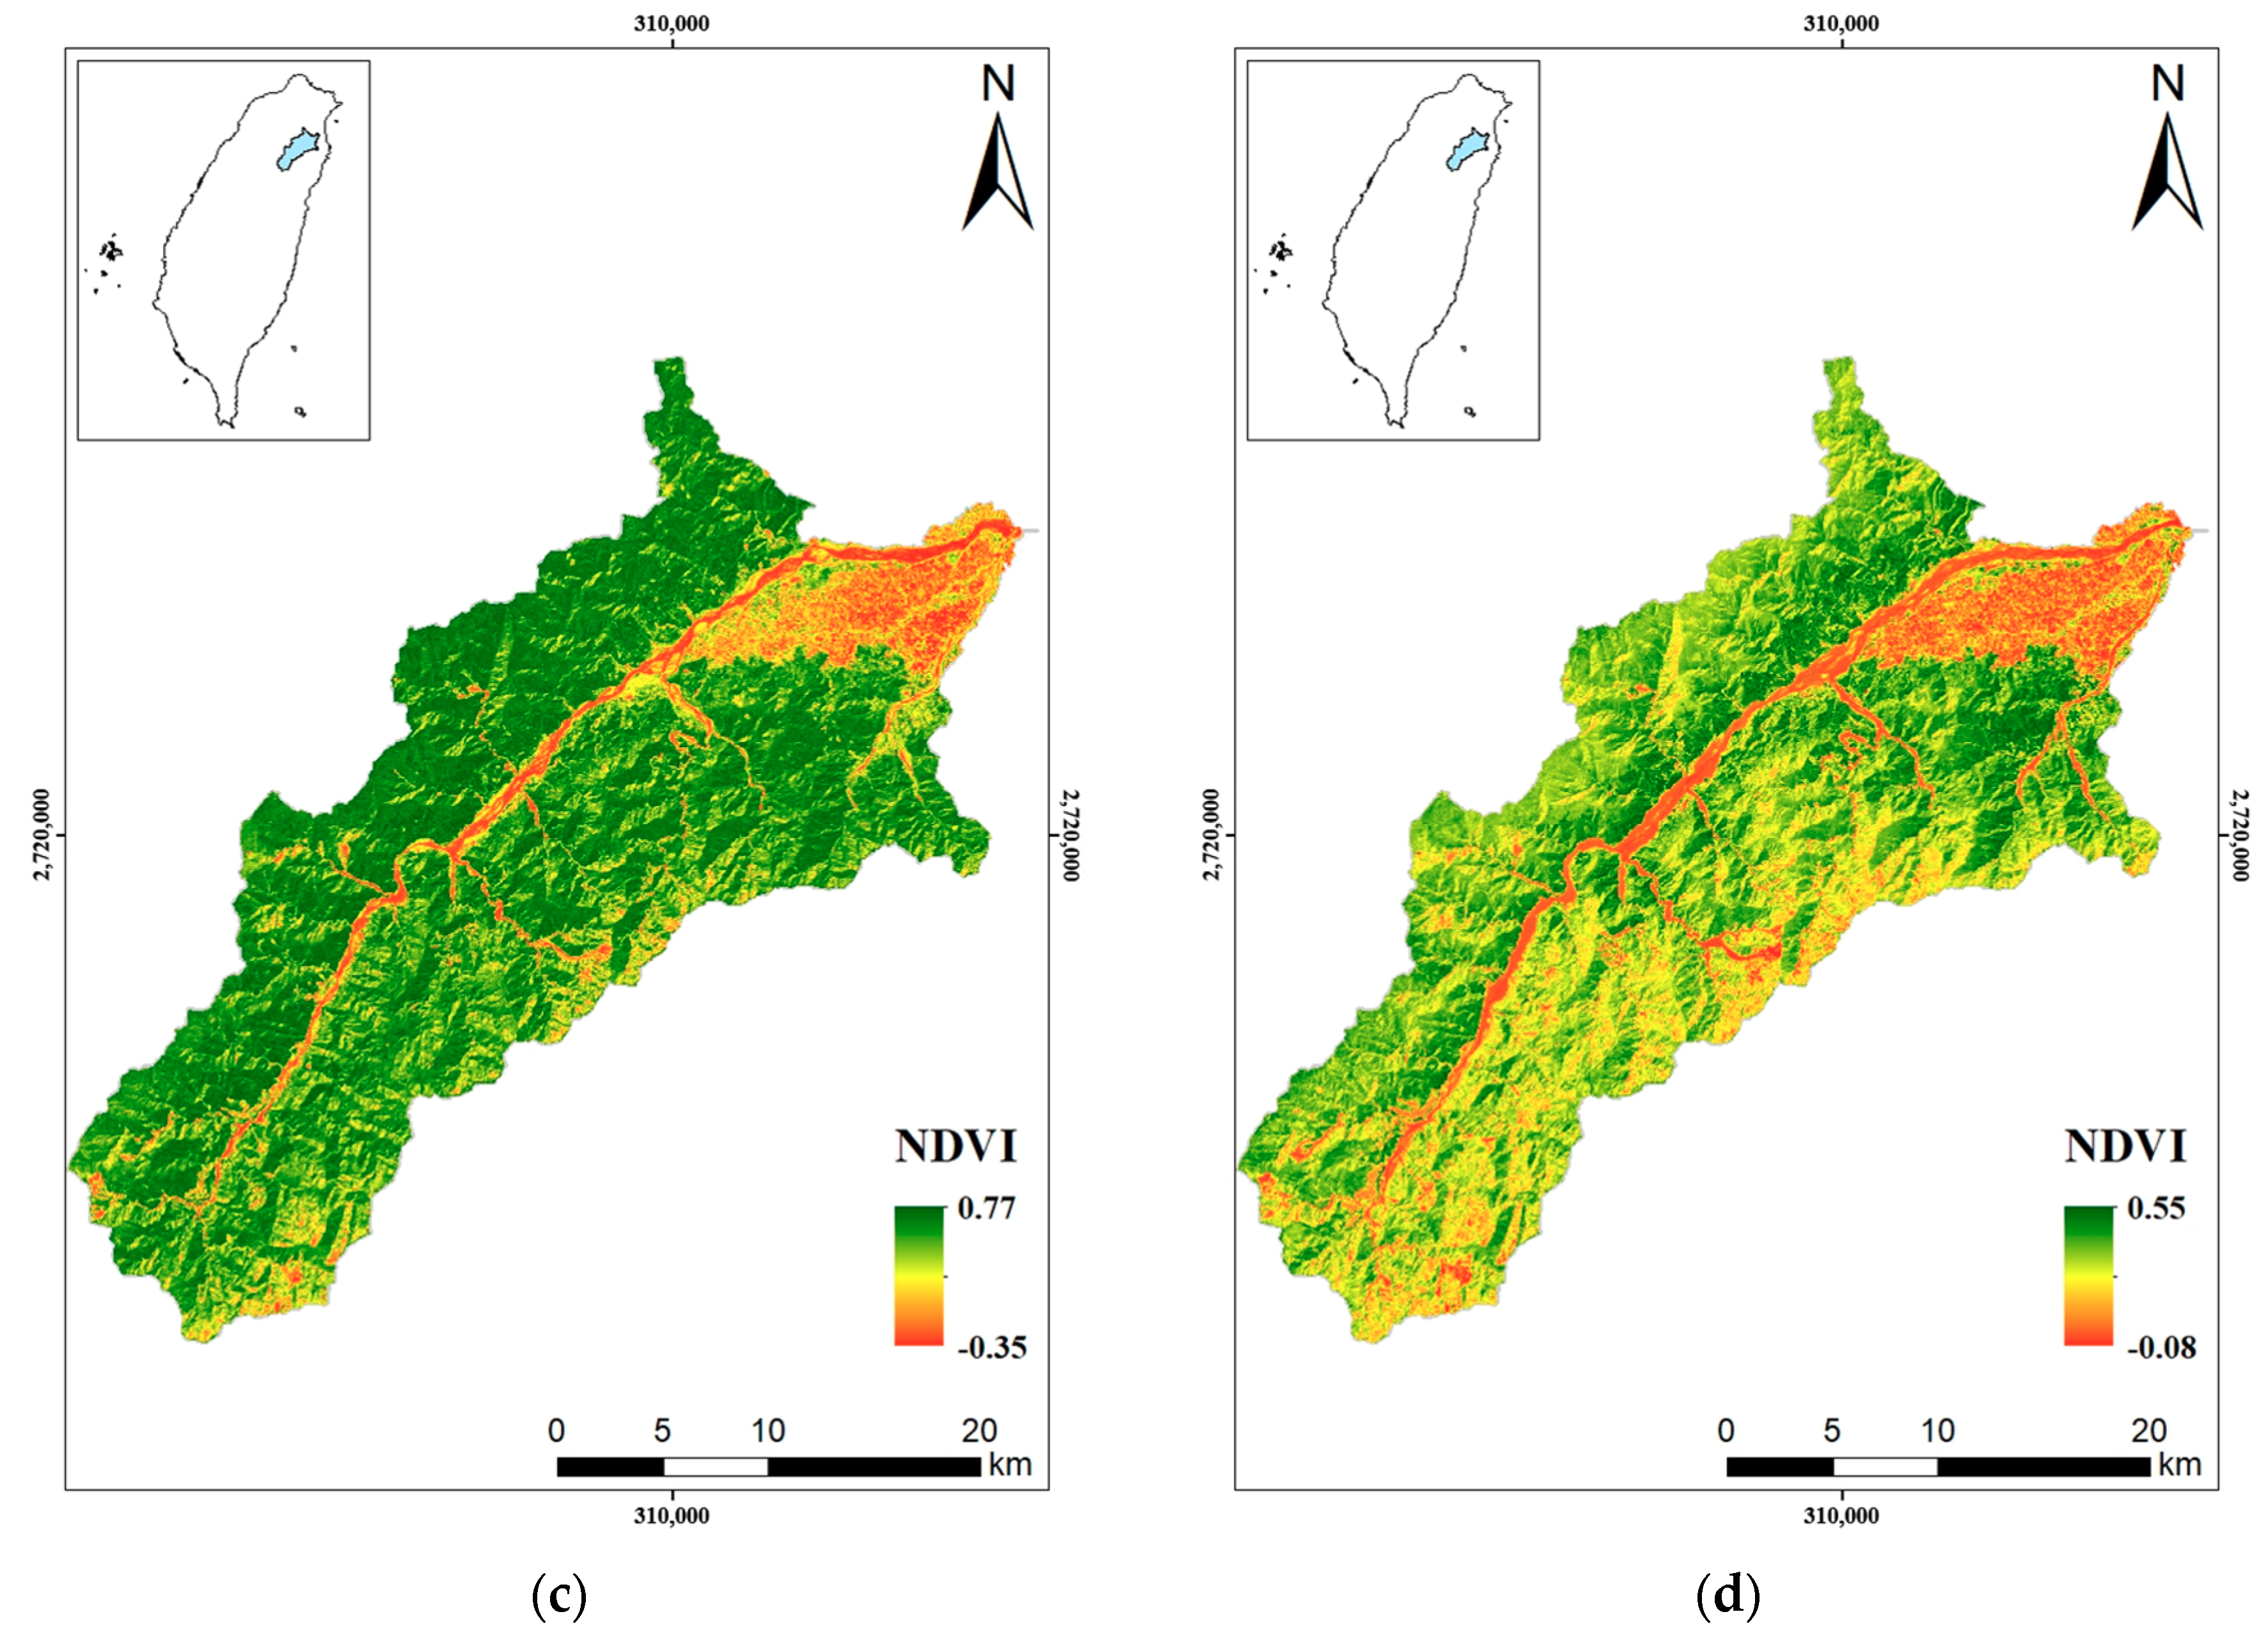
Figure 6.
NDVI difference between different periods in Lanyang River Basin. (a) NDVI difference in Lanyang River Basin during 1978 to 1993. (b) NDVI difference in Lanyang River Basin during 1993 to 2004. (c) NDVI difference in Lanyang River Basin during 2004 to 2018.
Figure 6.
NDVI difference between different periods in Lanyang River Basin. (a) NDVI difference in Lanyang River Basin during 1978 to 1993. (b) NDVI difference in Lanyang River Basin during 1993 to 2004. (c) NDVI difference in Lanyang River Basin during 2004 to 2018.


Table 1.
Different models of Budyko curve equations.
| Model | Budyko Curve Equation | Parameter | Reference |
|---|---|---|---|
| Budyko–Schreiber | None | Schreiber [36] | |
| Budyko–Ol’dekop | None | Ol’dekop [37] | |
| Budyko | None | Budyko [21,22] | |
| Budyko–Turc–Pike | None | Turc [38]; Pike [39] | |
| Budyko–Fu | m | Fu [40] | |
| Budyko–Mezentsev–Choudhury–Yang | n | Mezentsev [41]; Choudhury [42]; Yang et al. [43] | |
| Budyko–Mill–Porporato | Milly [44]; Porporato et al. [45] | ||
| Budyko–Zhang | Zhang et al. [46] | ||
| Budyko–Wang | Wang and Tang [47] |
Table 2.
Information for the rainfall station and streamflow gauging station in northern Taiwan [48].
Table 2.
Information for the rainfall station and streamflow gauging station in northern Taiwan [48].
| River Basin | Drainage Area (km2) | Average Elevation (m) | No. | Type | Station | TM2_X (TWD67) | TM2_Y (TWD67) |
|---|---|---|---|---|---|---|---|
| Lanyang River Basin | 820.69 | 955.2 | 1 | Streamflow gauging station | Lan Yang Bridge | 327,262.2 | 2,734,754 |
| 2 | Rainfall station | Nan Shan | 287,634 | 2,703,687 | |||
| 3 | Liu Mao An | 294,890 | 2,714,194 | ||||
| 4 | Tu Chang-1 | 299,456 | 2,718,763.39 | ||||
| 5 | Fan Fan-2 | 302,389 | 2,723,226 | ||||
| 6 | Xin Bei Cheng | 324,950 | 2,730,841 | ||||
| Dahan River Basin | 622.80 | 1614.81 | 7 | Streamflow gauging station | Xia Yun | 285,813.3 | 2,740,336.8 |
| 8 | Rainfall station | Xiu Luan | 278,034.4 | 2,723,777.7 | |||
| 9 | An Bu | 277,705.5 | 2,729,116.5 | ||||
| 10 | San Guang | 286,273.5 | 2,729,607.8 | ||||
| Keelung River Basin | 204.41 | 251.78 | 11 | Streamflow gauging station | Wu Tu | 319,419.4 | 2,774,923.7 |
| 12 | Rainfall station | Huo Shao Liao | 324,813.7 | 2,764,092.9 | |||
| 13 | Rui Fang-2 | 330,186.2 | 2,778,442.8 | ||||
| 14 | Wu Du | 319,447.5 | 2,774,911.4 | ||||
| Fengshan River Basin | 208.06 | 258.84 | 15 | Streamflow gauging station | Hsin Pu-2 | 255,810.3 | 2,746,676 |
| 16 | Rainfall station | Guanxi 3 | 267,417.1 | 2,741,651.3 | |||
| 17 | Xinpu 1 | 256,388.7 | 2,747,090.2 | ||||
| Youluo River Basin | 139.07 | 977.80 | 18 | Streamflow gauging station | Nei Wan | 267,503.3 | 2,733,084 |
| 19 | Rainfall station | Niaozuishan | 277,875.8 | 2,734,904.7 | |||
| 20 | Meihua | 270,281.7 | 2,730,286.1 | ||||
| Shangping River Basin | 221.73 | 1251.48 | 21 | Streamflow gauging station | Shang Ping | 260,738.5 | 2,729,330 |
| 22 | Rainfall station | Taigenan | 264,159.4 | 2,724,487.3 | |||
| 23 | Qingguan | 259,655.8 | 2,718,705.8 |
Table 3.
Trend analysis and break point analysis.
| River Basin | Period | Variable | Z | Significant Trend (α = 10%) | PMAX | Point of Highest Probability |
|---|---|---|---|---|---|---|
| Lanyang River Basin | 1980–2017 | P | −0.05 | None | 0.41 | 2001 |
| 1980–2017 | E0 | 0.55 | None | 0.54 | 1990 | |
| 1980–2017 | Q | 2.01 | Exist | 0.97 | 1993 | |
| Keelung River Basin | 1980–2017 | P | −0.86 | None | 0.66 | 1990 |
| 1980–2017 | E0 | 1.51 | None | 0.89 | 1990 | |
| 1980–2017 | Q | −1.31 | None | 0.94 | 1990 | |
| Dahan River Basin | 1980–2017 | P | 0.11 | None | 0.36 | 2008 |
| 1980–2017 | E0 | 1.11 | None | 0.73 | 1990 | |
| 1980–2017 | Q | −0.40 | None | 0.75 | 2008 | |
| Fengshan River Basin | 1981–2017 | P | −0.14 | None | 0.49 | 1986 |
| 1980–2017 | E0 | 1.58 | None | 0.86 | 2001 | |
| 1980–2017 | Q | −0.54 | None | 0.73 | 1990 | |
| Youluo River Basin | 1980–2017 | P | 0.38 | None | 0.42 | 2003 |
| 1980–2017 | E0 | 1.38 | None | 0.82 | 2001 | |
| 1980–2017 | Q | 0.58 | None | 0.78 | 2003 | |
| Shangping River Basin | 1980–2017 | P | 0.23 | None | 0.41 | 2003 |
| 1980–2017 | E0 | 1.38 | None | 0.83 | 2001 | |
| 1980–2017 | Q | 0.48 | None | 0.76 | 2003 |
Table 4.
Calculation of the streamflow variation under impacts of climate change and non-climate factors. B–F: Budyko–Fu, B–M–C–Y: Budyko–Mezentsev–Choudhury–Yang.
Table 4.
Calculation of the streamflow variation under impacts of climate change and non-climate factors. B–F: Budyko–Fu, B–M–C–Y: Budyko–Mezentsev–Choudhury–Yang.
| River Basin | Period | P (mm) | Q (mm) | E0 (mm) | m | n | ΔQ | B–F | B–M–C–Y | |||
|---|---|---|---|---|---|---|---|---|---|---|---|---|
| mm | % | ηc1imate | ηnon-climate | ηclimate | ηnon-climate | |||||||
| Lanyang | 1980–1993 | 2810.38 | 1926.62 | 1049.09 | 2.07 | 1.33 | ||||||
| 1994–2017 | 2752.51 | 2552.86 | 1050.16 | 1.10 | 0.32 | 626.24 | 32.50% | −9.01% | 109.01% | −8.99% | 108.99% | |
| Keelung | 1980–1990 | 4712.45 | 4376.79 | 1119.50 | 1.14 | 0.37 | ||||||
| 1991–2017 | 4130.50 | 3584.32 | 1146.11 | 1.28 | 0.53 | −792.47 | −18.11% | 71.75% | 28.25% | 71.30% | 28.70% | |
| Dahan | 1980–2017 | 2184.87 | 1850.40 | 1057.56 | 1.21 | 0.46 | - | - | - | - | - | - |
| Fengshan | 1981–2017 | 2043.57 | 1559.83 | 1086.29 | 1.37 | 0.64 | - | - | - | - | - | - |
| Youluo | 1980–2017 | 2851.03 | 2298.69 | 1063.48 | 1.37 | 0.64 | - | - | - | - | - | - |
| Shangping | 1980–2017 | 2449.42 | 2089.31 | 1082.52 | 1.23 | 0.48 | - | - | - | - | - | - |
Table 5.
Normalized Difference Vegetation Index (NDVI) difference of the Lanyang River Basin.
| NDVI Difference | 1978–1993 | 1993–2004 | 2004–2018 |
|---|---|---|---|
| −1.00~0.30 | 3.11% | 3.51% | 29.49% |
| −0.30~−0.20 | 2.31% | 5.28% | 44.46% |
| −0.20~−0.10 | 3.59% | 14.79% | 12.09% |
| −0.10~0 | 12.14% | 47.74% | 5.73% |
| 0~0.05 | 21.13% | 18.06% | 2.30% |
| 0.05~0.10 | 28.91% | 4.70% | 2.58% |
| 0.10~0.15 | 16.27% | 1.88% | 2.04% |
| 0.15~0.20 | 6.38% | 1.12% | 0.72% |
| 0.20~0.25 | 2.71% | 0.86% | 0.30% |
| 0.25~0.30 | 1.43% | 0.70% | 0.16% |
| 0.30~1.00 | 2.02% | 1.36% | 0.16% |
Table 6.
Results of the sensitivity analysis of streamflow variation for precipitation, potential evapotranspiration, and watershed characteristics parameters.
Table 6.
Results of the sensitivity analysis of streamflow variation for precipitation, potential evapotranspiration, and watershed characteristics parameters.
| River Basin | Period | B–F | B–M–C–Y | ||||
|---|---|---|---|---|---|---|---|
| Lanyang | 1980–1993 | 1.37 | −0.37 | −0.27 | 1.36 | −0.36 | −0.18 |
| 1994–2017 | 1.05 | −0.05 | −0.73 | 1.05 | −0.04 | −0.16 | |
| Keelung | 1980–1990 | 1.05 | −0.05 | −0.49 | 1.05 | −0.05 | −0.13 |
| 1991–2017 | 1.11 | −0.1 | −0.46 | 1.1 | −0.1 | −0.18 | |
| Dahan | 1980–2017 | 1.11 | −0.11 | −0.79 | 1.11 | −0.1 | −0.26 |
| Fengshan | 1981–2017 | 1.19 | −0.2 | −0.75 | 1.18 | −0.19 | −0.33 |
| Youluo | 1980–2017 | 1.17 | −0.16 | −0.54 | 1.16 | −0.16 | −0.24 |
| Shangping | 1980–2017 | 1.11 | −0.11 | −0.72 | 1.1 | −0.11 | −0.25 |
© 2019 by the authors. Licensee MDPI, Basel, Switzerland. This article is an open access article distributed under the terms and conditions of the Creative Commons Attribution (CC BY) license (http://creativecommons.org/licenses/by/4.0/).
Share and Cite
MDPI and ACS Style
Lee, C.-H.; Yeh, H.-F. Impact of Climate Change and Human Activities on Streamflow Variations Based on the Budyko Framework. Water 2019, 11, 2001. https://doi.org/10.3390/w11102001
AMA Style
Lee C-H, Yeh H-F. Impact of Climate Change and Human Activities on Streamflow Variations Based on the Budyko Framework. Water. 2019; 11(10):2001. https://doi.org/10.3390/w11102001
Chicago/Turabian StyleLee, Chung-Hsun, and Hsin-Fu Yeh. 2019. "Impact of Climate Change and Human Activities on Streamflow Variations Based on the Budyko Framework" Water 11, no. 10: 2001. https://doi.org/10.3390/w11102001
Note that from the first issue of 2016, this journal uses article numbers instead of page numbers. See further details here.