CDOM Absorption Properties of Natural Water Bodies along Extreme Environmental Gradients

 , ,
, ,
Abstract
:1. Introduction
2. Data and Methods
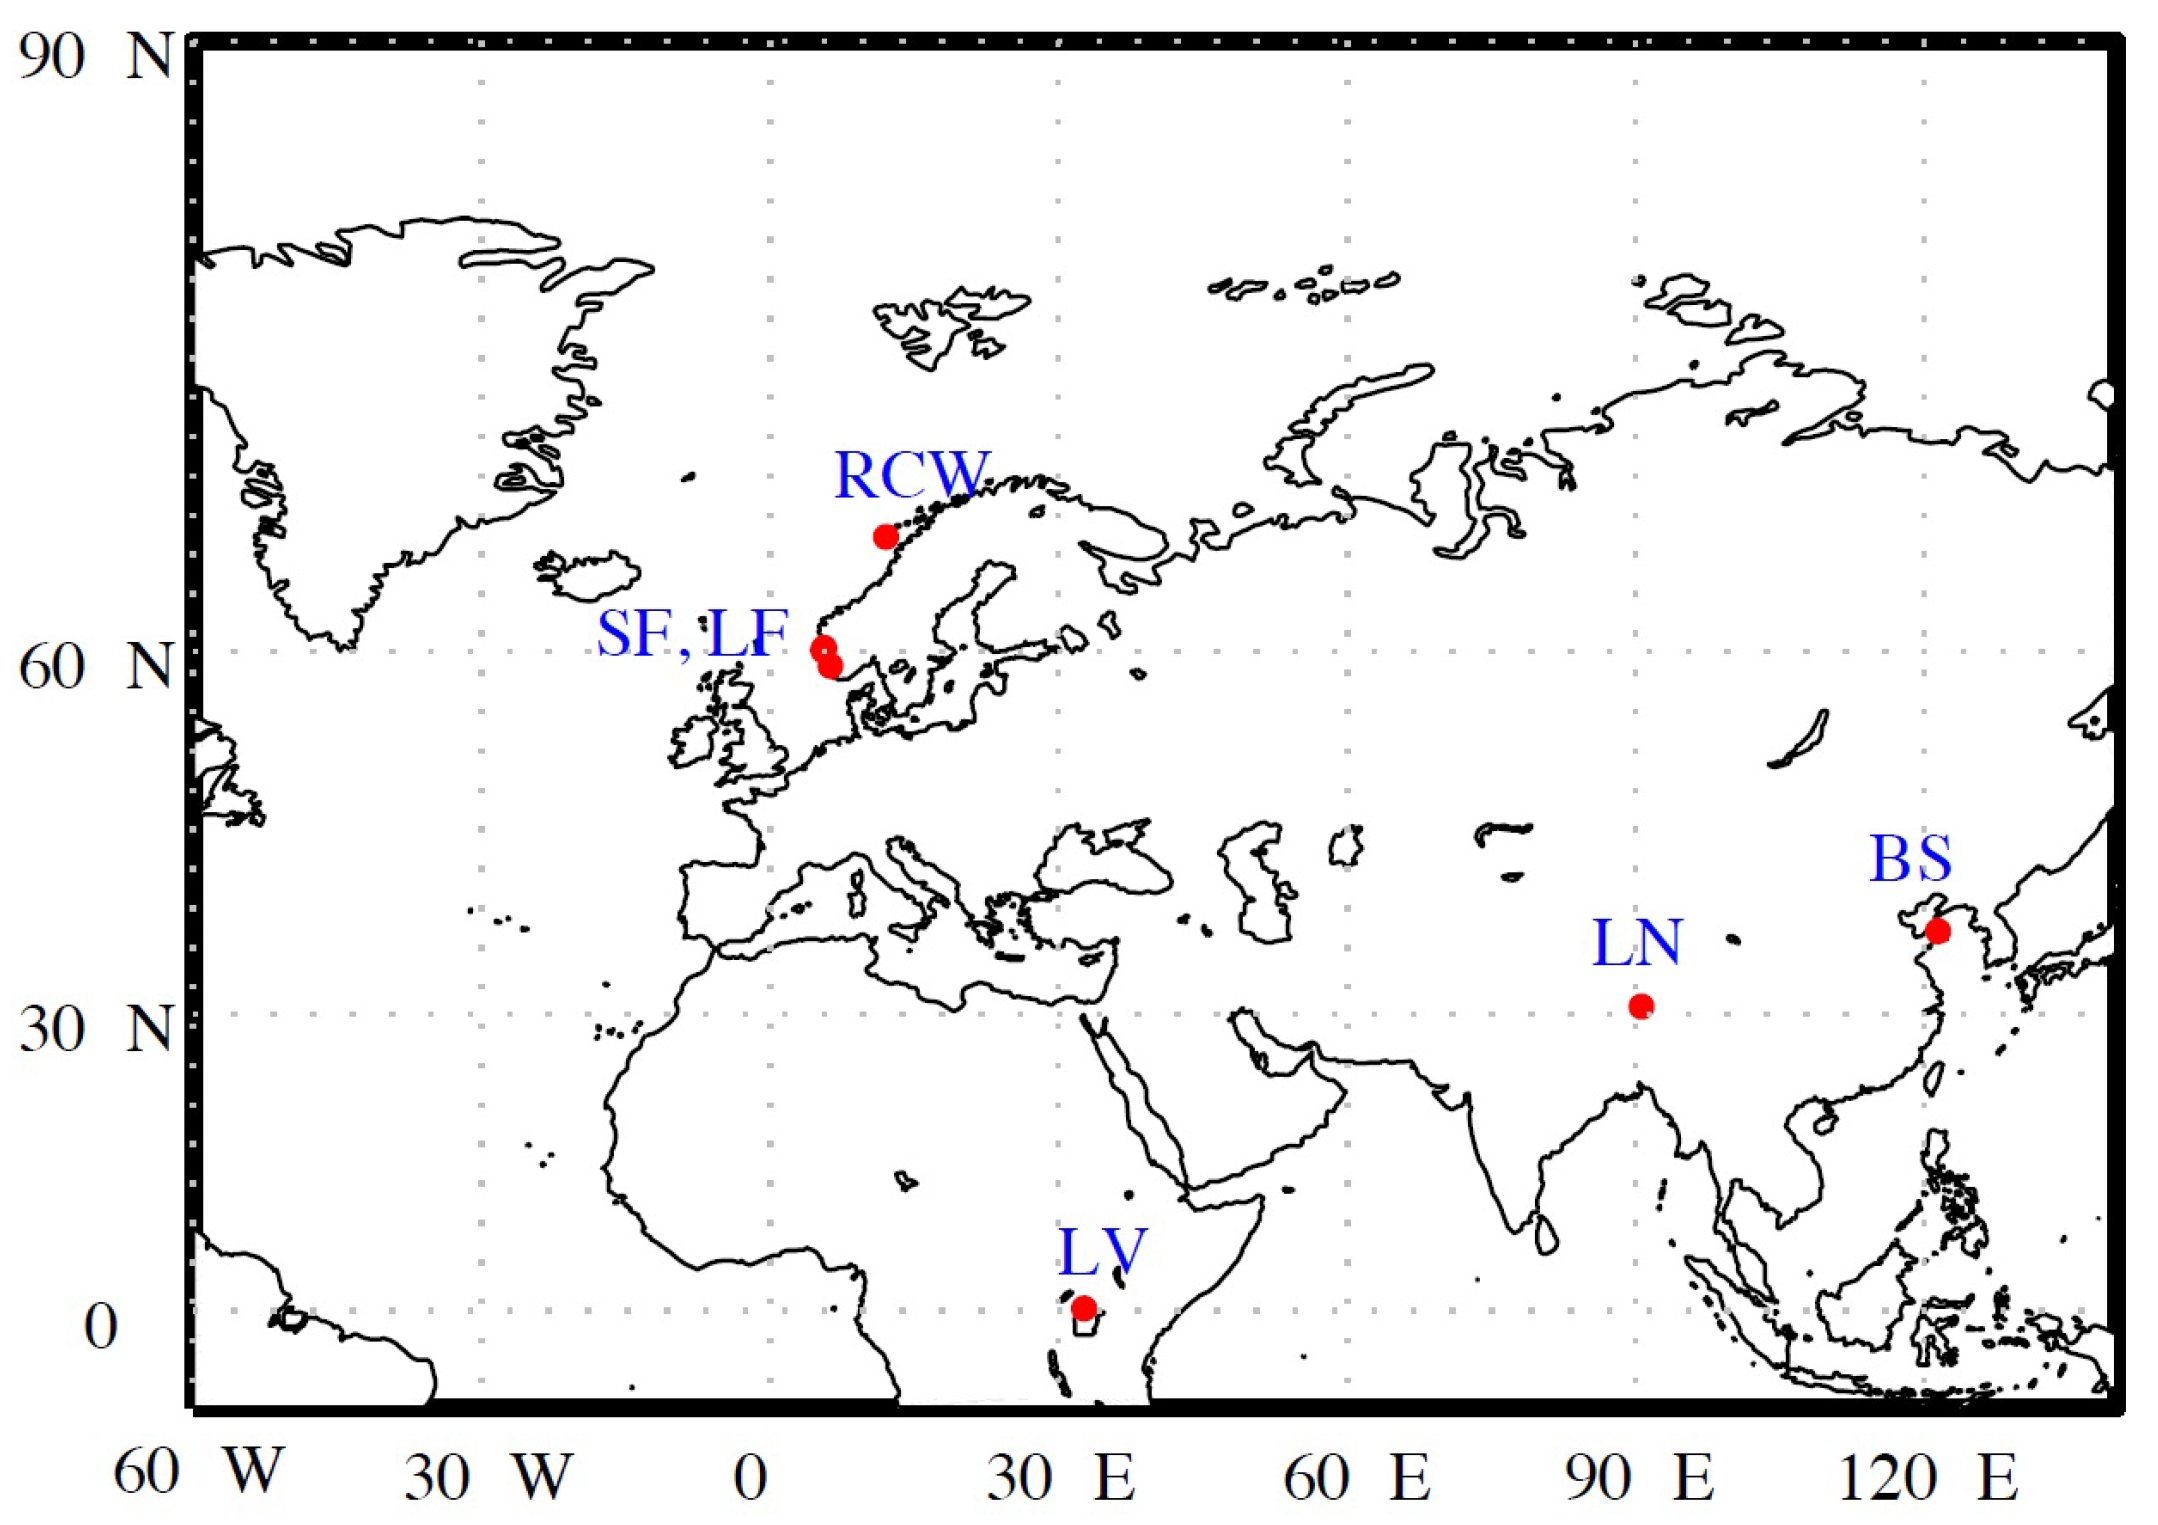
2.1. Study Sites
2.2. Determination of CDOM Absorption Coefficient and Spectral Slope
2.3. Determination of Chl-a Concentration
2.4. Determination of the Vertical Diffuse Attenuation Coefficient for the Downward Irradiance K
3. Results and Discussion
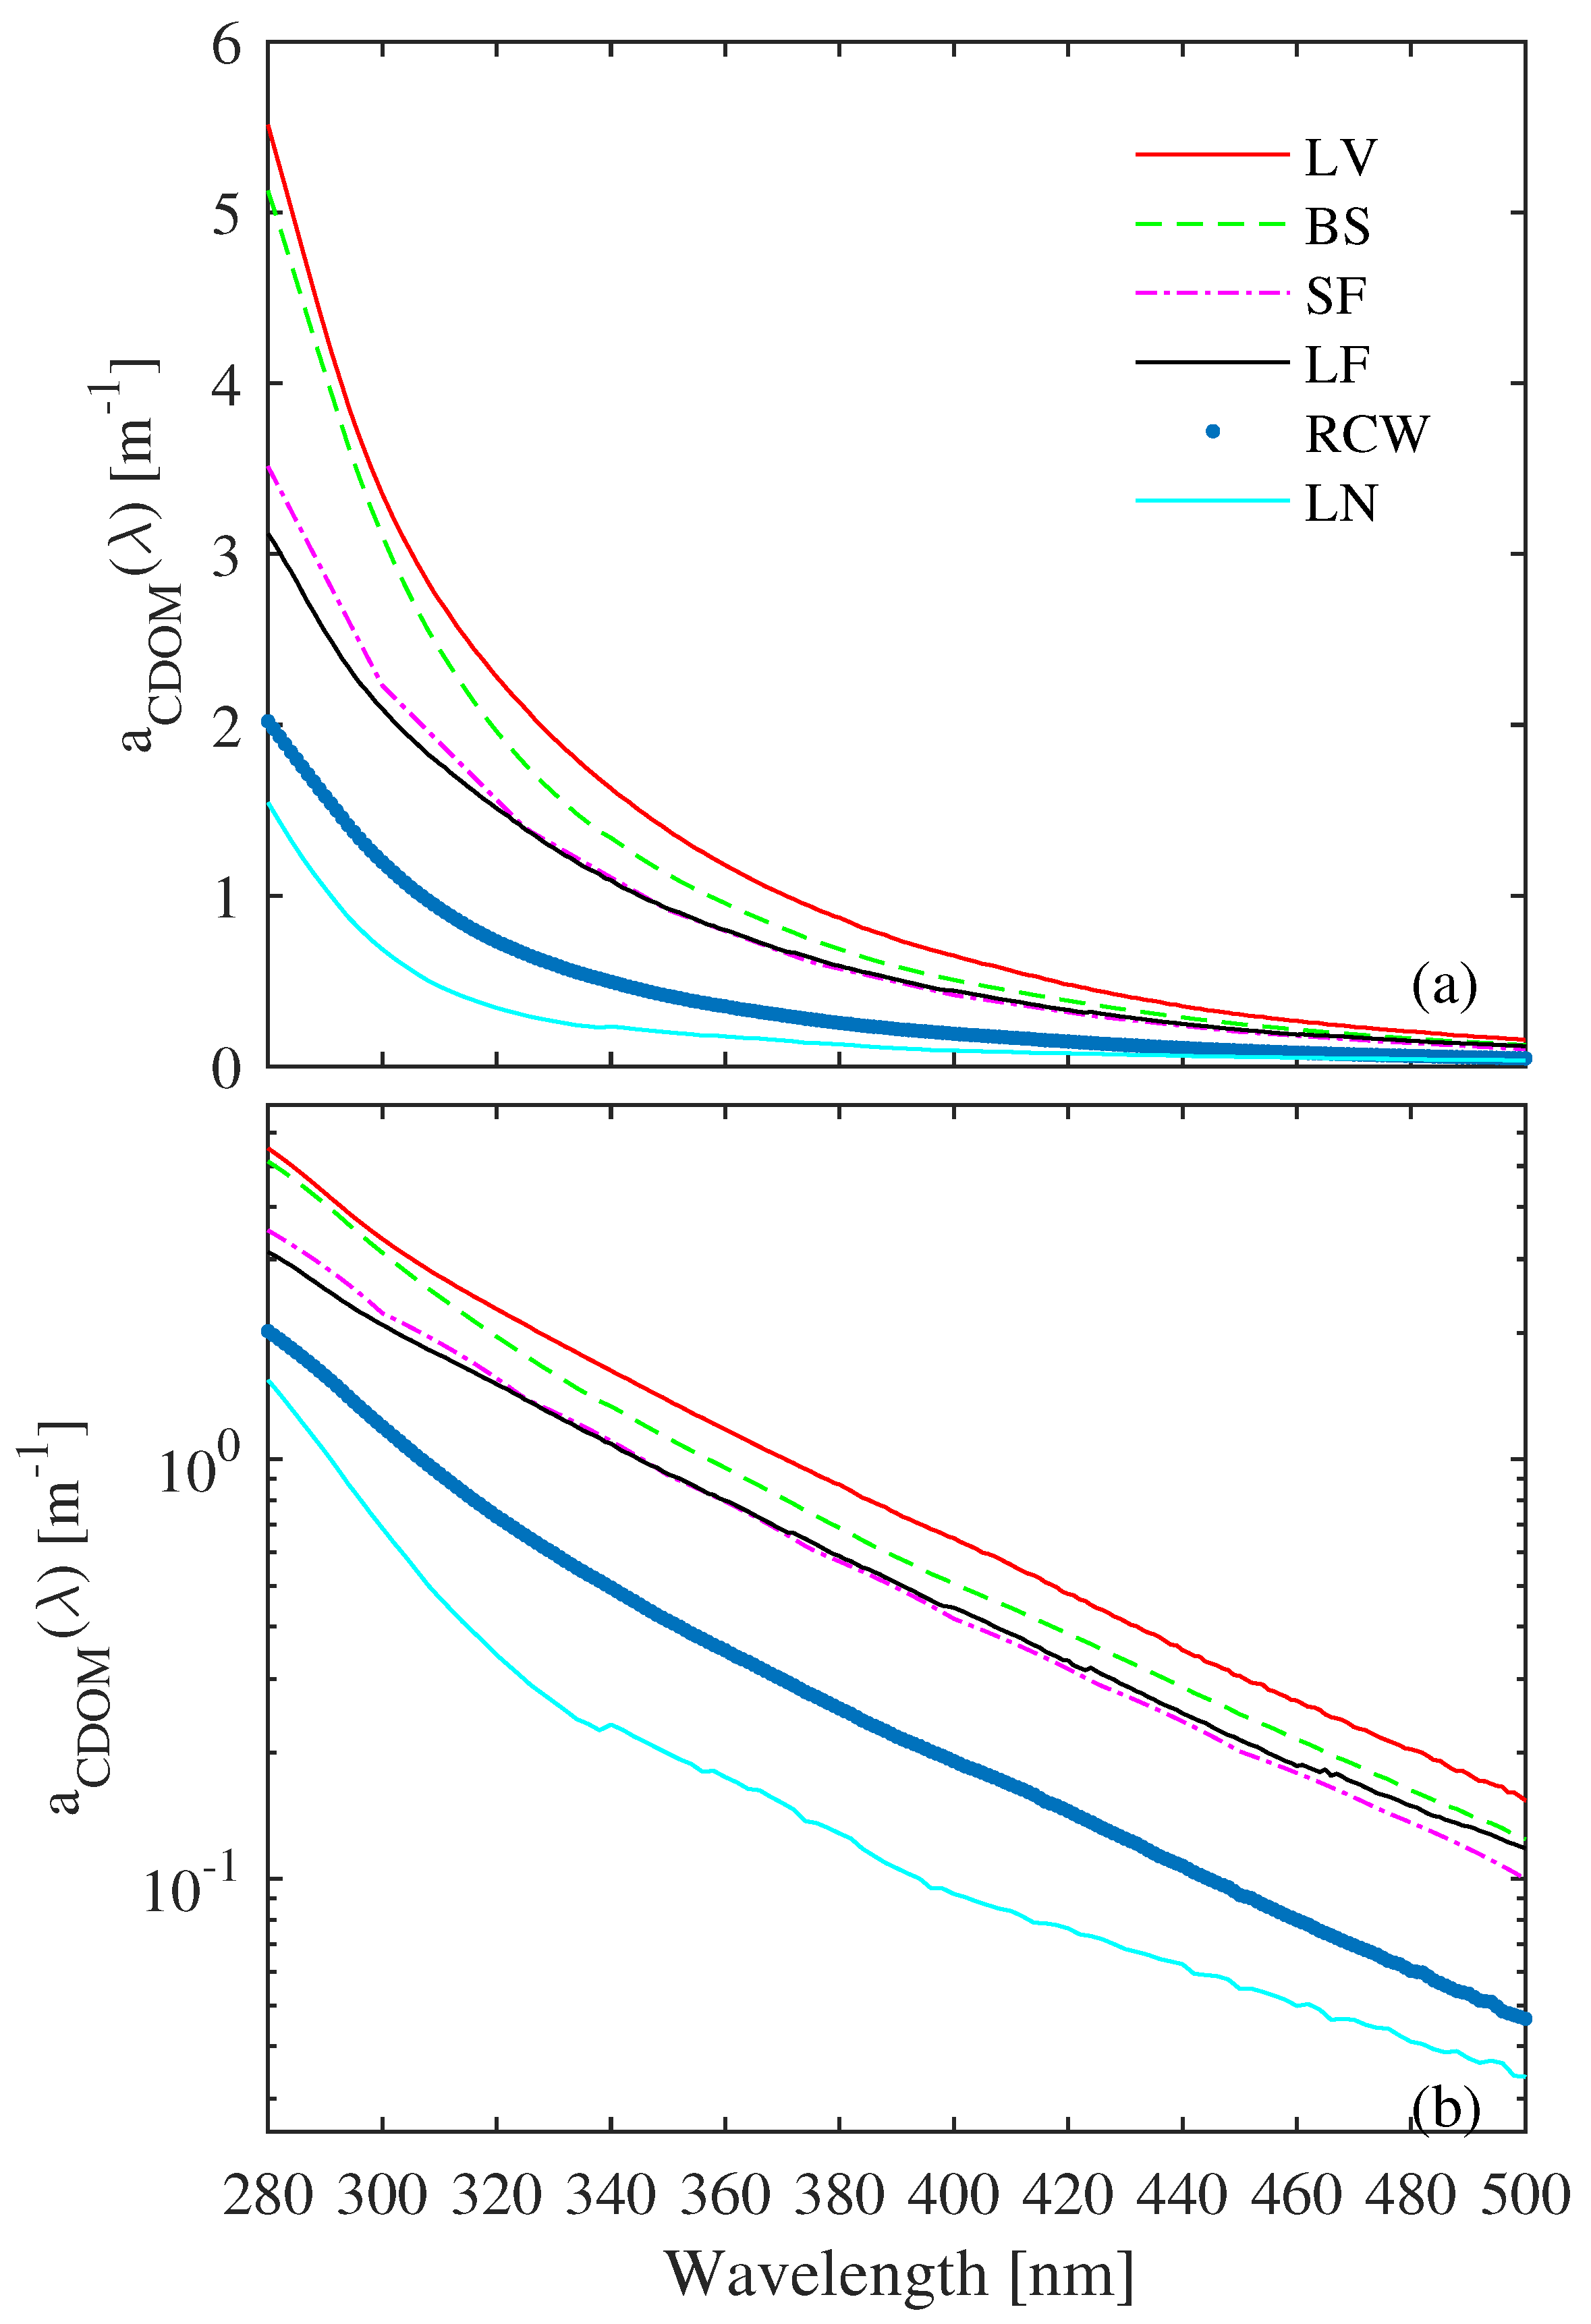
3.1. CDOM Absorption Characteristics of Different Water Types
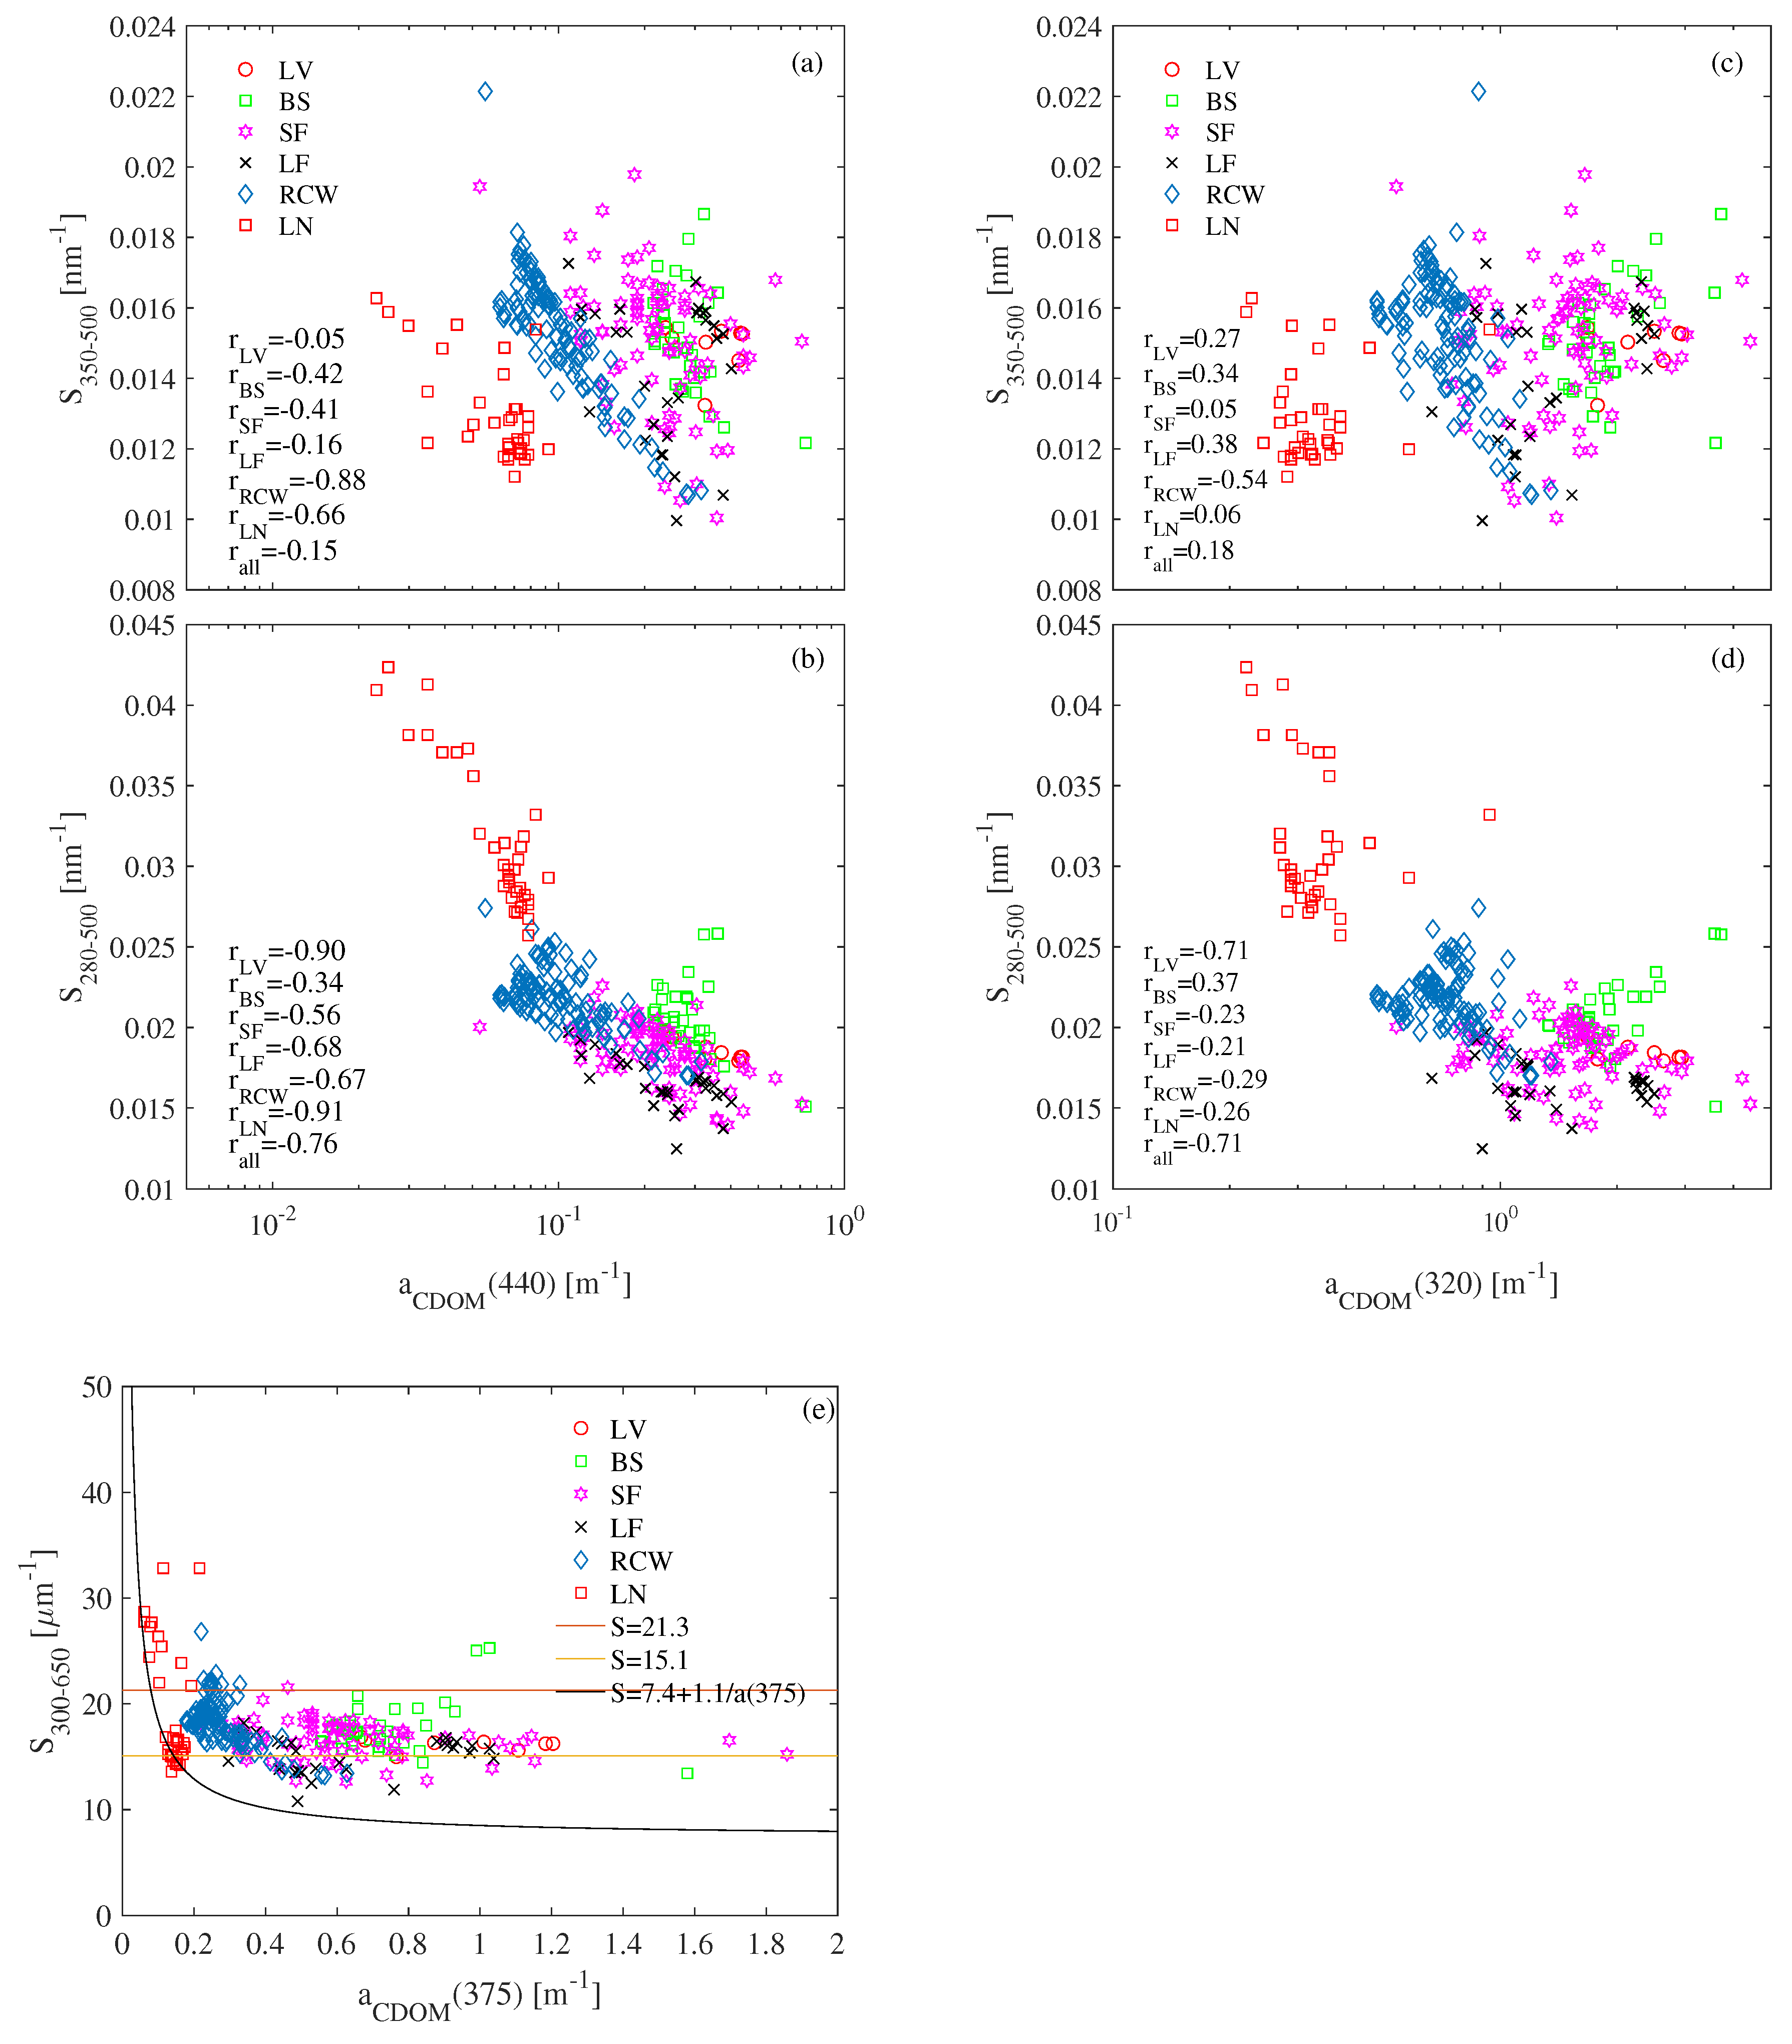
3.2. Using Absorption Spectral Slope to Uncover CDOM Origins
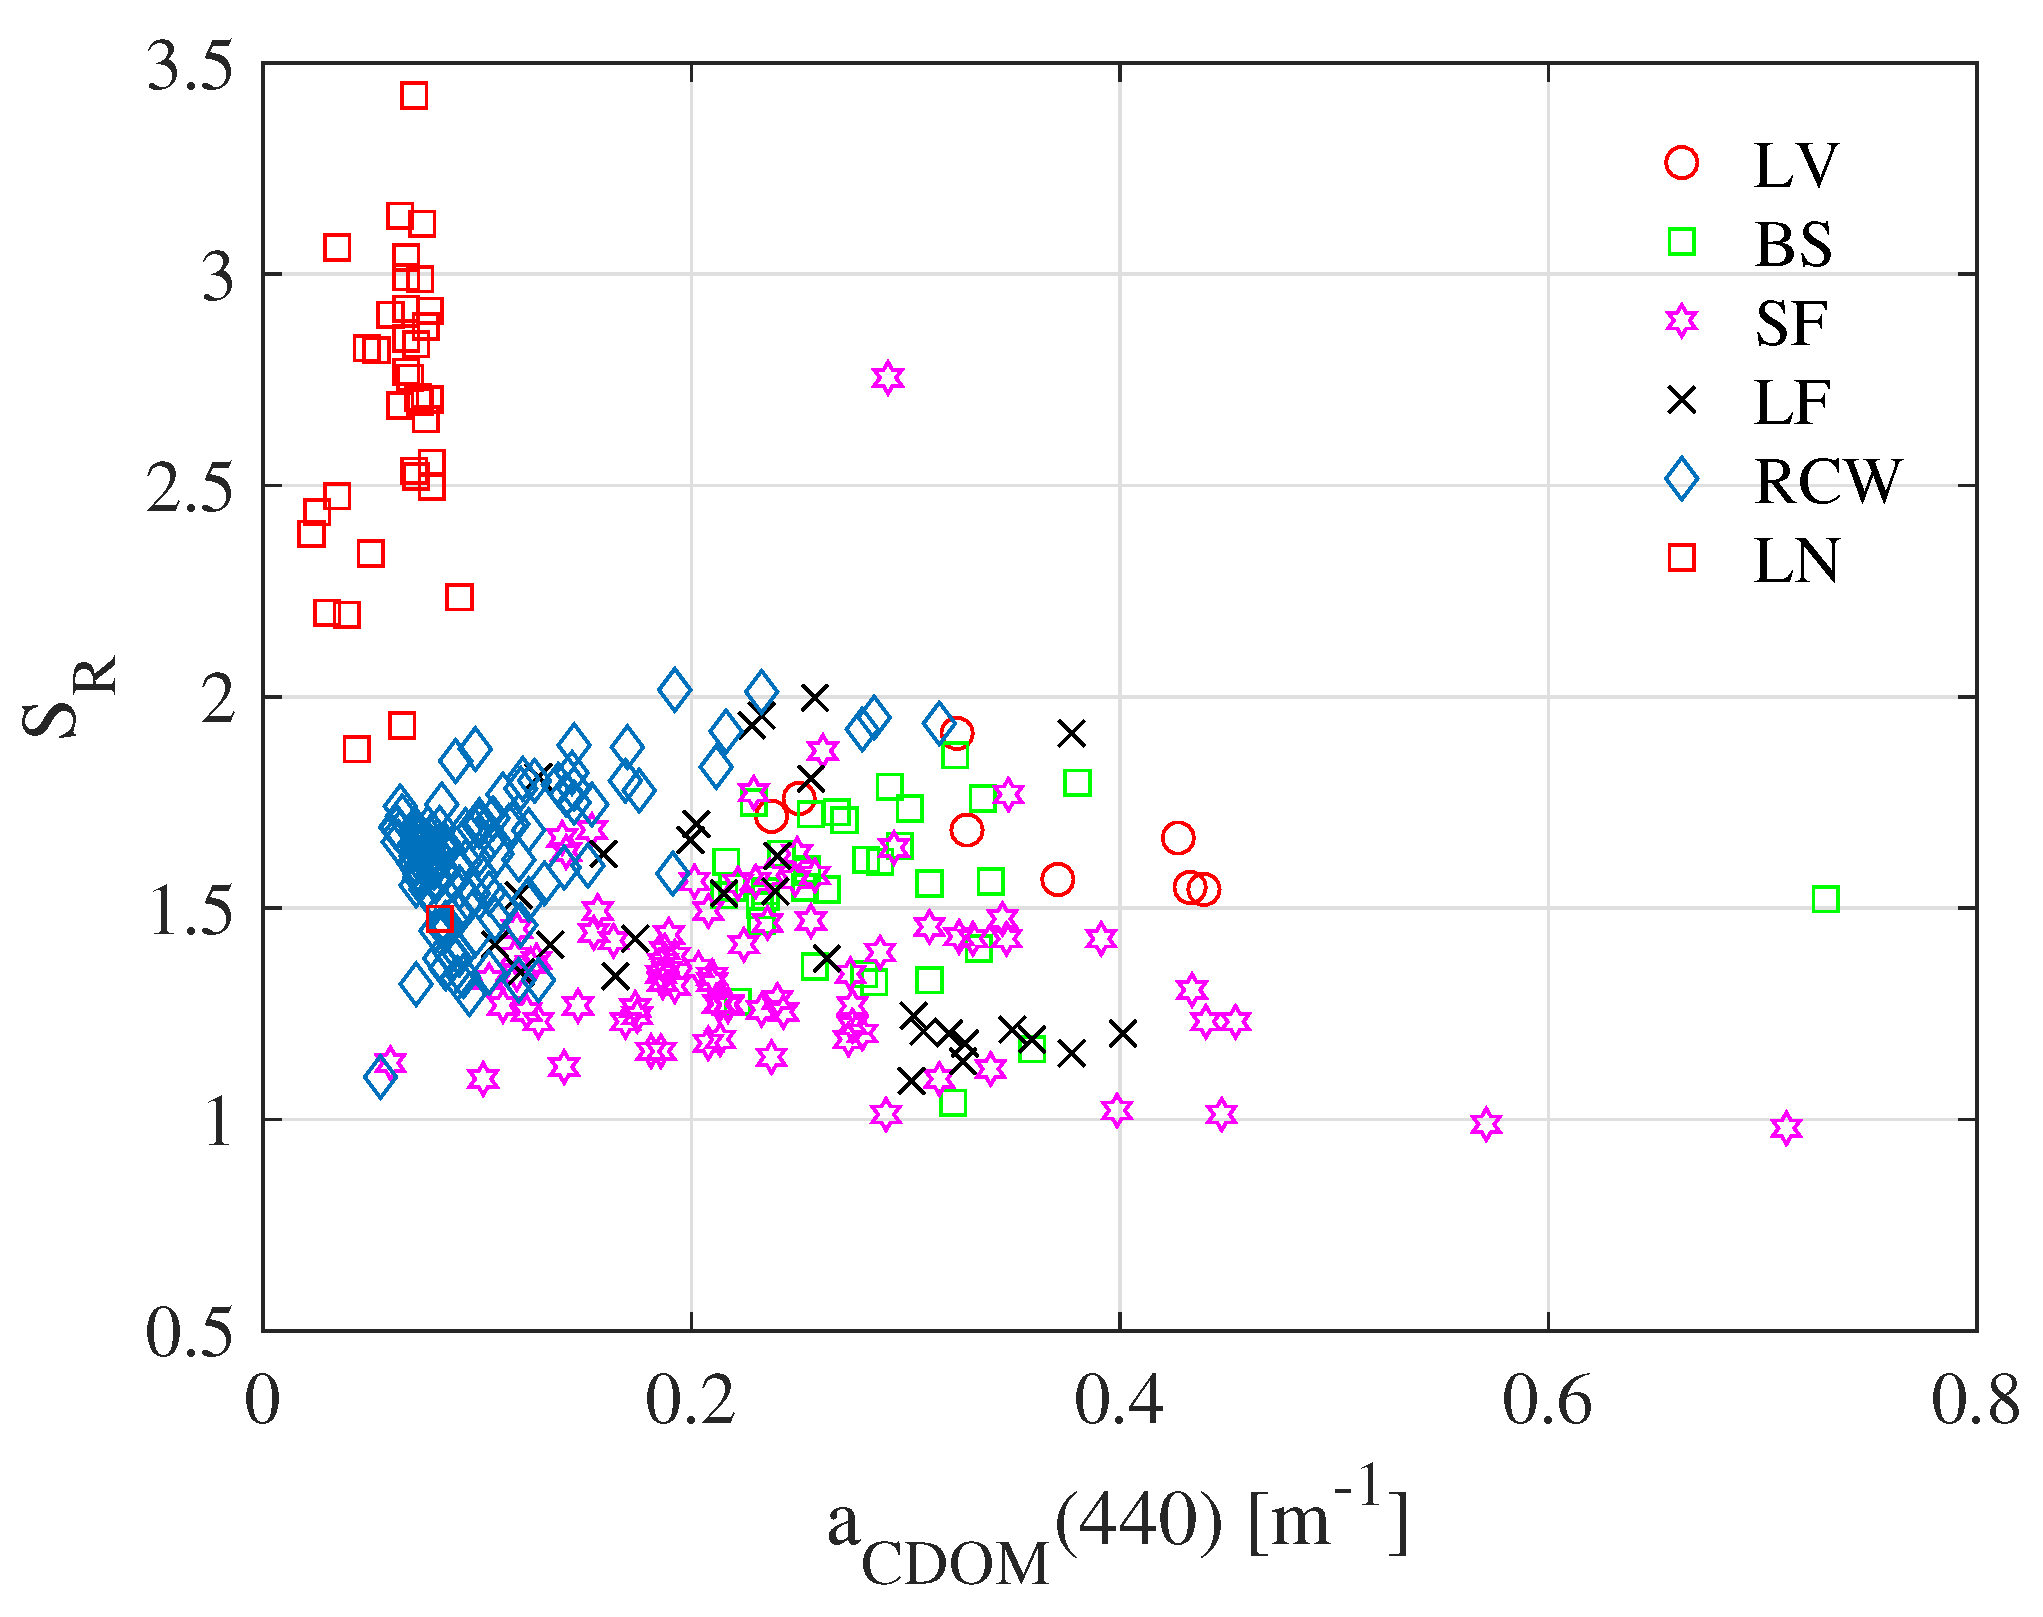
3.3. / Ratios Used as Indicators of CDOM Photobleaching
4. Conclusions
Author Contributions
Funding
Acknowledgments
Conflicts of Interest
References
- Kirk, J.T.O. Light and Photosynthesis in Aquatic Ecosystems, 3rd ed.; Cambridge University Press: Cambridge, UK, 2011; pp. 1–3. [Google Scholar]
- Bowers, D.G.; Evans, D.; Thomas, D.N.; Ellis, K.M.; Williams, P.J.L.B. Interpreting the colour of an estuary. Estuar. Coast. Shelf Sci. 2004, 59, 13–20. [Google Scholar] [CrossRef]
- Warnock, R.E.; Gieskes, W.W.C.; Van Laar, S. Regional and seasonal differences in light absorption by yellow substance in the Southern Bight of the North Sea. J. Sea Res. 1999, 42, 169–178. [Google Scholar] [CrossRef]
- Kalle, K. Meereskundliche chemische Untersuchungen mit Hilfe des Zeißchen Pulfrich-Photometers, VI. Mitt., Die Bestimmung des Nitrats und des Gelbstoffes (in German). Ann. Hydrogr. Maritim. Meteorol. 1937, 65, 276–282. [Google Scholar]
- Shank, G.C.; Zepp, R.G.; Vähätalo, A.; Lee, R.; Bartels, E. Photobleaching kinetics of chromophoric dissolved organic matter derived from mangrove leaf litter and floating Sargassum colonies. Mar. Chem. 2010, 119, 162–171. [Google Scholar] [CrossRef]
- Steinberg, D.K.; Nelson, N.B.; Carlson, C.A.; Prusak, A.C. Production of chromophoric dissolved organic matter (CDOM) in the open ocean by zooplankton and the colonial cyanobacterium Trichodesmium spp. Mar. Ecol. Prog. Ser. 2004, 267, 45–56. [Google Scholar] [CrossRef]
- Bricaud, A.; Morel, A.; Prieur, L. Absorption by dissolved organic matter of the sea (yellow substance) in the UV and visible domains. Limnol. Oceanogr. 1981, 26, 43–53. [Google Scholar] [CrossRef]
- Stedmon, C.A.; Markager, S.; Kaas, H. Optical properties and signatures of chromophoric dissolved organic matter (CDOM) in Danish coastal waters. Estuar. Coast. Shelf Sci. 2000, 51, 267–278. [Google Scholar] [CrossRef]
- Nelson, N.B.; Siegel, D.A. The global distribution and dynamics of chromophoric dissolved organic matter. Annu. Rev. Mar. Sci. 2013, 5, 447–476. [Google Scholar] [CrossRef]
- Babin, M.; Stramski, D.; Ferrari, G.M.; Claustre, H.; Bricaud, A.; Obolensky, G.; Hoepffner, N. Variations in the light absorption coefficients of phytoplankton, nonalgal particles, and dissolved organic matter in coastal waters around Europe. J. Geophys. Res. 2003, 108, 4.1–4.20. [Google Scholar] [CrossRef]
- Frette, Ø.; Erga, S.R.; Hamre, B.; Aure, J.; Stamnes, J.J. Seasonal variability in inherent optical properties in a western Norwegian fjord. Sarsia 2004, 89, 276–291. [Google Scholar] [CrossRef]
- Castillo, C.E.D.; Coble, P.G. Seasonal variability of the colored dissolved organic matter during the 1994–95 NE and SW Monsoons in the Arabian Sea. Deep Sea Res. Part II Top. Stud. Oceanogr. 2000, 47, 1563–1579. [Google Scholar] [CrossRef]
- Kowalczuk, P. Seasonal variability of yellow substance absorption in the surface layer of the Baltic Sea. J. Geophys. Res. 1999, 104, 30047–30058. [Google Scholar] [CrossRef]
- Matsuoka, A.; Hooker, S.B.; Bricaud, A.; Gentili, B.; Babin, M. Estimating absorption coefficients of colored dissolved organic matter (CDOM) using a semi-analytical algorithm for southern Beaufort Sea waters: Applications to deriving concentrations of dissolved organic carbon from space. Biogeosciences 2013, 10, 917–927. [Google Scholar] [CrossRef]
- Shang, Y.; Song, K.; Wen, Z.; Lyu, L.; Zhao, Y.; Fang, C.; Zhang, B. Characterization of CDOM absorption of reservoirs with its linkage of regions and ages across China. Environ. Sci. Pollut. Res. 2018, 25, 16009–16023. [Google Scholar] [CrossRef]
- Massicotte, P.; Asmala, E.; Stedmon, C.A.; Markager, S. Global distribution of dissolved organic matter along the aquatic continuum: Across rivers, lakes and oceans. Sci. Total Environ. 2017, 609, 180–191. [Google Scholar] [CrossRef] [Green Version]
- Ogawa, H.; Tanoue, E. Dissolved Organic Matter in Oceanic Waters. J. Oceanogr. 2003, 59, 129–147. [Google Scholar] [CrossRef]
- Blumthaler, M.; Ambach, W.; Rehwald, W. Solar UV-A and UV-B radiation fluxes at two alpine stations at different altitudes. Theor. Appl. Climatol. 1992, 46, 39–44. [Google Scholar] [CrossRef]
- Alexandris, D.; Varotsos, C.; Ya Kondratyev, K.; Chronopoulos, G. On the altitude dependence of solar effective UV. Phys. Chem. Earth Part C 1999, 24, 515–517. [Google Scholar] [CrossRef]
- Brinkmann, T.; Sartorius, D.; Frimmel, F.H. Photobleaching of humic rich dissolved organic matter. Aquat. Sci. 2003, 65, 415–424. [Google Scholar] [CrossRef]
- Del Vecchio, R.; Blough, N.V. Photobleaching of chromophoric dissolved organic matter in natural waters: Kinetics and modeling. Mar. Chem. 2002, 78, 231–253. [Google Scholar] [CrossRef]
- Twardowski, M.S.; Donaghay, P.L. Photobleaching of aquatic dissolved materials: Absorption removal, spectral alteration, and their interrelationship. J. Geophys. Res. 2002, 107, C8. [Google Scholar] [CrossRef]
- Arrigo, K.R.; Brown, C.W. Impact of chromophoric dissolved organic matter on UV inhibition of primary productivity in the sea. Mar. Ecol. Prog. Ser. 1996, 140, 207–216. [Google Scholar] [CrossRef] [Green Version]
- Mannino, A.; Novak, M.G.; Hooker, S.B.; Hyde, K.; Aurin, D. Algorithm development and validation of CDOM properties for estuarine and continental shelf waters along the northeastern U.S. coast. Remote Sens. Environ. 2014, 152, 576–602. [Google Scholar] [CrossRef]
- Erga, S.; Aursland, K.; Frette, Ø.; Hamre, B.; Lotsberg, J.; Stamnes, J.; Aure, J.; Rey, F.; Stamnes, K. UV transmission in Norwegian marine waters: Controlling factors and possible effects on primary production and vertical distribution of phytoplankton. Mar. Ecol. Prog. Ser. 2005, 305, 79–100. [Google Scholar] [CrossRef]
- Helms, J.R.; Stubbins, A.; Ritchie, J.D.; Minor, E.C.; Kieber, D.J.; Mopper, K. Absorption spectral slopes and slope ratios as indicators of molecular weight, source, and photobleaching of chromophoric dissolved organic matter. Limnol. Oceanogr. 2008, 53, 955–969. [Google Scholar] [CrossRef] [Green Version]
- Wei, J.; Lee, Z.; Ondrusek, M.; Mannino, A.; Tzortziou, M.; Armstrong, R.A. Spectral slopes of the absorption coefficient of colored dissolved and detrital material inverted from UV-visible remote sensing reflectance. J. Geophys. Res. Ocean. 2016, 121, 1953–1969. [Google Scholar] [CrossRef]
- Blough, N.V.; Del Vecchio, R. Chromophoric DOM in the coastal environment. In Biogeochemistry of Marine Dissolved Organic Matter; Hansell, D.A., Carlson, C.A., Eds.; Academic Press: San Diego, CA, USA, 2002; pp. 509–546. [Google Scholar]
- Conmy, R.N.; Coble, P.G.; Chen, R.F.; Gardner, G.B. Optical properties of colored dissolved organic matter in the Northern Gulf of Mexico. Mar. Chem. 2004, 89, 127–144. [Google Scholar] [CrossRef]
- Matsuoka, A.; Ortega-Retuerta, E.; Bricaud, A.; Arrigo, K.R.; Babin, M. Characteristics of colored dissolved organic matter (CDOM) in the Western Arctic Ocean: Relationships with microbial activities. Deep-Sea Res. Part II 2015, 118, 44–52. [Google Scholar] [CrossRef] [Green Version]
- Stedmon, C.A.; Markager, S. The optics of chromophoric dissolved organic matter (CDOM) in the Greenland Sea: An algorithm for differentiation between marine and terrestrially derived organic matter. Limnol. Oceanogr. 2001, 46, 2087–2093. [Google Scholar] [CrossRef]
- Matsuoka, A.; Hill, V.; Huot, Y.; Babin, M.; Bricaud, A. Seasonal variability in the light absorption properties of western Arctic waters: Parameterization of the individual components of absorption for ocean color applications. J. Geophys. Res. 2011, 116, C02007. [Google Scholar] [CrossRef]
- Vodacek, A.; Blough, N.V.; DeGrandpre, M.D.; Nelson, R.K. Seasonal variation of CDOM and DOC in the Middle Atlantic Bight: Terrestrial inputs and photooxidation. Limnol. Oceanogr. 1997, 42, 674–686. [Google Scholar] [CrossRef] [Green Version]
- Song, K.; Shang, Y.; Wen, Z.; Jacinthe, P.; Liu, G.; Lyu, L.; Fang, C. Characterization of CDOM in saline and freshwater lakes across China using spectroscopic analysis. Water Res. 2019, 150, 403–417. [Google Scholar] [CrossRef]
- Okullo, W.; Ssenyonga, T.; Hamre, B.; Frette, Ø.; Sørensen, K.; Stamnes, J.J.; Steigen, A.; Stamnes, K. Parameterization of the inherent optical properties of Murchison Bay, Lake Victoria. Appl. Opt. 2007, 46, 8553–8561. [Google Scholar] [CrossRef]
- Twardowski, M.S.; Boss, E.; Sullivan, J.M.; Donaghay, P.L. Modeling the spectral shape of absorption by chromophoric dissolved organic matter. Mar. Chem. 2004, 89, 69–88. [Google Scholar] [CrossRef]
- Zhang, Y.L.; Zhang, E.L.; Yin, Y.; Van Dijk, M.A.; Feng, L.Q.; Shi, Z.Q.; Liu, M.L.; Qin, B.Q. Characteristics and sources of chromophoric dissolved organic matter in lakes of the Yungui Plateau, China, differing in trophic state and altitude. Limnol. Oceanogr. 2010, 55, 2645–2659. [Google Scholar] [CrossRef]
- The Encyclopedia of Earth: Lake Victoria. Available online: http://www.eoearth.org/view/article/154134/ (accessed on 7 February 2015).
- Dorji, T.; Totland, Ø.; Moe, S.R.; Hopping, K.A.; Pan, J.B.; Klein, J.A. Plant functional traits mediate reproductive phenology and success in response to experimental warming and snow addition in Tibet. Glob. Chang. Biol. 2013, 19, 459–472. [Google Scholar] [CrossRef]
- Kang, S.C.; Yang, Y.P.; Zhu, L.P.; Ma, Y.M. Modern Environmental Processes and Changes in the Nam Co basin, Tibetan Plateau; Meteorological Press: Beijing, China, 2011; pp. 16–22. [Google Scholar]
- Norsang, G.; Chen, Y.C.; Pingcuo, N.; Dahlback, A.; Frette, Ø.; Kjeldstad, B.; Hamre, B.; Stamnes, K.; Stamnes, J.J. Comparison of ground-based measurements of solar UV radiation at four sites on the Tibetan Plateau. Appl. Opt. 2014, 53, 736–747. [Google Scholar] [CrossRef]
- Ssebiyonga, N.; Erga, S.R.; Hamre, B.; Stamnes, J.J.; Frette, O. Light conditions and photosynthetic efficiency of phytoplankton in Murchison Bay, Lake Victoria, Uganda. Limnologica 2013, 43, 185–193. [Google Scholar] [CrossRef]
- Erga, S.R.; Ssebiyonga, N.; Frette, Ø.; Hamre, B.; Aure, J.; Strand, Ø.; Strohmeier, T. Dynamics of phytoplankton distribution and photosynthetic capacity in a western Norwegian fjord during coastal upwelling: Effects on optical properties. Estuar. Coast. Shelf Sci. 2012, 97, 91–103. [Google Scholar] [CrossRef]
- Röhrs, J.; Kai, H.C.; Vikebø, F.; Sundby, S.; Saetra, Ø.; Broström, G. Wave-induced transport and vertical mixing of pelagic eggs and larvae. Limnol. Oceanogr. 2014, 59, 1213–1227. [Google Scholar]
- Nima, C.; Hamre, B.; Frette, Ø.; Erga, S.R.; Chen, Y.C.; Zhao, L.; Sørensen, K.; Norli, M.; Lu, D.R.; Xing, Q.G.; et al. Impact of particulate and dissolved material on light absorption properties in a High-Altitude Lake in Tibet, China. Hydrobiologia 2016, 768, 63–79. [Google Scholar] [CrossRef]
- Nima, C.; Frette, O.; Hamre, B.; Erga, S.R.; Chen, Y.; Zhao, L.; Sorensen, K.; Norli, M.; Stamnes, K.; Stamnes, J.J. Absorption properties of high-latitude Norwegian coastal water: The impact of CDOM and particulate matter. Estuar. Coast. Shelf Sci. 2016, 178, 158–167. [Google Scholar] [CrossRef] [Green Version]
- Erga, S.R.; Ssebiyonga, N.; Hamre, B.; Frette, Ø.; Hovland, E.K.; Hancke, K.; Drinkwater, K.F.; Rey, F.E.D. Environmental control of phytoplankton distribution and photosynthetic performance at the Jan Mayen Front in the Norwegian Sea. J. Mar. Syst. 2014, 130, 193–205. [Google Scholar] [CrossRef] [Green Version]
- Boyd, T.J.; Osburn, C.L. Changes in CDOM fluorescence from allochthonous and autochthonous sources during tidal mixing and bacterial degradation in two coastal estuaries. Mar. Chem. 2004, 89, 189–210. [Google Scholar] [CrossRef]
- Retamal, L.; Vincent, W.F.; Martineau, C.; Osburn, C.L. Comparison of the optical properties of dissolved organic matter in two river-influenced coastal regions of the Canadian Arctic. Estuar. Coast. Shelf Sci. 2007, 72, 261–272. [Google Scholar] [CrossRef]
- Granskog, M.A.; Macdonald, R.W.; Mundy, C.J.; Barber, D.G. Distribution, characteristics and potential impacts of chromophoric dissolved organic matter (CDOM) in Hudson Strait and Hudson Bay, Canada. Cont. Shelf Res. 2007, 27, 2032–2050. [Google Scholar] [CrossRef]
- Holmes, R.W. The secchi disk in turbid coastal waters1. Limnol. Oceanogr. 1970, 15, 688–694. [Google Scholar] [CrossRef]
- Eilertsen, H.C.; Frantzen, S. Phytoplankton from two sub-Arctic fjords in northern Norway 2002–2004: I. Seasonal variations in chlorophyll a and bloom dynamics. Mar. Biol. Res. 2007, 3, 319–332. [Google Scholar] [CrossRef]
- Norsang, G.; Kocbach, L.; Wangmu, T.; Stamnes, J.J.; Dahlback, A.; Pingcuo, N. Ground-based measurements and modeling of solar UV-B radiation in Lhasa, Tibet. J. Atmos. Environ. 2009, 43, 1498–1502. [Google Scholar] [CrossRef]
- Norsang, G.; Kocbach, L.; Stamnes, J.J.; Wangmu, T.; Pingcuo, N. Spatial distribution and temporal variation of solar UV radiation over the Tibetan Plateau. Appl. Phys. Res. 2011, 3, 37–46. [Google Scholar] [CrossRef]
- Carvalho, S.I.M.; Otero, M.; Duarte, A.C.; Santos, E.B.H. Spectroscopic changes on fulvic acids from a kraft pulp mill effluent caused by sun irradiation. Chemosphere 2008, 73, 1845–1852. [Google Scholar] [CrossRef]
- Carreto, J.I.; Carignan, M.O.; Montoya, N.G. A high-resolution reverse-phase liquid chromatography method for the analysis of mycosporine-like amino acids (MAAs) in marine organisms. Mar. Biol. 2005, 146, 237–252. [Google Scholar] [CrossRef]
- Tilstone, G.H.; Airs, R.L.; Vicente, V.M.; Widdicombe, C.E.; Llewellyn, C.A. High concentrations of mycosporine-like amino acids and colored dissolved organic matter in the sea surface microlayer off the Iberian Peninsula. Limnol. Oceanogr. 2010, 55, 1835–1850. [Google Scholar] [CrossRef]
- Pavlov, A.K.; Silyakova, A.; Granskog, M.A.; Bellerby, R.G.J.; Engel, A.; Schulz, K.G.; Brussaard, C.P.D. Marine CDOM accumulation during a coastal Arctic mesocosm experiment: No response to elevated pCO2 levels. J. Geophys. Res. Biogeosci. 2014, 119, 1216–1230. [Google Scholar] [CrossRef]
- Li, S.; Zhang, J.; Mu, G.; Ju, H.; Wang, R.; Li, D.; Shabbir, A.H. Spatiotemporal Characterization of Chromophoric Dissolved Organic Matter (CDOM) and CDOM-DOC Relationships for Highly Polluted Rivers. Water 2016, 8, 399. [Google Scholar] [CrossRef]
- Shao, T.; Zheng, H.; Song, K.; Zhao, Y.; Zhang, B. Influence of environmental factors on absorption characteristics of suspended particulate matter and CDOM in Liaohe River watershed, northeast China. Environ. Sci. Pollut. Res. 2017, 24, 19322–19337. [Google Scholar] [CrossRef]
- Stedmon, C.A.; Amon, R.M.W.; Rinehart, A.J.; Walker, S.A. The supply and characteristics of colored dissolved organic matter (CDOM) in the Arctic Ocean: Pan Arctic trends and differences. Mar. Chem. 2011, 124, 108–118. [Google Scholar] [CrossRef]
- Chen, C. Chemical and physical fronts in the Bohai, Yellow and East China seas. J. Mar. Syst. 2009, 78, 394–410. [Google Scholar] [CrossRef]
- Aksnes, D.L.; Dupont, N.; Staby, A.; Fiksen, Ø.; Kaartvedt, S.; Aure, J. Coastal water darkening and implications for mesopelagic regime shifts in Norwegian fjords. Mar. Ecol. Prog. Ser. 2009, 387, 39–49. [Google Scholar] [CrossRef]
- Zhang, Y.L.; Zhang, E.L.; Liu, M.L. Spectral absorption properties of chromophoric dissolved organic matter and particulate matter in Yunnan Plateau lakes. J. Lake Sci. 2009, 21, 255–263. (In Chinese) [Google Scholar]
- Chen, B.; Wei, H.; Ma, S.; Feng, M.; Liu, C.; Gu, X.; Kaining, C. Characterization of Chromophoric Dissolved Organic Matter in the Littoral Zones of Eutrophic Lakes Taihu and Hongze during the Algal Bloom Season. Water 2018, 10, 861. [Google Scholar] [CrossRef]
- Meler, J.; Kowalczuk, P.; Ostrowska, M.; Ficek, D.; Zablocka, M.; Zdun, A. Parameterization of the light absorption properties of chromophoricdissolved organic matter in the Baltic Sea and Pomeranian lakes. Ocean Sci. 2016, 12, 1013–1032. [Google Scholar] [CrossRef]
- Zhou, X.J.; Li, W.L.; Chen, L.X.; Liu, Y. Study on ozone change over the Tibetan Plateau. Acta Meteorol. Sinica 2006, 20, 129–143. [Google Scholar]
- Yamashita, Y.; Tanoue, E. Basin scale distribution of chromophoric dissolved organic matter in the Pacific Ocean. Limnol. Oceanogr. 2009, 54, 598–609. [Google Scholar] [CrossRef]
- Harvey, E.T.; Kratzer, S.; Andersson, A. Relationships between colored dissolved organic matter and dissolved organic carbon in different coastal gradients of the Baltic Sea. Ambio 2015, 44, 392–401. [Google Scholar] [CrossRef] [Green Version]
- Green, S.A.; Blough, N.V. Optical absorption and fluorescence properties of chromophoric dissolved organic matter in natural waters. Limnol. Oceanogr. 1994, 39, 1903–1916. [Google Scholar] [CrossRef]
- Højerslev, N.K.; Aas, E. Spectral light absorption by yellow substance in the Kattegat-Skagerrak area. Oceanologia 2001, 43, 39–60. [Google Scholar]
- Qiu, Z.; Sun, D.; Hu, C.; Wang, S.; Zheng, L.; Huan, Y.; Peng, T. Variability of Particle Size Distributions in the Bohai Sea and the Yellow Sea. Remote Sens. 2016, 8, 949. [Google Scholar] [CrossRef]
- Tietjen, T.E.; Vahatalo, A.V.; Wetzel, R.G. Effects of clay mineral turbidity on dissolved organic carbon and bacterial production. Aquat. Sci. 2005, 67, 51–60. [Google Scholar] [CrossRef]
- Erga, S.R.; Haugen, S.B.; Bratbak, G.; Egge, J.K.; Heldal, M.; Mork, K.A.; Norland, S. Seasonal variations in C:N:Si:Ca:P:Mg:S:K:Fe relationships of seston from Norwegian coastal water: Impact of extreme offshore forcing during winter-spring 2010. Mar. Chem. 2017, 196, 1–12. [Google Scholar] [CrossRef]
- Coble, P.G. Marine optical biogeochemistry: The chemistry of ocean color. Chem. Rev. 2007, 107, 402–418. [Google Scholar] [CrossRef]
- Klitgaardkristensen, D.; Buhlmortensen, L. Benthic foraminifera along an offshore-fjord gradient: A comparison with amphipods and molluscs. J. Nat. Hist. 1999, 33, 317–350. [Google Scholar] [CrossRef]


| Study Site | Sampling Periods | Depths [m] | Number of Samples | Water Type | Chl-a [gL] | Euphotic Depth [m] | Trophic State | K(PAR)[m] |
|---|---|---|---|---|---|---|---|---|
| Samnangerfjord | March 1999 | 0, 10, 50 | 85 | fjord | 0.01–6.3 [11] | 12–38 | MT | 0.12–0.4 * |
| (SF) | October 1999 | |||||||
| January 2000 | ||||||||
| Lake Victoria | October 2003 | surface | 8 | lake | 4.8–60.7 [35] | 2–2.4 | ET | 1.93–2.25 [42] |
| (LV) | November 2003 | |||||||
| December 2003 | ||||||||
| January 2004 | ||||||||
| Lysefjord | January 2011 | 1, 10, 25, 50 | 29 | fjord | 0.5–5 [43] | 12–35 | MT | 0.13–0.38 [43] |
| (LF) | ||||||||
| Bohai Sea | September 2012 | 0, hs, s | 36 | coastal | 0.97–8.80 | 6–16 | ET | 0.29–0.72 ** |
| (BS) | September 2013 | |||||||
| August 2014 | ||||||||
| Lake Namtso | July 2013 | 0, hs, s | 36 | lake | 0.01–0.17 [45] | 29–38 | OT | 0.12–0.16 |
| (LN) | August 2014 | |||||||
| Røst Coastal Water | May 2013 | 0, hs, s | 109 | coastal | 0.17–1.94 [46] | 26–51 | MT | 0.09–0.18 *** |
| (RCW) | October 2013 | |||||||
| April 2014 | ||||||||
| October 2014 | ||||||||
| March 2015 | ||||||||
| Total | 303 |
| Absorption Coefficient | Location | Max | Min | Mean | STD |
|---|---|---|---|---|---|
| [m] | [m] | [m] | [m] | [m] | |
| (320) | LV | 2.95 | 1.69 | 2.28 | 0.53 |
| LN | 0.94 | 0.22 | 0.34 | 0.12 | |
| BS | 3.72 | 1.33 | 1.96 | 0.59 | |
| RCW | 1.35 | 0.48 | 0.73 | 0.16 | |
| LF | 2.51 | 0.67 | 1.51 | 0.63 | |
| SF | 4.43 | 0.54 | 1.56 | 0.67 | |
| (325) | LV | 2.71 | 1.53 | 2.10 | 0.49 |
| LN | 0.77 | 0.19 | 0.30 | 0.10 | |
| BS | 3.37 | 1.20 | 1.77 | 0.51 | |
| RCW | 1.24 | 0.44 | 0.66 | 0.15 | |
| LF | 2.30 | 0.61 | 1.39 | 0.57 | |
| SF | 4.08 | 0.48 | 1.40 | 0.61 | |
| (355) | LV | 1.64 | 0.91 | 1.27 | 0.31 |
| LN | 0.31 | 0.09 | 0.18 | 0.05 | |
| BS | 2.14 | 0.76 | 1.03 | 0.26 | |
| RCW | 0.80 | 0.24 | 0.38 | 0.10 | |
| LF | 1.39 | 0.39 | 0.86 | 0.34 | |
| SF | 2.60 | 0.30 | 0.85 | 0.38 | |
| (375) | LV | 1.20 | 0.67 | 0.94 | 0.22 |
| LN | 0.22 | 0.06 | 0.14 | 0.04 | |
| BS | 1.58 | 0.56 | 0.74 | 0.19 | |
| RCW | 0.63 | 0.18 | 0.28 | 0.08 | |
| LF | 1.04 | 0.30 | 0.64 | 0.25 | |
| SF | 1.86 | 0.22 | 0.61 | 0.28 | |
| (412) | LV | 0.68 | 0.38 | 0.54 | 0.12 |
| LN | 0.12 | 0.03 | 0.08 | 0.02 | |
| BS | 0.99 | 0.31 | 0.43 | 0.12 | |
| RCW | 0.43 | 0.10 | 0.16 | 0.06 | |
| LF | 0.61 | 0.18 | 0.37 | 0.13 | |
| SF | 1.07 | 0.10 | 0.36 | 0.16 | |
| (440) | LV | 0.44 | 0.24 | 0.35 | 0.08 |
| LN | 0.092 | 0.023 | 0.063 | 0.017 | |
| BS | 0.73 | 0.22 | 0.29 | 0.09 | |
| RCW | 0.32 | 0.055 | 0.11 | 0.05 | |
| LF | 0.40 | 0.11 | 0.25 | 0.09 | |
| SF | 0.71 | 0.05 | 0.24 | 0.11 |
| Location | [nm] | [nm] | |
|---|---|---|---|
| Lake Victoria (LV) | Max | 0.020 | 0.015 |
| Min | 0.018 | 0.013 | |
| Mean | 0.019 | 0.015 | |
| STD | 0.001 | 0.001 | |
| Bohai Sea (BS) | Max | 0.026 | 0.019 |
| Min | 0.015 | 0.012 | |
| Mean | 0.021 | 0.015 | |
| STD | 0.002 | 0.001 | |
| Samnangerfjord (SF) | Max | 0.023 | 0.020 |
| Min | 0.014 | 0.010 | |
| Mean | 0.018 | 0.015 | |
| STD | 0.002 | 0.002 | |
| Lysefjord (LF) | Max | 0.020 | 0.017 |
| Min | 0.013 | 0.010 | |
| Mean | 0.017 | 0.014 | |
| STD | 0.002 | 0.002 | |
| Røst Coastal Water (RCW) | Max | 0.027 | 0.022 |
| Min | 0.017 | 0.011 | |
| Mean | 0.022 | 0.015 | |
| STD | 0.002 | 0.002 | |
| Lake Namtso (LN) | Max | 0.042 | 0.016 |
| Min | 0.026 | 0.011 | |
| Mean | 0.032 | 0.013 | |
| STD | 0.005 | 0.001 |
© 2019 by the authors. Licensee MDPI, Basel, Switzerland. This article is an open access article distributed under the terms and conditions of the Creative Commons Attribution (CC BY) license (http://creativecommons.org/licenses/by/4.0/).
Share and Cite
Nima, C.; Frette, Ø.; Hamre, B.; Stamnes, J.J.; Chen, Y.-C.; Sørensen, K.; Norli, M.; Lu, D.; Xing, Q.; Muyimbwa, D.; et al. CDOM Absorption Properties of Natural Water Bodies along Extreme Environmental Gradients. Water 2019, 11, 1988. https://doi.org/10.3390/w11101988
Nima C, Frette Ø, Hamre B, Stamnes JJ, Chen Y-C, Sørensen K, Norli M, Lu D, Xing Q, Muyimbwa D, et al. CDOM Absorption Properties of Natural Water Bodies along Extreme Environmental Gradients. Water. 2019; 11(10):1988. https://doi.org/10.3390/w11101988
Chicago/Turabian StyleNima, Ciren, Øyvind Frette, Børge Hamre, Jakob J. Stamnes, Yi-Chun Chen, Kai Sørensen, Marit Norli, Daren Lu, Qianguo Xing, Dennis Muyimbwa, and et al. 2019. "CDOM Absorption Properties of Natural Water Bodies along Extreme Environmental Gradients" Water 11, no. 10: 1988. https://doi.org/10.3390/w11101988