Spatio-Temporal Variations in Precipitation Extremes in the Endorheic Hongjian Lake Basin in the Ordos Plateau, China

Key Laboratory of Water Cycle and Related Land Surface Processes, Institute of Geographic Sciences and Natural Resources Research, Chinese Academy of Sciences, Beijing 100101, China
Water 2019, 11(10), 1981; https://doi.org/10.3390/w11101981
Submission received: 13 August 2019
/
Revised: 12 September 2019
/
Accepted: 19 September 2019
/
Published: 23 September 2019
(This article belongs to the Section Hydrology)
Abstract
:Precipitation extremes have important implications for regional water resources and ecological environment in endorheic (landlocked) basins. The Hongjian Lake Basin (HJLB), as the representative inflow area in the Ordos Plateau in China, is suffering from water scarcity and an ecosystem crisis; however, previous studies have paid little attention to changes in precipitation extremes in the HJLB. In this study, we investigated the spatio-temporal variations of the core extreme precipitation indices (i.e., PRCTOT, R99p, Rx1day, Rx5day, SDII, R1, R10, CWD, and CDD) recommended by the Expert Team on Climate Change Detection and Indices (ETCCDI), and analyzed the climatic dry–wet regime indicated by these extreme indices during 1960–2014 in the HJLB. The results show that the nine extreme indices had large differences in temporal and spatial variation characteristics. All the nine extreme precipitation indices showed a large fluctuation, both in the whole period and in the three detected different sub-periods, with variation magnitudes of 13%–52%. Most extreme indices had non-significant downward trends, while only the consecutive wet days (CWD) had a significant upward trend. The eight extreme wet indices increased from northwest to southeast, while the consecutive dry days (CDD) had the opposite change direction. Each index had a different trend with different spatial distribution locations and areas. The nine extreme indices revealed that the climate in the HJLB has become a drought since the early 1980s. This was specifically indicated by all four extreme precipitation quantity indices (PRCTOT, R99p, Rx1day, Rx5day) and the extreme intensity index (SDII) declining, as well as the number of heavy precipitation days (R10) decreasing. When the dry–wet variations was divided into the different sub-periods, the climatic dry–wet changes of each index demonstrated more inconsistency and complexity, but most indices in the first sub-period from 1960 to the late 1970s could be regarded as a wet high-oscillation phase, the second sub-period after the early 1980s was a relatively dry low-oscillation phase, and the third sub-period after the late 1990s or early 21st century was a dry medium-oscillation phase. It is worth noting that most extreme indices had an obvious positive linear trend in the third sub-period, which means that in the last 20 years, the precipitation extremes showed an increasing trend. This study could provide a certain scientific reference for regional climate change detection, water resources management, and disaster prevention in the HJLB and similar endorheic basins or inland arid regions.
1. Introduction
An endorheic (hydrologically landlocked) basin is a closed drainage basin lacking any water outflow to other external bodies of water, such as rivers or the ocean [1,2]. Endorheic basins, spatially concurring with arid and semi-arid climate regions, mostly with basin outlets ending in endorheic lakes [3], cover approximately 20% of the Earth’s land surface area [4]. According to continental and climatic similarities, the endorheic basins and related lakes in the world could be grouped into six primary zones, namely Central Eurasia, Sahara and Arabia, Great Rift Valley and Southern Africa, Western North America, Dry Andes and Patagonia, and Australia [4]. Some of the notable endorheic lakes include the Caspian and Aral Seas in Central Asia, Lake Chad in Africa, the Great Salt Lake in North America, Lake Titicaca in South America, and Lake Eyre in Australia [1,3]. Endorheic lakes play a vital role in maintaining the ecological environment, regulating regional climate, and supporting sustainable socio-economic development [4,5,6]. Due to the unique landlocked terrain and arid climate, both water resources and fragile ecosystems in endorheic basins are very sensitive to environmental change, and most endorheic basins around the world are suffering from water scarcity and an ecosystem crisis [4,6,7,8,9]. Endorheic basins have drawn greater attention due to their associated increasing environmental challenges and vulnerability [4,6,7,10]. Studies on endorheic basins mainly focus on climate change using in situ surface observation and climate models [11,12], with variations in the lake area, water level, and volume measured using a remote sensing method [9,13,14,15,16,17], and water storages changes were mainly evaluated using water balance method, remote sensing, and hydrological models [4,6,13,18]. As the key element of the hydrological cycle, the most important source of water resources, as well as the key control factor for the ecological environment in endorheic basins, precipitation and its extreme changes have an important impact on local hydrological process change, regional water resource management, ecological restoration, and disaster prevention in these water-limited endorheic basins [3,7,11]. Therefore, it is very important to study variations of precipitation extremes in endorheic basins.
Global warming might result in the intensification of extreme precipitation events [19,20]. Due to their tremendous and profound impacts on human society and the environment [21,22], precipitation extremes have been widely studied worldwide on different spatial scales, such as the observed or modeled intensification of precipitation extremes on a global scale [21,23,24,25], remarkable spatial differences in extreme precipitation indices on a regional scale [11,22,26,27,28,29,30], and visible differences in precipitation extremes on a national scale [31,32,33,34,35,36]. In general, these studies on precipitation extremes are more widely concentrated in exorheic (outflow) basins or regions with more abundant water resources, denser populations, and more developed economies. However, studies on precipitation extremes in endorheic basins are still not deep or extensive enough.
Studies on precipitation extremes in endorheic basins in China are mainly concentrated in the northwestern inland region and the inflow regions of the Qinghai-Tibet Plateau, where the main distribution regions of the inland rivers in China are located. For example, Wang et al. [11] revealed that precipitation extremes, in accordance with the Expert Team on Climate Change Detection and Indices (ETCCDI), increased during 1960–2010 in the northwest arid region. Huang et al. [12] showed that the total precipitation on very wet days is projected to slightly increase in the inland Tarim River Basin using the regional climate model. Cheng et al. [30] analyzed the trend and temporal variation of extreme precipitation indices recommended by ETCCDI during 1960–2011 over the arid inland Heihe River basin. You et al. [37] showed that most precipitation indices recommended by ETCCDI during 1961–2005 exhibited increasing trends in the southern and northern Tibetan Plateau and showed decreasing trends in the central Tibetan Plateau. However, as the representative inflow area in the Ordos Plateau in China, the endorheic Hongjian Lake Basin (HJLB) has not received sufficient attention. Previous studies in the HJLB have focused on the landscape’s dynamic changes based on remote sensing images [38,39], the ecological water demand by the water balance calculation [40], and the lake area variations via remote sensing and water balance modelling [14,41]. There are few studies on precipitation extremes in the HJLB. In this study, we aim to investigate the spatio-temporal variations in the precipitation extremes during 1960–2014 in the HJLB and to analyze the climatic dry–wet regime indicated by these extreme indices in the HJLB. This study could provide a certain scientific reference for regional climate change detection, water resources management, ecological environmental protection, and disaster prevention in the HJLB and similar endorheic basins or inland arid regions.
2. Materials and Methods
2.1. Study Area
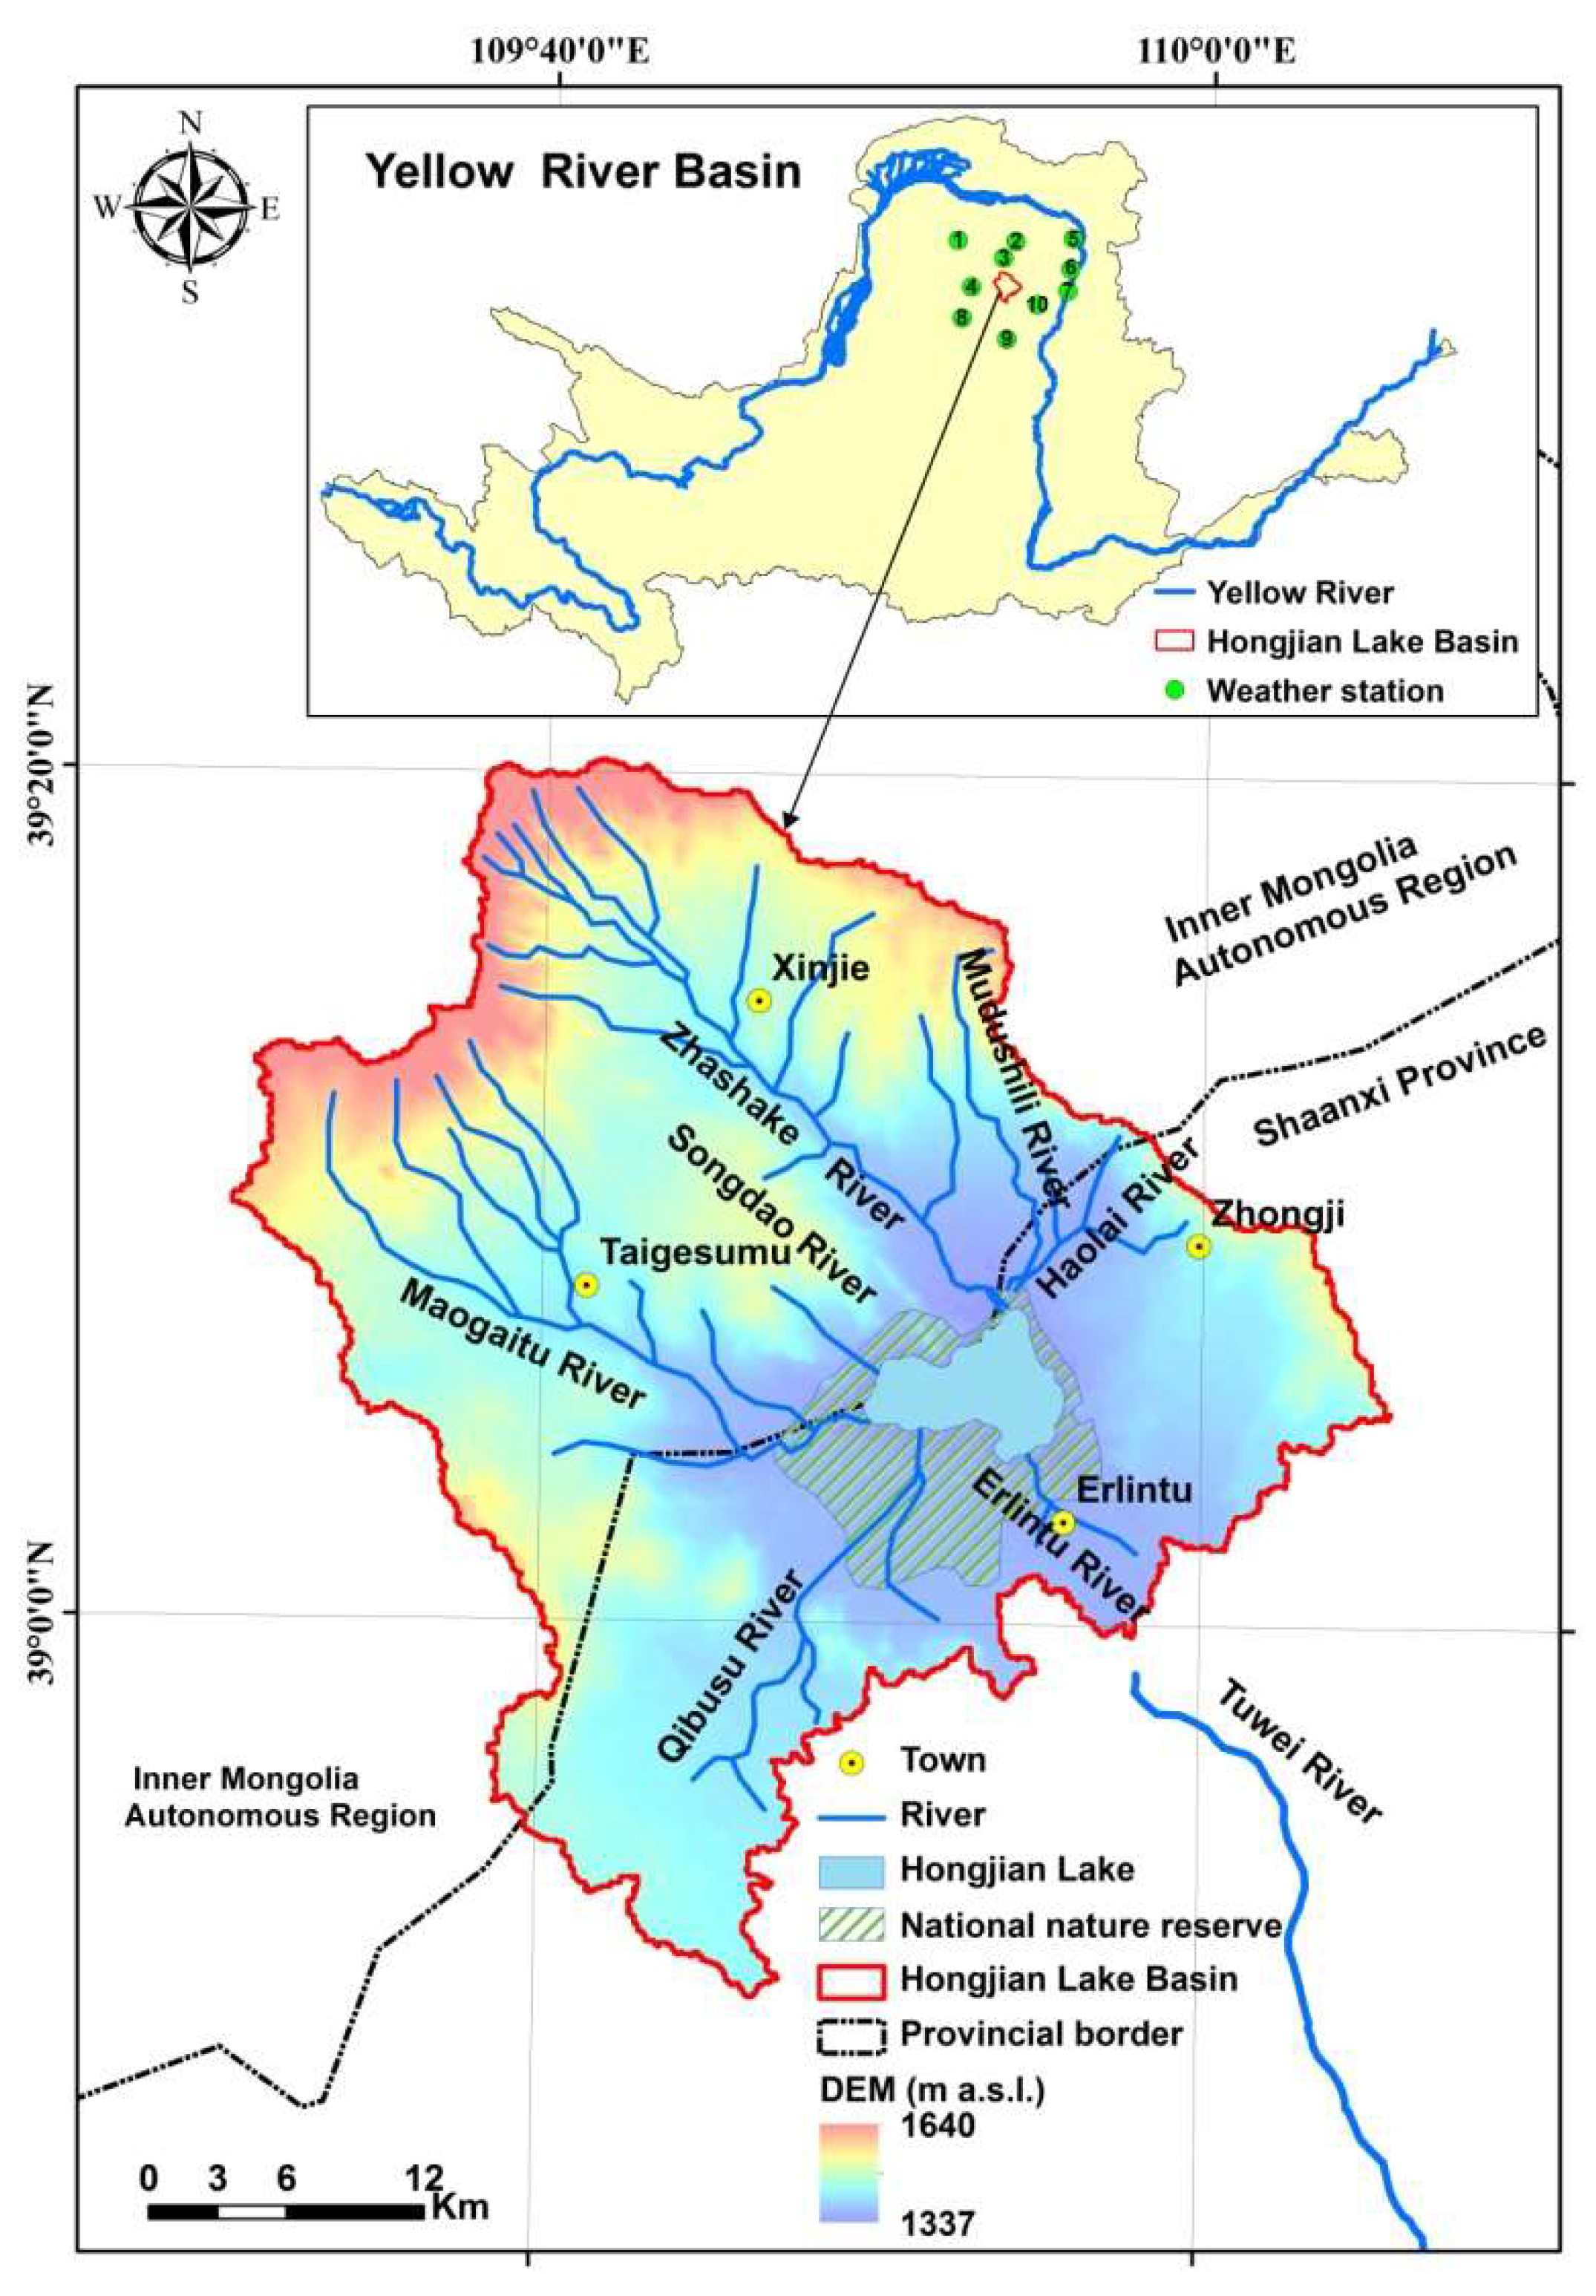
The Hongjian Lake Basin (HJLB), with a longitude of 109°30′38″ E–110°5′46″ E and a latitude of 38°51′10″ N–39°20′20″ N, is located in the Ordos Plateau, China [14,42]. The HJLB is also located in the middle regions of the Yellow River Basin, and closest to the Tuwei River, which is one of the main outflow tributaries in the middle reaches of the Yellow River (Figure 1). The HJLB spans the two provinces, and its western and northwestern parts are in the Inner Mongolia Autonomous Region, where the eastern and southeastern parts belong to Shaanxi Province. The HJLB is sparsely populated, and there are only four counties within the HJLB (Figure 1).
The HJLB is an inflow zone, and its surface water does not flow into the Yellow River system. Seven seasonal rivers flow into the central Hongjian Lake [14]. There are four seasonal rivers in the Inner Mongolia Autonomous Region (i.e., the Maogaitu River, the Zhashake River, the Mudushili River, and the Songdao River) flowing into the lake from the west and northwest, and three seasonal rivers in Shaanxi Province (i.e., the Qibosu River, the Erlintu River, and the Haolai River) flowing into the lake from the south, southeast, and north (Figure 1). In this study, based on hydrological analysis, the HJLB covers an area of ≈1513.10 km2 under the projected coordinate system projection of Beijing_1954_GK_Zone_19N, with an elevation from 1337 m to 1640 m.
The HJLB is a typical inland semi-arid and arid region. According to the daily meteorological data collected in this study (see Section 2.2.1), the average annual precipitation during 1960–2014 is 393.0 mm for the whole basin. The rainy season is concentrated from June to September, and precipitation in the rainy season accounts for 75.9% of the annual precipitation. The average annual surface water evaporation is generally 964–1124 mm, increasing from southeast to northwest. The average annual temperature is 7.4 °C. The coldest month is January, with an average temperature of −10.0 °C, while the hottest month is July, with an average temperature of 22.4 °C. Grassland, sand land, woodland, cropland, and lake water surface are the main land-use types, and grassland and shrubs are the primary vegetation types in the HJLB [14,39]. The HJLB has an extremely fragile ecological environment. The central Hongjian Lake area has shrunk severely since 1999 due to climate change and intensified human activity [14].
2.2. Data
2.2.1. Daily Precipitation
The time series of daily precipitation records are the necessary basic data for calculating extreme indices. The China Meteorological Data Service Center (CMDC), an upgraded system of the meteorological data-sharing platform developed by the Climate Data Center of the National Meteorological Information Center of the China Meteorological Administration (http://data.cma.cn/en/?r=site/index), makes a dataset of daily climate data, including such daily data as pressure, temperature, precipitation amount, evaporation amount, relative humidity, wind direction, wind speed, and sunshine duration from more than 2000 national weather stations in China, and has done so since the 1950s. After strict repeated verifications and quality control by the CMDC, all suspicious and incorrect data have been rechecked and rectified manually, the missing digitalized data are supplemented, and eventually all element data are flagged with quality control codes. The availability of various weather elements in the daily dataset is generally above 99%, and the correct data rate approaches nearly 100%. However, in this study, the study area (HJLB) belongs to a typical scarce data region, with no national weather stations within the HJLB. There are only 10 national weather stations around the HJLB (Figure 1), and their basic information is shown in Table 1. From the CMDC’s daily climate dataset, we obtained the daily precipitation data during 1960–2014 at the 10 national weather stations around the HJLB. On the basis of this daily precipitation data, we further applied the thin plate spline method [43,44] in ANUSPLIN version 4.4 software (https://fennerschool.anu.edu.au/research/products/anusplin, Australian National University, Canberra, Australia) [45] to interpolate the site’s daily data into grid data with a resolution of 0.05° × 0.05° to better obtain the basic daily precipitation and perform the spatial analysis of extreme precipitation within the HJLB.
2.2.2. Extreme Precipitation Indices
In the study of climate change detection and extreme events, the 27 core climate change indices recommended by the Expert Team on Climate Change Detection and Indices (ETCCDI) (http://etccdi.pacificclimate.org) [26,46,47] are most widely used around the world. Because not all the indices are meaningful in the HJLB, we finally chose the nine extreme precipitation indices from the core indicators, and their exact definitions are shown in Table 2. Based on the definitions of indices and the obtained daily precipitation data, we calculated the nine extremes precipitation indices using the MATLAB R2017b (9.3.0.713579) software (The MathWorks, Inc., Natick, MA, USA). According to the attribute and unit of these extreme indices, the nine indices can be further divided into three classes: the quantity indices expressed in mm units (i.e., PRCTOT, R99p, Rx1day, and Rx5day), the intensity index expressed in mm/day (i.e., SDII), and the time indices expressed in days (i.e., R1, R10, CWD, and CDD).
2.3. Methods
2.3.1. Basic Statistical Analysis
In this study, we selected the mean value (M), standard deviation (Sd), coefficient of variation (Cv, Cv = Sd/M), and slope of the linear trend (S) as basic statistics in order to help analyze the changes in each extreme precipitation index during the study period of 1960–2014 and the sub-periods. These basic statistics were calculated using IBM SPSS Statistics Version 19 software (https://www.ibm.com/products/spss-statistics).
2.3.2. Trend Analysis
The trends of extreme precipitation indices in the period of 1960–2014 and in the sub-periods were determined using the linear regression method. Then, the nonparametric Mann–Kendall test [48,49], as the widely used method for trend detection due to its robustness for non-normally distributed data [20,50,51], was applied to detect the significance of trends in the indices. For a given time series X (X1, X2…Xn); their ranks are R1, R2…Rn; and the Mann–Kendall rank statistic (S) is calculated as:
where the symbolic function is defined as:
An increasing or decreasing trend in the time series is indicated by a positive S and a negative S, respectively. If the null hypothesis H0 (i.e., no trend in the data) is true, then S can be assumed to be approximately normally distributed with:
The Z score of S is calculated as:
In this study, in order to statistically distinguish the differences in the trends of the indices, as well as the differences in the spatial trends of each indicator, and to concurrently ensure that there is at least one indicator with a significant change trend, the corresponding significant level was set as p = 0.1, which means that a positive Z score larger than 1.64 indicated a significant increasing trend, while a negative Z score lower than −1.64 indicated a significant decreasing trend. When the absolute value of the Z score was less than 1.64, it meant that the trend was not significant.
2.3.3. Turning Points Detection
The non-parametric Pettitt test [52] is commonly used to detect the turning points in the extreme precipitation indices [53,54,55]. For a given time series composed of X1, X2, …, Xn, the Pettitt test considers the series as two samples X1, X2…, Xt and Xt+1, Xt+2, …, Xn, and the Mann–Whitney statistic Ut,n is expressed as:
where the symbolic function sign(Xt − Xj) is the same as mentioned in Equation (2), and n is the data set length. Then the statistic Kt,n and the corresponding significance level are defined as:
If p < 0.05, a significant turning point exists.
2.3.4. Spatial Analysis
Based on every grid’s daily precipitation data with a resolution of 0.05° × 0.05°, as well as the definition of extreme precipitation indices (Table 2), we first calculated the nine extreme precipitation indices and the change trends of the indices for every grid, using the MATLAB R2017b software. Second, using the georasterref function and the geotiffwrite function in MATLAB software (https://ww2.mathworks.cn/help/map/ref/geotiffwrite.html?s_tid=srchtitle), we converted the gridded calculation results (i.e., extreme precipitation indices and their change trends) into data in tiff format using the coordinate system of GCS_WGS_1984. Third, we imported the targeted data in tiff format into ArcGIS Desktop 10.5 software (https://desktop.arcgis.com/en/). We selected the format of a stretched color ramp map (Layer Properties\Symbology\Stretched\Color Ramp) to symbolize and show the spatial results. To display the numerical distribution of the results more intuitively, using the Contour geoprocessing tool integrated into the Surface of ArcToolbox (Toolboxes\System Toolboxes\Spatial Analyst Tools.tbx\Surface\Contour), we further applied the format of contours to jointly show the spatial distributions of grid extreme indices and change trends. Lastly, as for the spatial change trends of indices, we needed to find the area of positive trends and negative trends. We used the Extract by Attributes tool integrated into Extraction within ArcToolbox (Toolboxes\System Toolboxes\Spatial Analyst Tools.tbx\Extraction\Extract by Attributes) to extract the targeted raster with positive trends (where clause is “VALUE > 0”), as well as the targeted raster with negative trends (where clause is “VALUE < 0”). When we got the positive and negative rasters, since each raster size was the same, we counted the number of rasters separately (Layer Properties\Symbology\Classified\Classify\Classification Statistics\Count) to get the required raster area.
3. Results
3.1. Temporal Variation Characteristics of Extreme Precipitation Indices
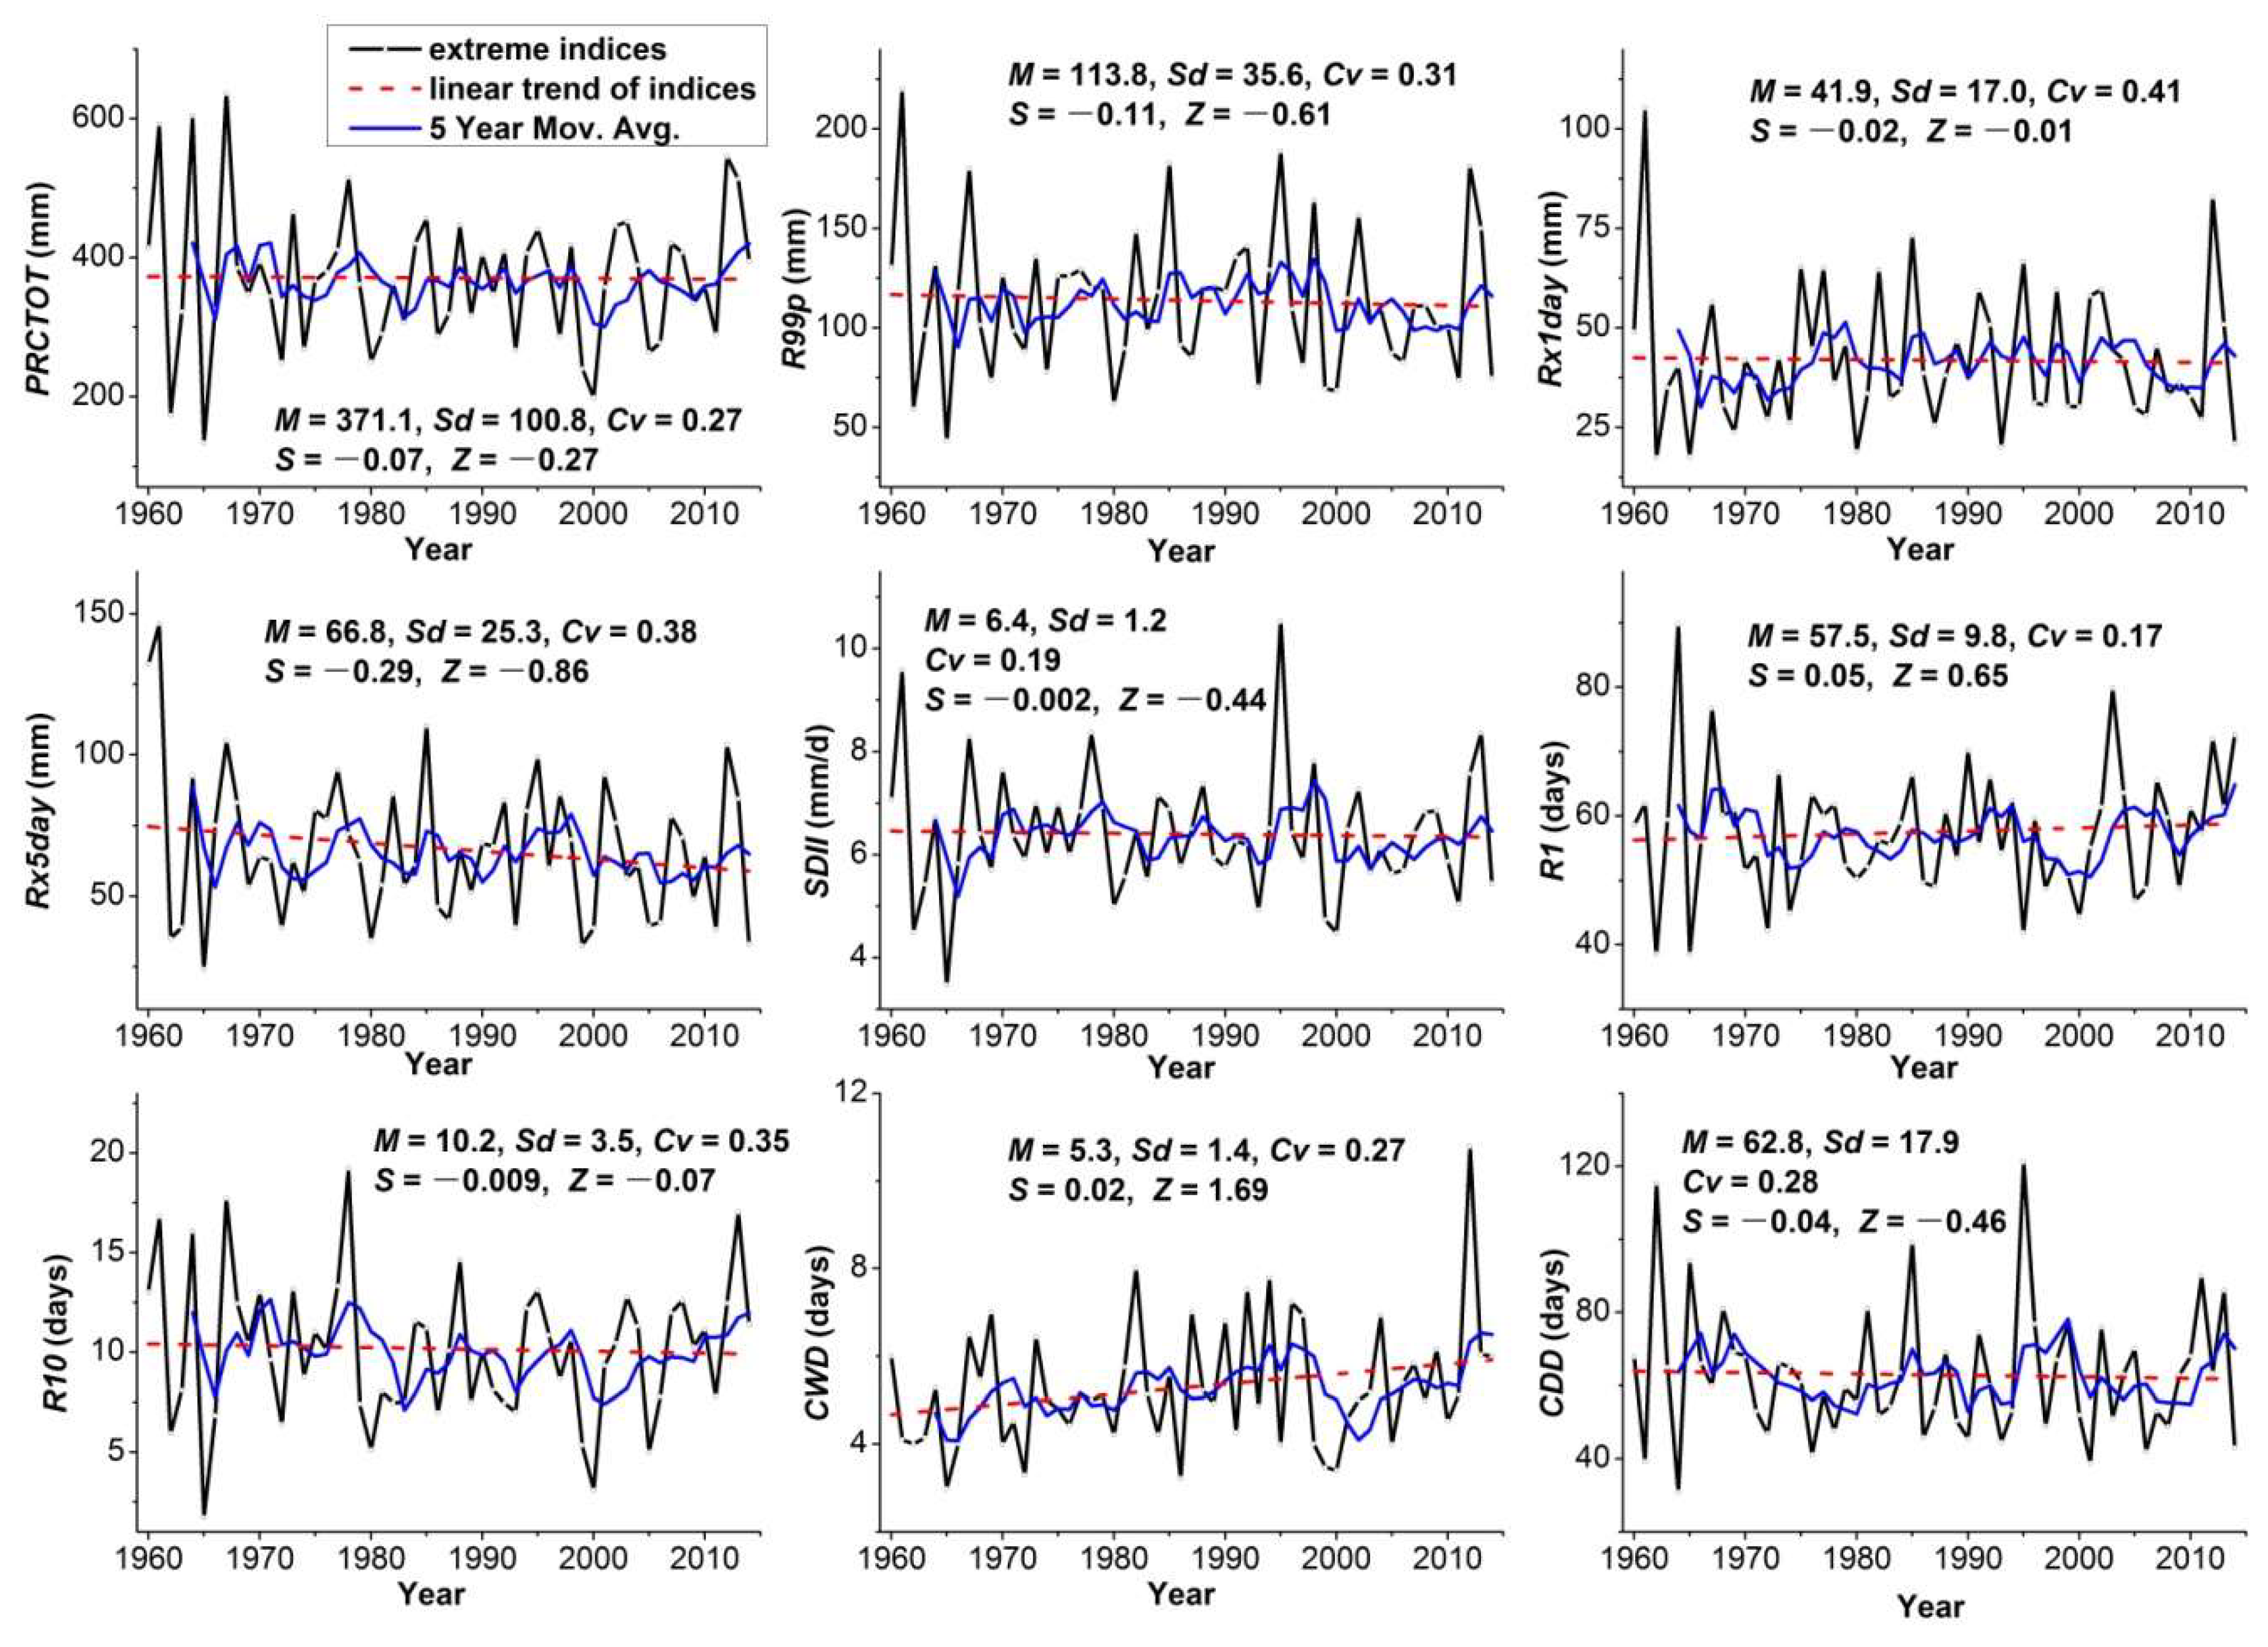
The temporal variations and basic statistical results of the nine extreme precipitation indices during 1960–2014 in the Hongjian Lake Basin (HJLB) are shown in Figure 2. Overall, all nine indices showed a large fluctuation, with the variation coefficient (Cv) ranging from 0.17 to 0.41. In the linear trends of the nine extreme indices, seven indices (i.e., PRCTOT, R99p, Rx1day, Rx5day, SDII, R10, CDD) had negative trends, and the other two indices (i.e., R1, CWD) had positive trends. Only the change trend of CWD was significant, indicated by the Mann–Kendall test’s Z statistic being greater than 1.64 at the significance level of p = 0.1. Specifically, the nine extreme precipitation indices in the HJLB had different statistical values (Figure 2). For example, the annual total wet-day precipitation (PRCTOT) varied from 134.0 mm to 635.9 mm, with a slight downward trend of −0.07 mm/year. The mean value (M), the standard deviation (Sd), and the variation coefficient (Cv) of PRCTOT were 371.1 mm, 100.8 mm, and 0.27, respectively. The maximum 5-day precipitation (Rx5day) ranged from 24.2 mm to 146.4 mm, with a downward trend of −0.29 mm/year. The mean value, the standard deviation, and the variation coefficient of Rx5day were 66.8 mm, 25.3 mm, and 0.38, respectively. For the simple daily intensity index (SDII), it had a range of 3.5–10.5 mm/day, and its mean value, standard deviation and variation coefficient were 6.4 mm/day, 1.2 mm/day, and 0.19, respectively.
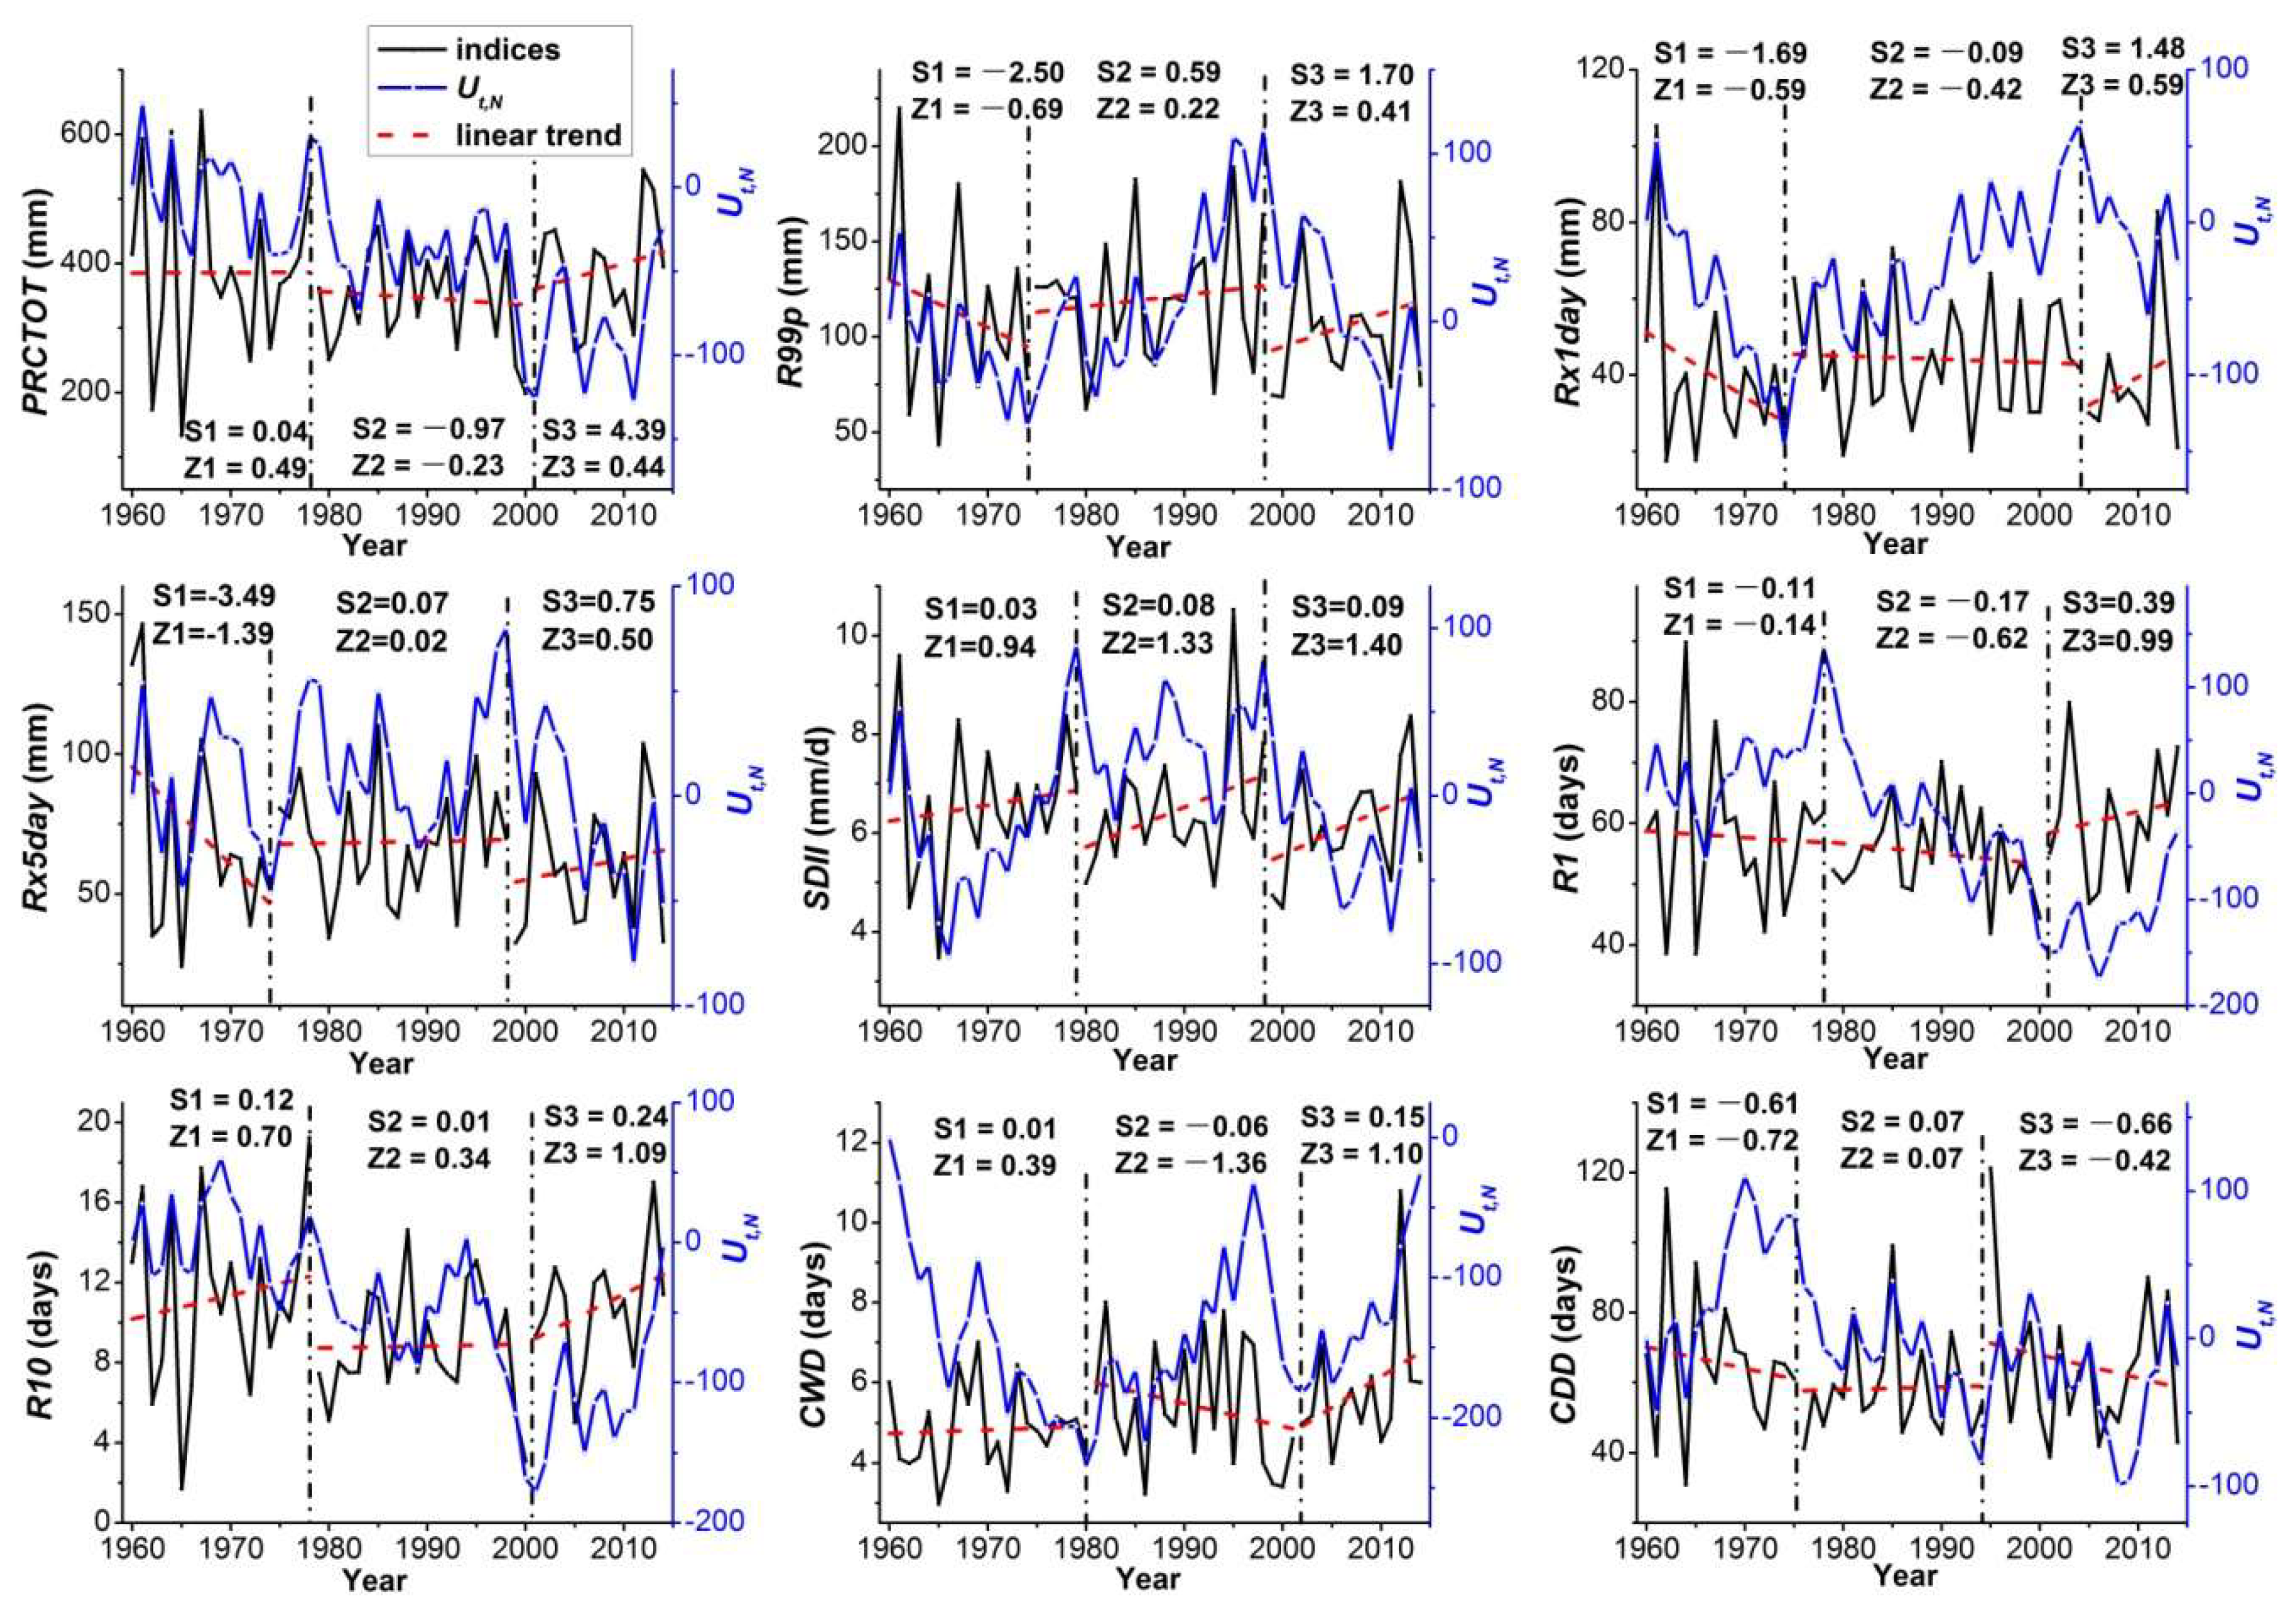
Figure 3 shows the three different change sub-periods of the nine extreme indices divided by the detected turning points. Although the nine indices had different turning points at different years, their variations could be divided into three sub-stages. Table 3 listed the corresponding basic statistical results in the three sub-periods. Taking the first sub-period as the benchmark, the percentage of relative change in the mean value in the second or third sub-periods (i.e., Rc2 or Rc3 in Table 3) ranged from −21.6% to 21.0%. Comparing the change directions of the mean value in the second and the third sub-periods of the nine indices, there were four kinds of combinations, namely downward–upward (PRCTOT, R1), downward–downward (Rx5day, SDII, R10, CDD), upward–downward (R99p, Rx1day), and upward–upward (CWD). For example, the mean value of PRCTOT in 1960–19789 was 386.0 mm, which declined to 346.7 mm in 1979–2000, and then rose to 389.4 mm in 2001–2014. The mean value of Rx5day in 1960–1974 was 71.0 mm, which declined to 68.7 mm in 1975–1998, and then continued to decline to 60.0 mm in 1999–2014. Comparing the fluctuations of the nine indices in the three sub-periods, the total variation coefficient (Cv) ranged from 0.13 to 0.52. The change range of Cv in the three sub-stages was 0.20–0.52, 0.13–0.33, and 0.15–0.43, respectively. Except for CWD with the largest variation coefficient (Cv) in the second sub-period, the other eight indices (PRCTOT, R99p, Rx1day, Rx5day, SDII, R1, R10, CDD) had the largest fluctuation with the largest values of Cv in the first sub-period. The five indices (R99p, Rx1day, Rx5day, R1, CDD) had the lowest Cv in the second sub-period, and the other three indices (PRCTOT, SDII, R10) had the lowest Cv in the third sub-period. The nine indices had clearly different linear slopes in the three sub-periods (i.e., S in Table 3). Generally, most indices had the largest linear slope in the third and first sub-periods, and the lowest S in the second sub-period.
3.2. Spatial Variation Characteristics of Extreme Precipitation Indices
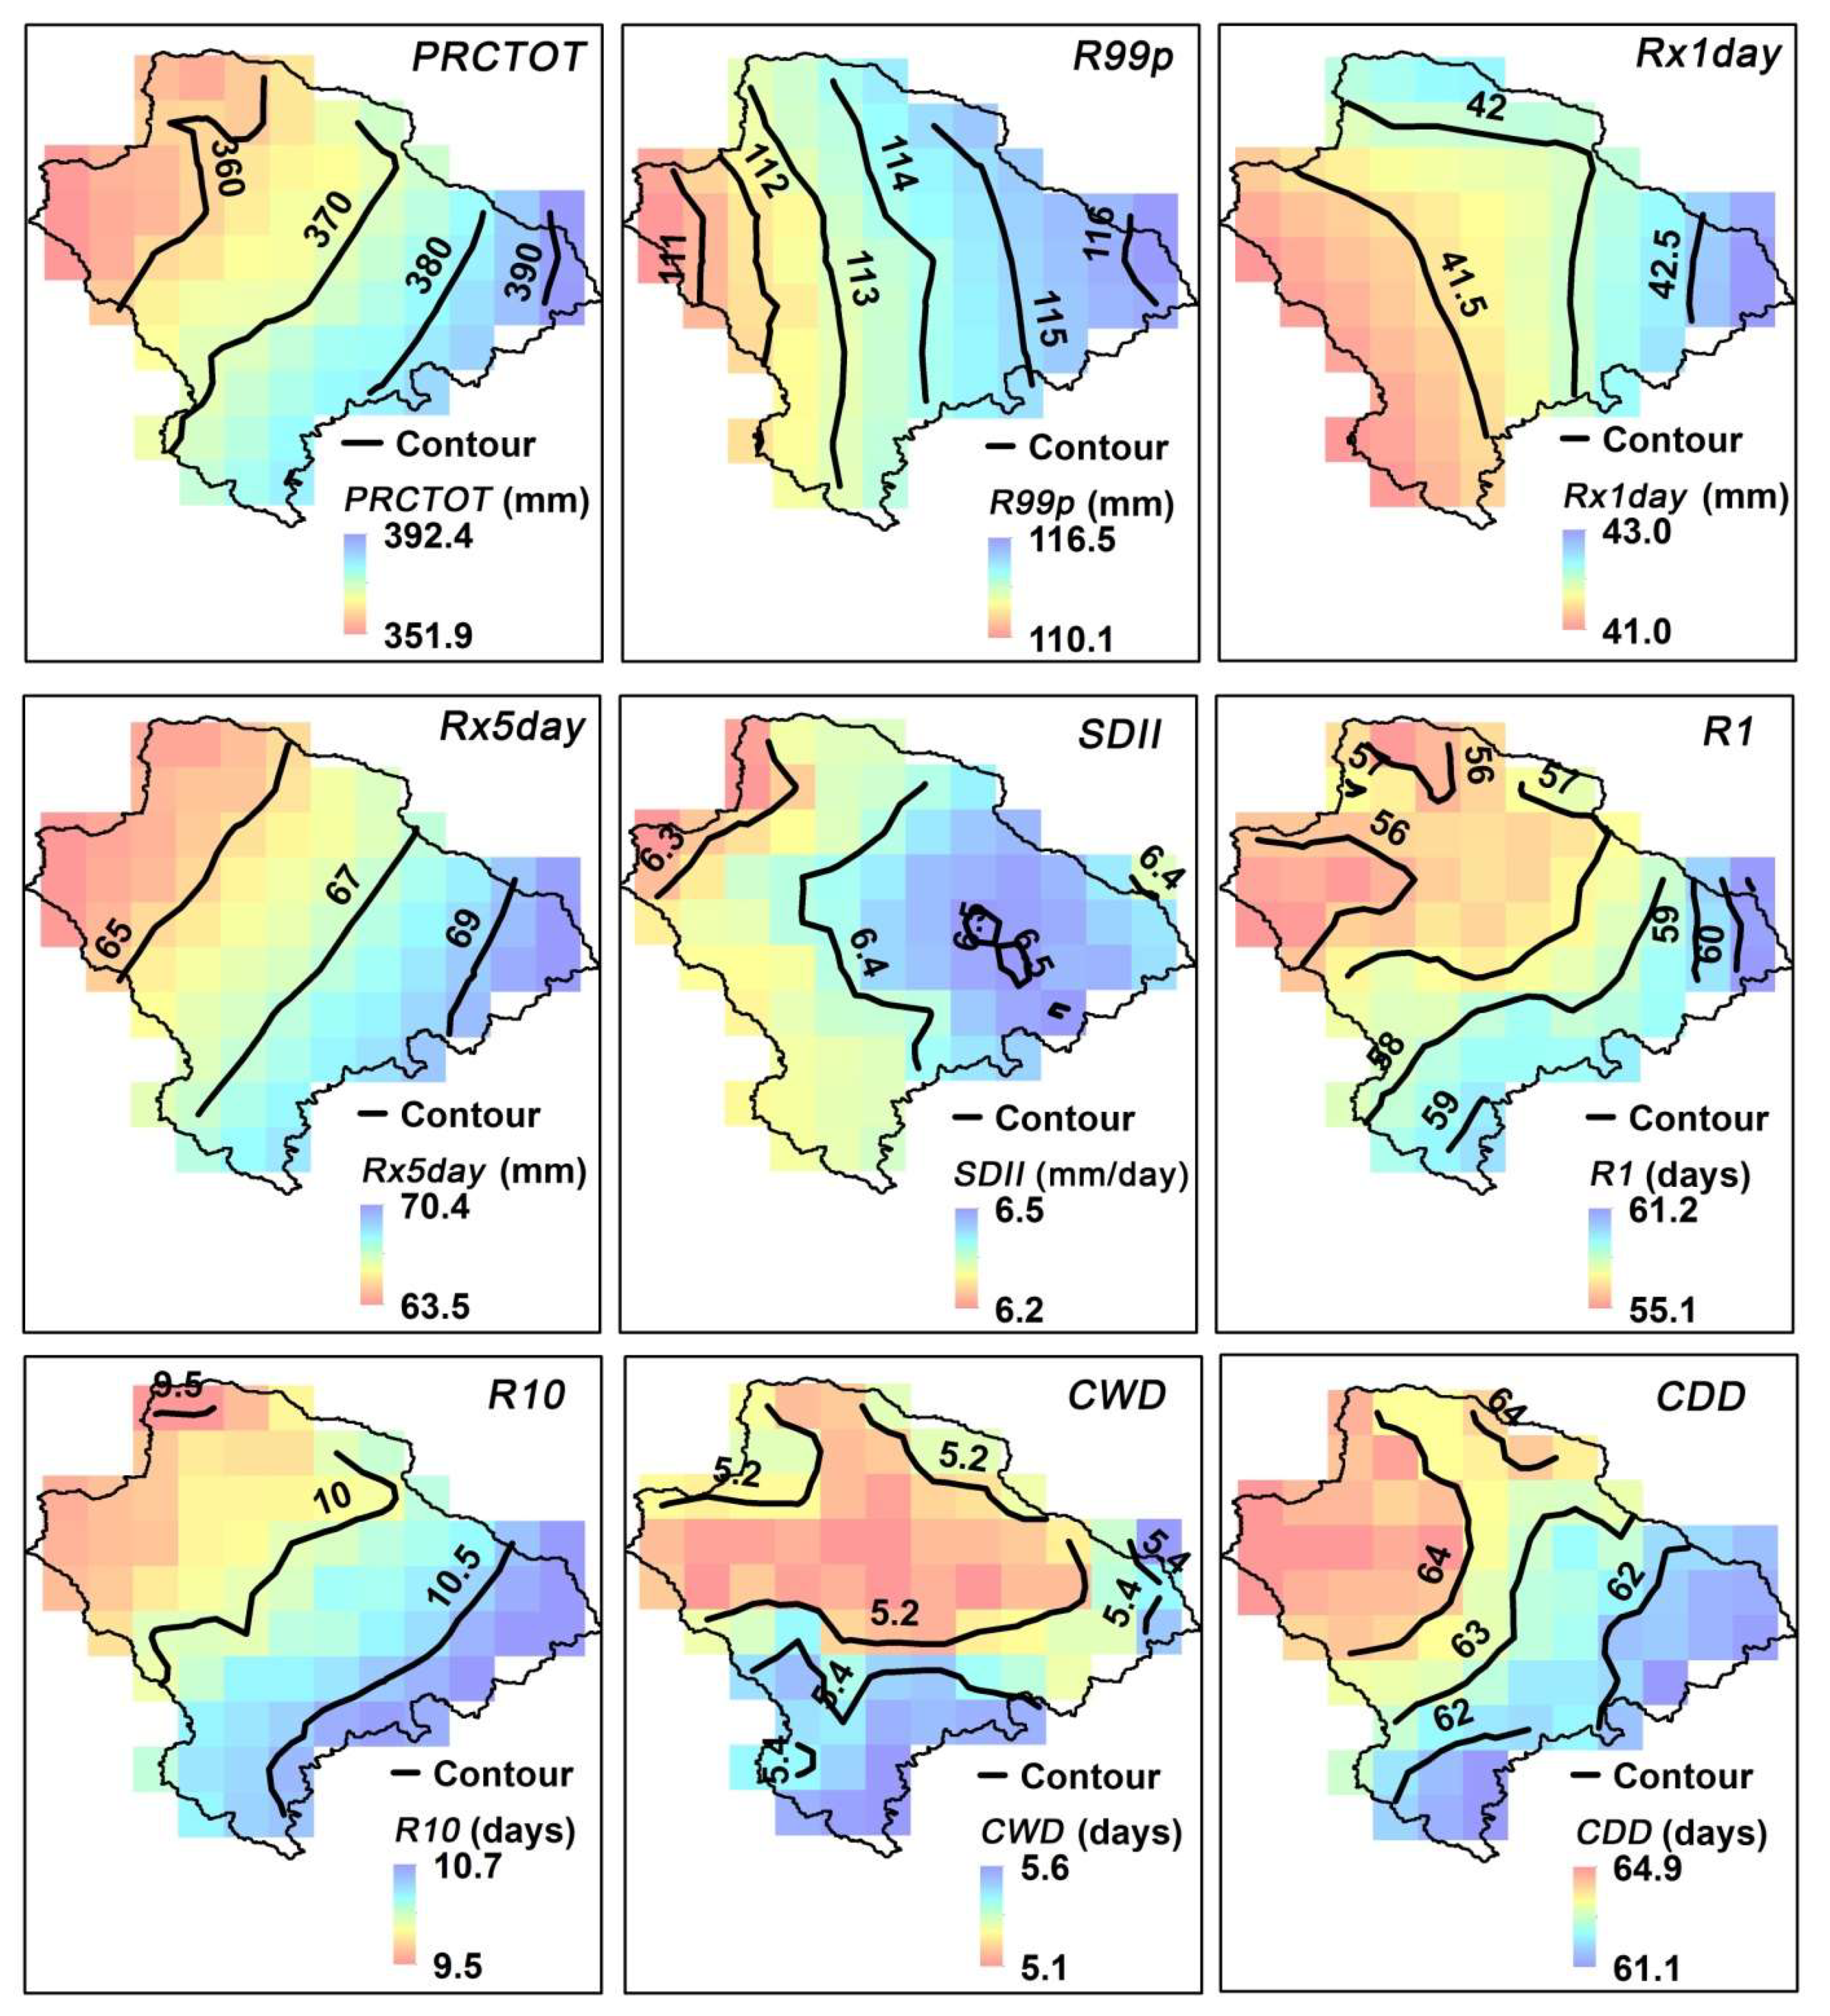
The spatial distribution of the nine extreme precipitation indices during 1960–2014 in the HJLB is shown in Figure 4. Except for the consecutive dry days (CDD), the other eight indices (PRCTOT, R99p, Rx1day, Rx5day, SDII, R1, R10, CWD) had similar spatial variation characteristics, namely, they increased from northwest to southeast. Meanwhile, the CDD had the opposite change direction, namely, they declined from northwest to southeast. In detail, as for the four quantity indices, the range of variations (i.e., minimum–maximum) in the PRCTOT, R99p, Rx1day, Rx5day was 351.9–392.4 mm, 110.1–116.5 mm, 41.0–43.0 mm, and 63.5–70.4 mm, respectively. For the intensity index, the SDII increased from 6.2 mm/day in the northwest to 6.5 mm/day in the southeast of the study area. For the four time indices, the min–max values of R1, R10, CWD, and CDD were 55.1–61.2 days, 9.5–10.7 days, 5.1–5.6 days, and 61.1–64.9 days, respectively.
3.3. Spatial Characteristics of Change Trends in Extreme Precipitation Indices
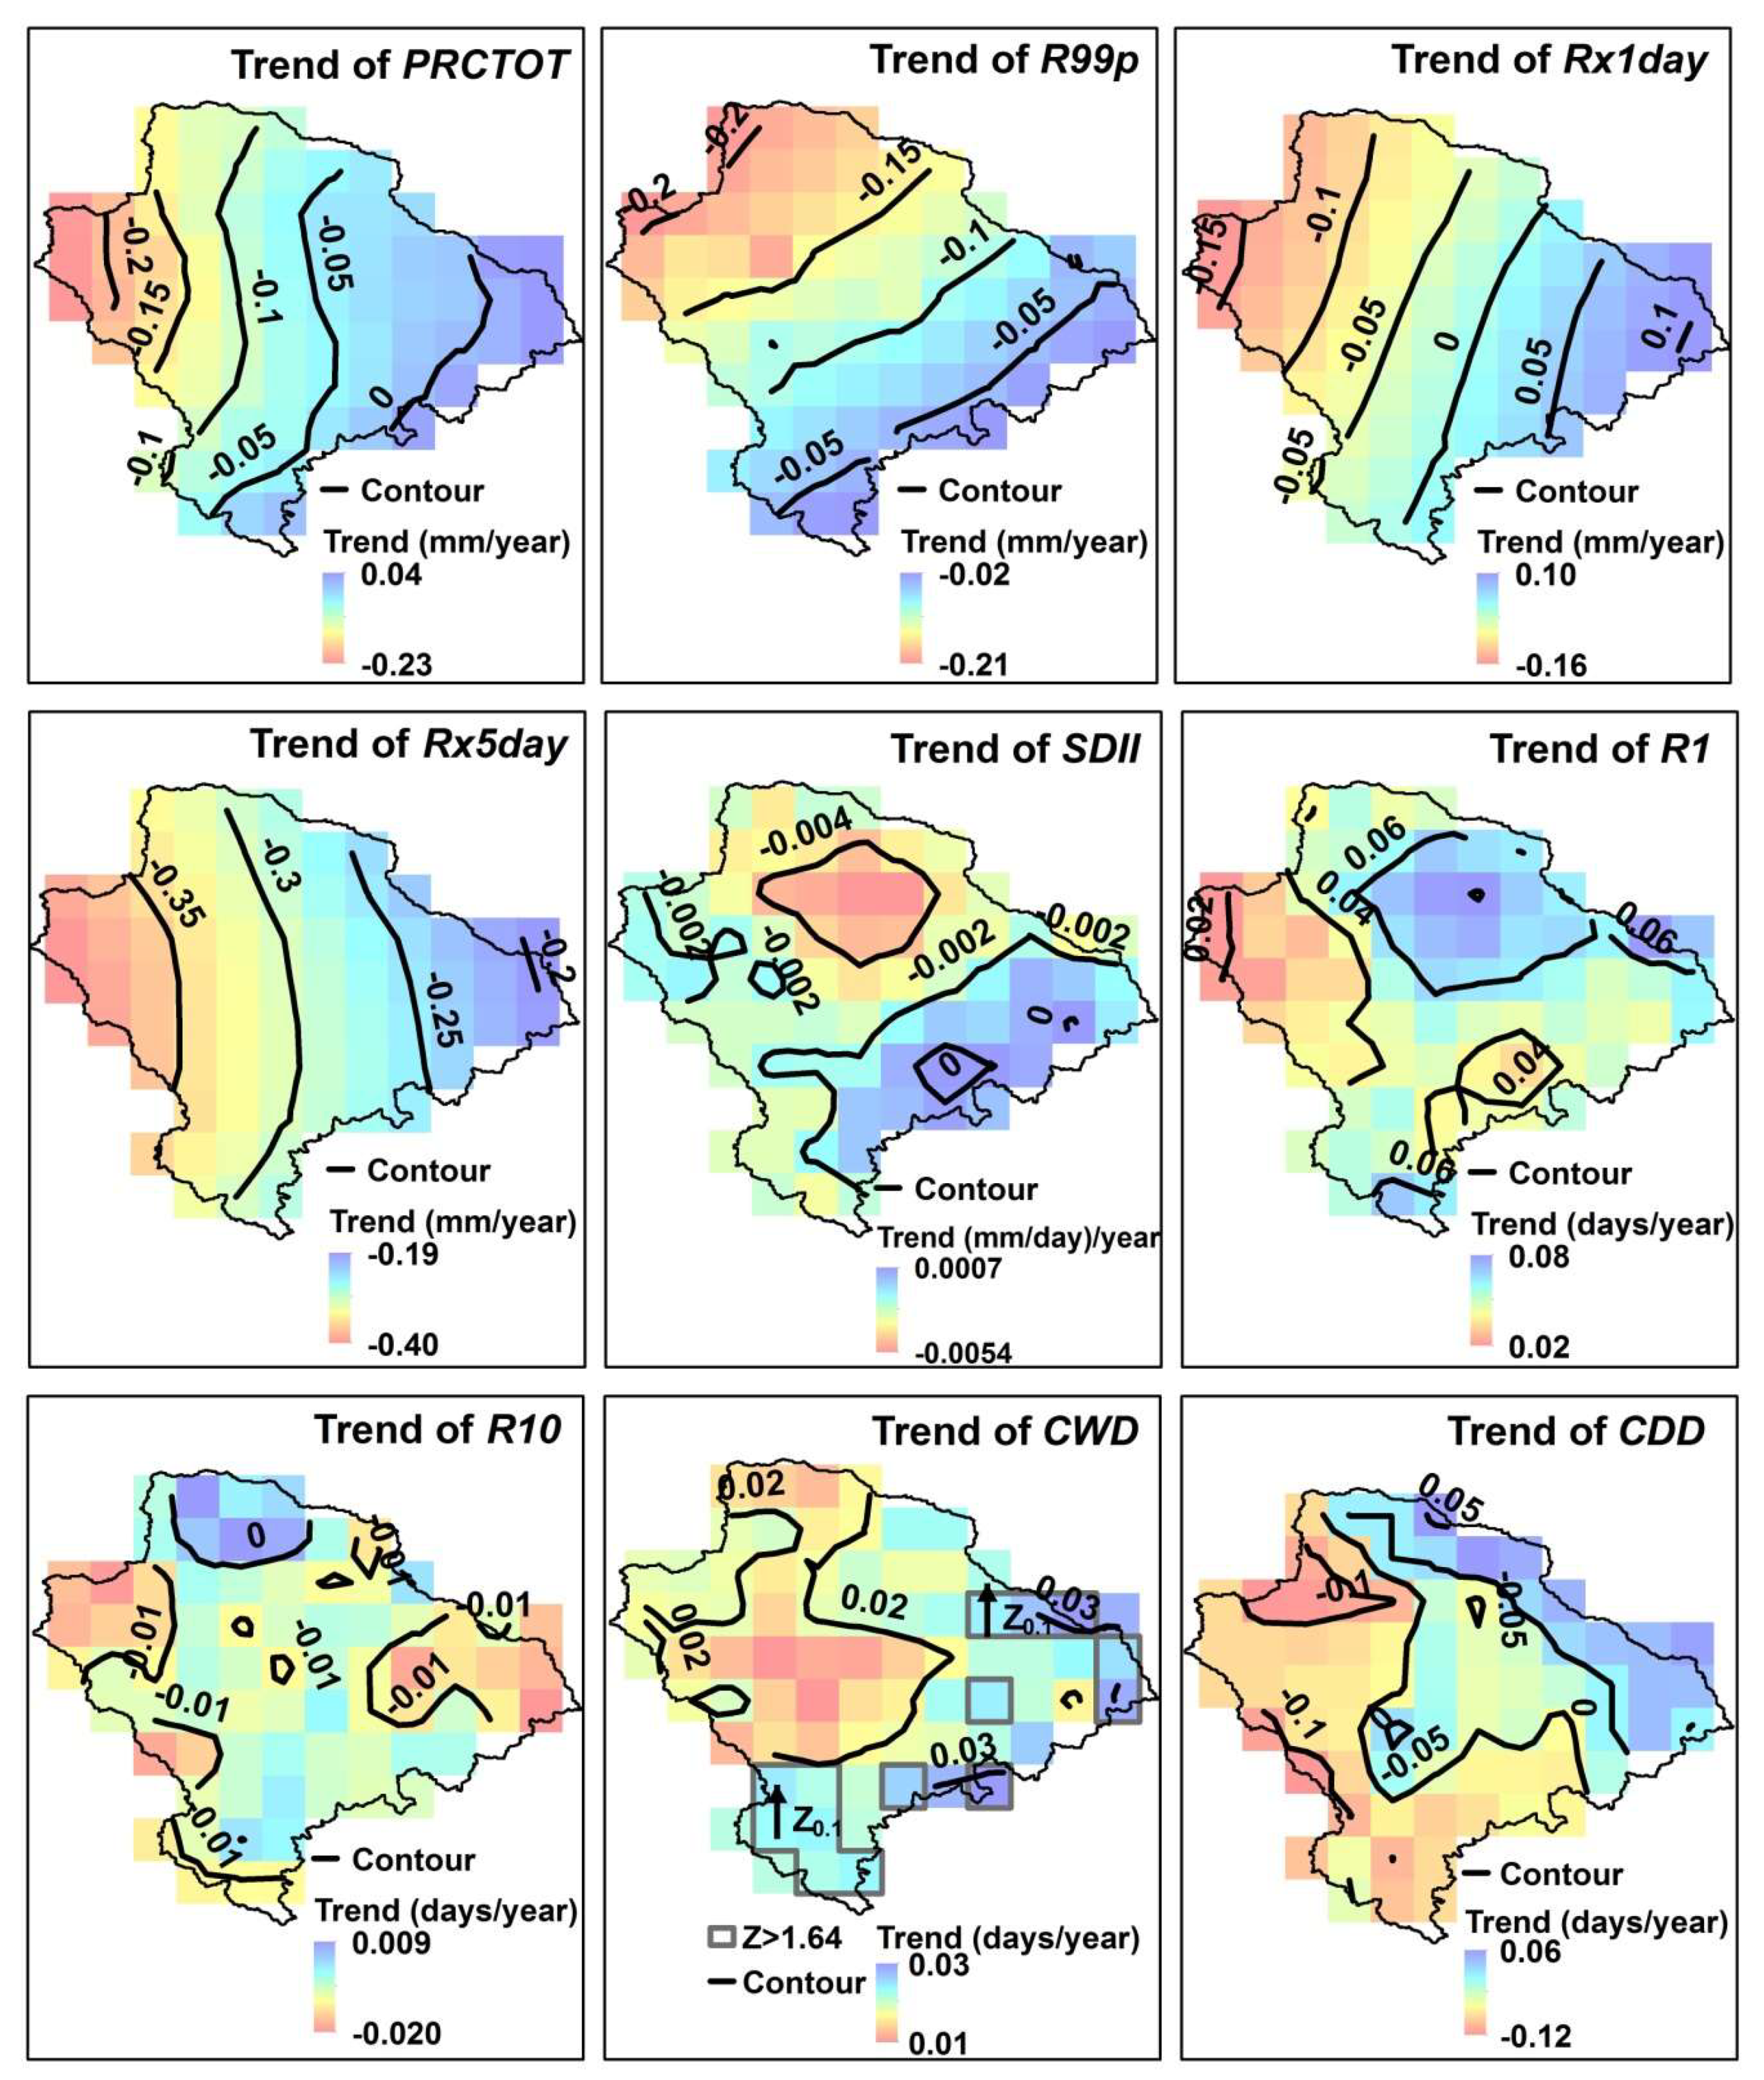
Figure 5 shows the spatial distribution of the change trends of the nine extreme precipitation indices during 1960–2014 in the HJLB. Table 4 shows the area and area ratio of positive trends and negative trends. The spatial variation in the change trends of indices was more complicated and variable than the spatial distribution of the indices themselves. Each index had different spatial trends with different area and area ratios, and the specific spatial locations of the highest and lowest values were also different. For example, the changing trend of PRCTOT ranged from −0.23 mm/year to 0.04 mm/year. The negative trend of PRCTOT was distributed over most regions, while the positive trend was located in the eastern regions (Figure 5). The area of negative trends and positive trends was 1507.53 km2 and 141.22 km2, accounting for 90.67% and 9.33% of the total area, respectively (Table 4). Trends of Rx5day were negative, ranging from −0.40 mm/year in the west region to −0.19 days/year in the eastern region. All the trends of R1 were positive, ranging from 0.02 days/year in the west region to 0.08 days/year in the north and northeast regions.
In addition, there was a difference in the significance of the spatial variation trend of each index, indicated by the value of the Mann–Kendall test’s Z statistic at a significance level of p = 0.1 (i.e., Z0.1 stands for the significant positive trends with the Z larger than 1.64). Only consecutive wet days (CWD) had significant positive change trend points or sub-regions in the south, southeast, and east regions (Figure 5). Although the spatial change trend of the remaining eight indices was different, the trend was not significant.
4. Discussion
4.1. Precipitation Extremes and Climatic Dry–Wet Regime Compared with Other Studies
Although there are few studies on precipitation extremes in our study area (HJLB), in the neighborhood or in some typical wider regions in China (e.g., Loess Plateau, Yellow River basin, the northwest arid region, and Tibetan Plateau), there are still some related studies that can be used for comparison regarding precipitation extremes indices, as recommended by the ETCCDI and widely used worldwide. Table 5 shows the trends of precipitation extremes from this study and other studies in some typical regions in China. As for the change trends of the same index, a large difference did exist in the magnitude, direction, and significance of trends in these different regions. These differences, to a large extent, could reveal the complexity and spatial-temporal differences of changes in precipitation extremes. The possible causes of these differences include data sources, data sequence length, regional size, regional climate and geographic conditions, regional spatial heterogeneity, and trend analysis methods. It is very meaningful to further analyze the differences and underlying mechanisms of precipitation extremes in different regions.
Furthermore, endorheic basins and related lakes are sensitive to climate change, responding rapidly to environmental changes [4,13]. Variations in the climatic dry–wet regime can directly affect the state of water deficit in these water-scarce endorheic basins. Therefore, it is necessary to conduct further discussions on the climatic dry–wet regime in the endorheic HJLB and adjacent regions. The nine selected extreme precipitation indices can be used to reflect the changes in the climatic dry–wet regime in the HJLB. The results of this study (Figure 2 and Figure 3, Table 3) show that, overall, the climate in the Hongjian Lake Basin during 1960–2014 developed toward aridification. The specific performance was that all four extreme precipitation quantity indices (PRCTOT, R99p, Rx1day, Rx5day) declined, and the extreme intensity index (SDII) also slightly decreased. Although the number of wet days (R1) and the consecutive wet days (CWD) slightly increased, the number of heavy precipitation days (R10) decreased. Some studies on annual precipitation and precipitation extremes in the neighborhood or a wider region, for example, Li et al. [59] used daily precipitation data during 1957–2007 at Shenmu meteorological station near to HJLB (i.e., the station labeled as number 10 in Figure 1) to analyze climate change, showing that the precipitation in the HJLB in the past 50 years experienced a slight increase and then decreased to become a relatively dry climate. Sun et al. [56] studied changes in precipitation extreme indices recommended by the ETCCDI in the Loess Plateau during 1960–2013, showing that the changes of the rapid warming and consecutive drying in the Loess Plateau is indicated by most extreme indices (exclude PRCTOT) (Table 5). Although there are differences relative to these findings, to some extent, it could reflect that the climate in HJLB and adjacent regions is overall changing towards aridification. However, when the climatic dry–wet variations was divided into the three sub-periods, it became more complicated and varied than that during the whole period of 1960–2014. Generally, most indices in the first sub-period were a wet high-oscillation phase with a relatively high mean value and having the largest variation coefficient. Compared with that in the first sub-period, the dry–wet state in the second and third sub-periods had four kinds of combinations, namely drier–driest (Rx5day, SDII, R10), wetter–drier (R99p, Rx1day), drier–wetter (PRCTOT, R1), and wetter–wettest (CWD, CDD). It could be seen that the climatic dry–wet changes of each index in the different three sub-periods demonstrated more inconsistency, and this inconsistency was masked in the overall trend. Therefore, special attention needs to be paid to the inconsistency of climate change in sub-phases.
4.2. Implications in the Study
As the main source of water resources and the key factor for the ecological environment in the closed HJLB, variations in precipitation and its extremes have some important implications for water resource management, ecological protection, and disaster prevention.
First, our results showed that the extreme precipitation indices fluctuated greatly over time, and heterogeneity was clear in the spatial distribution. The central Hongjian Lake’s four main seasonal recharging rivers are mainly distributed in the northwestern part of the closed basin (Figure 1), while the northwest region was the drier area of the basin, as indicated by these extreme indices. These obvious differences in time and space are very detrimental to the replenishment and effective use of precipitation. Second, the climate in the HJLB, as indicated by the nine extreme precipitation indices, became drier after the late 1970s and early 1980s, which means that the water resources in the HJLB have decreased. This overall drying climate will inevitably exacerbate the already existing water stress, which puts more stringent requirements and challenges on local water resources management. Third, the central Hongjian Lake in the HJLB plays an important role in protecting the biological and ecological environment. However, some studies [9,14] have revealed that the shrinkage of Hongjian Lake due to climate change and intensified human activities has seriously threatened the survival of rare species. How the gradual drying of the climate affects the water supply of lakes and the survival of the species is an important scientific issue that deserves further study. Lastly, our results revealed that although the climate was generally dry throughout the study period (1960–2014), when the linear trends of the indices were examined separately in the three sub-periods, it was found that: the index value in the third sub-period was smaller than that in the first sub-period, the linear change trends of the six indices in the third sub-period was greater than the value in the first sub-period, and the linear trends of most extreme indices (except for CDD) clearly increased in the third sub-period after the late 1990s (Figure 3 and Table 3); this means that the climate change trends were generally enhanced and have created humidification in the last 20 years. On the one hand, these kinds of climate change trends have a certain positive effect on the precipitation recharge into the endorheic basin, and on the other hand, it will increase the risk of potential rainstorm damage. There are still great risks and challenges for the extreme climate disaster prevention in the HJLB.
4.3. Uncertainty in this Study
First, there is a certain degree of uncertainty in the division of sub-periods of variations in the indices. The turning points were detected using the Pettitt test [52]. Some indices had the other possible turning points at the year 1966 (SDII in Figure 3) or year 2011 (PRCTOT, Rx5day in Figure 3); however, considering that the length of the sub-period should not be too short, we did not take the 1966 or 2011 years as turning points. The further combined use of multiple abrupt point detection methods, such as the cumulative anomaly method [9,60], will be more conducive to accurate detection of the actual turning point.
Second, due to the large fluctuation of the indices, only a linear trend was used to represent the overall trends of the extreme indices, which will cause a certain degree of uncertainty in the quantitative description of the trend size. Subsequent attempts will be made to more accurately quantify the fine trend of the index using a non-linear approach, such as polynomial fitting.
Lastly, the Hongjian Lake Basin (HJLB) is located in a sparsely populated region, lacking enough meteorological stations within the basin, which will cause a certain degree of fine mapping of the spatial distribution characteristics inside the study area. We suggest that it is necessary to add some rainfall stations inside the HJLB in the future.
5. Conclusions
In this study, we used the nine extreme precipitation indices recommended by the Expert Team on Climate Change Detection and Indices (ETCCDI) to quantify the spatio-temporal extreme climate changes during 1960–2014 in the endorheic Hongjian Lake Basin (HJLB), as well as investigate the corresponding climatic dry–wet regime. We found that, both in the whole period of 1960–2014 and in the three different sub-periods, all nine extreme precipitation indices (i.e., PRCTOT, R99p, Rx1day, Rx5day, SDII, R1, R10, CWD, and CDD) had different temporal variation characteristics, with a total fluctuation magnitude of 13%–52%. Most indices had a non-significant change trend, and only the CWD had a significant positive trend. The large fluctuation, the different change direction, and the magnitude of the change trends jointly demonstrated the complexity of precipitation extremes change in the HJLB. Eight indices (PRCTOT, R99p, Rx1day, Rx5day, SDII, R1, R10, CWD) had similar spatial distribution characteristics, namely, they increased from northwest to southeast, while the CDD had the opposite change direction. Each index had a different trend in some different regions with different areas and area ratios. The nine extreme indices revealed that the climate in the HJLB has become a drought since the early 1980s. This was specifically indicated by all four extreme precipitation quantity indices (PRCTOT, R99p, Rx1day, Rx5day) and the extreme intensity index (SDII) declining, as well as the number of heavy precipitation days (R10) decreasing. When the dry–wet variations disintegrated into the different sub-periods, the climatic dry–wet changes of each index demonstrated more inconsistency and complexity, but most indices in the first sub-period from 1960 to the late 1970s could be regarded as a wet high-oscillation phase, the second sub-period after the early 1980s belonged a relatively dry low-oscillation phase, and the third sub-period after the late 1990s or early 21st century was a dry medium-oscillation phase. However, it is worth noting that most extreme indices had an obvious positive linear trend in the third sub-period, which means that in the last 20 years, the precipitation extremes showed an increasing trend. This changing trend will not only have a certain effect on the precipitation recharge into the endorheic basin but also increase the risk of rainstorm disaster damage.
Funding
This research was funded by the Program for “Bingwei” Excellent Talents in Institute of Geographic Sciences and Natural Resources Research, the Chinese Academy of Sciences (2017RC204), and the Natural Science Foundation of China (41971035, 41501032).
Acknowledgments
Thanks to the Climate Data Center of the National Meteorological Information Center of the China Meteorological Administration for providing daily meteorological data. Thanks to Lu Liu and Peng Bai for their help with MATLAB programming. Thanks for the anonymous reviewers’ valuable comments and suggestions and the editor’s efforts in improving this article.
Conflicts of Interest
The author declares no conflict of interest. The funders had no role in the design of the study; in the collection, analyses, or interpretation of data; in the writing of the manuscript, nor in the decision to publish the results.
References
- Sawe, B.E. Fluvial Landforms: What Is an Endorheic Basin? Available online: https://www.worldatlas.com/articles/fluvial-landforms-what-is-an-endorheic-basin.html (accessed on 1 September 2019).
- Nichols, G. Endorheic basins. In Tectonics of Sedimentary Basins: Recent Advances; John Wiley & Sons: Hoboken, NJ, USA, 2011; pp. 621–632. [Google Scholar]
- Yapiyev, V.; Sagintayev, Z.; Inglezakis, V.; Samarkhanov, K.; Verhoef, A. Essentials of endorheic basins and lakes: A review in the context of current and future water resource management and mitigation activities in central Asia. Water 2017, 9, 798. [Google Scholar] [CrossRef]
- Wang, J.; Song, C.; Reager, J.T.; Yao, F.; Famiglietti, J.S.; Sheng, Y.; MacDonald, G.M.; Brun, F.; Schmied, H.M.; Marston, R.A.; et al. Recent global decline in endorheic basin water storages. Nat. Geosci. 2018, 11, 926–932. [Google Scholar] [CrossRef] [PubMed] [Green Version]
- Williamson, C.E.; Saros, J.E.; Vincent, W.F.; Smol, J.P. Lakes and reservoirs as sentinels, integrators, and regulators of climate change. Limnol. Oceanogr. 2009, 54, 2273–2282. [Google Scholar] [CrossRef]
- Wurtsbaugh, W.A.; Miller, C.; Null, S.E.; DeRose, R.J.; Wilcock, P.; Hahnenberger, M.; Howe, F.; Moore, J. Decline of the world’s saline lakes. Nat. Geosci. 2017, 10, 816. [Google Scholar] [CrossRef]
- Li, X.; Cheng, G.; Ge, Y.; Li, H.; Han, F.; Hu, X.; Tian, W.; Tian, Y.; Pan, X.; Nian, Y.; et al. Hydrological cycle in the Heihe river basin and its implication for water resource management in endorheic basins. J. Geophys. Res. Atmos. 2018, 123, 890–914. [Google Scholar] [CrossRef]
- Shen, Q.; Gao, G.; Lü, Y.; Wang, S.; Jiang, X.; Fu, B. River flow is critical for vegetation dynamics: Lessons from multi-scale analysis in a hyper-arid endorheic basin. Sci. Total Environ. 2017, 603, 290–298. [Google Scholar] [CrossRef]
- Yan, G.; Lou, H.; Liang, K.; Zhang, Z. Dynamics and driving forces of Bojiang lake area in Erdos Larus relictus national nature reserve, China. Quat. Int. 2018, 475, 16–27. [Google Scholar] [CrossRef]
- Varis, O.; Kummu, M. The major central Asian river basins: An assessment of vulnerability. Int. J. Water Resour. Dev. 2012, 28, 433–452. [Google Scholar] [CrossRef]
- Wang, H.; Chen, Y.; Chen, Z. Spatial distribution and temporal trends of mean precipitation and extremes in the arid region, northwest of China, during 1960–2010. Hydrol. Process. 2013, 27, 1807–1818. [Google Scholar] [CrossRef]
- Huang, J.; Tao, H.; Fischer, T.; Wang, X. Simulated and projected climate extremes in the Tarim river basin using the regional climate model cclm. Stoch. Environ. Res. Risk Assess. 2015, 29, 2061–2071. [Google Scholar] [CrossRef]
- Zhang, G.; Yao, T.; Shum, C.K.; Yi, S.; Yang, K.; Xie, H.; Feng, W.; Bolch, T.; Wang, L.; Behrangi, A. Lake volume and groundwater storage variations in Tibetan plateau’s endorheic basin. Geophys. Res. Lett. 2017, 44, 5550–5560. [Google Scholar] [CrossRef]
- Liang, K.; Yan, G. Application of landsat imagery to investigate lake area variations and relict gull habitat in Hongjian lake, Ordos plateau, China. Remote Sens. 2017, 9, 1019. [Google Scholar] [CrossRef]
- Pekel, J.-F.; Cottam, A.; Gorelick, N.; Belward, A.S. High-resolution mapping of global surface water and its long-term changes. Nature 2016, 540, 418. [Google Scholar] [CrossRef]
- Verpoorter, C.; Kutser, T.; Seekell, D.A.; Tranvik, L.J. A global inventory of lakes based on high-resolution satellite imagery. Geophys. Res. Lett. 2014, 41, 6396–6402. [Google Scholar] [CrossRef]
- Crétaux, J.F.; Jelinski, W.; Calmant, S.; Kouraev, A.; Vuglinski, V.; Bergé-Nguyen, M.; Gennero, M.C.; Nino, F.; Abarca Del Rio, R.; Cazenave, A.; et al. Sols: A lake database to monitor in the near real time water level and storage variations from remote sensing data. Adv. Space Res. 2011, 47, 1497–1507. [Google Scholar] [CrossRef]
- Yang, T.; Wang, C.; Chen, Y.; Chen, X.; Yu, Z. Climate change and water storage variability over an arid endorheic region. J. Hydrol. 2015, 529, 330–339. [Google Scholar] [CrossRef]
- Westra, S.; Alexander, L.V.; Zwiers, F.W. Global increasing trends in annual maximum daily precipitation. J. Clim. 2013, 26, 3904–3918. [Google Scholar] [CrossRef]
- Prein, A.F.; Rasmussen, R.M.; Ikeda, K.; Liu, C.; Clark, M.P.; Holland, G.J. The future intensification of hourly precipitation extremes. Nat. Clim. Chang. 2016, 7, 48–52. [Google Scholar] [CrossRef]
- Min, S.-K.; Zhang, X.; Zwiers, F.W.; Hegerl, G.C. Human contribution to more-intense precipitation extremes. Nature 2011, 470, 378–381. [Google Scholar] [CrossRef]
- Liang, K.; Liu, S.; Bai, P.; Nie, R. The Yellow River basin becomes wetter or drier? The case as indicated by mean precipitation and extremes during 1961–2012. Theor. Appl. Climatol. 2015, 119, 701–722. [Google Scholar] [CrossRef]
- Alexander, L.; Zhang, X.; Peterson, T.; Caesar, J.; Gleason, B.; Klein Tank, A.; Haylock, M.; Collins, D.; Trewin, B.; Rahimzadeh, F.; et al. Global observed changes in daily climate extremes of temperature and precipitation. J. Geophys. Res 2006, 111, 22. [Google Scholar] [CrossRef]
- Allan, R.P.; Soden, B.J. Atmospheric warming and the amplification of precipitation extremes. Science 2008, 321, 1481–1484. [Google Scholar] [CrossRef]
- Papalexiou, S.M.; Montanari, A. Global and regional increase of precipitation extremes under global warming. Water Resour. Res. 2019, 55, 4901–4914. [Google Scholar] [CrossRef]
- Peterson, T.C.; Manton, M.J. Monitoring changes in climate extremes: A tale of international collaboration. Bull. Am. Meteorol. Soc. 2008, 89, 1266–1271. [Google Scholar] [CrossRef]
- Choi, G.; Collins, D.; Ren, G.; Trewin, B.; Baldi, M.; Fukuda, Y.; Afzaal, M.; Pianmana, T.; Gomboluudev, P.; Huong, P.T.T.; et al. Changes in means and extreme events of temperature and precipitation in the Asia-Pacific network region, 1955–2007. Int. J. Climatol. 2009, 29, 1906–1925. [Google Scholar] [CrossRef]
- Donat, M.G.; Angélil, O.; Ukkola, A.M. Intensification of precipitation extremes in the world’s humid and water-limited regions. Environ. Res. Lett. 2019, 14, 065003. [Google Scholar] [CrossRef]
- Martel, J.-L.; Mailhot, A.; Brissette, F.; Caya, D. Role of natural climate variability in the detection of anthropogenic climate change signal for mean and extreme precipitation at local and regional scales. J. Clim. 2018, 31, 4241–4263. [Google Scholar] [CrossRef]
- Cheng, A.; Feng, Q.; Fu, G.; Zhang, J.; Li, Z.; Hu, M.; Wang, G. Recent changes in precipitation extremes in the Heihe river basin, northwest China. Adv. Atmos. Sci. 2015, 32, 1391–1406. [Google Scholar] [CrossRef]
- Simpson, I.R.; McCarthy, M.P. Structural and sampling uncertainty in observed UK daily precipitation extremes derived from an intercomparison of gridded data sets. Int. J. Climatol. 2019, 39, 128–142. [Google Scholar] [CrossRef]
- Zhang, X.; Hogg, W.; Mekis, É. Spatial and temporal characteristics of heavy precipitation events over Canada. J. Clim. 2001, 14, 1923–1936. [Google Scholar] [CrossRef]
- Zhai, P.; Zhang, X.; Wan, H.; Pan, X. Trends in total precipitation and frequency of daily precipitation extremes over China. J. Clim. 2005, 18, 1096–1108. [Google Scholar] [CrossRef]
- Zhou, B.; Wen, Q.H.; Xu, Y.; Song, L.; Zhang, X. Projected changes in temperature and precipitation extremes in China by the cmip5 multimodel ensembles. J. Clim. 2014, 27, 6591–6611. [Google Scholar] [CrossRef]
- You, Q.; Kang, S.; Aguilar, E.; Pepin, N.; Flügel, W.A.; Yan, Y.; Xu, Y.; Zhang, Y.; Huang, J. Changes in daily climate extremes in China and their connection to the large scale atmospheric circulation during 1961–2003. Clim. Dyn. 2011, 36, 2399–2417. [Google Scholar] [CrossRef]
- Fu, G.; Yu, J.; Yu, X.; Ouyang, R.; Zhang, Y.; Wang, P.; Liu, W.; Min, L. Temporal variation of extreme rainfall events in China, 1961–2009. J. Hydrol. 2013, 487, 48–59. [Google Scholar] [CrossRef]
- You, Q.; Kang, S.; Aguilar, E.; Yan, Y. Changes in daily climate extremes in the eastern and central Tibetan plateau during 1961–2005. J. Geophys. Res. Atmos 2008, 113. [Google Scholar] [CrossRef]
- Tan, L.; Zhang, H.; Zhang, R.; Luo, Z.; Li, X.; Liu, P. Study on the landscape pattern change of Hongjiannao watershed in northern Shaanxi province. J. Xi’an Jiaotong Univ. 2010, 44, 126–132. (In Chinese) [Google Scholar]
- Zhang, H.; Liu, P.; Li, X. Land use dynamic change of Hongjiannao watershed in northern Shaanxi province. Environ. Sci. Technol. 2011, 34, 180–183. (In Chinese) [Google Scholar]
- Tang, K.; Wang, H.; Liu, C. Preliminary study of Hongjiannao lake’s variation and ecological water demand. J. Nat. Resour. 2003, 18, 304–309. (In Chinese) [Google Scholar]
- Liang, K. Quantifying streamflow variations in ungauged lake basins by integrating remote sensing and water balance modelling: A case study of the Erdos Larus relictus national nature reserve, China. Remote Sens. 2017, 9, 588. [Google Scholar] [CrossRef]
- Hou, G.; Zhao, Z.; Wang, X.; Gong, B.; Yin, L. Formation mechanism of interior drainage areas and closed drainage areas of the Ordos plateau in the middle reaches of the Yellow River, China based on an analysis of the water cycle. Geol. Bull. China 2008, 27, 1107–1114. [Google Scholar]
- Hutchinson, M.F. Interpolating mean rainfall using thin plate smoothing splines. Int. J. Geogr. Inf. Syst. 1995, 9, 385–403. [Google Scholar] [CrossRef]
- Wahba, G. Spline Models for Observational Data; SIAM: Philadelphia, PA, USA, 1990; Volume 59. [Google Scholar]
- Hutchinson, M.F.; Xu, T. Anusplin Version 4.4 User Guide; Australian National University: Canberra, Australia, 2013. [Google Scholar]
- Karl, T.R.; Nicholls, N.; Ghazi, A. Clivar/gcos/wmo workshop on indices and indicators for climate extremes workshop summary. In Weather and Climate Extremes; Springer: Berlin/Heidelberg, Germany, 1999; pp. 3–7. [Google Scholar]
- Peterson, T.; Folland, C.; Gruza, G.; Hogg, W.; Mokssit, A.; Plummer, N. Report on the Activities of the Working Group on Climate Change Detection and Related Rapporteurs; World Meteorological Organization: Geneva, Switzerland, 2001. [Google Scholar]
- Kendall, M. Rank Correlation Measures; Charles Griffin: London, UK, 1975. [Google Scholar]
- Mann, H.B. Nonparametric tests against trend. Econom. J. Econom. Soc. 1945, 13, 245–259. [Google Scholar] [CrossRef]
- Belle, G.; Hughes, J.P. Nonparametric tests for trend in water quality. Water Resour. Res. 1984, 20, 127–136. [Google Scholar] [CrossRef]
- Liang, K.; Bai, P.; Li, J.; Liu, C. Variability of temperature extremes in the Yellow River basin during 1961–2011. Quat. Int. 2014, 336, 52–64. [Google Scholar] [CrossRef]
- Pettitt, A.N. A non-parametric approach to the change-point problem. J. R. Stat. Soc. 1979, 28, 126–135. [Google Scholar] [CrossRef]
- Barbero, R.; Fowler, H.J.; Lenderink, G.; Blenkinsop, S. Is the intensification of precipitation extremes with global warming better detected at hourly than daily resolutions? Geophys. Res. Lett. 2017, 44, 974–983. [Google Scholar] [CrossRef] [Green Version]
- Tan, X.; Gan, T.Y.; Shao, D. Effects of persistence and large-scale climate anomalies on trends and change points in extreme precipitation of Canada. J. Hydrol. 2017, 550, 453–465. [Google Scholar] [CrossRef]
- Yue, D.; Jiang, W.; He, B.; Zheng, C.; Kai, J. Change in intensity and frequency of extreme precipitation and its possible teleconnection with large-scale climate index over the China from 1960 to 2015. J. Geophys. Res. Atmos. 2018, 123. [Google Scholar]
- Sun, W.; Mu, X.; Song, X.; Dan, W.; Cheng, A.; Bing, Q. Changes in extreme temperature and precipitation events in the Loess plateau (China) during 1960–2013 under global warming. Atmos. Res. 2016, 168, 33–48. [Google Scholar] [CrossRef]
- Wang, B.; Zhang, M.; Wei, J.; Wang, S.; Li, S.; Ma, Q.; Li, X.; Pan, S. Changes in extreme events of temperature and precipitation over Xinjiang, northwest China, during 1960–2009. Quat. Int. 2013, 298, 141–151. [Google Scholar] [CrossRef]
- Wang, S.; Zhang, M.; Wang, B.; Sun, M.; Li, X. Recent changes in daily extremes of temperature and precipitation over the western Tibetan plateau, 1973–2011. Quat. Int. 2013, 313–314, 110–117. [Google Scholar] [CrossRef]
- Li, D.; Zhuo, J.; Wang, Z. Effect of human activities and climate change on the water surface area of Hongjiannao lake. J. Glaciol. Geocryol. 2009, 31, 1110–1115. (In Chinese) [Google Scholar]
- Liang, K. Comparative investigation on the decreased runoff between the water source and destination regions in the middle route of China’s south-to-north water diversion project. Stoch. Environ. Res. Risk Assess. 2018, 32, 369–384. [Google Scholar] [CrossRef]
Figure 1.
Locations of the Hongjian Lake Basin in China.

Figure 2.
Variations of the nine extreme precipitation indices in the Hongjian Lake Basin. M—mean value of indices, Sd—standard deviation, Cv—variation coefficient, S—slope of linear trend, and Z—Mann–Kendall test’s Z statistic.
Figure 2.
Variations of the nine extreme precipitation indices in the Hongjian Lake Basin. M—mean value of indices, Sd—standard deviation, Cv—variation coefficient, S—slope of linear trend, and Z—Mann–Kendall test’s Z statistic.

Figure 3.
Division of the three sub-periods and statistic Ut,n of the Pettitt test for the nine extreme precipitation indices in the Hongjian Lake Basin. S—slope of the linear trend, and Z—Mann-Kendall test’s statistic Z (the significance level of p = 0.1).
Figure 3.
Division of the three sub-periods and statistic Ut,n of the Pettitt test for the nine extreme precipitation indices in the Hongjian Lake Basin. S—slope of the linear trend, and Z—Mann-Kendall test’s statistic Z (the significance level of p = 0.1).

Figure 4.
Spatial distribution of the nine extreme precipitation indices in the Hongjian Lake Basin.
Figure 4.
Spatial distribution of the nine extreme precipitation indices in the Hongjian Lake Basin.

Figure 5.
Spatial distribution of the trends of the nine extreme precipitation indices in the Hongjian Lake Basin (the grid points or sub-region labeled Z0.1 represent significantly positive trends at a significance level of p = 0.1, see in trend of CWD).
Figure 5.
Spatial distribution of the trends of the nine extreme precipitation indices in the Hongjian Lake Basin (the grid points or sub-region labeled Z0.1 represent significantly positive trends at a significance level of p = 0.1, see in trend of CWD).


Table 1.
Basic information on the 10 national weather stations around the Hongjian Lake basin.
| Serial Number * | Station Number | Station Name | North Latitude | East Longitude | Elevation (m a.s.l.) | Start Year |
|---|---|---|---|---|---|---|
| 1 | 53533 | Hangjinqi | 39.85 | 108.73 | 1389.5 | 1958 |
| 2 | 53543 | Dongsheng | 39.83 | 109.98 | 1461.9 | 1956 |
| 3 | 53545 | Yijinhuoluoqi | 39.57 | 109.72 | 1367.0 | 1958 |
| 4 | 53547 | Wushenzhao | 39.10 | 109.03 | 1312.2 | 1958 |
| 5 | 53553 | Zhungeerqi | 39.87 | 111.22 | 1221.4 | 1958 |
| 6 | 53564 | Hequ | 39.38 | 111.15 | 861.5 | 1954 |
| 7 | 53567 | Fugu | 39.03 | 111.08 | 981.0 | 1959 |
| 8 | 53644 | Wushenqi | 38.60 | 108.83 | 1307.2 | 1959 |
| 9 | 53646 | Yulin | 38.27 | 109.78 | 1157.0 | 1951 |
| 10 | 53651 | Shenmu | 38.82 | 110.43 | 941.1 | 1956 |
* The stations are labeled by serial number in Figure 1.
Table 2.
Definition of nine extreme precipitation indices used in the Hongjian Lake Basin (PRCP is the daily precipitation amount).
Table 2.
Definition of nine extreme precipitation indices used in the Hongjian Lake Basin (PRCP is the daily precipitation amount).
| Class | Index | Descriptive Name | Definition | Units |
|---|---|---|---|---|
| Quantity indices | PRCTOT | Annual total wet-day precipitation | Annual total PRCP in wet days (PRCP ≥ 1 mm) | mm |
| R99p | Extremely wet days’ precipitation | Annual total PRCP when PRCP > 99th percentile | mm | |
| Rx1day | Max 1-day precipitation amount | Monthly maximum 1-day precipitation | mm | |
| Rx5day | Max 5-day precipitation amount | Monthly maximum consecutive 5-day precipitation | mm | |
| Intensity index | SDII | Simple daily intensity index | Annual total precipitation divided by the number of wet days (PRCP ≥ 1.0 mm) in the year | mm/day |
| Time indices | R1 | Number of wet days | Annual count of days when PRCP ≥ 1.0 mm | days |
| R10 | Number of heavy precipitation days | Annual count of days when PRCP ≥ 10 mm | days | |
| CWD | Consecutive wet days | Maximum number of consecutive days with PRCP ≥ 1 mm | days | |
| CDD | Consecutive dry days | Maximum number of consecutive days with PRCP < 1 mm | days |
Table 3.
Basic statistical results of the nine extreme precipitation indices in the different three sub-periods in the HJLB.
Table 3.
Basic statistical results of the nine extreme precipitation indices in the different three sub-periods in the HJLB.
| Index | Sub-Period 1 | Sub-Period 2 | Sub-Period 3 | ||||||||||||||
|---|---|---|---|---|---|---|---|---|---|---|---|---|---|---|---|---|---|
| Y1 | M1 | Sd1 | Cv1 | S1 | Y2 | M2 | Sd2 | Cv2 | S2 | Rc2 | Y3 | M3 | Sd3 | Cv3 | S3 | RC3 | |
| PRCTOT | 1960–1978 | 386.0 | 131.7 | 0.34 | 0.04 | 1979–2000 | 346.7 | 72.6 | 0.21 | −0.97 | −10.2% | 2001–2014 | 389.4 | 80.7 | 0.20 | 4.39 | 0.9% |
| R99p | 1960–1974 | 112.3 | 43.9 | 0.39 | −2.50 | 1975–1998 | 119.9 | 31.0 | 0.26 | 0.59 | 6.7% | 1999–2014 | 106.0 | 31.6 | 0.30 | 1.70 | −5.6% |
| Rx1day | 1960–1974 | 39.3 | 20.6 | 0.52 | −1.69 | 1975–2004 | 44.2 | 14.6 | 0.33 | −0.09 | 12.4% | 2005–2014 | 38.8 | 16.9 | 0.43 | 1.48 | −1.4% |
| Rx5day | 1960–1974 | 71.0 | 34.3 | 0.48 | −3.49 | 1975–1998 | 68.7 | 19.1 | 0.28 | 0.07 | −3.3% | 1999–2014 | 60.0 | 21.8 | 0.36 | 0.75 | −15.4% |
| SDII | 1960–1979 | 6.6 | 1.3 | 0.20 | 0.03 | 1980–1998 | 6.4 | 1.2 | 0.19 | 0.08 | −1.6% | 1999–2014 | 6.2 | 1.0 | 0.17 | 0.09 | −6.0% |
| R1 | 1960–1978 | 57.8 | 12.1 | 0.21 | −0.11 | 1979–2000 | 55.1 | 6.9 | 0.13 | −0.17 | −4.7% | 2001–2014 | 61.0 | 9.2 | 0.15 | 0.39 | 5.6% |
| R10 | 1960–1978 | 11.2 | 4.3 | 0.39 | 0.12 | 1979–2000 | 8.8 | 2.7 | 0.31 | 0.01 | −21.6% | 2001–2014 | 10.8 | 2.7 | 0.25 | 0.24 | −3.9% |
| CWD | 1960–1980 | 4.8 | 1.0 | 0.21 | 0.01 | 1981–2001 | 5.4 | 1.5 | 0.28 | −0.06 | 12.4% | 2002–2014 | 5.8 | 1.6 | 0.27 | 0.15 | 21.0% |
| CDD | 1960–1975 | 65.6 | 19.3 | 0.30 | −0.61 | 1976–1994 | 58.3 | 13.9 | 0.24 | 0.07 | −11.0% | 1995–2014 | 64.9 | 19.2 | 0.30 | −0.66 | −0.9% |
Note: Y—the years of sub-period, M—mean value, Sd—standard deviation, Cv—variation coefficient (Cv = Sd/M), S—slope of linear trend, Rc—percentage of relative change in the mean value in the second and third sub-periods (Rc2 = (M2 − M1)/M1 × 100, Rc3 = (M3 − M1)/M1 × 100). The units of M and Sd are mm for PRCTOT, R99p, Rx1day, and Rx5day; mm/day for SDII; and days for R1, R10, CWD, and CDD.
Table 4.
Area of positive and negative change trend of the nine extreme precipitation indices during 1960–2014 in the HJLB.
Table 4.
Area of positive and negative change trend of the nine extreme precipitation indices during 1960–2014 in the HJLB.
| Class | Index | Range of Trend | Area of Positive Trend (km2) | Area Ratio of Positive Trend (%) | Area of Negative Trend (km2) | Area Ratio of Negative Trend (%) |
|---|---|---|---|---|---|---|
| Quantity indices | PRCTOT | −0.23 to 0.04 mm/year | 141.22 | 9.33 | 1507.53 | 90.67 |
| R99p | −0.21 to −0.02 mm/year | 0.00 | 0.00 | 1513.10 | 100.00 | |
| Rx1day | −0.16 to 0.10 mm/year | 504.37 | 33.33 | 1008.73 | 66.67 | |
| Rx5day | −0.40 to −0.19 mm/year | 0.00 | 0.00 | 1513.10 | 100.00 | |
| Intensity index | SDII | −0.0054 to 0.0007 (mm day−1)/year | 60.52 | 4.00 | 1452.58 | 96.00 |
| Time indices | R1 | 0.02 to 0.08 days/year | 1513.10 | 100.00 | 0.00 | 0.00 |
| R10 | −0.02 to 0.01 days/year | 121.05 | 8.00 | 1392.05 | 92.00 | |
| CWD | 0.01 to 0.03 days/year | 1513.10 | 100.00 | 0.00 | 0.00 | |
| CDD | −0.12 to 0.06 days/year | 342.97 | 22.67 | 1170.13 | 77.33 |
Table 5.
Trends of precipitation extremes from this study and other studies in some typical regions in China *.
Table 5.
Trends of precipitation extremes from this study and other studies in some typical regions in China *.
| Index | This Study | China | North China (Loess Plateau) | North China (Yellow River Basin) | Northwest China (Xinjiang) | Northwest China (Arid Region) | Western China (Western Tibetan Plateau) | Western China (Middle and Eastern Tibetan Plateau) |
|---|---|---|---|---|---|---|---|---|
| PRCTOT | −0.73 | 3.21 | 1.50 | −8.70 | - | 6.82 | 0.47 | 6.66 |
| R99p | −1.08 | - | −0.10 | 0.16 | 3.26 | - | 0.41 | 0.17 |
| Rx1day | −0.22 | 1.37 | - | −0.14 | 0.79 | 0.63 | 0.37 | 0.27 |
| Rx5day | −2.91 | 1.90 | −0.42 | −0.29 | 0.85 | 0.98 | 1.25 | −0.08 |
| SDII | −0.02 | 0.06 | −0.14 | −0.02 | 0.04 | 0.05 | −0.01 | 0.03 |
| R1 | 0.47 | - | - | - | 1.12 | - | - | - |
| R10 | −0.09 | - | - | −0.19 | 0.20 | 0.22 | −0.06 | 0.23 |
| CWD | 0.23 | - | −0.05 | −0.78 | 0.05 | 0.05 | 0.17 | −0.07 |
| CDD | −0.40 | −1.22 | 1.96 | 1.50 | −0.02 | −4.85 | −0.52 | −4.64 |
* Notes: Trends are unified into a decade scale (i.e., in units per decade). Values for trends marked in bold are statistically significant at the 0.05 level. Data sources and time period: Loess Plateau during 1960–2013 [56], Yellow River basin during 1961–2013 [22], Xinjiang during 1960–2009 [57], arid region in northwest China during 1960–2010 [11], western Tibetan Plateau during 1973–2011 [58], and middle and eastern Tibetan Plateau during 1961–2005 [37].
© 2019 by the author. Licensee MDPI, Basel, Switzerland. This article is an open access article distributed under the terms and conditions of the Creative Commons Attribution (CC BY) license (http://creativecommons.org/licenses/by/4.0/).
Share and Cite
MDPI and ACS Style
Liang, K. Spatio-Temporal Variations in Precipitation Extremes in the Endorheic Hongjian Lake Basin in the Ordos Plateau, China. Water 2019, 11, 1981. https://doi.org/10.3390/w11101981
AMA Style
Liang K. Spatio-Temporal Variations in Precipitation Extremes in the Endorheic Hongjian Lake Basin in the Ordos Plateau, China. Water. 2019; 11(10):1981. https://doi.org/10.3390/w11101981
Chicago/Turabian StyleLiang, Kang. 2019. "Spatio-Temporal Variations in Precipitation Extremes in the Endorheic Hongjian Lake Basin in the Ordos Plateau, China" Water 11, no. 10: 1981. https://doi.org/10.3390/w11101981
Note that from the first issue of 2016, this journal uses article numbers instead of page numbers. See further details here.