Does Rural Water System Design Matter? A Study of Productive Use of Water in Rural Nepal


1
School of Public and International Affairs, Virginia Tech, Blacksburg, VA 24061, USA
2
Department of Statistics, Virginia Tech, Blacksburg, VA 24061, USA
*
Author to whom correspondence should be addressed.
Water 2019, 11(10), 1978; https://doi.org/10.3390/w11101978
Submission received: 26 August 2019
/
Revised: 14 September 2019
/
Accepted: 18 September 2019
/
Published: 23 September 2019
(This article belongs to the Special Issue Present and Future of Drinking Water Supplies in Low-Income Regions)
Abstract
:In Nepal, rural water systems (RWS) are classified by practitioners as single-use domestic water systems (SUS) or multiple-use water systems (MUS). In the rural hills of Nepal, subsistence farming communities typically use RWS to support income-generating productive activities that can enhance rural livelihoods. However, there is limited research on the extent of existing productive activity and the factors enabling these activities. This paper examines the extent of water-related productive activities and the factors driving these activities based on a study, undertaken between October 2017 to June 2018, of 202 households served from five single-use domestic water systems and five multiple use water systems in the mid-hills of Nepal. The research found that a majority (94%) of these households engaged in two or more productive activities including growing vegetables and horticulture crops, raising livestock, and producing biogas and Rakshi (locally-produced alcohol), regardless of the system design, i.e., SUS vs. MUS. Around 90% of the households were engaged in productive activities that contributed to over 10% of their mean annual household income ($4,375). Since the SUS vs. MUS classification was not found to be a significant determinant of the extent of productive activity, the households were reclassified as having high or low levels of productive activity based on the quantity of water used for these activities and the associated earned income. A multinomial logistic regression model was developed to measure the relative significance of various predictors of high productive activity households. Five dominant predictors were identified: households that farm as a primary occupation, use productive technologies, are motivated to pursue productive activities, have received water-related productive activity training, and have received external support related to productive activities. Whereas MUS are designed for productive activity, nearly every household in SUS communities was involved in productive activities making them ‘de-facto’ MUS. These results challenge the current approach to rural water provision that views SUS and MUS as functionally different services.
1. Introduction
Water, as a basic human right, is typically supplied in rural areas in developing countries through traditional domestic water systems that meet basic household needs for drinking, washing, cooking, and bathing. However, a growing number of studies show that people in rural communities are using these domestic water systems to support a wide range of productive activities usually located in or around the household [1,2,3,4,5]. These productive uses include a range of small-scale activities that enable people to grow crops and vegetables, raise livestock, and engage in a variety of informal small-scale enterprises [6,7]. Productive activities play an important role in livelihoods by making a significant contribution to household income, food security, improved nutrition, and health [4,8,9,10]. In response to the growing evidence on how rural households use water, an international multiple-use water services (MUS) group with membership from over twenty-two developing countries was created to promote water systems that accommodate and support productive homestead-scale enterprises [11,12].
A central finding from research focused on how rural communities use water is that their water infrastructure is in reality a form of ‘de facto’ MUS, regardless of its original design. A water abundant source is often used to meet people’s multiple water needs [13]. When communities have limited access to water, possibly relying on an inadequate water source, they usually look for alternative sources to be used either in combination with or separately from an existing source. A variety of technologies and practices are available to make water available in rural areas. For example, in Zimbabwe, boreholes with handpumps have been used for domestic use, livestock, and community gardens; in Ethiopia, ponds have been used for irrigation, livestock, and domestic uses; in Bolivia, groundwater-fed distribution networks provide services for domestic use and livestock production; in Nepal, gravity-fed piped water systems provide water for domestic use and irrigation; and in Colombia, communal surface water is piped to households for domestic uses, the irrigation of gardens, cattle production, and agricultural processing [14,15].
Similar to other developing countries, small-scale productive activities in Nepal are a critical part of rural livelihoods. In rural communities, separate systems to serve productive uses such as irrigating crops on small plots near households (bari lands) are rarely available. Rural water systems (RWS) have been widely used for multiple uses around homesteads in the hills of Nepal, whether they are designed for single-use domestic water supply or dual-use (domestic and irrigation) [16]. However, the productive use of water from RWS often remains unrecognised [1] in poverty alleviation programmes, international development goals [17,18], and government policies [11].
Access to water in rural areas has been rapidly improving over the past few years. In early 2000, International Development Enterprises (iDE) and its local partners pioneered multiple-use water systems in Nepal with the aim of providing water for domestic use and the irrigation of high-value vegetables [4,19]. In view of the current practice of rural water services development in Nepal, RWS is generally classified as “by design SUS” or “by design MUS” [20]. The SUS design provides 45 litres per capita per day (LPCD) for domestic use. The MUS design provides year-round water based on the standard of 45 LPCD for domestic use and 400–600 litres/household/day (LPD) for vegetables grown near the homestead [10,21,22]. SUS and MUS designs have many structural similarities; they divert water from a spring intake at an elevated location, typically a forested area, that is gravity-fed to a storage tank located above the community being served. Water is then piped to community taps or to individual households. Beyond water infrastructure, a core component of MUS is community engagement in learning micro-irrigation technologies, the selection of appropriate cultivation practices, and training on strategies to sell water-based products in local markets [4,21].
Since early 2005, organisations such as the International Water Management Institute (IWMI), Winrock International (WI), the IRC (International Water Supply and Sanitation Centre), the Challenge Program on Water and Food (CPWF), and iDE, as well as academics, have undertaken research to understand the impact of MUS on water system functionality and sustainability [4,9,13,18,23,24]. Similarly, several studies have been conducted on the impacts of SUS [25,26,27,28] and MUS [4,10,21,29,30]. While this research has explored the extent of productive activities undertaken in rural communities and the factors and conditions that enable this activity, research focusing on communities in the rural hills of Nepal is limited. Those studies that do exist include [4,9,10,13,16].
Studies of rural water systems in developing countries have identified many factors that advance the productive use of water. For example, households with high water service levels have been found to generate more income than households with poor water access [13,31], indicating that productive income is associated with the amount of water used. A global MUS assessment conducted by Renwick et al. [31] in Rural South Asia and sub-Saharan Africa found that each additional litre of water consumption for productive activities generated approximately $0.5 to $1.00 of income per capita per year. Therefore, improved access to water at the household level—e.g., improved water quantity and quality and reduced distances to the water sources [7,14,32]—can promote productive activities that improve livelihoods. In contrast, unreliable access to water discourages water-based activity.
The extent of productive water use and the associated income are also affected by several other factors, including: market access [17]; the nature and intensity of crop production, climatic and soil conditions, and commodity prices [31]; access to inputs such as seeds, fertilisers, etc., and agricultural support services [21]; available land [9]; available capital [33]; and household knowledge in agricultural production [34], affordable agricultural production technologies, and access to agricultural information [17]. Productive activities in and around homesteads are also typically undertaken by women [35,36] and provide households with an opportunity for livelihood diversification [37].
In Kenya, high productive activity was found to correlate with greater household wealth, a greater percentage of households with at least one literate member, and shorter distances to the nearest paved road [38]. In Senegal, improved water systems along with an effective institutional structure and capable water user committees were found to be necessary for the promotion of productive activities and income growth [39]. Household engagement in productive activities using water has also been found to be correlated with better technical performance of rural water supply systems [3].
The wide range of factors discussed above included technical, financial, and managerial aspects that can promote the productive use of water. However, this literature has not adequately reported on the factors that influence household income derived from productive activities in rural communities in the mid-hills of Nepal.
This paper focuses on understanding the factors that influence household income derived from productive activities in ten rural communities within the mid-hills of Nepal. More specifically, the research focuses on answering the following questions: (a) What is the extent of water-related productive activities in rural Nepalese households supported by SUS vs. MUS? and (b) What factors enable rural households in Nepal to engage in high levels of productive activity? This research should be of particular interest to the government of Nepal, which has a growing interest in water-based productive income through its recently launched five-year plan “Roadmap to Prosperity” that promotes the commercialization of productive activities to enhance the Nepalese rural economy.
The following section presents the research methodology and provides a description of the study area and the data collection and analysis techniques used. The results section presents and describes the findings from the analysis, which is organised into sections on the household characteristics, the extent of productive activities supported by communities with MUS vs. SUS, and the factors that are associated with high levels of productive activity at the household level. The final two sections discuss the findings and conclude the paper.
2. Methods
2.1. Study Area
The research site is located in three wards (Annapurna-6, Waling-5, and Bagnaskali-1) of Kaski, Syangja, and Palpa districts in the mid-hills region of Nepal as depicted in Figure 1. Kaski and Syangja are located in Province-4 and Palpa in Province-5. The wards are the lowest administrative-political body of Palikas (rural municipalities and municipalities). Several wards make a Palika. About 60% of the population in Nepal depends on subsistence farming [40]. Rural families typically grow rice, maize, and millet on terraced fields in the region [4]. The lands are often fragmented [41], and commercial farming is very limited in the region [42]. Most hill farmers depend on spring-fed piped systems for domestic use and seasonal rains for crops [20,43]. Springs are the reliable and preferred source of domestic water for communities in the mid-hills of Nepal because the cost of lifting water is often expensive, and groundwater is not economically accessible [43]. Since spring sources are being increasingly tapped and gradually depleted, their sustained use is becoming a challenge [35]. The depletion of spring sources is often due to a variety of biophysical (e.g., hydro-meteorological and land use changes) and social reasons (e.g., population growth, deforestation, haphazard construction activities) in the region [44].
2.2. Sampling Strategy and Process
The fieldwork was facilitated by iDE, an organisation promoting MUS in Nepal. Communities and households are the focus of analysis for this study, and their selection followed a three-stage process developed by the research team. First, districts and rural municipalities within a large geographical area in the mid-hills region were identified that contained both types of rural water supply systems: “by-design SUS” and “by-design MUS.” Most districts within the mid-hills have SUS developments and many have not experienced MUS development. By reviewing iDE’s MUS data, three mid-hill districts (Syangja, Kaski, and Palpa) were identified as having 105 MUS developments (out of the 450 MUS total). SUS developments were widely available in these districts. Therefore, these three districts provided an ideal setting for the study where both MUS and SUS are used by communities.
The second stage of the selection process identified the wards within each district that contained the largest number of water systems with a sufficient number of systems that have been operational for several years. Purposive sampling utilizing a separate list of water systems prepared by the researchers in consultation with local NGOs, authorities, and community leaders was used to identify the following wards most appropriate for the study: Annapurna-6 of Kaski District, Waling-5 of Syangja District, and Bagnaskali-1 of Palpa District.
The third stage consisted of selecting the communities within these wards for an in-depth study of their productive activity. A rapid assessment was conducted of all the community water systems (20 MUS and 40 SUS) that existed within the three wards. This assessment led to the development of water system selection criteria and created the sample frame for the research. Water systems were excluded from the sample if they were serving fewer than 10 households, were shared by two or more villages, were partial systems (lacking tanks, taps, etc.), or were jointly serving users with a parallel system. These criteria helped exclude the less representative water systems. The sample frame, together with the criteria, informed the selection of 10 systems (5 MUS and 5 SUS) for an in-depth study. Of the ten systems, there were 3 MUS and 3 SUS from Annapurna-6 of Kaski District, 1 MUS and 1 SUS from Waling-5 of Syangja District, and 1 MUS and 1 SUS from Bagnaskali-1 of Palpa District. Each water system served a community averaging 21 households for a total of 213 households.
2.3. Data Collection
The fieldwork was conducted between October 2017 and June 2018. A total of 202 household surveys (from a sample population of 213) and ten focus group interviews were completed. The 13 households that were not interviewed had either migrated elsewhere or could not be reached at their home and were excluded from the analysis. The household survey included a structured questionnaire to assess a household’s water-based productive activities, the related incomes, and its water consumption and to collect data to examine the socio-economic and geographic characteristics of productive activities in the region. Given the primary role of women in most household activities, including water collection, they were given priority for the interviews. In cases where two family members participated in an interview, only the participant with the greatest knowledge of their water system was listed on the survey sheet.
A focus group discussion among water users in each of the target communities was conducted to gain an understanding of user perceptions regarding productive activities, water-based incomes, and any associated interrelationships. These discussions were designed to complement the quantitative data received from the household survey. The focus group discussion was designed to be interactive. Each focus group consisted of 7–12 men and women selected from upper, middle, and lower income and geographical sections of the community. At the start of a focus group, a researcher explained the overall purpose of the study and read the questions to be discussed. Time was given to discuss each question while key discussion points were noted. The researchers then summarized the recorded discussion points and facilitated a discussion.
2.4. Classification of Households for Estimating the Determinants of Productive Activity
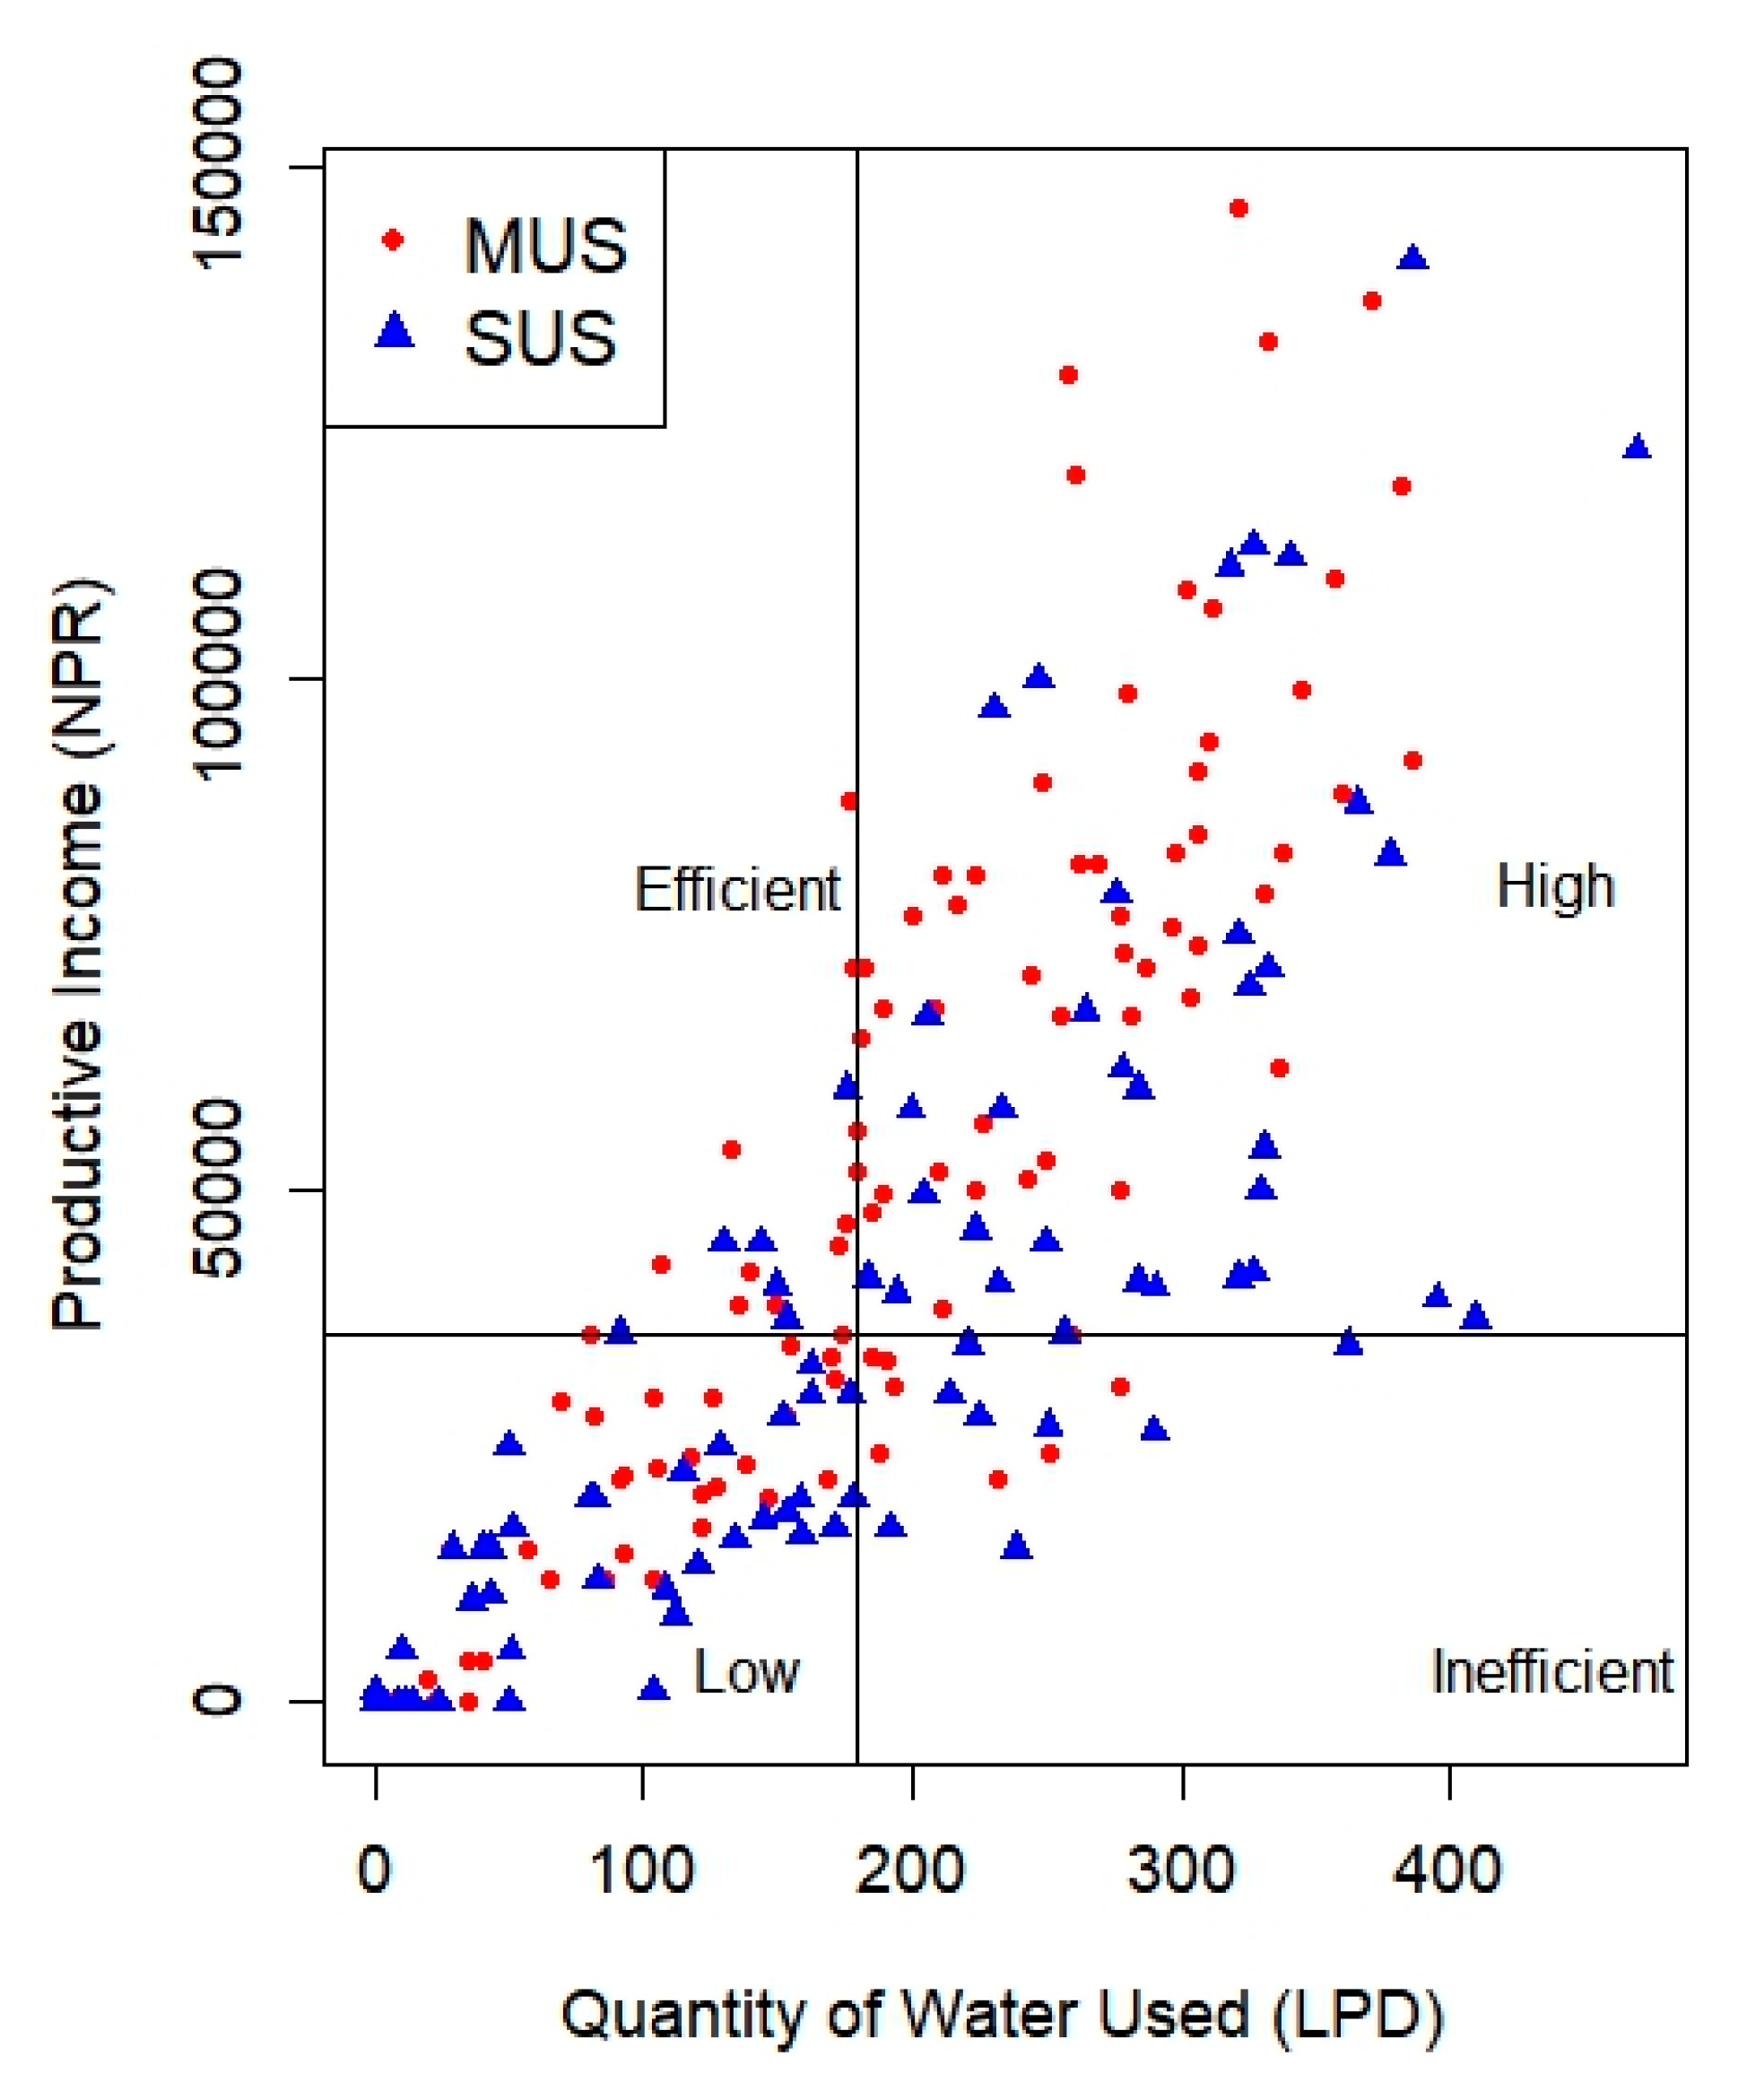
Table 1 shows that the MUS and SUS systems were providing water for uses beyond their designed uses. For example, 89% of SUS users, despite their systems being designed for domestic use only, use water for various productive activities including the irrigation of vegetables on their Bari lands. Similarly, 85% of the MUS users, despite their systems being designed for domestic use and vegetable production, also used water for livestock, dairy, Rakshi, and biogas. Figure 2 supports the finding that there is a large continuum of productive activities for both MUS and SUS systems. These findings suggest that a distinction of high vs. low productive activity should examine factors other than the design of MUS vs. SUS when exploring the determinants of productive activities. Therefore, a system-level analysis of MUS (by design) and SUS (by design) is unlikely to reveal the factors influencing productive activity. Thus, this research also undertook a household-level analysis using the “household clustering method” discussed below.
According to Hall et al. [3], the following two variables offer an appropriate measure of household-level productive activity:
- Water Consumption: Median volume of water, litres per household per day (LPD), used by households for productive activities from the water system; and
- Productive Income: Median household annual income (Nepalese Rupee-NPR) from productive activities that use water from the water system.
Using the statistical software R, four levels of households were identified and classified based on water consumption and income derived from productive activities. Figure 2 divides the surveyed households into the following four classifications (dependent variable):
- High group: Households who use a high quantity of water and generate a high income are defined as the high group, in which productive income > median income; LPD > median LPD.
- Low group: Households who use a low quantity of water and generate a low income are defined as the low group, in which productive income < median income; LPD < median LPD.
- Efficient group: Households who use a low quantity of water and generate a high income are defined as the efficient group, in which productive income > median income; LPD < median LPD.
- Inefficient group: Households who use a high quantity of water and generate a low income are defined as the inefficient group, in which productive income < median income, LPD > median LPD.
Figure 2 shows that the high and low groups have a comparable number of households, 42% and 43%, respectively. The remaining 15% of households were evenly split between the efficient (7.5%) and inefficient (7.5%) groups. Table 2 provides descriptive statistics for the four groups. The t-test for high and low groups shows that water consumption and productive income are statistically significant (p < 0.001).
While the above classification analysis clearly shows a direct relationship between water consumption and income for households engaged in productive activities, it does not reveal the extent to which other factors contribute to that relationship. To identify the effects of these factors, a multinomial logistic regression model was developed to capture the relationship between group identity (as defined by the four groups above) and socio-economic and geographical characteristics. This predictive model allows the identification of the effects of these factors at the household level in relation to a household’s classification.
2.5. Independent Variables
Fourteen variables were included in the analysis that covered a wide range of household-level socio-economic and geographical characteristics (Table 3).
2.6. Data Analysis
Multinomial logistic regression (MLR), a widely accepted research tool used in the rural water supply literature [45,46,47], was used to estimate the ratio of the probability of choosing a response category for each independent variable over the probability of choosing the baseline category. The response category in this work has four levels (low, high, efficient, and inefficient), with the low group being the baseline category (reference level). Group classification is shown in Figure 2 while Table 3 lists the independent variables. The MLR regression was chosen for two primary reasons. First, it is an appropriate model when the dependent variable is categorical and needs to be classified in two or more levels [48]. Second, it offers an effective way to test whether each independent variable has a probability of belonging in a particular group compared to the reference group [49]. Therefore, it shows the degree to which each group differs from the reference level and tells us the effect that each independent variable has on this classification and the effect size of this difference (relative to the reference group). Importantly, the model also allows us to identify which variables are statistically significant for defining the difference between the response and reference groups.
The MLR equation is written as follows:
where, p = probability of outcome/response, (Y)/1-p(Y) = odds of the outcome/response, β0 = intercept (constant), βn = coefficients for the nth independent variable, X n = nth predictor (independent) variable which can be categorical or continuous, and Y is a categorical dependent variable. Each regression coefficient represents the change in Y relative to a one-unit change in the respective independent variable (X).
ln[p(Y)/1−p(Y)] = β0 + βi X i+ ……..+ βn X n
The data were analysed with the statistical software “R”. Statistics (z- stat and p-value) for the model, and the model coefficients were examined, and the statistical significance of each independent variable was assessed as a predictor of the difference in classification between high and low groups.
3. Results
3.1. Household Characteristics
The ten communities selected for the study supply water to 213 households with over 1000 people within the three mid-hill districts. The mean household size in the study area was 5.07 people per household. More than half the working-age male population (15–50 years of age) have migrated out of the communities to work in the Middle East and elsewhere. This age group accounts for more than 55 percent of the total sample population. The median age of all respondents is 48 years. Landholdings, referred to as ‘khet’ and ‘bari’ lands, average less than 0.5 hectares per household. Khet refers to cultivated land outside the community that relies on rainwater for irrigation whereas bari lands are smaller plots near the household that are used for cultivation, livestock, and other uses that rely on delivered water, especially during the dry season. We estimate that 85 percent of households own bari land and 67 percent of households own khet land, 24 percent of which is rented. Households are differentiated by a caste system that is no longer legally recognized: 53 percent of the households are upper caste (highest hierarchy of social group within the Hindu caste system/traditional system that includes Brahmin and Chhetri), 24% Dalits (lowest hierarchy of social group within the Hindu caste system), and 23% Janajatis (an ethnic group or tribe with traditional customs, distinct cultural identity, and their own language). The vast majority of families (97.5%) own their home, typically made of earth plastered walls (76%), an earth floor (79%), and tin roof (65%). Around one-fifth of respondents had no formal education. Eighty-five percent of the respondents reported owning a television, 18 percent a motorcycle, 98 percent a mobile phone, and 13 percent a refrigerator, while 86 percent used cooking gas and 15 percent used bio-gas. The mean per capita income of households in the study communities was $863 USD, which is less than the national average of $998 USD as of the fiscal year 2017/2018 [50].
Remittance from men working outside the country accounted for 41 percent of total income while jobs (22%), agriculture (15%), business (10%), pension (11%), and government allowances (1%) accounted for the remainder. Most households (79%) had livestock with an average of 5.8 animals per household. It is notable that only a fraction (6.2%) of bari lands are irrigated from the primary water system. In addition to piped water, 68.5 percent of households utilized a secondary water source to meet their needs. Almost all (99%) of households had private latrines, but fewer than 50 percent were water-base toilet units. Households have limited access to year-round secondary water sources within their residences. They rely on the primary water sources for activities around the homestead, and rainfall serves as a complementary source for irrigating vegetables and crops in and around the homestead during the four-month monsoon season (June to August).
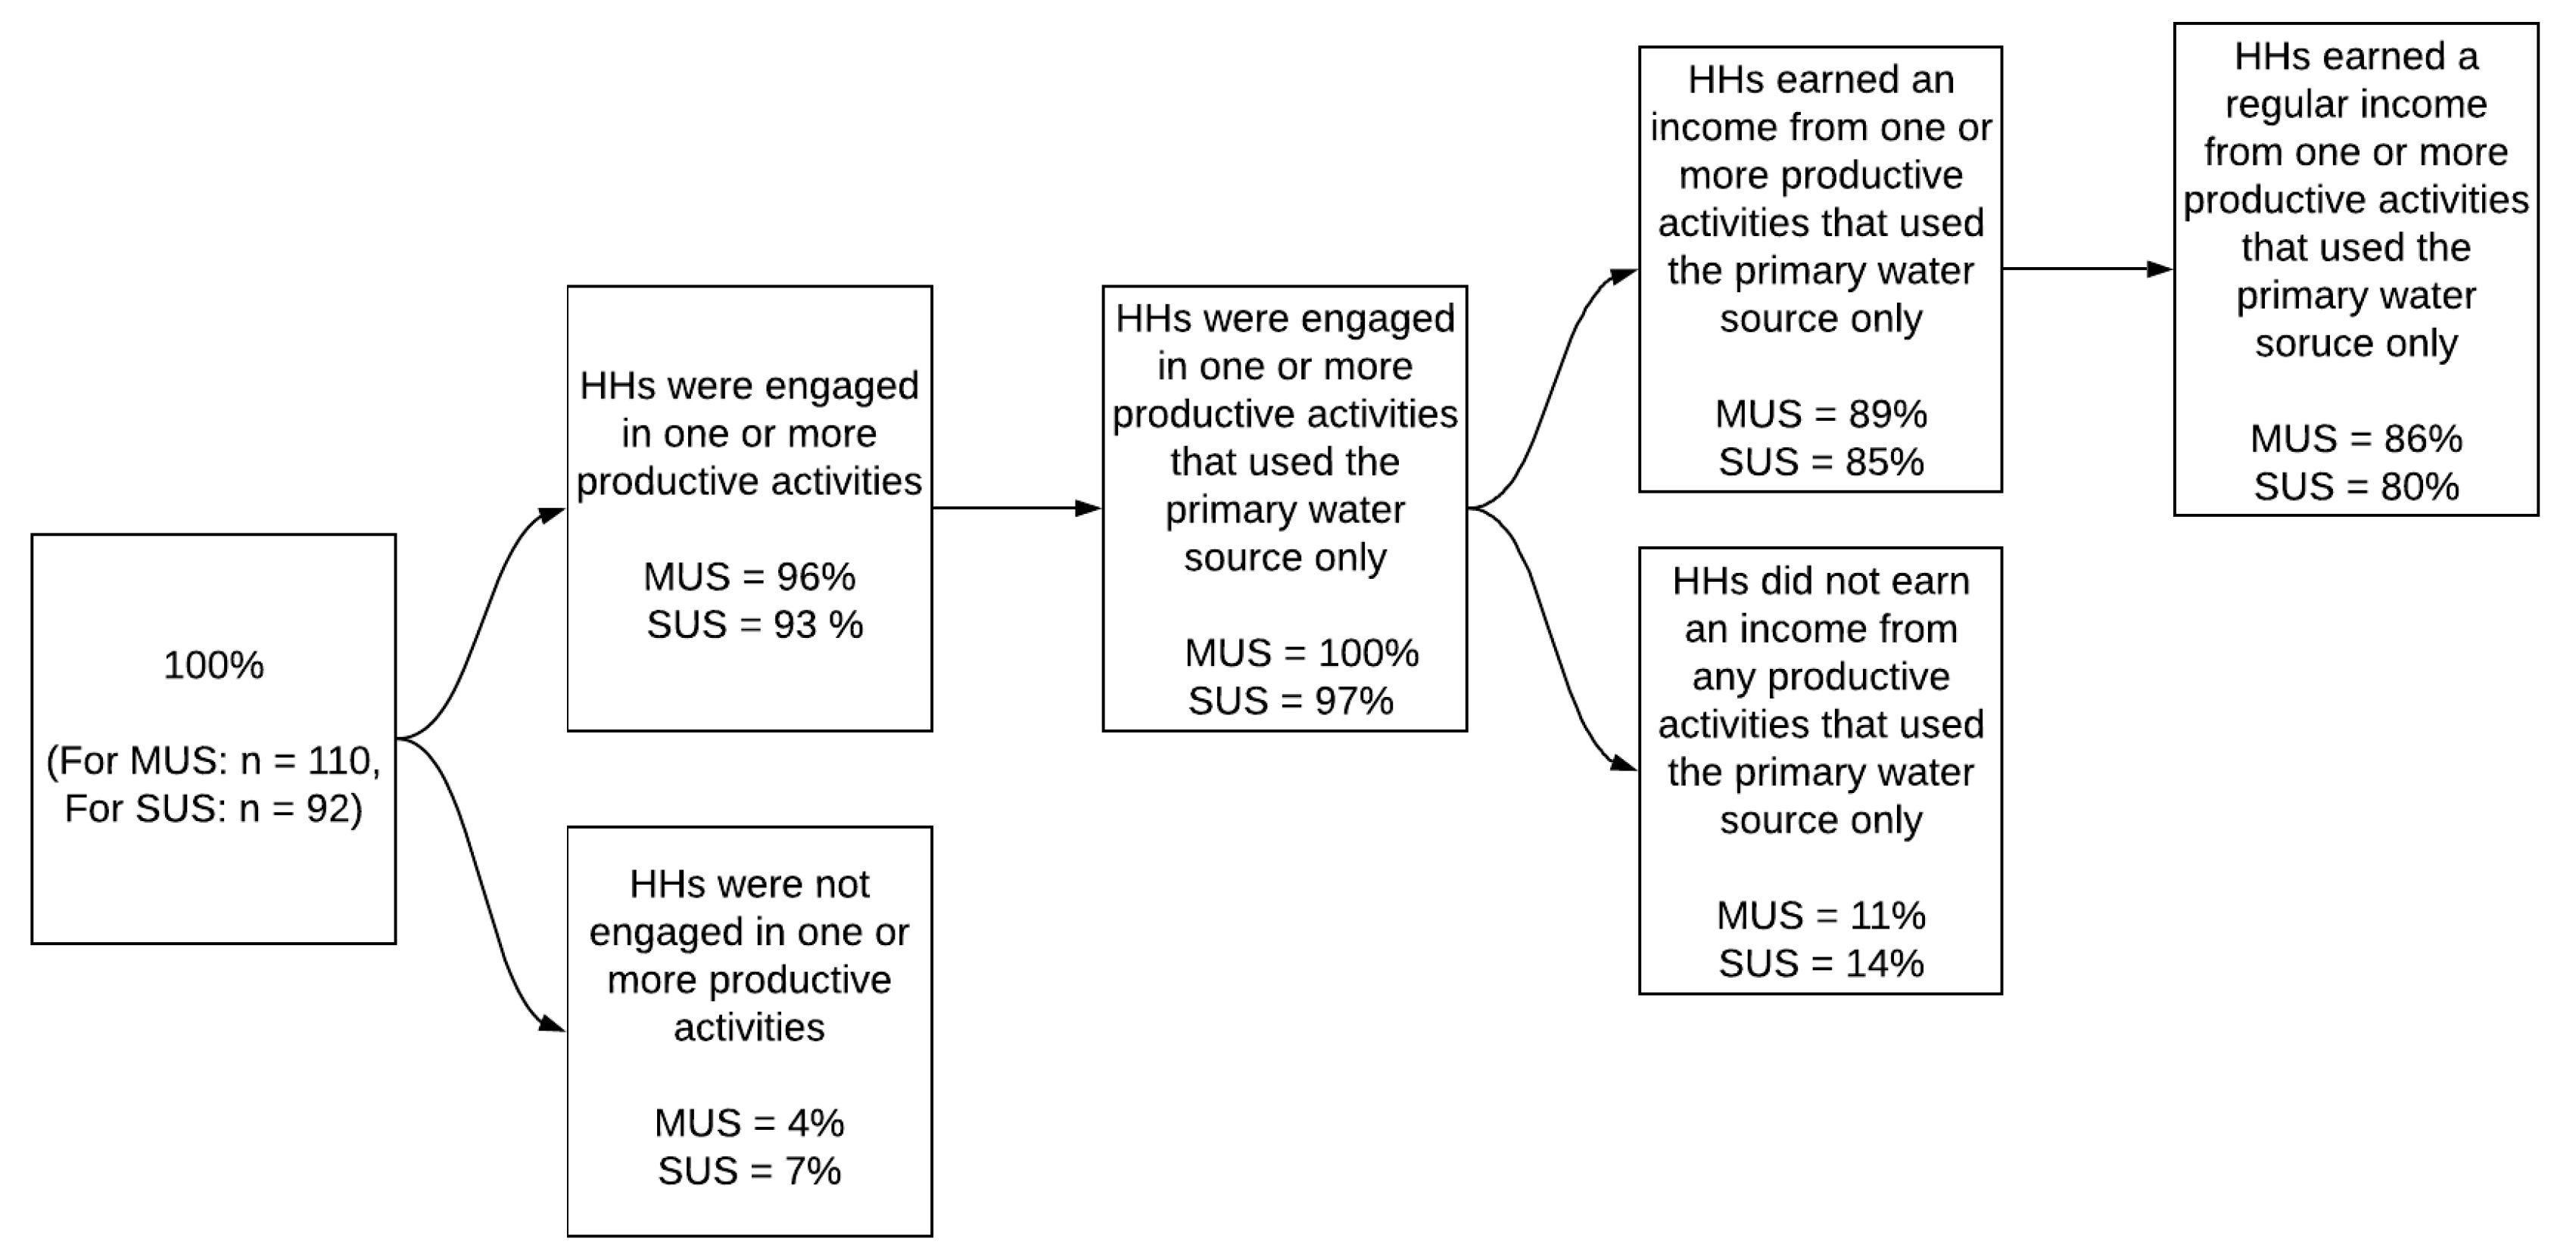
3.2. Extent of Household Participation in Water-Based Productive Activities
Figure 3 shows the extent of productive activities for households located in MUS and SUS communities. The vast majority of households (MUS 96% and SUS 93%) were engaged in one or more productive activities and most of them (MUS 89% and SUS 85%) earned some income from these activities, which accounted for around 65% of the total agricultural income (from all types of crop and livestock). Similarly, more than three-quarters of the households (MUS 86% and SUS 80%) earned a regular income from productive activities. Thus, an equivalent proportion of MUS and SUS households engage in productive activities regardless of their system design. Of the 110 MUS households and 92 SUS households that were surveyed, nearly all (MUS 100% and SUS 97%) reported that they were dependent on their primary water system to undertake at least one productive activity. The remaining 3% of SUS households used a secondary water source for productive activity.
More than half (MUS 56% and SUS 57%) of the surveyed households were using public taps for one or more productive activities, and the rest used a private tap. More than half of the households used a hosepipe to irrigate their bari lands, while one-third used micro-irrigation technology with the reminder (one–sixth) using buckets. Of the one-third of households using micro-irrigation, 37% were MUS and 8% were SUS households. With year-round productive activities, especially vegetable cultivation, rainfall was the primary source of water during the monsoon season, while the piped system served as a supplement to rainwater. Most of the users, either with a public or private tap, used a hosepipe to fill a water trough or small container to water animals.
The research found a wide range of water-dependent activities in the study area including vegetable gardens, horticulture (fruit trees, flower gardens), livestock (cattle, goats, chickens), dairy production, bio-gas, and Rakshi (locally made alcohol) production. A limited amount of work in construction, hotels, and religion was reported. Table 4 presents the following five water-based productive sources of income reported by households: vegetables, horticulture, livestock, dairy, and Rakshi. For both MUS and SUS communities, a majority of the households were involved in vegetable production, livestock, and dairy. Vegetable and livestock production were found to be the most practiced productive activity. Rakshi, horticulture, and bio-gas engaged a small percentage of households in MUS and SUS communities.
The annual median household income derived from water-based productive income was $360, which accounts for 9% of total median income ($3810). Around 94% of MUS and 80% of SUS households derived income from vegetable production. A comparison of mean income for vegetable production shows MUS households had nearly double the income of SUS households, $207 and $114, respectively. Whereas the mean income derived from each of the remaining four productive activities is similar for both MUS and SUS households. A comparison of mean annual productive incomes of MUS and SUS households was significant (p > 0.05). The water consumption for productive activities for MUS and SUS was not significantly different (median water consumption for MUS and SUS were 183 LPD and 166 LPD, respectively) (Table 5).
The higher income of MUS households was mainly driven by vegetable production reflecting the planning and support directed to farmers that created an efficient method for growing and marketing vegetables. The engagement of SUS households in vegetable production was influenced by neighbouring communities that had installed MUS water systems. With MUS households more focused on vegetable production, it is interesting to note that the two major activities of livestock and dairy production are slightly higher for SUS households. Nearly one-half (54%) of MUS and less than two-third (58%) of SUS households earned incomes from livestock; for dairy, the difference was 47 percent for MUS and 54 percent for SUS households.
These findings indicate that each one-litre per day (LPD) increase in water consumption in productive activities results in annual increased income of NPR. 248 ($2.48)—an increase of NPR. 295 ($2.95) for MUS and NPR. 207 ($2.07) for SUS households. These findings mean that households in MUS communities are one-seventh more productive than households in SUS communities. These findings are also consistent with Renwick et al. [31] and show that productive income in the surveyed households was largely associated with the volume of water used for productive activities.
In summary, most households used water for de-facto productive uses no matter what the systems were designed to support. However, this research has not found any evidence that households have compromised their basic domestic uses. Most households were using a mean of 171 LPD (34.2 lpcd) for domestic use, which was less than the designed 45 lpcd. Nonetheless, some households stored water to offset potential shortages due to system breakdowns, overuse by irrigators, or limited supply.
These findings challenge the current approach to rural water provision that views SUS and MUS differently. With this in mind, the following multinomial regression analysis focuses on identifying the key factors that differentiate households located in the high, efficient, and inefficient groups from those in the low group.
3.3. Determinants of Productive Activity
The multinomial logistic regression (MLR) analysis predicts the probable influence of independent variables on each of the household categories (the dependent variable). Thus, the model compares the low group against the other three groups (high, efficient, and inefficient) for each of the independent variables.
The following variables were found to be statistically significant predictors (positive) of the distinction between the high and the low groups (Table 6): agriculture as a primary occupation of household (p < 0.001), external support in productive activities (p < 0.05), motivation to undertake productive activities (p < 0.05), the use of productive technology (p < 0.001), and water-related productive activity training (p < 0.05). The variables pension and poor households were the only significant predictors that had a negative effect on productive activities. None of the other variables considered in this study had a significant association (at a 5% confidence level) with the differentiation between the high group and the low group.
The MRL model also determines how the independent variables were associated with households in the efficient and inefficient groups when compared with households in the low group. Agriculture as a primary occupation of households (p < 0.05) and productive technology (p < 0.05) were the significant predictors of the efficient group as differentiated with the low group. Similarly, poor (p < 0.001) and Palpa (p < 0.001) households were significantly associated (positively) with the inefficient group relative to the low group, whereas Janajati (p < 0.001) households had a significant negative association with the inefficient group relative to the low group. The following results provide an important comparison between the high group and low group.
The MRL model results presented in Table 6 show that the odds of a household being in the high group relative to being in the low group increases (keeping all else constant) by 0.2 times for households engaged in labour compared to households not engaged as labour, 1.2 times when households used a private tap as compared to households who used a public tap, 2.3 times when households had access to water for year round irrigation compared to households without such access, 3.24 times when households practiced agriculture as the major occupation as compared to those whose major source of income is not agriculture, 15.7 times for households who received productive training compared to those who do not, 15.8 times when households were receiving any support related to productive activities as compared to households who did not receive such support, 21 times if they were located in Syangja (Walling-5) vs. Kaski (Annapurna-6), 64 times when households were motivated to engage in productive activities compared to those who were not motivated, and 407 times when a family used productive technologies compared to those who do not use technologies.
Conversely, the odds of a household being in the high group relative to the low group decreases (keeping all else constant) by 1.1 times when a family received a remittance, 1.4 times for Janajati vs. upper caste, 3.4 times for households who consider themselves as having the same wealth as other households vs. those that consider themselves as wealthier than other households, 4.3 times for Dalit vs. upper caste, 5.8 times when one or more of the family members is employed with a government job, 26 times for poor households vs. wealthy households, and 38 times when households received an income from a pension. The findings show that households with the lowest economic status and those with secured income from a reliable source (e.g., a remittance, pension, or government job) are less likely to be in the high group relative to the low group. In addition, households with similar economic status are less likely to be in the high group relative to the low group.
Importantly, an increase in productive training, motivation, and external support increases the probability of a household being in the efficient group and decreases the probability of it being in the inefficient group. As expected, the use of productive technology has greatly increased the chances of a household being in the high and efficient groups. Interestingly, households in the inefficient group tend to earn a low income but use a high volume of water. In contrast, households that own a private tap are more likely to be in the high group. Home owners prefer to own and control a water tap instead of sharing a tap with neighbours. According to the MLR model, households in the upper-class ethnic group are more likely to be in the high group than the households from the Janajati and Dalit caste groups. Households in the upper caste group have more access to land resources, tend to be culturally trained in agriculture, and have more knowledge relating to agricultural practices. Of the three wards located in each district, households in Waling-5 of the Syangja district are more likely to be in the high group due to their high level of engagement in raising livestock and dairy production. In addition, a higher percentage of households in Waling-5 are considered to be upper caste when compared with households in the other two wards (i.e., Annapurna-6 of the Kaski district and Bagnaskali-1 of the Palpa district).
As shown in Table 6, an increase in the number of non-educated persons in a household, being Dalits vs. upper caste, being Palpa (Bagnaskali-1) vs. Kaksi (Annapurna-6), and using private vs. public taps are more likely to put a household in the inefficient group relative to the low group. Importantly, Dalits are considered to be the most disadvantaged and less empowered caste group. Palpa (Bagnaskali-1) and Dalits households typically lack water management training compared to Kaski (Annapurna-6) and upper caste households or had limited access to productive-use training. This finding implies that Palpa (Bagnaskali-1) and Dalit households may benefit from the practical demonstration of technology and training in water management practices.
4. Discussion
This research provides empirical evidence of the extent of rural-water-system-based productive activities in communities in the mid-hills of Nepal and the factors enabling these activities. The findings show that water-based productive activity is an income-generating opportunity for households. The water systems surveyed support nearly 94% of the households (MUS 96% and SUS 93%) in one or more productive activities, from which 87% of the households earned an income. This finding is similar to that of Hall et al.’s [3] multi-country study of the piped water systems in Senegal, Kenya, and Colombia where a majority of households (71%−75%) using a piped water system were involved in both domestic and productive activities and half of these households earned an income from these activities. Vegetable production, livestock raising, and dairy production were the most practiced water-based productive activities in the mid-hills of Nepal. Most importantly, these small enterprises are the most reliable sources of income for these families. These small-scale productive activities and their benefits are widely realized in several developing countries [4,6,18,21,23]. The productive activities of the surveyed households increased annual median income by $360, which is significant for a subsistence farming rural family. In addition, a small proportion of the households were engaged in horticulture, biogas, and production of Rakshi.
Considering all water-based productive activity, the extent of the productive activity differed insignificantly between MUS and SUS households, while the median productive income of MUS households ($446) was significantly higher than SUS ($290) households (p < 0.05). The difference in income can be explained by the contribution of vegetables. A previous study of 16 rural water systems in the mid-hills of Nepal found that households gained an annual income $ 136 from the sale of vegetables [9]. Other productive activities (livestock, dairy, Rakshi, and horticultural crops) had a comparable contribution to family income across systems. In our study, the incorporation of vegetable production into the MUS planning process enabled users to develop irrigation technology, inputs, markets, and investment tools that resulted in increased levels of production and higher user income than those experienced by SUS users. At the homestead level, Renwick et al. [31] estimated 175–475 LPD was needed to meet productive uses for some livestock (15 goats/8–10 cows), small gardens (10–110 sq.m), and small-scale enterprises. In our study, water consumption for productive activity falls towards the lower limit (i.e., 183 LPD for MUS and 166 LPD for SUS). The average number of livestock per household in our study was only 5.8, resulting in lower water consumption when compared to Renwick et al.’s study [31]. Research has found that significant levels of productive activities can occur by providing intermediate level MUS (>175 LPD/household for productive uses) or high-level MUS (>475 LPD/household for productive uses) [15,31]. In a similar vein, Moriarty et al. [6] underscored that rural household engagement in economic activities is largely shaped by the availability of and access to water supplies. The extent of water consumption also differs between its use categories—e.g., to support large livestock, livestock at a commercial scale, irrigation of crops, etc. The results comparing MUS and SUS support our basic proposition that MUS households earned a higher income than SUS households. However, the extent of productive activity and water consumption (for productive activities) for MUS was not significantly higher than SUS.
A significant predictor of households being located in the high and efficient groups was the use of productive technology, which plays a key role in improved levels of production through the efficient use of water. For example, many households have installed micro-irrigation systems and low-tech greenhouses to boost production while conserving water. Similarly, livestock producers have improved production efficiency through technical training and new technologies such as improved animal-sheds, livestock feeders, water troughs, and new feed sources. These technologies and the associated technical assistance can significantly expand water-based productive activities. A majority of the households reported that these new technologies were instrumental in reducing the risk of crop failure or low production rates for livestock, dairy, and crops. Thus, the technical control of the piped water system (MUS and SUS) together with the application technologies (micro-irrigation technology, low-tech greenhouses, etc.) are associated with positive production gains per unit of water use. The application of appropriate water technologies can create multiple opportunities that need to be supported by a range of management options [19].
User motivation to pursue productive activities is a significant predictor of success. Users who had realised benefits from productive activities were found to be more motivated than those who benefited less. Additionally, households with government jobs were less engaged and thus less motivated to pursue productive activities. Households with lower economic status were more frequently located in the low group when compared with the high group. In addition, households engaged in year-round production were more likely to be in the high group. Uninterrupted and reliable access to water throughout the year was a necessary condition to enable year-round productive activity.
Households that received technical training in vegetable production, marketing of vegetables, improved livestock management, fodder production, and other small-scale water-based enterprises, were more likely to be in the high group. Agriculture and livestock service centres, NGOs, and local agricultural cooperatives provide a variety of agricultural and educational training programmes directed at supporting the needs of the surveyed communities. These training programmes were designed to improve the user’s ability to increase production levels and establish marketing skills with the basic goal of improving rural livelihoods. The findings from this research provide empirical evidence that these training programmes have been effective at increasing levels of water-based productive activity and improving household livelihood.
This study also suggests that certain productive activities are associated with a particular cultural group. For example, the higher caste group is more likely to grow vegetables, keep livestock, and sell dairy products whereas the production of Rakshi (locally made alcohol) was popular among the lower castes–the Dalit and Janajati households. The frequency of irrigation varied from one location to another due to variability in local micro-climatic conditions. The availability of fodder and geographical constraints also affected the raising of livestock. Syangja (Waling-5) and Palpa (Bagnaskali-1) were the most desirable locations for livestock, whereas Kaksi was the most desirable location for vegetable production. Each category of produce (vegetable, livestock, etc.) had different market requirements across these locations. These factors individually and collectively affect productive activities.
The results from the MLR model were largely consistent with findings derived from the focus group discussions with water users. There was uniform agreement that undertaking productive activities is an attractive option for households without a reliable source of income and who lack technical skills. The interviews highlighted how poor families that learned about commercial production techniques, technologies, and markets became small-scale entrepreneurs to better meet their family needs. Productive work was reported to be comparatively easier and more enjoyable than traditional agriculture due to the realization of income and livelihood benefits. The focus groups revealed that a small percentage of very wealthy families considered agriculture to be laborious, less profitable, and characterised by disappointment. Their production was primarily for home consumption with any leftovers being sold locally. However, these households could potentially enhance their productive activities through training and better use of appropriate technology.
Some families have limited or no access to bari lands or have unproductive land with limited ability to engage in productive activity. A study from the same region reported that households with sufficient bari land were more engaged in vegetable production and earned higher incomes from vegetables [9]. Water users reported that persons with higher educational attainment were found to be less engaged in productive activity as compared with persons with no formal education. They also revealed that users fear risks such as production failures, pest infestations, low crop yields, limited availability of livestock fodder and land for grazing, and market uncertainty. These factors have discouraged some users from undertaking productive activities. Therefore, future support strategies should focus on these challenges and recognise that women are largely responsible for water-based productive activities such as vegetable cultivation, livestock production, alcohol production, and the selling of products.
There were no constraints for most households in the study area to buying productive technologies and obtaining related productive services locally or from the district headquarters. Technologies were low-cost and either provided by NGOs, local governments, or self-purchased by the users in local markets. Most households had the ability to purchase these technologies. Therefore, the ability of households to develop productive activities depends more on their level of motivation than their poverty level.
The planning and design standard for MUS is to provide water for domestic use and vegetable production, whereas SUS is designed to provide water for domestic use only. However, the vast majority of households (89%) in SUS communities used their systems for unplanned small-scale productive activities. Thus, this research finds that communities do not limit the scope of their water use from a rural water system (RWS), regardless of its design. Therefore, rural water systems in the mid-hills of Nepal are a de-facto multi-purpose infrastructure. This result is consistent with (12: pp. 19) who states that “multiple uses of infrastructure is the rule, and single-use the exception.” This conclusion is also supported by others [1,11].
This paper has addressed factors in rural water system planning and design that inform a system’s ability to function as de-facto productive. Ideally, the design of MUS extends beyond supply infrastructure to include appropriate technologies (e.g., micro irrigation, water troughs, etc.), technical training, and access to productive activity support/services. In the mid-hills of Nepal, SUS that are designed and built for domestic use only are adapted by users to accommodate small-scale productive activities. The failure to address these unplanned uses in advance may result in inefficient, inequitable, and unsustainable use and management of the water systems [51,52]. While this de-facto multiple use of water has become an opportunity for rural households, it may bring risks to the sustainability of service provision [24] or cause technical and managerial problems [18]. More comprehensive research that explores links between de-facto productive use and system sustainability would be valuable.
5. Conclusions
This paper provides empirical evidence on the extent of productive activity of MUS and SUS in the rural mid-hills of Nepal. The research finds that the vast majority households (using MUS and SUS) are engaged in small-scale productive activities, from which more than three-quarters of the households earn an income. This indicates that water-based productive activities are critical to supporting rural livelihoods in Nepal. The research found that the productive activities and associated income were higher for MUS vs. SUS households, suggesting that integrated practices and services (productive training, technologies, and market linkages) offered in MUS could be transferred to SUS households to enhance the income earned.
Second, the research identifies the dominant predictors of high levels of productive activity. More specifically, households that farm as a primary occupation, use productive technologies, are motivated to pursue productive activities, have received water-related productive activity training, and have received external support related to productive activities have higher levels of productive activity. These factors also help explain why households served by SUS engaged in high levels of productive activity. Thus, while the design of rural water systems does influence what types of productive activities are undertaken and the income received from these activities, virtually all of the households in SUS communities were engaged in productive activities—making them ‘de-facto MUS’. Put differently, the productive use of water in rural communities in Nepal is likely to be the norm, which implies that the Nepalese government should design rural water services with these activities in mind.
The findings from this study are generally applicable in rural areas of Nepal or other developing countries with similar socio-cultural, economic, and climatic settings. However, additional research may be needed to identify additional variables unique to a particular area that would inform policy makers and water system planners and designers of the key factors that promote the productive use of water.
Author Contributions
Conceptualization, R.K.G., R.P.H., and S.R.; methodology, R.K.G., S.R., and R.P.H.; software, R.K.G. and S.R.; formal analysis, R.K.G., S.R., and R.P.H.; investigation, R.K.G.; data curation, R.K.G.; writing—original draft preparation, R.K.G.; writing—review and editing, R.K.G., R.P.H., and S.R.; visualization, R.K.G., R.P.H., and S.R.
Funding
This research received no external funding. We are grateful to the Virginia Tech Open Access Subvention Fund for covering the article processing charges for this paper.
Acknowledgments
The authors would like to thank the International Water Management Institute (IWMI Nepal) for providing an internship opportunity to conduct this research. We acknowledge the in-kind support of International Development Enterprises (iDE-Nepal), who provided local staff, vehicles, and support for various components of the research. We would also like to thank Bal Krishna Thapa, Khadka Sunar, and Him Bahadur DC who introduced the authors to each of the communities included in this research and provided necessary support in the field. We are grateful to John Covert for his valuable comments and feedback on the paper.
Conflicts of Interest
The authors declare no conflict of interest.
References
- Hall, R.P.; Van Koppen, B.; Van Houweling, E. The human right to water: The importance of domestic and productive water rights. Sci. Eng. Ethics 2014, 20, 849–868. [Google Scholar] [CrossRef] [PubMed]
- van Koppen, B.; Smits, S. Multiple Use Water Services: Scoping Study Synthesis; Research Report; International Water Management Institute (IWMI): Colombo, Sri Lanka, 2012. [Google Scholar]
- Hall, R.P.; Vance, E.; van Houweling, E. The productive use of rural piped water in Senegal. Water Altern. 2014, 7, 480–498. [Google Scholar]
- Mikhail, M.; Yoder, R. Multiple Use Water Service Implementation in Nepal and India: Experience and Lessons for Scale-Up; International Development Enterprises (iDE): Denver, CO, USA; The Challenge Program on Water and Food (CPWF): International Water Management Institute (IWMI): Lakewood, CO, USA; Colombo, Sri Lanka, 2008. [Google Scholar]
- Moriarty, P.; Smits, S.; Butterworth, J.; Franceys, R. Trends in rural water supply: Towards a service delivery approach. Water Altern. 2013, 6, 329–349. [Google Scholar]
- Moriarty, P.; Butterworth, J.; Van Koppen, B. Beyond Domestic: Case Studies on Poverty and Productive Uses of Water at the Household Level; Technical Papers Series 41; International Water Supply and Sanitation Centre (IRC): The Hague, The Netherlands, 2004; Volume 7. [Google Scholar]
- Hall, R.P.; Vance, E.A.; van Houweling, E. Upgrading domestic-plus systems in rural Senegal: An incremental income-cost (ic) analysis. Water Altern. 2015, 8, 317–336. [Google Scholar]
- Hall, R.P.; Ranganathan, S.; GC, R.K. A general micro-level modeling approach to analyzing interconnected SDGs: Achieving SDG 6 and more through multiple-use water services (MUS). Sustainability 2017, 9, 314. [Google Scholar] [CrossRef]
- Clement, F.; Pokhrel, P.; Sherpa, T.Y.C. Sustainability and Replicability of Multiple-Use Water Systems (MUS); International Water Management Institute (IWMI): Kathmandu, Nepal, 2015. [Google Scholar]
- Basnet, G.; van Koppen, B. Multiple Use Water Services in Nepal Scoping Study; International Water Management Institute (IWMI) and International Rural Water Supply and Sanitation Centre (IRC): Colombo, Sri Lanka; The Hague, The Netherlands, 2011. [Google Scholar]
- Clement, F.; Pradhan, P.; Van Koppen, B. Understanding the non-institutionalisation of a socio-technical innovation: The case of multiple-use water services (MUS) in Nepal. Water Int. 2019, 44, 408–426. [Google Scholar] [CrossRef]
- Van Koppen, B.; Smits, S.; del Rio, C.R.; Thomas, J. Scaling up Multiple Use Water Services: Accountability in the Water Sector; Practical Action Publishing Ltd.: Warwickshire, UK, 2014. [Google Scholar]
- van Koppen, B.; Smits, S.; Moriarty, P.; de Vries, F.P.; Mikhail, M.; Boelee, E. Multiple-Use Water Services (MUS); CPWF Project Report; Challenge Program on Water and Food: Colombo, Sri Lanka, 2009. [Google Scholar]
- Smits, S.; Van Koppen, B.; Moriarty, P.; Butterworth, J. Multiple-use services as alternative to rural water supply services-A characterisation of the approach. Water Altern. 2010, 3, 102–121. [Google Scholar]
- van Koppen, B.; Smits, S. Multiple-use water services: Climbing the water ladder. Waterlines 2010, 29, 5–20. [Google Scholar] [CrossRef]
- Rautanen, S.L.; van Koppen, B.; Wagle, N. Community-driven multiple use water services: Lessons learned by the Rural Village Water Resources Management Project in Nepal. Water Altern. 2014, 7, 160–177. [Google Scholar]
- Polak, P.; Adhikari, D.; Nanes, B.; Salter, D.; Surywanshi, S. Transforming rural water access into profitable business opportunities. In Proceedings of the International Symposium on Water, Poverty and Productive Uses of Water at the Household Level, Muldersdrift, South Africa, 21–23 January 2003; p. 184. [Google Scholar]
- Van Koppen, B.; Moriarty, P.; Boelee, E. Multiple-Use Water Services to Advance the Millennium Development Goals; Research Report; International Water Management Institute (IWMI): Colombo, Sri Lanka, 2006. [Google Scholar]
- Yoder, R.; Mikhail, M.; Sharma, K.; Adhikari, D. Technology adoption and adaptation for multiple use water services in the hills of Nepal. In Proceedings of the Fighting Poverty through Sustainable Water Use: 2nd International Forum on Water and Food, Colombo, Sri Lanka, 10–14 November 2018; pp. 99–102. [Google Scholar]
- Sharma, K.; GC, R.K.; Cook, M.; O’Hara, C. iDE Guidelines for Planning, Design, Construction, and Operation of Multiple Use Water Systems (MUS): Field-Level Implementation Guidelines; International Development Enterprises (iDE): Kathmandu, Nepal, 2016. [Google Scholar]
- GC, R.K.; Colavito, L.A. Benefits of multiple-use water systems (MUS) with micro irrigation for the smallholder farmers in the rural hills of Nepal. In Proceedings of the Sixth International Seminar on Small Scale Irrigation Systems: Challenges to Sustainable Livelihood, Kathmandu, Nepal, 15–16 February 2015; pp. 123–131. [Google Scholar]
- Matoso, M.; GC, R.K.; Jobbins, G. Climate-Resilient Planning: Reflections on Testing a New Toolkit. Resilience Intel 7; BRACED: London, UK, 1 March 2017. [Google Scholar]
- Pant, D.; Gautam, K.R.; Shakya, S.D.; Adhikari, D.L. Multiple Use Schemes: Benefit to Smallholders; IWMI: Colombo, Sri Lanka, 2007; Volume 114. [Google Scholar]
- Smits, S.; Mejía, T.; Rodríguez, S.E.; Suazo, D. Effects of multiple-use of water on users’ livelihoods and sustainability of rural water supply services in Honduras. Waterlines 2010, 29, 37–51. [Google Scholar] [CrossRef]
- WaterAid. Research into Financial and Institutional Structures to Support the Functionality and Sustainability of Rural Hill Water Systems; WaterAid: Kathmandu, Nepal, 2010. [Google Scholar]
- Whaley, L.; Cleaver, F. Can ‘functionality’ save the community management model of rural water supply? Water Resour. Rural Dev. 2017, 9, 56–66. [Google Scholar] [CrossRef]
- Montgomery, M.A.; Bartram, J.; Elimelech, M. Increasing functional sustainability of water and sanitation supplies in rural sub-Saharan Africa. Environ. Eng. Sci. 2009, 26, 1017–1023. [Google Scholar] [CrossRef]
- Bhandari, B.; Grant, M. User satisfaction and sustainability of drinking water schemes in rural communities of Nepal. Sustain. Sci. Pract. Policy 2007, 3, 12–20. [Google Scholar] [CrossRef]
- Rautanen, S.; White, P. Using every drop–experiences of good local water governance and multiple-use water services for food security in far-western Nepal. Aquat. Procedia 2013, 1, 120–129. [Google Scholar] [CrossRef]
- GC, R.K. An Evaluation of Multiple Use Water Systems in Mid-Hills of Nepal: A Case Study of Phulbari Multiple Use Water Systems in iDE’s Project Area of Shyangja District; MSc Internship Research Report; Wangeningen University: Wangeningen, The Netherlands, 2010. [Google Scholar]
- Renwick, M.E.; Joshi, D.; Huang, M.; Kong, S.; Petrova, S.; Bennett, G.; Bingham, R.; Fonseca, C.; Moriarty, P.; Smits, S.; et al. Multiple Use Water Services for the Poor: Assessing the State of Knowledge; Final Report; Winrock International (WI): Arlington, VA, USA, 2007. [Google Scholar]
- Katsi, L.; Siwadi, J.; Guzha, E.; Makoni, F.S.; Smits, S. Assessment of factors which affect multiple uses of water sources at household level in rural Zimbabwe–A case study of Marondera, Murehwa and Uzumba Maramba Pfungwe Districts. Phys. Chem. Earth Parts A/B/C 2007, 32, 1157–1166. [Google Scholar] [CrossRef]
- De Boer, J. Study on Costs and Benefits of Multiple Use Water Services in NEPAL; Final Report, Water Innovation Program; Winrock International (WI): Arlington, VA, USA, 2007. [Google Scholar]
- Pant, D.; Gautam, K.R.; Shakya, S.D. Assessment of Multiple Use Schemes (MUS) Implemented under Smallholder Irrigation Market Initiative (SIMI); International Development Enterprises (iDE Nepal): Kathmandu, Nepal, 2005. [Google Scholar]
- GC, R.K. Multiple use water systems and micro irrigation technologies for Koshi Basin – Lessons from Gandaki region, Nepal. In Proceedings of the Water-Livelihoods-Gender Nexus to Advance Koshi Basin Management, Kathmandu, Nepal, 24–25 March 2016; pp. 77–84. [Google Scholar]
- Sharma, B.R.; Riaz, M.; Pant, D.; Adhikary, D.; Bhatt, B.; Rahman, H. Water Poverty in the Northeastern Hill Region (India): Potential Alleviation through Multiple-Use Water Systems: Cross-Learnings from Nepal Hills; IWMI-NAIP Report; International Water Management Institute (IWMI): New Delhi, India, 2010. [Google Scholar]
- Van Houweling, E.; Hall, R.; Diop, A.S.; Davis, J.; Seiss, M. The role of productive water use in women’s livelihoods. Evidence from rural Senegal. Water Altern. 2012, 5, 658–677. [Google Scholar]
- IRC (International Water Supply and Sanitation Centre). Multiple Use Services (MUS). IRC Synergy Week; IRC, MUS Group: The Hague, The Netherlands, 2012; Available online: https://www.slideshare.net/ircuser/multiple-use-services-irc-webinar (accessed on 5 April 2019).
- Moriarty, P.; Butterworth, J.; Martin, A.; Morris, M.; Nicol, A.; Cousins, T. Productive Use of Domestic Water Supplies: How Water Supplies Can Play a Wider Role in Livelihood Improvement and Poverty Reduction; International Water Supply and Sanitation Centre (IRC): The Hague, The Netherlands, 2003. [Google Scholar]
- Aksha, S.K.; Juran, L.; Resler, L.M.; Zhang, Y. An analysis of social vulnerability to natural hazards in Nepal using a modified social vulnerability index. Int. J. Disaster Risk Sci. 2019, 10, 103–116. [Google Scholar] [CrossRef]
- Dhakal, B.N.; Khanal, N.R. Causes and consequences of fragmentation of agricultural land: A case of Nawalparasi District, Nepal. Geogr. J. Nepal 2018, 11, 95–112. [Google Scholar] [CrossRef]
- Khanal, A.R.; Mishra, A.K. Impacts of Contract Farming Decisions on High Value Crop Production of Smallholder Nepalese Farmers: A Multinomial Endogenous Switching Regression Approach. In Proceedings of the 2018 Annual Meeting, Washington, DC, USA, 5–7 August 2018. [Google Scholar]
- GC, R.K. Experiences from multiple use water system in Nepal-A case study of Phulbari village of Syangja District. In Proceedings of the 6th Rural Water Supply Network Forum, Kampala, Uganda, 29 November–1 December 2011. [Google Scholar]
- Poudel, D.D.; Duex, T.W. Vanishing Springs in Nepalese Mountains: Assessment of Water Sources, Farmers’ Perceptions, and Climate Change Adaptation. Mt. Res. Dev. 2017, 37, 35–46. [Google Scholar] [CrossRef]
- Sango, V. Elicitation of determinants of rural households’ water supply in Côte d’Ivoire: A case study. In Proceedings of the 7th RWSN Forum “Water for Everyone”, Abidjan, Côte d’Ivoire, 29 November–2 December 2016. [Google Scholar]
- Masamha, B.; Kanda, A.; Mapuwei, T.; Gotosa, J.; Dudu, V.P. Multinomial regression modelling of factors determining choice of household water treatment technology in Bindura rural District of Zimbabwe. Res. J. Math. Stat. 2014, 6, 12–15. [Google Scholar] [CrossRef]
- Irianti, S.; Prasetyoputra, P.; Sasimartoyo, T.P. Determinants of household drinking-water source in Indonesia: An analysis of the 2007 Indonesian family life survey. Cogent Med. 2016, 3, 1–13. [Google Scholar] [CrossRef]
- El-Habil, A.M. An application on multinomial logistic regression model. Pak. J. Stat. Oper. Res. 2012, 8, 271–291. [Google Scholar] [CrossRef]
- Starkweather, J.; Moske, A.K. Multinomial Logistic Regression. Available online: https://it.unt.edu/sites/default/files/mlr_jds_aug2011.pdf (accessed on 25 May 2019).
- MoF (Ministry of Finance). Economic Survey 2018/19. MoF, Government of Nepal: Kathmandu, Nepal, 2018. Available online: https://mof.gov.np/en/archive-documents/economic-survey-21.html (accessed on 22 September 2019).
- Renwick, M.E. Valuing water in a multiple-use system–irrigated agriculture and reservoir fisheries. Irrig. Drain. Syst. 2001, 15, 149–171. [Google Scholar] [CrossRef]
- Srinivasan, V.; Palaniappan, M.; Akudago, J.; Cohen, M.; Christian-Smith, J. Multiple-Use Water Services (MUS): Recommendations for a Robust and Sustainable Approach; Pacific Institute: Oakland, CA, USA, 2012. [Google Scholar]
Figure 1.
Map of the study area highlighting the three research sites in Annapurna-6, Waling-5, and Bagnaskali-1.
Figure 1.
Map of the study area highlighting the three research sites in Annapurna-6, Waling-5, and Bagnaskali-1.

Figure 2.
Household water consumption and productive income.

Figure 3.
Extent of productive activity of MUS and SUS.


Table 1.
Distribution of water system and household use within and beyond the intended design purposes.
Table 1.
Distribution of water system and household use within and beyond the intended design purposes.
| Type of Rural Water System | Domestic Use Only | Domestic and Vegetable Only | Domestic, Vegetable, and Other Productive Activities | |
|---|---|---|---|---|
| Multiple-Use Water Systems (MUS) | System (n = 5) | 0% | 0% | 100% |
| Household (n = 109) | 4% | 12% | 85% | |
| Single-Use Domestic Water Systems (SUS) | System (n = 5) | 0% | 0% | 100% |
| Household (n = 90) | 7% | 4% | 89% |
Table 2.
Descriptive statistics for four levels (low, high, efficient, and inefficient) of households.
Table 2.
Descriptive statistics for four levels (low, high, efficient, and inefficient) of households.
| Variable Name | Low | High | Efficient | Inefficient | T-test between High vs. Low Group | ||||||||
|---|---|---|---|---|---|---|---|---|---|---|---|---|---|
| N | Med | SD | N | Med | SD | N | Med | SD | N | Med | SD | p-Value | |
| HH Productive Income (USD/year) | 86 | 150 | 117 | 85 | 720 | 271 | 15 | 440 | 144 | 15 | 280 | 62 | <0.001 |
| Water Used/Consumption (LPD/HH) | 86 | 74 | 62 | 85 | 279 | 64 | 15 | 153 | 22 | 15 | 225 | 48 | <0.001 |
Table 3.
List of independent variables.
| Variable | Question/Description |
|---|---|
| Government job | Are one or more family members employed in a government job? Yes = 1 No = 0 |
| Labour | Are one or more family members engaged in unskilled labour for cash income? Yes = 1 No = 0 |
| Pension | Does anyone in the household receive an income from a government pension or private source? Yes = 1 No = 0 |
| Remittance | Do one or more members of the family receive a remittance? Yes = 1 No = 0 |
| Wealth status | Does the respondent consider themselves 1 = wealthy when compared to others in the community? 2 = as having the same wealth as others in the community? 3 = poor when compared to others in the community? |
| Agriculture as a primary occupation of household | Does the household practice agriculture as their major occupation? Yes = 1 No = 0 |
| External support in productive activities | Is the household currently receiving any external support from an implementing agency or other organisation outside the community related to productive activities? Yes = 1 No = 0 |
| Motivation in productive activities | Did the household respondent state that s/he was motivated to engage in productive activities? Yes = 1 No = 0 |
| Productive technologies | Did the household use productive technologies (such as micro-irrigation, low tech greenhouses, improved livestock sheds and management, etc.) for at least two major productive activities—e.g., growing vegetables and raising livestock? Yes = 1 No = 0 |
| Productive training | Did anyone in the household receive training related to water-based productive activities (such as high-value vegetable production, production of off-seasonal crops, livestock production and management, marketing of produce, etc.) during, before, or after the implementation of the project? Yes = 1 No = 0 |
| Locality | In which region is the household located? 1 = Kaksi (Annapurna-6) 2 = Syangja (Waling-5) 3 = Palpa (Bagnaskali-1) |
| Ethnicity | What is the caste group of the household? 1 = Upper 2 = Janajati 3 = Dalit |
| Availability of water for year-round productive use | Does the household have access to water for year-round productive activities? Yes = 1 No = 0 |
| Non-educated persons in the household | What is the total number of persons with no formal education in the household? (numerical response) |
| Tap Ownership | Do the households use a public or private tap? 1 = Private tap 0 = Public tap |
Table 4.
Distribution of household participation in productive activities.
| Type of Rural Water System | Productive Activity | % of HHs Participating in Activity | % of HHs Earning an Income from Activity |
|---|---|---|---|
| Multiple-Use Water Systems (MUS) | Vegetables (n = 110) | 94 | 75 |
| Livestock (n = 109) | 80 | 54 | |
| Dairy (n =1 09) | 50 | 47 | |
| Rakshi (n = 110) | 31 | 9 | |
| Horticulture (n = 110) | 14 | 11 | |
| Bio-Gas (n = 110) | 6 | Income cannot be monetised | |
| Single-Use Domestic Water Systems (SUS) | Vegetables (n = 90) | 80 | 46 |
| Livestock (n = 92) | 79 | 58 | |
| Dairy (n = 92) | 53 | 54 | |
| Rakshi (n = 92) | 34 | 30 | |
| Horticulture (n = 92) | 27 | 20 | |
| Bio-Gas (n = 92) | 25 | Income cannot be monetised |
Table 5.
Descriptive statistics for MUS and SUS.
| Variable Name | MUS | SUS | T-Test between MUS and SUS | ||||
|---|---|---|---|---|---|---|---|
| N | Median | SD | N | Median | SD | p-Value | |
| HH Productive Income (USD/year) | 110 | 446 | 360 | 92 | 290 | 318 | <0.05 |
| Water Consumption (LPD/HH) | 110 | 183 | 105 | 92 | 166 | 121 | 0.6023 |
Table 6.
Results of multinomial logistic regression.
| Independent Variable | Groups | Coefficients (Beta) | Standard Error | P–Value |
|---|---|---|---|---|
| Government job | High | −1.9291 | 1.7648 | 0.2743 |
| Efficient | −0.3965 | 1.9142 | 0.8359 | |
| Inefficient | −21.0261 | 0.0000 | <0.001 | |
| Labour | High | 0.1797 | 1.4275 | 0.8998 |
| Efficient | −0.4410 | 1.6702 | 0.7917 | |
| Inefficient | −1.8557 | 1.2913 | 0.1507 | |
| Penson | High | −3.6721 | 1.5786 | <0.05 |
| Efficient | −18.0673 | 0.0000 | <0.001 | |
| Inefficient | 0.7863 | 1.1758 | 0.5036 | |
| Remittance | High | −0.7550 | 1.2452 | 0.5443 |
| Efficient | 0.7307 | 1.2969 | 0.5732 | |
| Inefficient | −0.3903 | 0.9043 | 0.6660 | |
| Wealth same as others | High | −1.2277 | 1.4491 | 0.3969 |
| Efficient | 0.0101 | 1.4417 | 0.9944 | |
| Inefficient | 0.2487 | 0.8666 | 0.7742 | |
| Poor | High | −3.3077 | 2.0592 | <0.05 |
| Efficient | −1.5937 | 2.1009 | 0.4481 | |
| Inefficient | −16.1432 | 0.0000 | <0.001 | |
| Agriculture as a primary occupation of household | High | 6.0541 | 1.4005 | <0.001 |
| Efficient | 3.0349 | 1.1189 | <0.05 | |
| Inefficient | 0.4140 | 0.9907 | 0.6760 | |
| External support | High | 2.8217 | 1.4022 | <0.05 |
| Efficient | 2.0424 | 1.3364 | 0.1264 | |
| Inefficient | −0.3469 | 1.4103 | 0.8057 | |
| Motivation in productive activities | High | 4.1844 | 1.6490 | <0.05 |
| Efficient | 2.2860 | 1.3170 | 0.0826 | |
| Inefficient | −0.0672 | 0.7895 | 0.9322 | |
| Productive technology | High | 6.0123 | 1.9100 | <0.001 |
| Efficient | 4.6002 | 1.9337 | <0.05 | |
| Inefficient | 3.7293 | 2.2136 | 0.0920 | |
| Productive training | High | 2.8185 | 1.3993 | <0.05 |
| Efficient | 1.1038 | 1.1549 | 0.3392 | |
| Inefficient | −0.5649 | 0.8934 | 0.5272 | |
| Syangja (Waling-5) | High | 3.0586 | 1.9765 | 0.0509 |
| Efficient | 3.9763 | 1.9706 | <0.05 | |
| Inefficient | 2.6513 | 1.7461 | 0.1289 | |
| Palpa (Bagnaskali-1) | High | 1.7191 | 2.6421 | 0.0304 |
| Efficient | 3.0846 | 2.6959 | 0.2526 | |
| Inefficient | 25.6955 | 0.7164 | <0.001 | |
| Janajati | High | −0.3625 | 1.6714 | 0.8283 |
| Efficient | 1.5318 | 1.8597 | 0.4101 | |
| Inefficient | −23.9599 | 0.7164 | <0.001 | |
| Dalit | High | −1.6731 | 1.5341 | 0.2754 |
| Efficient | 0.0326 | 1.5573 | 0.9833 | |
| Inefficient | 2.3456 | 1.2595 | 0.0626 | |
| Availability of water for year−round productive use | High | 1.1966 | 1.0925 | 0.2734 |
| Efficient | 1.5094 | 1.1359 | 0.1839 | |
| Inefficient | −0.0596 | 0.7442 | 0.9361 | |
| Non−educated persons in the household | High | 0.5534 | 0.5798 | 0.3398 |
| Efficient | 0.1668 | 0.6343 | 0.7926 | |
| Inefficient | 0.8334 | 0.4368 | 0.0564 | |
| Tap ownership | High | 0.7900 | 1.3144 | 0.5478 |
| Efficient | 0.0675 | 1.4161 | 0.9620 | |
| Inefficient | 0.2346 | 0.9281 | 0.8005 |
© 2019 by the authors. Licensee MDPI, Basel, Switzerland. This article is an open access article distributed under the terms and conditions of the Creative Commons Attribution (CC BY) license (http://creativecommons.org/licenses/by/4.0/).
Share and Cite
MDPI and ACS Style
GC, R.K.; Ranganathan, S.; Hall, R.P. Does Rural Water System Design Matter? A Study of Productive Use of Water in Rural Nepal. Water 2019, 11, 1978. https://doi.org/10.3390/w11101978
AMA Style
GC RK, Ranganathan S, Hall RP. Does Rural Water System Design Matter? A Study of Productive Use of Water in Rural Nepal. Water. 2019; 11(10):1978. https://doi.org/10.3390/w11101978
Chicago/Turabian StyleGC, Raj K., Shyam Ranganathan, and Ralph P. Hall. 2019. "Does Rural Water System Design Matter? A Study of Productive Use of Water in Rural Nepal" Water 11, no. 10: 1978. https://doi.org/10.3390/w11101978
Note that from the first issue of 2016, this journal uses article numbers instead of page numbers. See further details here.