Geospatial Information System-Based Modeling Approach for Leakage Management in Urban Water Distribution Networks


1
Computer Engineering, Shariaty University, Tehran 18918-16851, Iran
2
Geoformation Technology Center of Excellence, Faculty of Geodesy & Geomatics Engineering, K.N. Toosi University of Technology, Tehran 19697, Iran
3
Department of Computer Science and Engineering, Sejong University, Seoul 143-747, Korea
*
Author to whom correspondence should be addressed.
†
These authors contributed equally to this work.
Water 2019, 11(8), 1736; https://doi.org/10.3390/w11081736
Submission received: 22 June 2019
/
Revised: 10 August 2019
/
Accepted: 13 August 2019
/
Published: 20 August 2019
(This article belongs to the Special Issue Advances in Modeling and Management of Urban Water Networks)
Abstract
:The purpose of this paper is to model one of the urban network problems, the issue of water leakage. In order to manage water leakage, the specific area should be partially isolated from the rest of the network. As Geospatial Information System (GIS) is a powerful technology in spatial modeling, analysis and visualization of the water network management, a web GIS system for finding optimal valves to close in the event of an incident was developed. The system consists of a new GIS based algorithm for identifying the ideal valves to isolate the desired pipeline. The algorithm is able to identify optimum valves in a water distribution network in the shortest time by using the traceability in GIS web services. The system uses the functions of storing and managing the spatial data by expert users based on web 2.0 technology. The system was implemented and evaluated for Tehran’s district 5 water distribution network using Silverlight, C# and ArcGIS SDK (Software Development Kit). The evaluations demonstrated the accuracy of the algorithm and the operational viability of the system developed.
1. Introduction
The rapid technological and economic developments of the recent century have led to the emergence and expansion of a large number of human settlements across the world. However, for a human settlement to be called a proper city, it should contain the infrastructures necessary for comfortable living. One of the basic and yet most complex infrastructures needed in every city is a water distribution system, which can be described as a multi-source and non-directional network [1,2].
In the last few years, urban water network modeling has been boosted to face the new challenges of modern society. The challenges include, among others, leakage management of water distribution network and urban drainage systems. Despite immense progress in human technological ability, tens of thousands of one common leakage problem that regularly causes interruption in water supply is pipes bursting. Following a pipe burst, network maintenance personnel should be able to address the issue as soon as possible while keeping the number of affected citizens to a minimum. Although strong management of repair and maintenance efforts is of paramount importance, the method of choosing the fastest, and most effective way to solve the issue can also play an important role in this regard. This approach is quite time-consuming and error-prone.
A possible solution to improve the response time to such problems is the utilization of a Geospatial Information System (GIS) as an enhanced technology in the field of water distribution management. GIS technology can be used for spatial modeling of the urban water network and as an interactive user environment for daily water management tasks [3,4]. Given the spatial nature of the data used and generated in GIS, it can be used to effectively enhance water resource modeling. Another merit of GIS is its ability to determine the water network condition and capacity information from existing databases, transform them into a geo-analysis environment, and produce reports and graphic information accordingly [5].
With the rapid growth of Internet and online devices, there have been many successful efforts that take advantage of these developments to solve operational problems in different fields [6,7]. A web-based online system provides ubiquitous access to software data and utilities without needing to install any specific application, and can execute the operations requested by a large number of clients simultaneously [8]. At present, the majority of software applications related to water distribution networks are desktop-based and their data depend on the software version [9]. Considering the aforementioned issues, one may ask whether it is possible to develop a web GIS software with a flexible platform, multi-user capability, and proper upgradability.
This study provides a GIS based leakage management model to establish a partially isolated area from the rest of the water distribution network. In order to achieve the aforementioned benefit, we developed a web GIS application based on the Silverlight platform. This web application is founded upon a relational database, an intermediate layer for the management of geospatial information, two layers of web interface for customizing services, and other software components. This application consists of web services for managing, visualizing and storing geospatial data, support of the water spatial data model, and a GIS based algorithm for optimal burst pipe isolation. This web application was successfully tested on the database of Tehran’s district 5 water distribution network. This test demonstrated the operational viability of the application and its potential as a platform for future web-based solutions.
The rest of this paper is organized as follows. Section 2 reviews the previous works on burst pipe isolation and analysis, GIS solutions and related issues. Section 3 describes the steps of the present work, the system architecture, and its constituting services. Section 4 provides the details of system implementation and the related diagrams. Section 5 outlines the test details and provides the test results; finally, Section 6 presents the conclusions and some suggestions for future research.
2. Related Works
The internet is very much alive and kicking with regards to related works. The first generation of internet sites primarily gave information. Most people have become familiar with web 2.0, blogging, tagging, social networking and social bookmarking have paved a way to the next step in the development of the web. The next step was to the intelligent and omnipresent web 3.0. The Ubiquitous Computing System is a concept in software engineering and computer science, in which computations are performed at any location and time. Contrary to the computing of desktop computers, computational calculations can be done on any device, anywhere, and in any format. In this technology, the user interacts with the computer in a variety of shapes such as lobes, tablets, and everyday objects from a refrigerator to a pair of glasses. Ubiquitous Geographic Information Systems (UbiGIS) are geographic information systems that provide users or systems at any location, at any time, through GIS services [10]. With the advent and expansion of Web 2.0, the user no longer needs to passively accept the author’s limited information, and can also work with customized online maps [11]. For example, a user can utilize the Open Geospatial Consortium (OGC), a Web Map Service (WMS), and Google API (application program interface) interface to integrate geospatial data provided in different sources and generate a web 2.0 online map in the form of mashup [12] or mapping hack [13].
At present, Web Mapping 2.0 has been expressed as citizen science and social media geotags. Additionally, the web contents produced by Twitter or Flickr communities is more than just Big Data [14] and has generated a new paradigm for socio-spatial research [15]. This paradigm, which Lansley and Langley call the Twitter geography, has been successfully used in recent geography studies. Initially, Web 2.0 maps were used only in graphical representations of the results at the end of the research. However, as data representations became more dynamic and online maps became more detailed, Web 2.0 maps became a part of the research workflow [16,17,18].
Web GIS is the product of the combination of GIS with Internet and can be considered a major development in this field. In its essence, Web GIS is a type of Dynamic Web Application [8]. One of many ways to implement Web GIS is the use of Silverlight. Silverlight, as a cross-browser and cross-platform plugin, has served as a platform for a new generation of rich interactive applications based on NET-media experiences [19]. In the traditional web development paradigm, the only task of the browser was to display information, and the extraction of the data requested by the user from the database was a task of the server, but this arrangement does not meet the requirements of Web GIS. The use of Silverlight in web development enables the user to experience and work with new multimedia, images and graphics [7]. Vaitis et al. designed a spatial database and a web-GIS application based on Silverlight in order to visualize and analyse the Greece climate data [20]. In another research, WANG and LI utilized the GIS data processing capability to implement a web-GIS tourism system [21]. The study carried out by Vitianingsih et al. provided a web-GIS application based on Silverlight to indicate the mapping of roads with heavy traffic [22].
One of the areas where the features of Web GIS can be used to address an urban management problem is the water distribution network. Several investigations on Iranians abilities in maintaining and managing the water resource throughout the history have been done [23,24]. According to these surveys, renewable water per capita in Tehran is now reaching a critical threshold level. Moreover, due to old water pipe systems, a significant fraction of the treated water is leaked. In order to predict a burst pipe in urban water distribution in Tehran, Alizadeh et al. evaluated a data driven model. Based on the result, Gaussian Process Regression performed better than Grasshopper Optimization Algorithm-based Support Vector Regression and Artificial Neural Network [25]. In addition, Motiee and Ghasemnejad applied four statistical models to evaluate pipe vulnerability variables with the goal of discovering equations to predict likely future pipe accidents [26]. Moreover, Tchorzewska-Cieslak et al. proposed a possibilistic model for analyzing the failure risk in water supply network. The technique described was based on the fact hypothesis (Shafer) which was based on the notion of the incorrect probability, which incorporated the distribution capacities of its own Fuzzy Set function. This model is useful when the risk factor data are uncertain or incomplete [27]. A typical water distribution network consists of many components including water pipes, valves, etc. The major problems of a water distribution network are pipe bursts and leakages, and the consequent disruption in citizen access to water. Therefore, following such events, immediate steps should be taken to isolate the failed pipeline by closing the linked valves in order to prevent water loss and replace the damaged pipe as soon as possible. Naturally, it is unwise to close the valve of the main sources because that will affect all consumers served by that source, including the critical buildings. Therefore, closing the valves in an optimal way to minimize the number of affected buildings is of great importance. The burst pipe analysis and emergency repair have been the subjects of much research.
A review of literature shows that a number of studies have proposed different algorithms for optimal valve closing at the site of pipe burst. These include the study of [28], where the genetic algorithm was used to find the shortest path, and thereby the valves that should be closed following a pipe burst incident. By simplifying the scale of the problem and dismembering the complex pipeline into a simple network structure, they increase search effectiveness. Ouyang et al. [29] also developed a valve-closing optimization algorithm and implemented it using the ArcEngine. The study carried out by [30] provided another such algorithm that operated based on the status of check valves. Jian-chuan et al. and Jiankang, W.J. [1,31] developed other such algorithms by optimizing and modifying the BFS (Breadth-first search) algorithm. Despite the variety of works carried out on this subject, the present study was the first to implement its proposed algorithm based on a web platform to allow simultaneous use by a large number of users.
3. Architecture and Development Stages
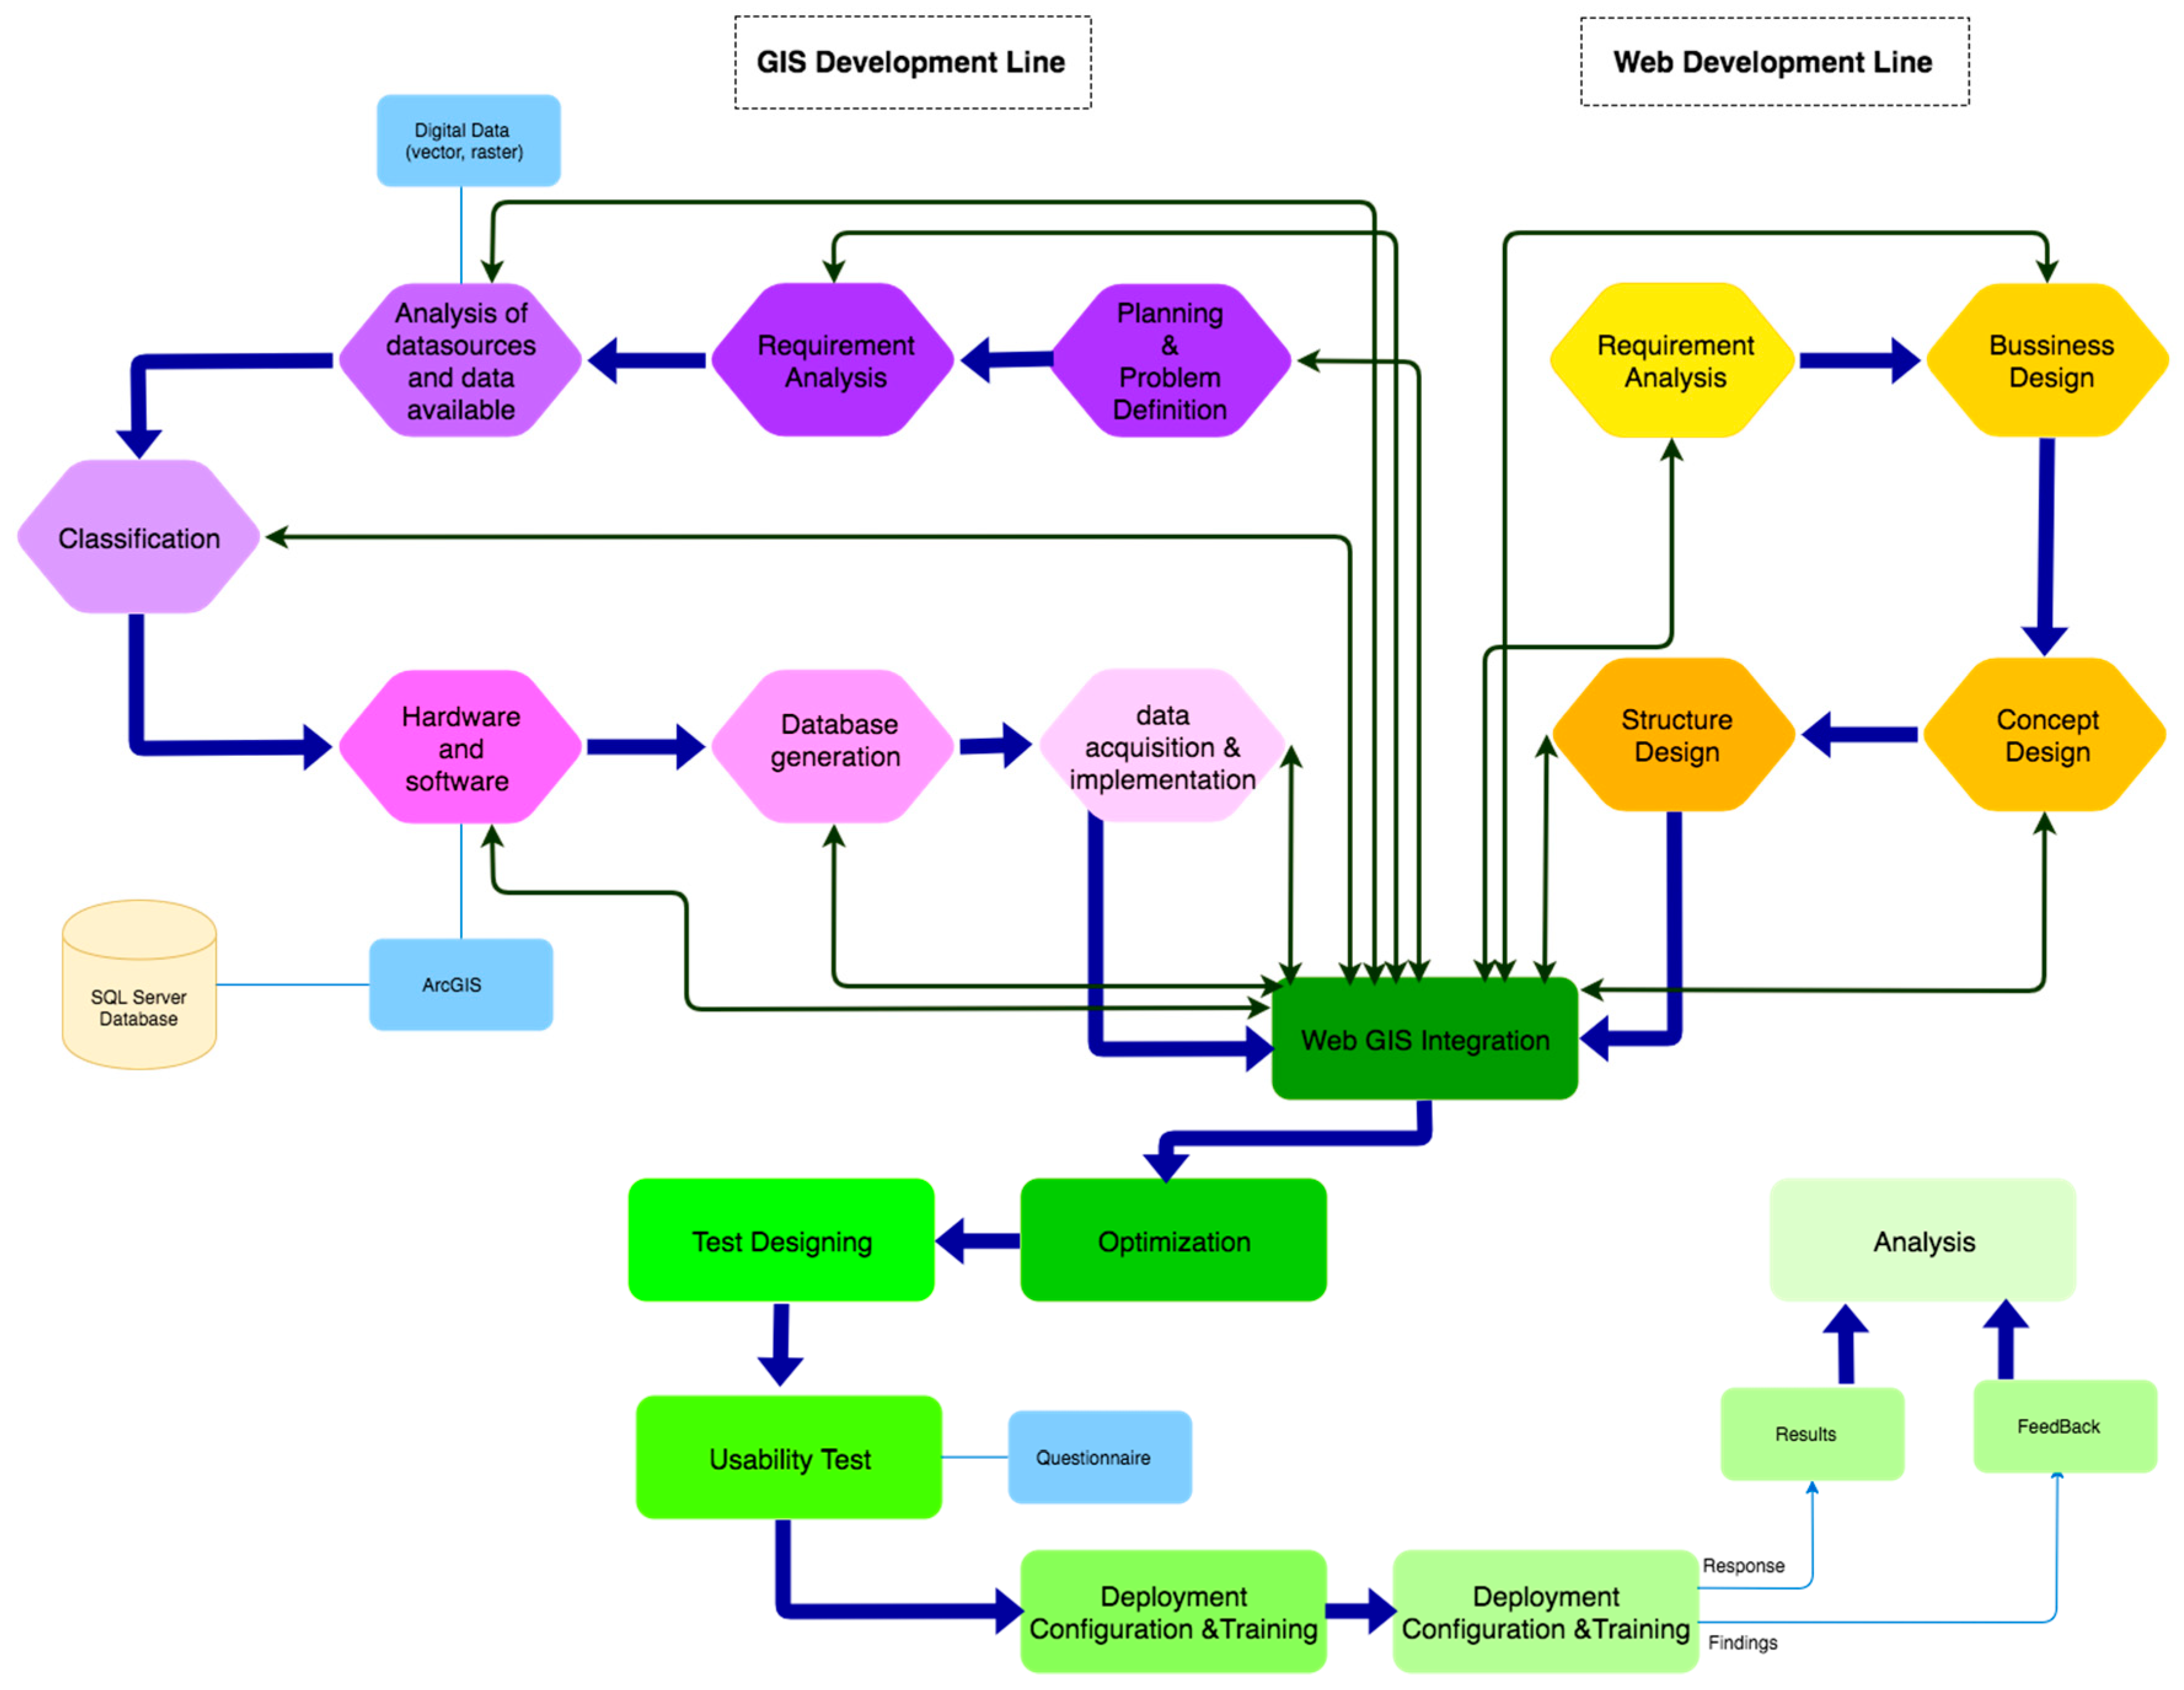
The web application development stages are illustrated in Figure 1. The development stages of Web and GIS sections started at the same time and joined together at the Web GIS Integration stage, where they proceeded as a single integrated implementation process. In the end, the implementation was evaluated by a number of tests, the test results were reviewed, and the overall conclusion regarding the web application were presented.
The authors decided to support all system components with three web services. In this system, data transfer was asynchronous. The web services included in the system are described in the following:
3.1. Web Service for Managing, Visualizing and Storing Geospatial Data
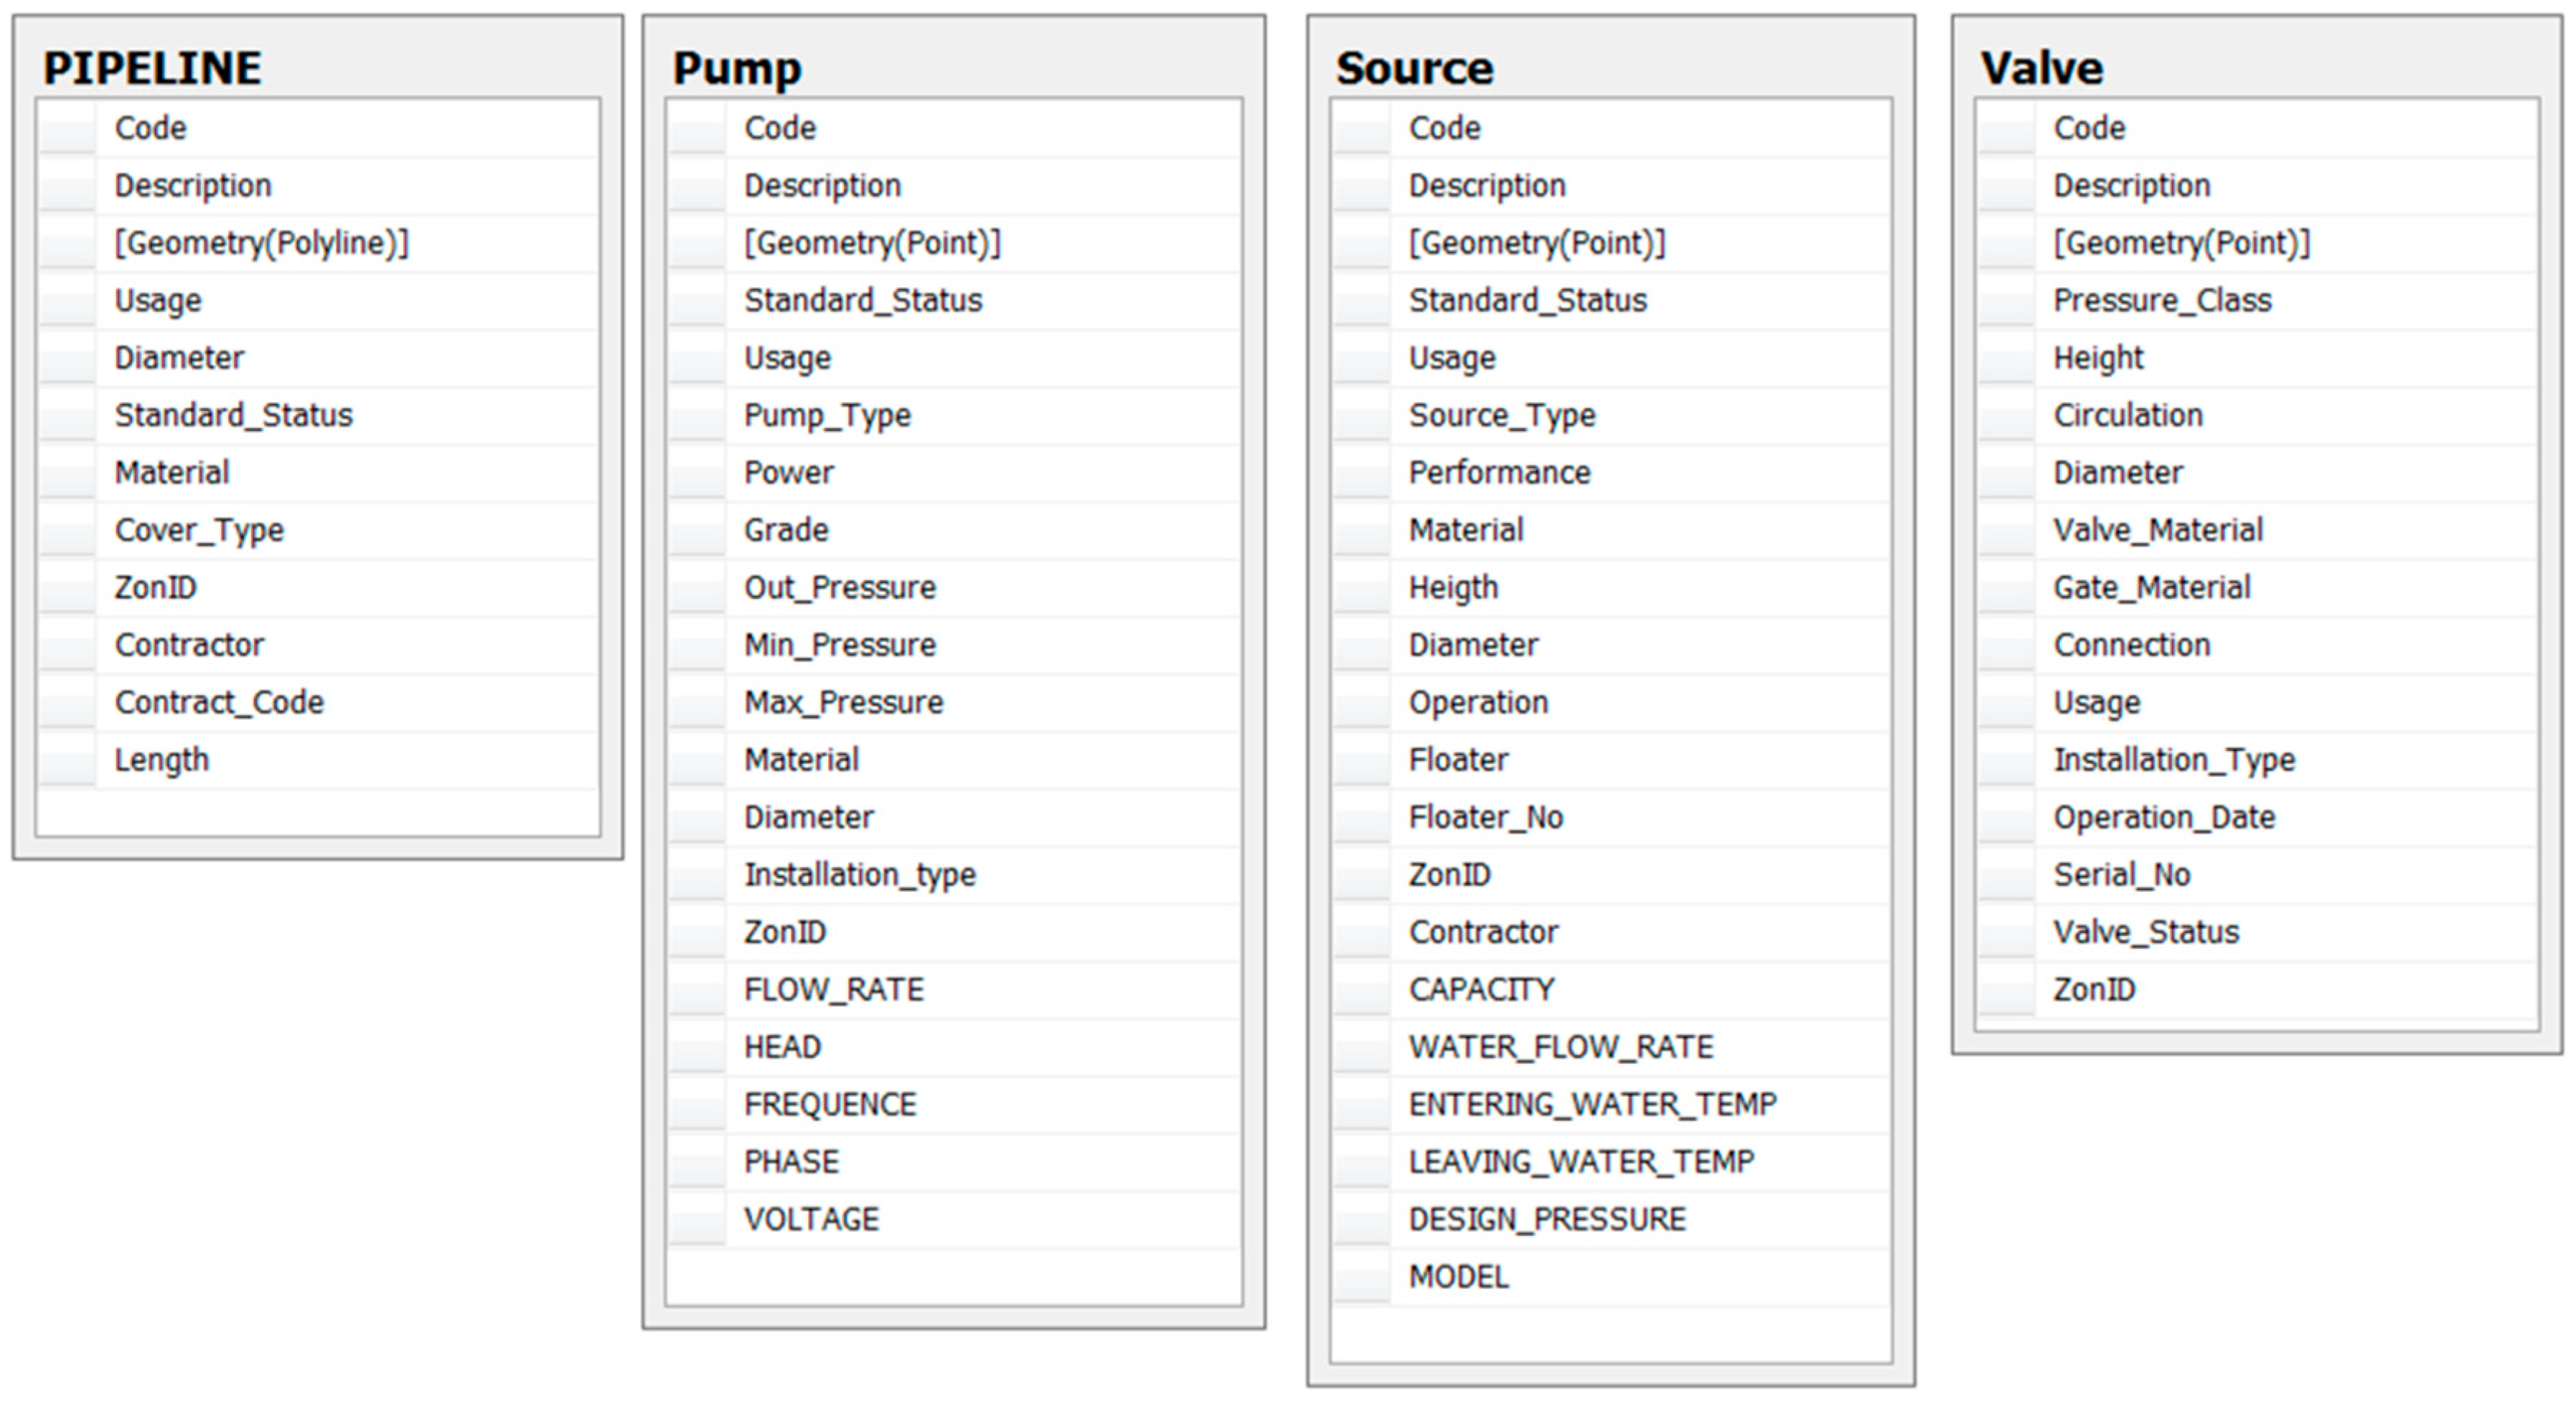
This web service operates based on two components: (1) a relational database called Water Spatial Database Engine (WRSDE), which was created in Microsoft SQL Server; (2) ArcGIS Server with 9 geospatial vector layers. The WRSDE database contains data elements with labels pump, valve, pipe, and flow source as well as their Attribute Table. The water network data model is shown in Figure 2. According to the data mode, each layer contains a code, description, and a geometry field to save the necessary information. The pipeline layer, contains some specific fields like diameter, usage, cover type, and material. Fields like pump type, power, head, phase, and voltage are specified for the pump layer. The source layer has capacity, height, floater, floater type, and model as well. At last, the valve layer has diameter, material, serial number, and gate material. The ArcGIS Server developed by Esri (Redlands, CA, USA) is a software application for sharing the data of geographic information system [32]. Here, ArcGIS Server used the WRSDE database to create and manage GIS web services, applications, and data. The main task of ArcGIS Server was to serve as an intermediate layer for linking the WRSDE relational database to the developed web services.
3.2. Web Application for Supporting Water Resource Modeling
The web application user interface must provide user access to web tools and services. Here, the user interface provides the tools for using nine geospatial vector layers that display the components and structure of the water network and sources. This user interface has a tool for viewing the points that are critical for the isolation of any given section of the pipe system, a number of tools for modifying features and markers on the map, and a section that shows a list of active layers and allows the user to activate/deactivate the desired layers. The elements provided for the visualization in the web application consists of multiple types of geospatial data. Geospatial objects are represented by their geographic information and their corresponding attributes. Water pipes are of polyline type and are represented by certain attributes such as code, label, name, diameter, material, ID, etc.
This web application has a 3-layer architecture. The Presentation Layer is the visible and interactive component of the application and is in direct contact with the user. This layer was designed with Silverlight to take advantage of its technological merits including high compatibility, cross-browser and cross-platform features, variety of media experiences, support of rich interactive applications, flexible programming, low cost, fast speed, and other technical specifications [33,34]. The business layer is responsible for running and organizing all processing routines of the software application. Based on the software requirements, this layer creates an interface called I[BizName]Service and implements a class of this interface, where the processing routine will be called. For the internal modules such as feature editing operation, the module will be created in the form of a class library and will be called in the desired business class. The Data Access Layer provides a mapping of database structure in the software application. Here, the data model was implemented by the use of Entity Framework technology. In the application, this layer is utilized by implementing the desired table model in the class structure and creating a DbSet from the table model.
3.3. Web Service for Valve-Closing
The web application provides a tool for identifying the valves that should be closed to isolate a certain pipe in an optimal way. The web service responsible for this operation utilizes an algorithm for this purpose. Details and method of implementation of this service and its algorithm are described in the next section.
The selected architecture covers the key requirements in terms of size, performance, and runtime. Experience has shown that the selected architecture allows approximately 50 users to simultaneously use the application. It should however be noted that this estimation does not account for hardware and network constraints and is based on the assumption that an ideal platform is in place. The proposed system can also edit, remove, and create features and markers, and identify optimal valve-closing (pipe isolation) solutions in a reasonable time. These features are irrespective of hardware and network constraints. Because of the web-based nature of the software application and the use of Silverlight, this application can be executed by any online device containing a standard web browser with Silverlight plugin.
The quality of the developed architecture can be examined in terms of extensibility and security. The main patterns employed in this architecture contribute to the extensibility of the software application. Furthermore, because of component-based nature of this architecture, components can be extended without much dependency or change in other layers. In general, security segments are provided through .NET authentication mechanisms, and the Web map service is provided by the use of tokens.
These technical specifications have provided a strong technical support for the extension of burst pipe analysis Web GIS service. In this web application, the ability to visualize different map layers and perform desired operations on the desired layers are provided by the use of web map services (WMS). The interface of the application contains several segments, most notably a layer list, where the user can activate/deactivate the desired layers, and a Pipe-Isolation tool, which allows the user to identify the valves that should be closed to isolate a certain point or section.
4. Implementation
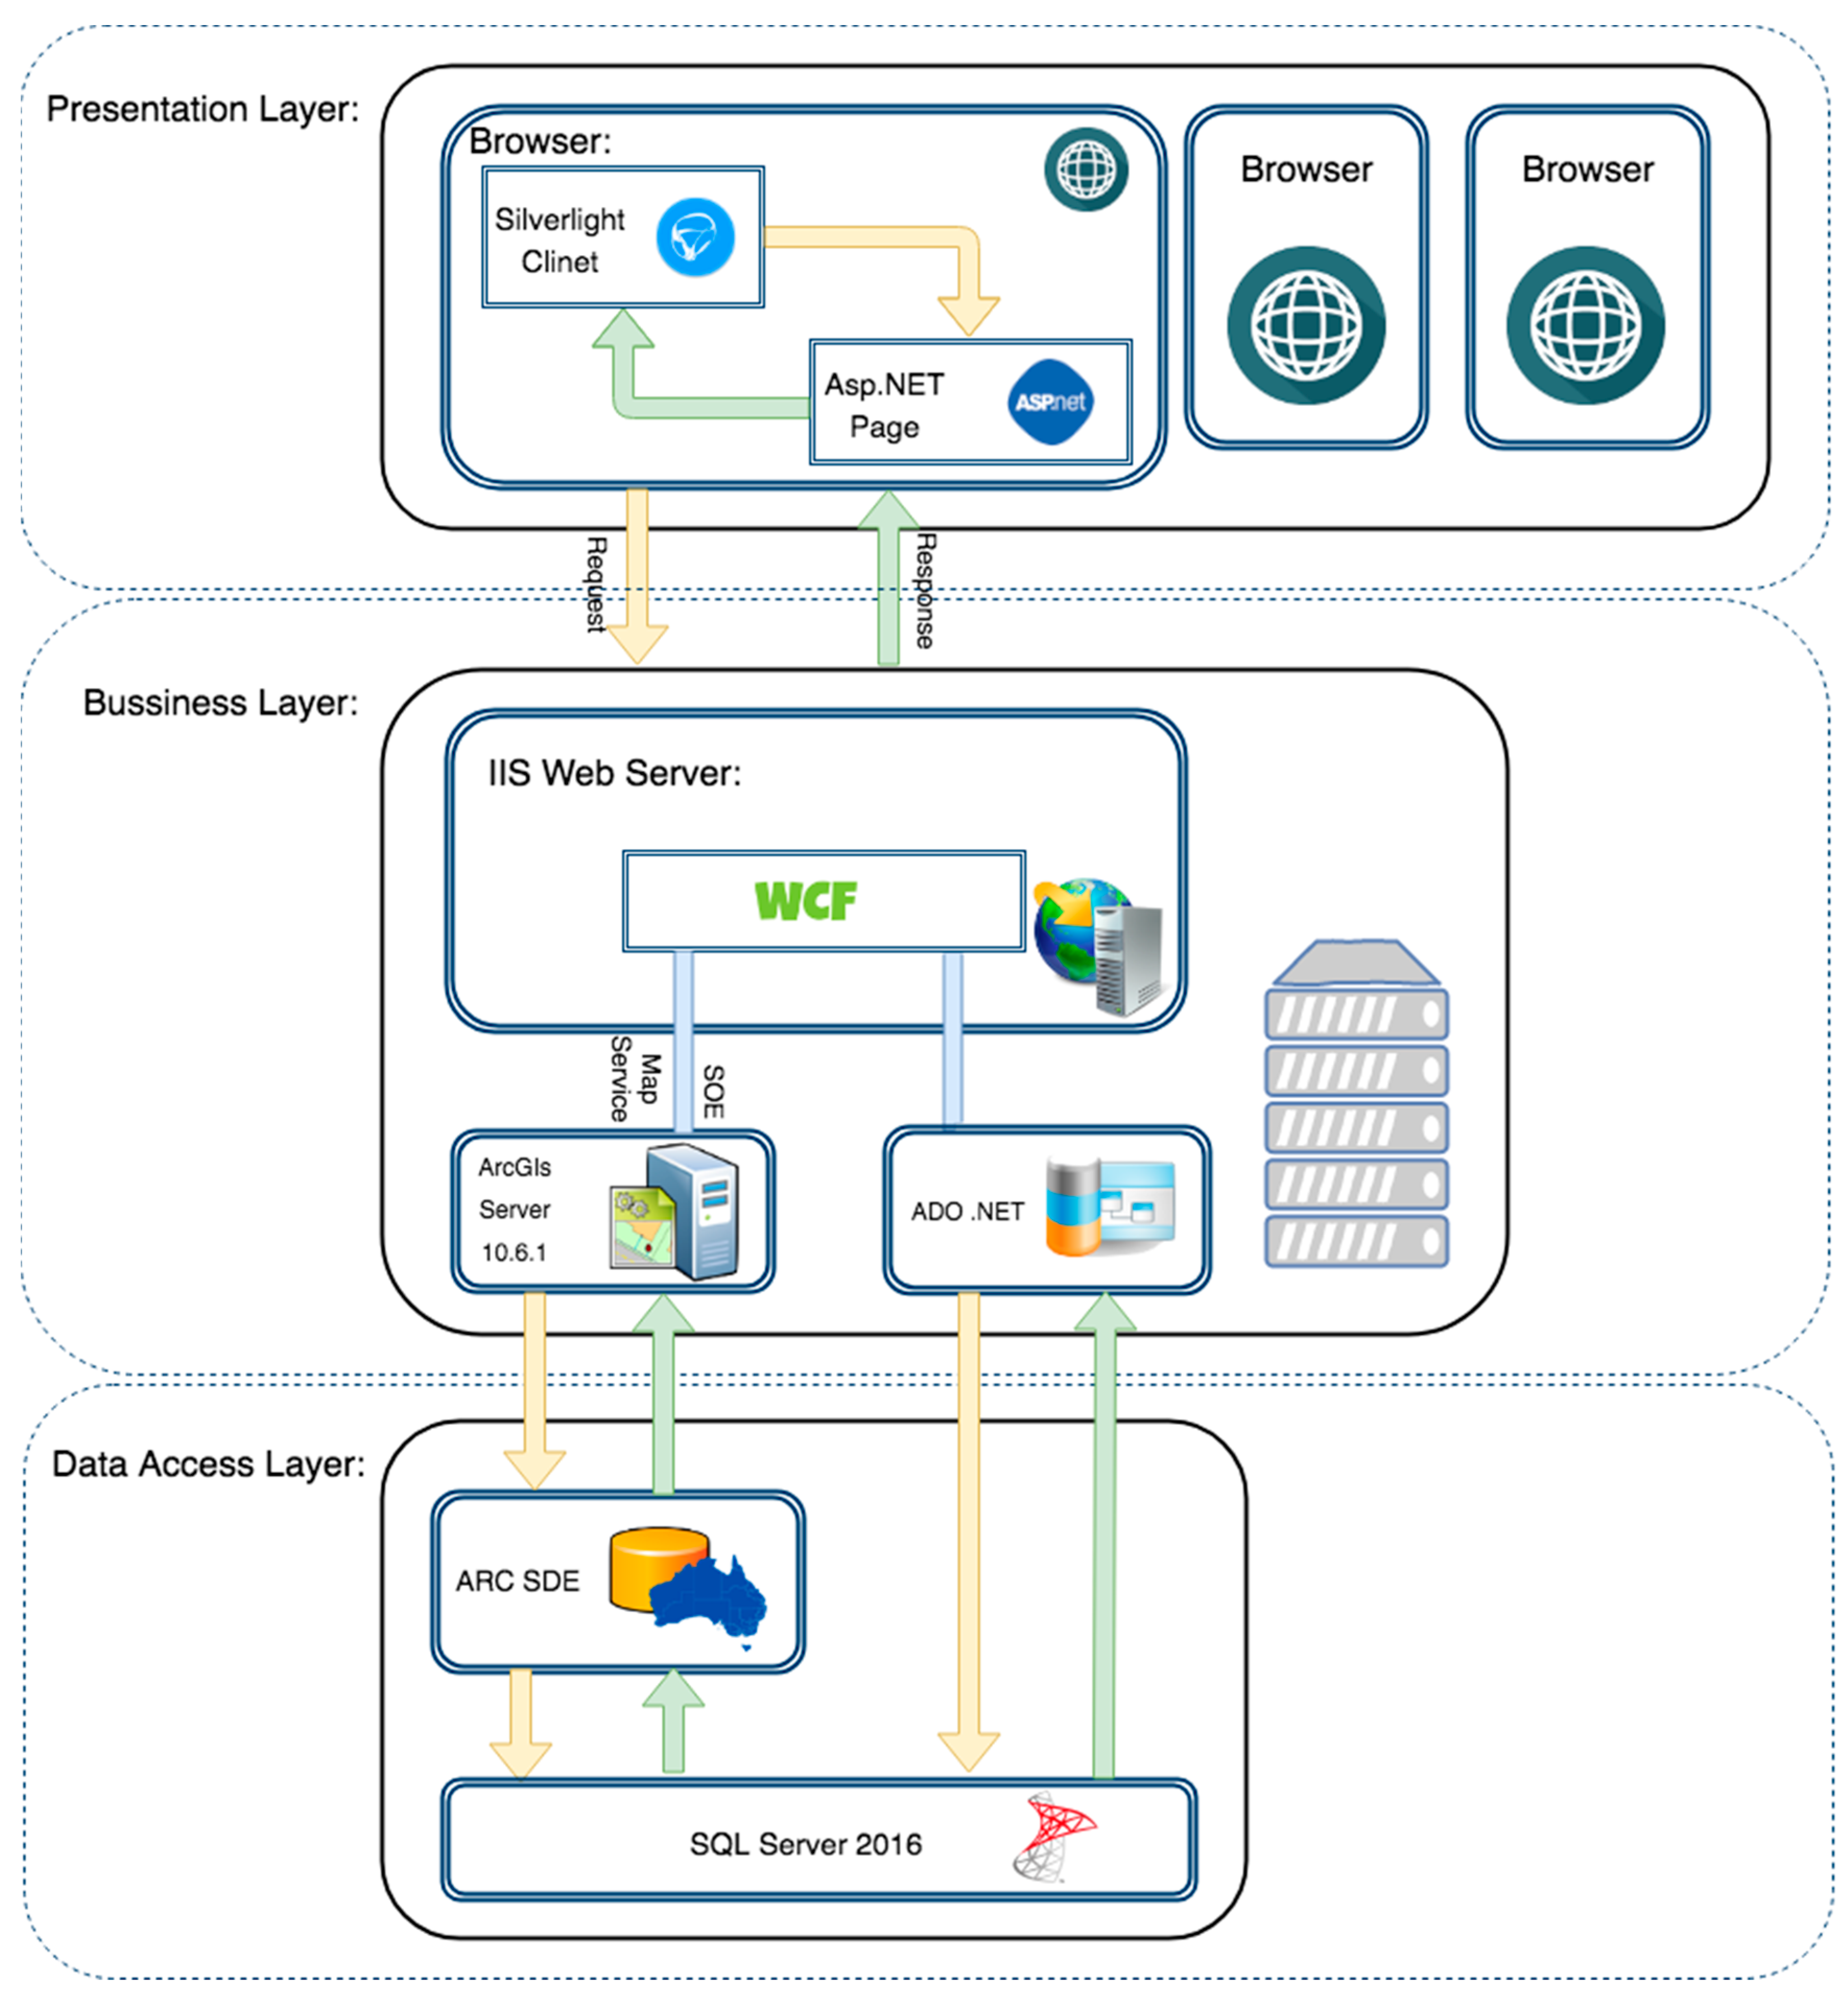
This section describes the method of implementation of the developed valve-closing service for Tehran’s District 5 water distribution network. The algorithm was implemented using ArcGIS for Silverlight SDK, Silverlight, ArcGIS Server, and Visual Studio 2015. As outlined in Section 3, the system was based on a three-layer architecture. Figure 3 illustrates an overview of the system architecture and its interactions with other components.
When a user logs in, the system sends a map display request to the main server. The user can then use the editing tools to edit, delete, or add a feature or marker on the map. Upon the use of this tool, the system sends a request through WCF to the main server and then connects to the ArcGIS Server by a map Service address in order to perform the requested operation. The user will be notified of the result via the same path. When the user clicks on the Pipe-Isolation tool and selects the pipeline that should be isolated, the system sends the information of the selected pipeline through the webService to the main server. At the server, the system uses the database to collect a list of associated valves and sources, and then uses the SOE (Server object extensions) to connect to the ArcGIS Server and analyzes the network on the map. Server object extensions (SOE) allow users to create service operations to expand the base functionality of map or image services. SOEs are suitable if customers have to conduct some well-defined business logic that is not readily achieved using ArcGIS client APIs. Most SOEs do this by utilizing custom code to work with geospatial data and maps [32]. With the list of valves and sources, the system then runs the valve-closing algorithm on the main server side while maintaining a connection through the SOE to the ArcGIS Server as long as needed. This operation continues until the algorithm ends. Finally, the list of valves in the algorithm solution will be sent through WCF to the browser in order to provide a visualization for the user.
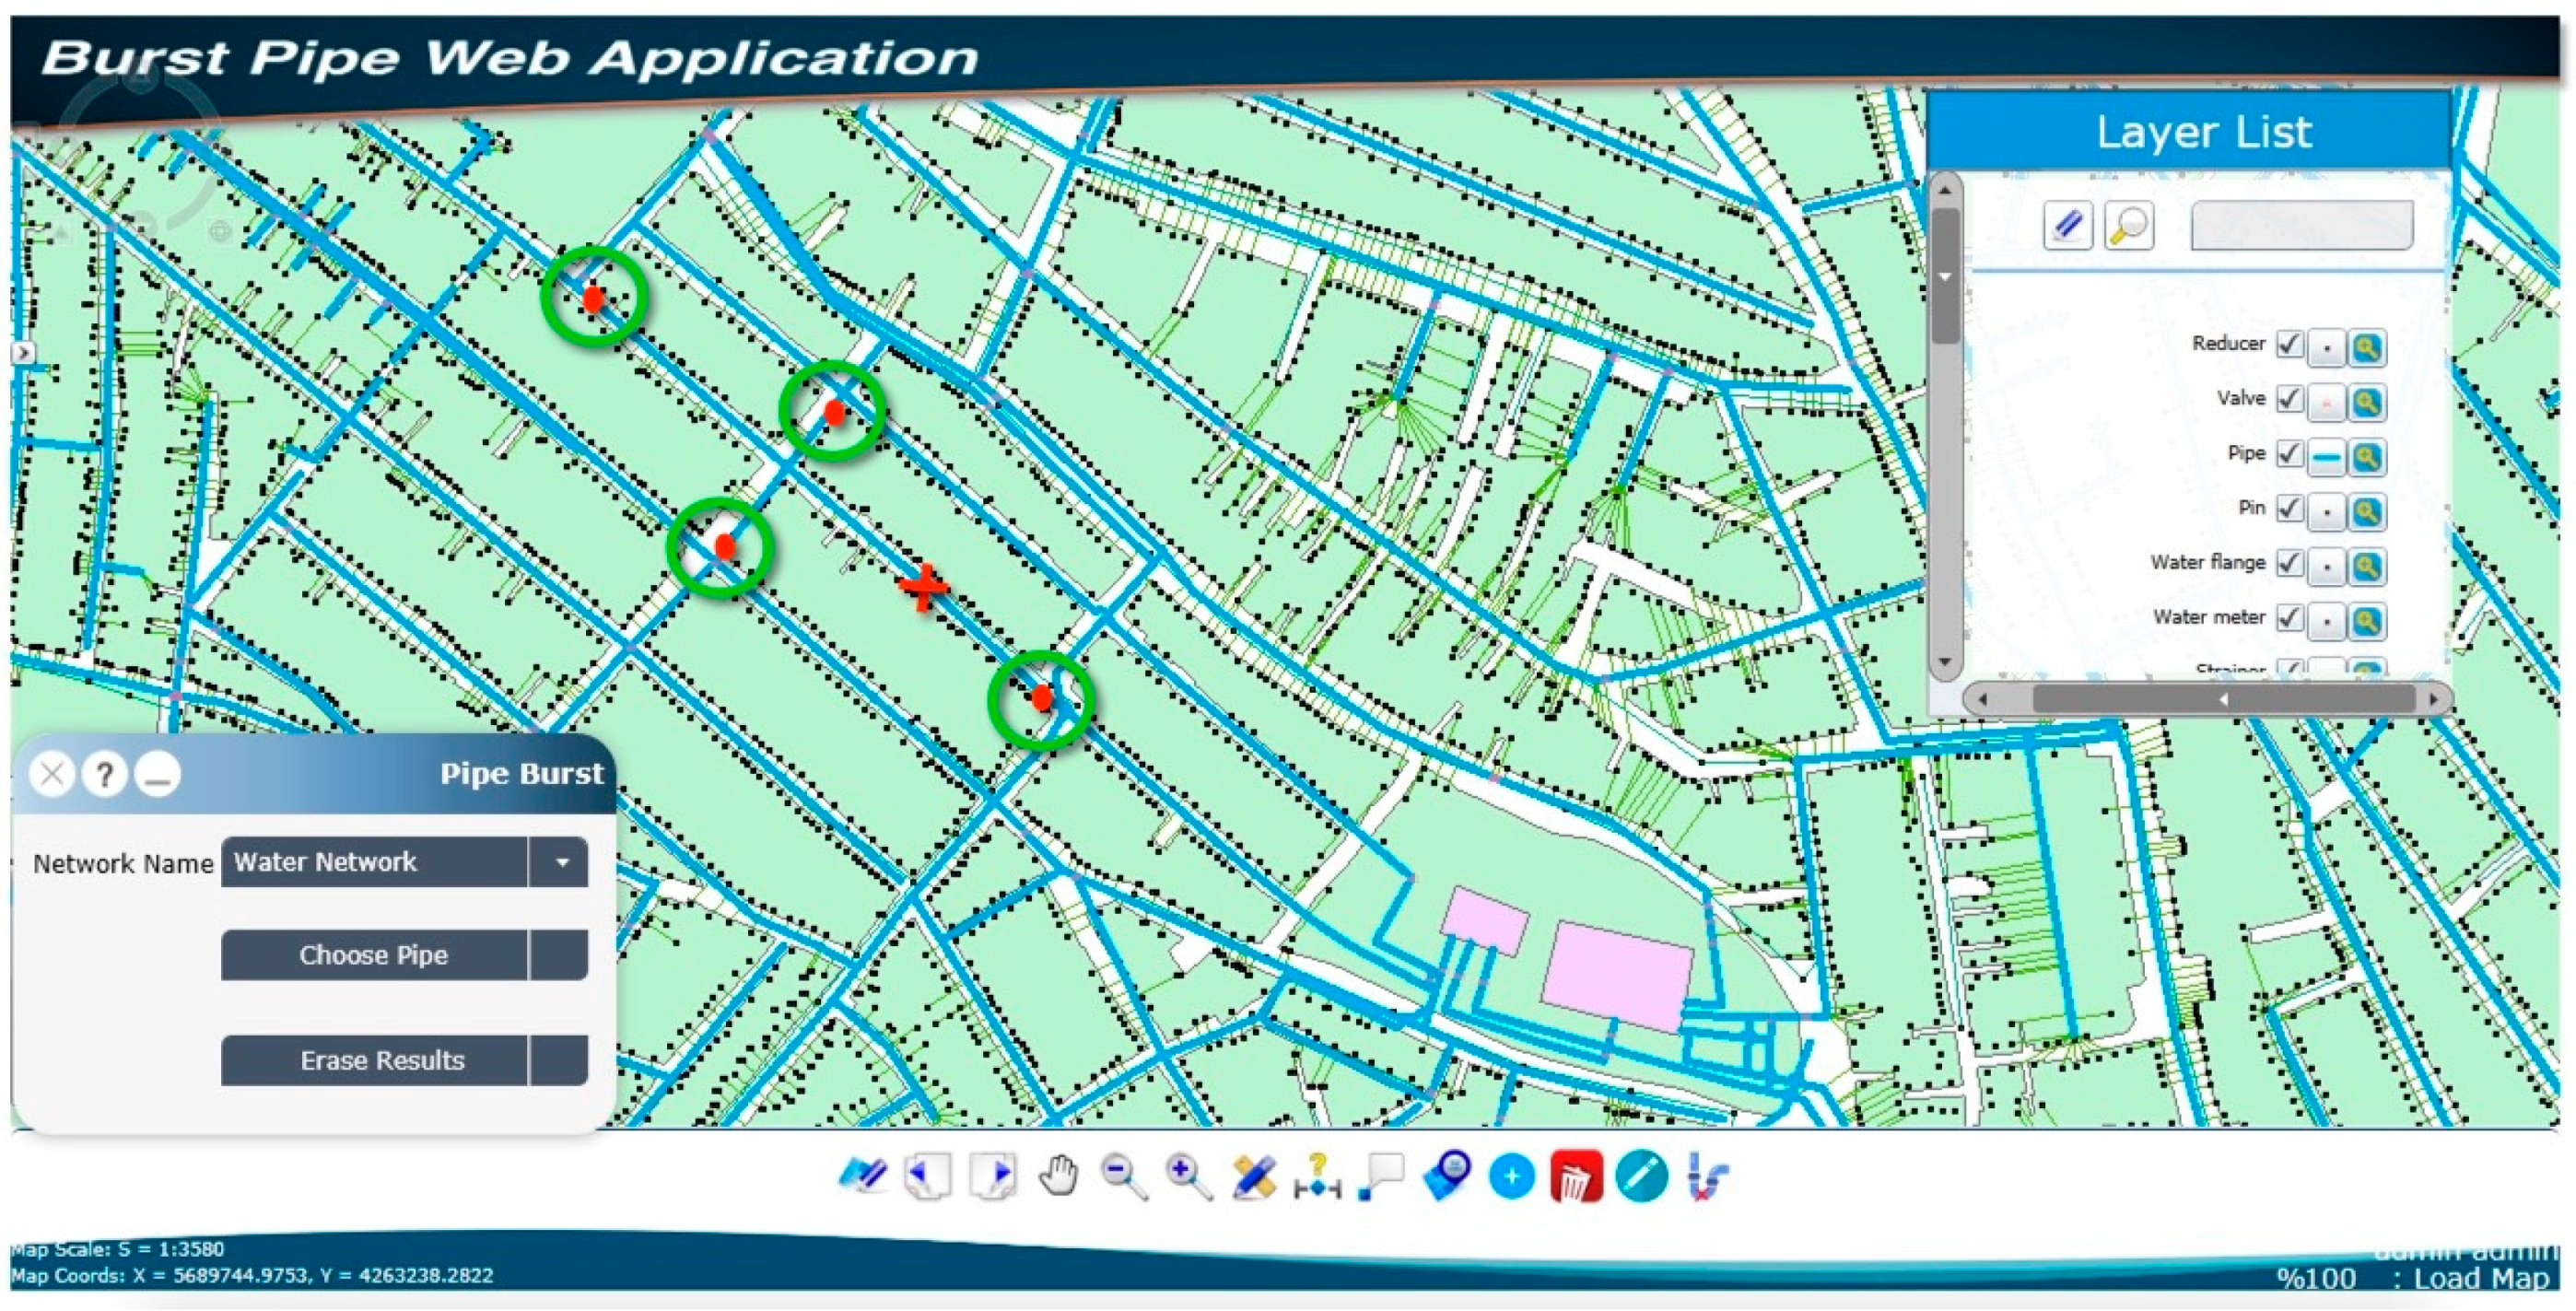
Figure 4 shows the map of Tehran’s district 5 water distribution network and an overview of the tools included in the interface. As mentioned, the interface included a Layer-List for activating/deactivating any combination of layers as needed, some tools for editing, removing and adding features and markers, and the Pipe-Isolation tool. In addition, Figure 4 shows a view of the area in the vicinity of a damaged pipe. The burst pipe is located in the section marked with *. The system selects this section as the point of interest and marks it as the burst point.
To illustrate the algorithm more accurately, a schematic design of the water network is shown in Figure 5. In this schema, the green circle is the source point, the gray icons are the valves, and the black lines are pipes. The algorithm input parameter is the burst point. The system starts tracing upstream from the burst point to the related source point and finds the valves in this path. Once the Trace operation is completed, the system will find (several) potential valve(s). The candidate valves in Figure 5 are 1, V2, V3, V4, and V9. Since the trace output is out of sorts, the system will select one of the valves randomly and start the trace from the valve to the burst point. If the trace operation finds any valves in this trace, the current valve will be removed from the final list. In this scenario, the system selected the valve V2 and started tracing. The valve V1 was found in the path, so the V2 would be removed from the final list. Afterwards, the valve V1 would be selected and the system starts tracing from V1 to the burst point. Since no valves were found in this operation, V1 would be added to the final list. In the next step, the system would use V4 for tracing. Because there are no valves in this path, V4 will be added to the final list too. This operation will be done for V3 and if valve V4 is found in the trace result, thus V3 will be deleted from the final list. V9 will be processed like other valves and will be added to the final list. As no more candidate valves exists, the system traced downstream from the burst point and found the candidate valves: V5, V6, V7, and V8. The aforementioned operations will be done for the current candidate valves and V5 will be appended to the final list. When there won’t be any candidate valves from the downstream operation the algorithm is finished. Finally, the valves in the final list will be exported as the list of valves that should be closed to isolate the damaged pipe.
5. Test and Results
The developed software was deployed on a server with 16 GB of RAM (random access memory), 200 GB of hard disk, Windows Server 2019 operating system, and was successfully tested for Tehran’s water network data. The main objective of the test was to evaluate the accuracy of the output of the pipe-isolation tool and the system’s ability to support real-time multi-user activity. To embed Tehran’s water distribution network in the application, it was modeled as a web service. In addition to the current application, any other software application with the ability to use WFS or MapService could connect to the map server and manage, modify and update the geospatial data. This feature demonstrates the flexibility of the system components and how conveniently they can be connected and integrated with other applications.
To evaluate system accuracy and its multiuser service capability, 32 experts on water networks were asked to use the system simultaneously for 10 h. The objective of this test was to check the stability of the web application, its capacity to serve multiple users simultaneously, and the accuracy of the pipe-isolation operation. All participants had the same access to the application and were asked to undertake the following activities:
- Use the services to search and download any desired variety of maps and manage, view, and store geospatial data
- Use the services to draw, edit and delete geospatial objects and their attributes
- Use the provided pipe-isolation tool to find the optimal valve-closing solutions for any desired section of the water network
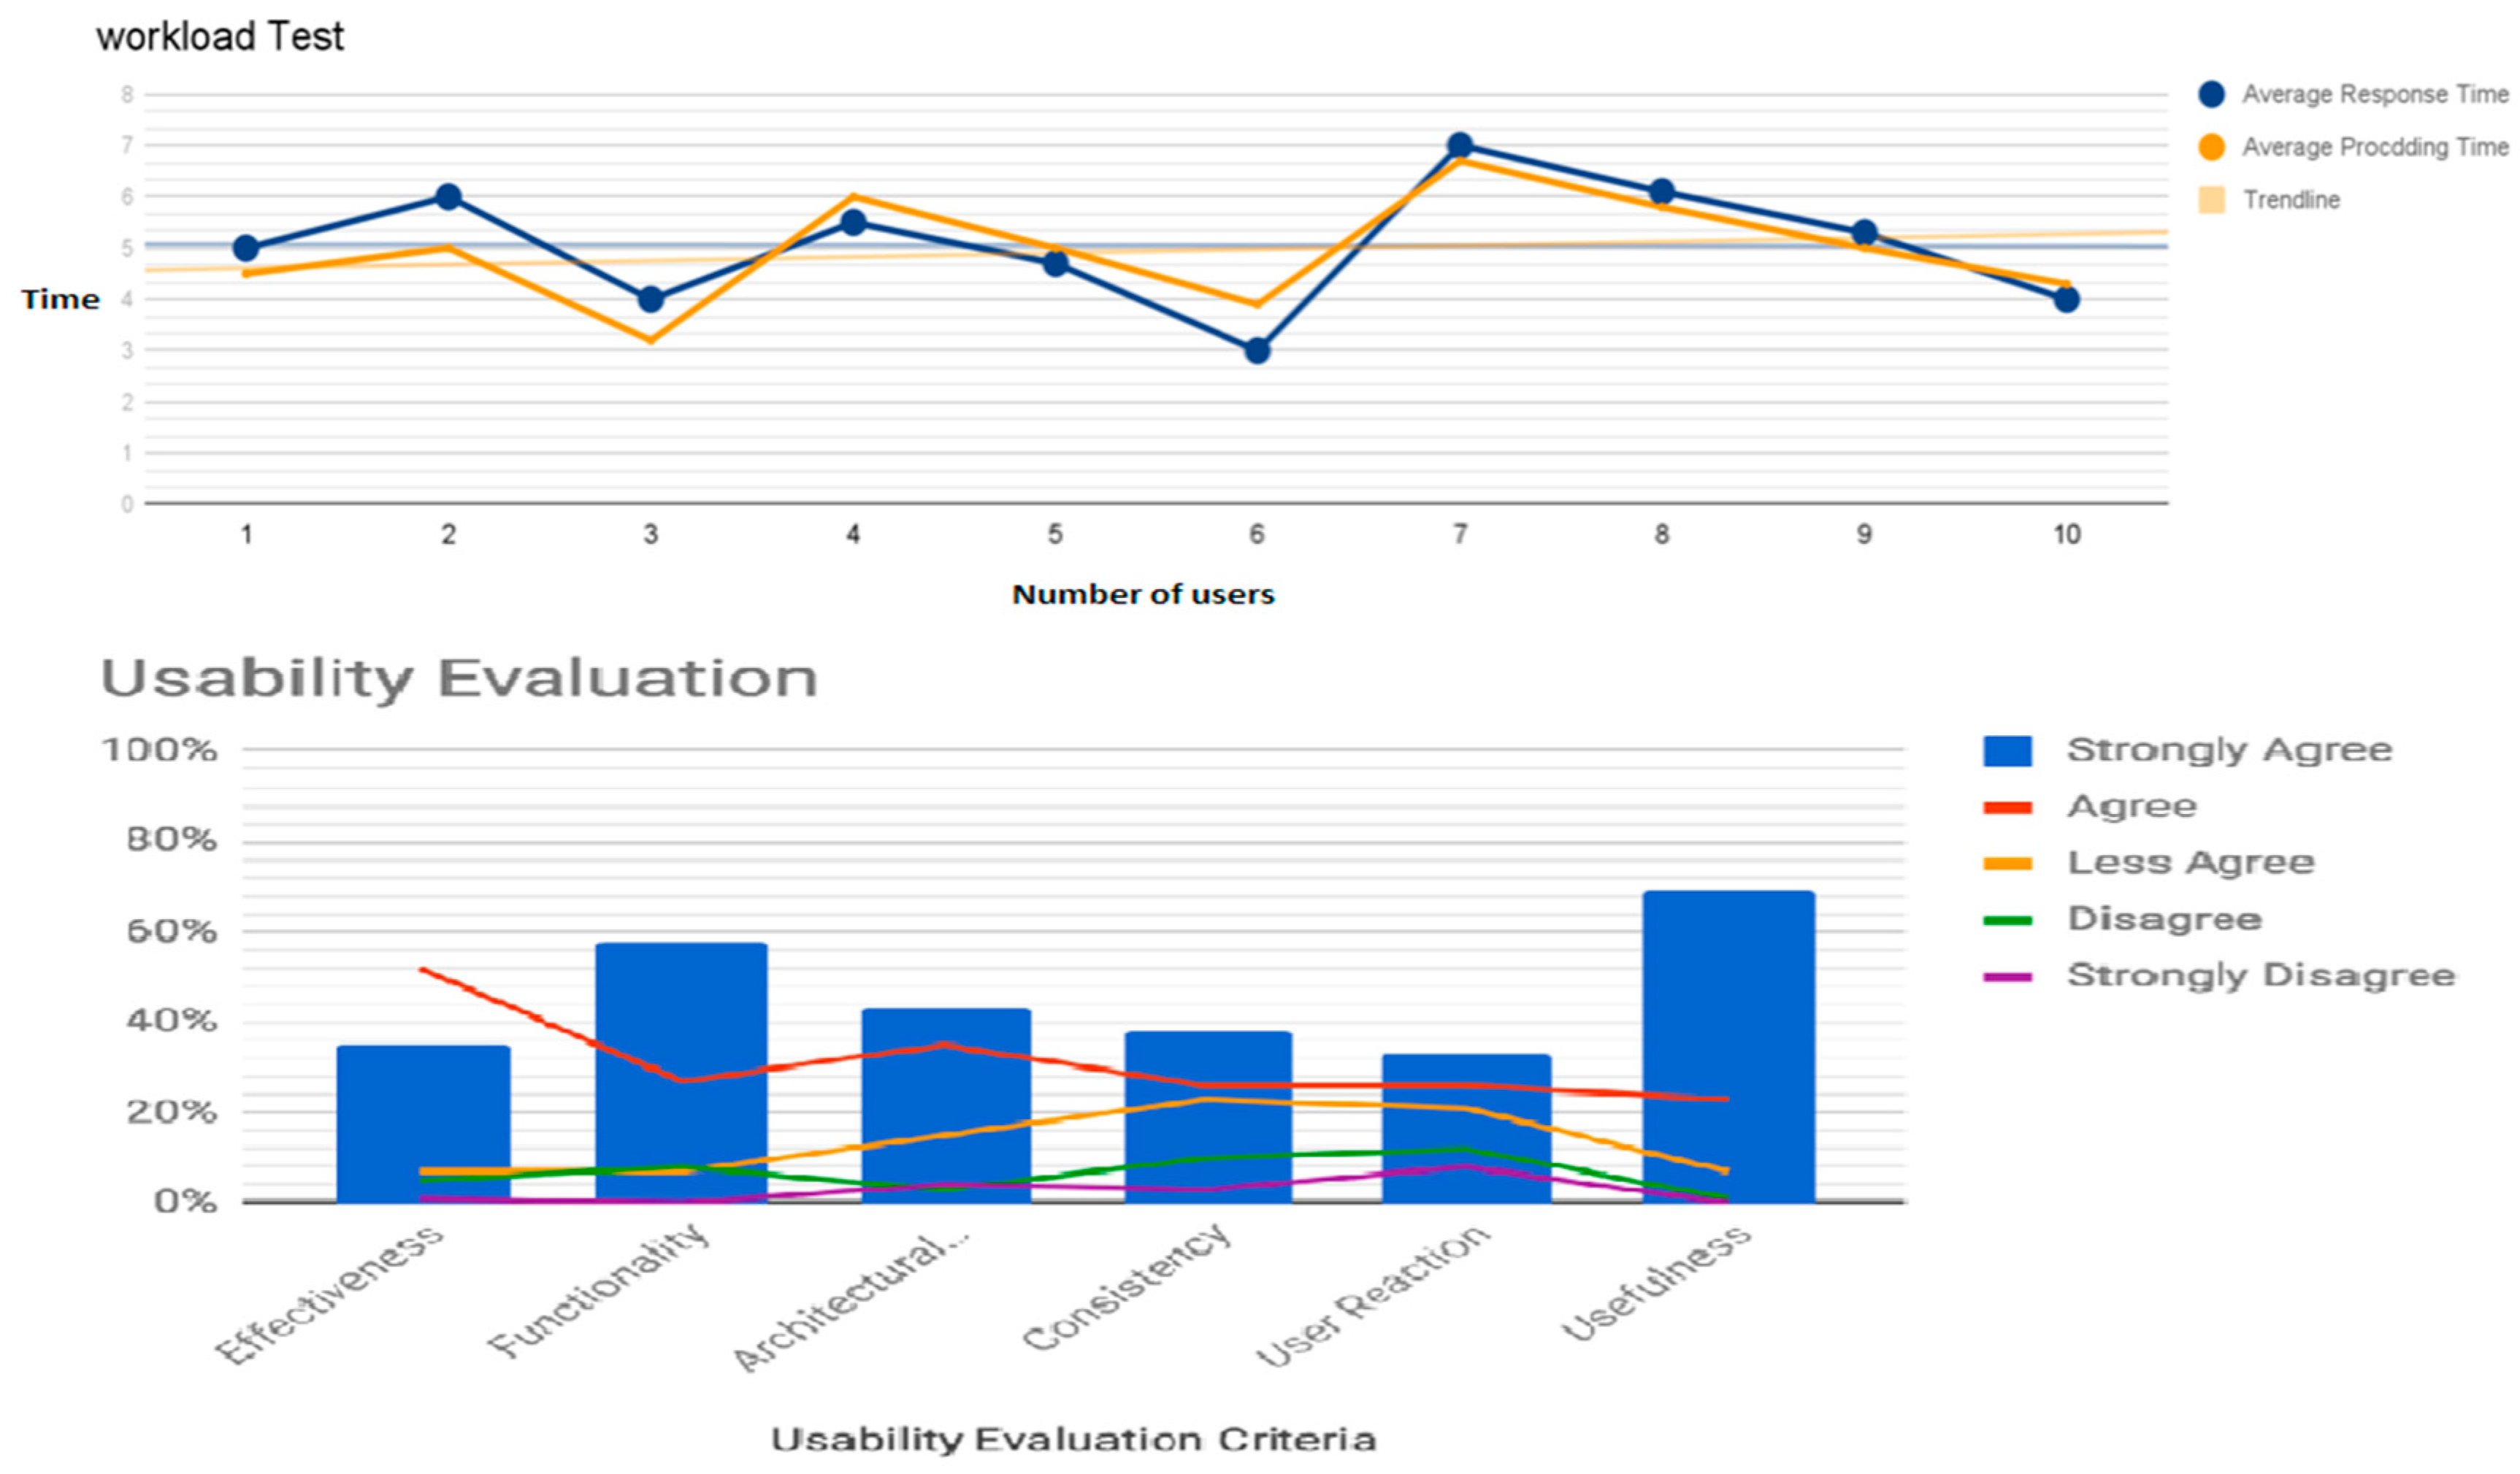
Before the test, participants received training on how to use the application and increase the workload when the system was in simultaneous use by multiple users. The test results demonstrated the system’s ability to respond to simultaneous requests of multiple users to manage, visualize and store geospatial data. As expected, the services exhibited a satisfactory performance in performing the search, visualization and download operations requested by multiple users. Additionally, the performance of the pipe-isolation tool was tested simultaneously by multiple users. The tests were performed first for the simple sections of the network and then for the more complex sections, and the solutions were checked and approved by the experts. Despite system use by multiple users, there was no interruption in searching, downloading, managing, and viewing maps and storing geospatial data. Figure 6 shows the result of this test based on Average Response Time and Average Processing Time.
As can be seen, the test results were satisfactory and the low slope of the graph indicated the system’s ability to provide simultaneous support to multiple users. For further evaluation of the system, test participants were asked to fill out the usability evaluation questionnaire developed by [35]. As shown in Figure 6, 35%, 58%, 43%, 38%, 33% and 69% of participants expressed a strong positive opinion with regard to Effectiveness, Functionality, Architectural and Visual Clarity, Consistency, User Reaction, and Usefulness of the system, respectively.
The performance of the valve-closing algorithm was further evaluated by the use of sample data provided by [29], who introduced an algorithm for the same purpose. After executing the present algorithm with the aforementioned data, the results were found to be identical to the results reported in that article. From these tests, it can be concluded that the application is stable, operationally viable and can support multiple users simultaneously under a heavy workload. A number of other system functions including system performance and other features were not evaluated.
6. Conclusions
This paper modeled leakage management in an urban water distribution network using the GIS based algorithm to detect the valves that should be closed to optimally isolate a burst pipe. The GIS based model can improve repair and maintenance operations. By using this GIS algorithm, a web GIS application was developed with access to multilayered maps and the ability to edit, create, and delete features and markers. The provided algorithm is also applicable to other networks with similar characteristics, such as gas distribution networks. The results obtained from the accuracy evaluation test, workload test, and usability questionnaire showed good accuracy of the proposed algorithm and the desirable qualities of the developed web application. To improve and accelerate pipe repair and the maintenance operation, the presented system can be linked to hardware sensors mounted on pipe valves so that they could be closed automatically. The system can also be implemented using the ArcGIS JavaScript API. For further development of the system, it can be linked to water pressure sensors on the pipes so that leakage detection and valve closing operations could be done swiftly and automatically. Naturally, such automatic and real-time management of pipe bursts can result in significant time and cost saving in repair and maintenance operations.
Author Contributions
These authors contributed equally to this work: P.M. and A.S.-N. (co-first authors). Conceptualization, P.M., A.S.-N. and M.S.; methodology, P.M. and A.S.-N.; software, P.M.; formal analysis, P.M. and M.S.; investigation, A.S.-N. and M.S.; visualization, P.M. and A.S.-N.; resources, A.S.-N.; data curation, P.M. and M.S.; writing–original draft preparation, P.M.; writing–review and editing, A.S.-N., M.S. and S.-M.C.; supervision, A.S.-N.; project administration, S.-M.C.; funding acquisition, S.-M.C.
Funding
This research was supported by the MSIT (Ministry of Science and ICT), Korea, under the ITRC (Information Technology Research Center) support program (IITP-2019-2016-0-00312) supervised by the IITP (Institute for Information & communications Technology Planning & Evaluation).
Conflicts of Interest
The authors declare no conflicts of interest.
References
- Jian-chuan, L.; Yong-shu, L.; Guo-ling, C. Algorithmic optimization and implementation of pipe burst analysis based on ArcGIS. Sci. Surv. Mapp. 2008, 1, 70. [Google Scholar]
- Ugarelli, R.; Venkatesh, G.; Brattebø, H.; Di Federico, V.; Sagrov, S. Historical analysis of blockages in wastewater pipelines in Oslo and diagnosis of causative pipeline characteristics. Urban Water J. 2010, 7, 335–343. [Google Scholar] [CrossRef]
- AbdelBaki, C.; Touaibia, B.; Ammari, A.; Mahmoudi, H.; Goosen, M. Contribution of GIS and Hydraulic Modeling to the Management of Water Distribution Network. In Geospatial Challenges in the 21st Century; Springer: Cham, Switzerland, 2019; pp. 125–150. [Google Scholar]
- Arnold, U.; Datta, B.; Haenscheid, P. Intelligent Geographic Information Systems (IGIS) and Surface Water Modeling; IAHS: Wallingford, UK, 1989; p. 81. [Google Scholar]
- Neji, H.B.B.; Turki, S.Y. GIS based multicriteria decision analysis for the delimitation of an agricultural perimeter irrigated with treated wastewater. Agric. Water Manag. 2015, 162, 78–86. [Google Scholar] [CrossRef]
- Jia, Y.; Zhao, H.; Niu, C.; Jiang, Y.; Gan, H.; Xing, Z.; Zhao, X.; Zhao, Z. A WebGIS-based system for rainfall-runoff prediction and real-time water resources assessment for Beijing. Comput. Geosci. 2009, 35, 1517–1528. [Google Scholar] [CrossRef]
- Shi, Q.; Wang, H.; Wang, H.; Chen, J. Design of WebGIS Rendering Engine Based on Silverlight-based RIA. In Proceedings of the 2011 International Conference on Intelligent Computation Technology and Automation (ICICTA), Shenzhen, China, 28–29 March 2011; pp. 1050–1053. [Google Scholar]
- Li, P.; Ma, L.; Cai, C.; Zhu, L. Research on Application of Ajax and Silverlight Technology in WebGIS. In Proceedings of the 2009 1st International Conference on Information Science and Engineering (ICISE), Nanjing, China, 26–28 December 2009; pp. 2149–2152. [Google Scholar]
- Delipetrev, B.; Jonoski, A.; Solomatine, D.P. Development of a web application for water resources based on open source software. Comput. Geosci. 2014, 62, 35–42. [Google Scholar] [CrossRef]
- Rad, T.G.; Sadeghi-Niaraki, A.; Abbasi, A.; Choi, S.M. A methodological framework for assessment of ubiquitous cities using ANP and DEMATEL methods. Sustain. Cities Soc. 2018, 37, 608–618. [Google Scholar]
- Atabekova, A.; Belousov, A.; Shoustikova, T. Web 3.0-Based Non-formal Learning to Meet the Third Millennium Education Requirements: University Students’ Perceptions. Procedia Soc. Behav. Sci. 2015, 214, 511–519. [Google Scholar] [CrossRef]
- Purvis, M.; Sambells, J.; Turner, C. Beginning Google Maps Applications with PHP and Ajax; Apress: New York, NY, USA, 2006. [Google Scholar]
- Erle, S.; Gibson, R.; Walsh, J. Mapping Hacks: Tips & Tools for Electronic Cartography; O’Reilly Media Inc.: Sebastopol, CA, USA, 2005. [Google Scholar]
- Laney, D. 3D data management: Controlling data volume, velocity and variety. META Group Res. Note 2001, 6, 70. [Google Scholar]
- Jiang, B.; Thill, J.C. Volunteered Geographic Information: Towards the establishment of a new paradigm. Comput. Environ. Urban Syst. 2015, 53, 1–3. [Google Scholar] [CrossRef]
- Fox, P.; Hendler, J. Changing the equation on scientific data visualization. Science 2011, 331, 705–708. [Google Scholar] [CrossRef]
- Tsou, M.H. Revisiting Web Cartography in the United States: The Rise of User-Centered Design. Cartogr. Geogr. Inf. Sci. 2011, 38, 250–257. [Google Scholar] [CrossRef]
- Zastrow, M. Data visualization: Science on the map. Nature 2015, 519, 119. [Google Scholar] [CrossRef] [PubMed]
- Liu, Y.; Liu, X.F.; Mao, J.H. Research on the Integration of Silverlight and WebGIS Based on REST. In Proceedings of the 2010 International Conference on Multimedia Technology (ICMT), Ningbo, China, 29–31 October 2010; pp. 1–4. [Google Scholar]
- Vaitis, M.; Feidas, H.; Symeonidis, P.; Kopsachilis, V.; Dalaperas, D.; Koukourouvli, N.; Taskaris, S. Development of a spatial database and web-GIS for the climate of Greece. Earth Sci. Inform. 2019, 12, 97–115. [Google Scholar] [CrossRef]
- Wang, X.J.; Li, C.H. Design and Implementation of Tourism System Based on WebGIS. Comput. Technol. Dev. 2018, 8, 31. [Google Scholar]
- Vitianingsih, A.V.; Cahyono, D.; Choiron, A. Web-GIS Application Using Multi-Attribute Utility Theory Method as an Alternative Classification of New Highway Development with Heavy Traffic. Adv. Sci. Lett. 2018, 24, 9186–9192. [Google Scholar] [CrossRef]
- Ardalan, A.; Rad, M.K.; Hadi, M. Urban Water Issues in the Megacity of Tehran. In Urban Drought; Springer: Singapore, 2019; pp. 263–288. [Google Scholar]
- Saatsaz, M. A historical investigation on water resources management in Iran. Environ. Dev. Sustain. 2019, 1–37. [Google Scholar] [CrossRef]
- Alizadeh, Z.; Yazdi, J.; Mohammadiun, S.; Hewage, K.; Sadiq, R. Evaluation of data driven models for pipe burst prediction in urban water distribution systems. Urban Water J. 2019, 16, 136–145. [Google Scholar] [CrossRef]
- Motiee, H.; Ghasemnejad, S. Prediction of pipe failure rate in Tehran water distribution networks by applying regression models. Water Supply 2019, 19, 695–702. [Google Scholar] [CrossRef]
- Tchórzewska-Cieślak, B.; Boryczko, K.; Piegdoń, I. Possibilistic risk analysis of failure in water supply network. In Safety and Reliability: Methodology and Applications; CRC Press: Boca Raton, FL, USA, 2015; pp. 1473–1480. [Google Scholar]
- Ye, D.; Liu, Q. Simulation for Emergency Treatment of Squib Based on Genetic Algorithm. In Proceedings of the 2010 Second International Workshop on Education Technology and Computer Science (ETCS), Wuhan, China, 6–7 March 2010; pp. 296–299. [Google Scholar]
- Ouyang, P.; Jian, J.; Zhang, Z. Pipe Burst Analysis Based On GIS. In ICPTT 2013: Trenchless Technology; American Society Of Civil Engineers: Reston, WV, USA, 2013; pp. 10–18. [Google Scholar]
- Chen, R.; Shen, X. Analysis and Realization of Burst Pipe’s Closing Valve in Gas Pipe System Based on ArcGIS Engine. J. Kunming Metall. Coll. 2011, 1, 5. [Google Scholar]
- Jiankang, W.J. Valve Closing Analysis of Water Distribution Network in Case of Multi-accidents. Ship Electron. Eng. 2009, 7, 46. [Google Scholar]
- ArcGIS Server. Available online: https://enterprise.arcgis.com/en/server/latest/develop/windows/about-extending-services.htm (accessed on 22 July 2019).
- Cheng, G.X.; Hu, S.Q. System architecture and pattern research of RIA based on Silverlight. Comput. Eng. Des. 2010, 8, 1706–1709. [Google Scholar]
- Gao, S.; Qin, F.; Liu, J.; Qin, L.; Li, J. Design of the tourism service WebGIS based on Silverlight. In Proceedings of the 2013 21st International Conference on Geoinformatics, Kaifeng, China, 20–22 June 2013; pp. 1–5. [Google Scholar]
- Khan, Z.A.; Adnan, M. Usability evaluation of web-based GIS Applications. In Proceedings of the 11th International Conference on Information Integration and Web-based Applications & Services-iiWAS’09, Paris, France, 8–10 November 2010. [Google Scholar]
Figure 1.
Development stages.

Figure 2.
Water network data model.

Figure 3.
System architecture.

Figure 4.
Interface, view of the area around damaged pipe and valves linked to damaged pipeline.

Figure 5.
Sample water distribution network.

Figure 6.
Results of the usability evaluation questionnaire and system performance test.

© 2019 by the authors. Licensee MDPI, Basel, Switzerland. This article is an open access article distributed under the terms and conditions of the Creative Commons Attribution (CC BY) license (http://creativecommons.org/licenses/by/4.0/).
Share and Cite
MDPI and ACS Style
Mirshafiei, P.; Sadeghi-Niaraki, A.; Shakeri, M.; Choi, S.-M. Geospatial Information System-Based Modeling Approach for Leakage Management in Urban Water Distribution Networks. Water 2019, 11, 1736. https://doi.org/10.3390/w11081736
AMA Style
Mirshafiei P, Sadeghi-Niaraki A, Shakeri M, Choi S-M. Geospatial Information System-Based Modeling Approach for Leakage Management in Urban Water Distribution Networks. Water. 2019; 11(8):1736. https://doi.org/10.3390/w11081736
Chicago/Turabian StyleMirshafiei, Parima, Abolghasem Sadeghi-Niaraki, Maryam Shakeri, and Soo-Mi Choi. 2019. "Geospatial Information System-Based Modeling Approach for Leakage Management in Urban Water Distribution Networks" Water 11, no. 8: 1736. https://doi.org/10.3390/w11081736
Note that from the first issue of 2016, this journal uses article numbers instead of page numbers. See further details here.