Zwitterion-Modified Ultrafiltration Membranes for Permian Basin Produced Water Pretreatment


1
Center for Energy and Environmental Sustainability, Prairie View A&M University, Prairie View, TX 77446, USA
2
Department of Civil and Environmental Engineering, Prairie View A&M University, Prairie View, TX 77446, USA
*
Author to whom correspondence should be addressed.
Water 2019, 11(8), 1710; https://doi.org/10.3390/w11081710
Submission received: 5 July 2019
/
Revised: 14 August 2019
/
Accepted: 15 August 2019
/
Published: 17 August 2019
(This article belongs to the Special Issue Desalination and Wastewater Treatment: Chemical, Physical, and Biological Methods)
Abstract
:Unconventional oil and gas extraction generates large quantities of produced water (PW). Due to strict environmental regulations, it is important to recover and reuse PW. In this study, commercial polyethersulfone (PES) ultrafiltration (UF) membranes were surface-modified with zwitterionic polymer 3-(3,4-Dihydroxyphenyl)-l-alanine (l-DOPA) solution to alleviate membrane fouling during the ultrafiltration of shale oil PW of the Permian Basin. UF membranes were coated in l-DOPA solution by using a dip coating technique. Membrane characterization tests confirmed successful l-DOPA coating on UF membranes. While performing the experiments, permeate flux behaviors of the uncoated and coated membranes and antifouling resistance of the zwitterionic coating were evaluated. Among the coated UF membranes with varying coating times from one day to three days, the three-day coated UF membrane showed a good flux performance and the highest fouling resistance. The flux reduced by 38.4% for the uncoated membrane, while the reduction was 16% for the three-day coated membrane after the 5 h ultrafiltration of PW. Both improvements of the flux performance and recovery ratio are attributed to a negatively-charged surface developed on the membranes after the zwitterionic coating. The UF pretreatment also improved the flux behavior of the later forward osmosis (FO) process for PW treatment.
1. Introduction
Produced water (PW) is the remaining waste water after the fluids in the reservoir (oil/gas/water) are returned back from the oil and gas wells and separated. The PW contains some solids and residual oil, dissolved hydrocarbons, gases (e.g., carbon dioxide), and other chemicals used during the oil and gas production [1]. Even though the volume of PW depends on different factors, it is usually generated in large quantities during the unconventional oil and gas extraction. The increasing demand for energy drives the increase of the oil and gas production from the unconventional sources including oil shale, tar sands, and coal bed methane [2]. In 2016, daily oil and gas production in the U.S. was 1,556,717 barrels and 5369 million cubic feet, respectively [3].
The Permian Basin located across two states, Texas and New Mexico, is one of the major oil and gas production areas in the US [3]. Beginning from 2010, the production of the unconventional oil and gas in the Permian Basin has been increased significantly [4]. Only the Midland Basin within the Permian Basin has shale oil reserves that has potential to generate more than 20 billion barrels and 16 trillion cubic feet of natural gas [5]. The Permian Basin is expected to hold 29% of the future oil reserves in the U.S. [6]. The fresh water required for oil and gas extraction in the Permian Basin is mostly withdrawn from the High Plains aquifer [7]. Because of the high demand for fresh water, the aquifer is getting depleted and this has a potential to create a serious problem in the future [7]. Besides, the disposal of PW is also a challenge. Texas is the leading state for the PW generation [8]. It is not feasible to dispose PW in the long term despite a significant number of disposal wells in Texas [7]. On average, for one barrel of oil production in the Permian Basin, six and a half barrels of PW was generated in 2016, making it one of the highest water-to-oil ratio producers in the U.S. [7]. Overall, it was estimated that the Permian Basin generated around 286 to 358 million barrels of PW in 2015 and 2016 [7]. Texas part of the Permian basin PW has a median TDS of 99,600 mg/L [8]. The measured TDS in the shale oil wells ranged from 36,100 to 163,000 mg/L, showing highly varying chemical composition [9].
The treatment of PW is generally limited to the available technologies in the facility [10]. Multiple factors affect the quality and the feasibility of treatment, for example, capital and operating costs. Some treatment options are almost not feasible because of the large space requirements. Some of the compact technologies that are generally preferred in facilities are coagulation and flocculation, hydrocyclones, and photoelectrocatalytic processes [11]. However, most of these conventional technologies applied for the PW treatment are not sufficient and they generate large volumes of secondary waste [12]. Membrane technologies are capable of treating complex waste streams at high salinity with reduced waste. They have several advantages over the conventional methods, including lower energy consumption, higher product quality, and compact module [13]. Membrane technologies have been proven to have higher separation efficiency over the conventional technologies. Moreover, the use of coagulants and chemical additives are not necessary with the employment of membrane technologies making them more cost-effective and environmental friendly [14]. Utilizing the membrane technologies will improve the efficiency of the PW treatment without complicating the operational and mechanical processes of the treatment.
Ultrafiltration can be a reliable pretreatment for PW treatment. Ultrafiltration (UF) has a high oil and suspended solids removal rate [15]. It is also effective for removing color, odor, viruses, and colloidal organic matter [16]. Different studies were conducted to test the UF efficiency for the PW treatment [17,18,19,20]. Ebrahimi et al. used ceramic membranes with 0.05 µm pore size and 20 kDa molecular weight cut-off (MWCO) to treat the tank dewatering PW [17]. The UF achieved a 99.2% oil removal, and total organic carbon (TOC) decreased by 13.6%. The UF was shown to be a feasible method as both a pre-treatment and post-treatment for oil removal [17]. Li et al. used the polyvinylidene fluoride (PVDF) UF membranes to clean oil field wastewater [18]. After the treatment, the oil concentration was 0.2 mg/L, which was a decrease of more than 98%. The TOC, turbidity, and suspended solids were also greatly reduced by more than 90%. Salahi et al. investigated the polyacrylonitrile (PAN) UF membranes for the oily wastewater treatment [19]. After the treatment, the oil content decreased from 78 mg/L to 0.2 mg/L. Similarly, a high TOC removal was achieved, and the TOC decreased from 81 mg/L to 0.4 mg/L. Teodosiu et al. used the UF as a pretreatment method for reverse osmosis (RO) to treat the refinery wastewater [20]. Polyethersulfone/polyvinylpyrollidone (PES/PVP) UF membranes with a 0.015 µm average pore size were used in the experiments. The removal efficiencies of 98% for turbidity and 44.5% for the chemical oxygen demand (COD) were achieved.
In general, studies exploring the performance of ultrafiltration using PW directly obtained from the oil and gas fields are limited. In this article, we present a facile and cost-effective method to reduce the membrane fouling during the UF filtration of PW obtained from shale oil hydraulic fracking of the Permian Basin. Commercial polyethersulfone (PES) UF membranes were surface-modified in zwitterionic polymer 3-(3,4-Dihydroxyphenyl)-l-alanine (l-DOPA) solution by using a dip coating technique. Zwitterionic materials have both positively and negatively-charged groups and interact with water electrostatically, and hydrate the surface by forming hydration layers against the foulant particles. They show a neutral charge, if they are exposed to the particles, to prevent any kind of interaction with the charged particle [21]. The zwitterion-modified membrane was used in the pretreatment of the Permian Basin PW.
2. Materials and Methods
2.1. Feed Solution
The Permian Basin shale oil PW was employed as the feed solution for all experiments. The PW was obtained from a Texas-based exploration and production company. pH of the PW is 7.43, indicating that it is slightly basic. The total dissolved solid (TDS) concentration was measured as 191,505 mg/L. Chemical oxygen demand (COD) and TOC concentrations were 3200 and 156 mg/L, respectively. The membranes were immersed in deionized (DI) water for 24 h before use.
2.2. Membrane Materials
Microfiltration (MF) filters (Thermo-Fisher Scientific, Waltham, MA, USA) were used for filtering suspending solids from the PW before UF, and they were made of mixed ester cellulose with pore sizes of 0.45 μm. UF membranes (Synder Filtration, Vacaville, CA, USA) were composed of PES. They had 1000 Da molecular weight cut-off (MWCO) and were highly resistant to temperature and pH. Flat sheet forward osmosis (FO) membranes (Fluid Technology Solutions, Albany, OR, USA) used in the experiments were made of cellulose triacetate (CTA). These membranes provide high resistance to fouling and abrasion and they were proved to be successful in treating different types of wastewaters.
2.3. Surface Coating
3-(3-4-Dihydroxyphenyl)-l-alanine (l-DOPA) and Tris (hydroxymethyl) aminomethane (Tris) buffer were obtained from Sigma Aldrich, USA, and used for the coating solution preparation. A total of 10 mM Tris-HCl buffer solution was prepared as a solvent for coating l-DOPA [10]. The concentration of l-DOPA was 2 g/L. The pH of the buffer solution was adjusted and maintained at 8.0. The UF membranes were coated for 1, 2, and 3 days by a dip coating technique. The membranes were dipped vertically into the l-DOPA solution and retained there for a predetermined period with slow stirring. After the membranes were removed, they were sonicated in DI water for one min at 40 kHz (Thermo-Fisher Scientific, Waltham, MA, USA). This process was expected to remove any loosely attached coating particles before the membranes were placed into the filtration cell.
2.4. UF Membrane Characterization
2.4.1. Surface Hydrophilicity
The surface hydrophilicity of the membranes was determined by a water contact angle method using the CAM-PLUS Contact Angle Meter. The contact angle was calculated from the CAM-PLUS system based on Tantec’s half-angle measuring method (U.S. Patent No. 5,268,733). During the testing, a 0.5 microliter water droplet was placed on the surface of the membrane through the syringe. One minute contact time was maintained before each measurement to reach the equilibrium with the membrane surface. All measurements were repeated three times for each sample.
2.4.2. UV-Vis Absorption and ATR-FTIR Spectra
To examine the absorption of l-DOPA on the surface of the membranes, the UV-vis analysis was carried out. For this purpose, the Shimadzu UV-1800 spectrophotometer was used. The absorption was measured in the wavelength range of 200 to 800 nm.
To characterize the membrane surface, attenuated total reflection-Fourier-transform infrared spectroscopy (ATR-FTIR) measurements were conducted with an IRAffinity-1 FT-IR Shimadzu spectrophotometer. The membranes’ surfaces were analyzed by a MIRacle 10 accessory using the ATR technique. The surface functional groups were analyzed between the wavenumbers 4000 and 900 cm−1. Both measurements were repeated three times.
2.4.3. Zeta Potential Measurements
The zeta potential of the membranes was determined using an Anton Paar SurPASS streaming potential analyzer. The samples were placed on the analyzer using an adjustable gap cell apparatus. The streaming potential of the surface was measured to calculate the zeta potential. A total of 5 mM KCl solution was used as the measuring electrolyte. The measurements were taken in a pH range of 4.0 to 8.5. The pH was adjusted automatically by analyzer with HCl and NaOH solutions. The measurements were made starting at pH of 4.0 and ending at pH of 8.5. Two measurements were made at each pH value and the average zeta potential values were plotted.
2.4.4. Atomic Force Microscopy (AFM)
Surface roughness and surface morphology were analyzed using the tapping mode atomic force microscopy (AFM) (Bruker Dimension Icon AFM with Nanoscope software, Santa Barbara, CA, USA). Dried samples were cut into small pieces and placed onto the specimen’s holder. Images were taken in the scan size of 4.0 × 4.0 µm. Surface roughness parameters, arithmetic average of the surface height deviations (Ra), root mean square average of height deviations (Rq), and maximum vertical distance between the highest and lowest data points in the image (Rmax) were used as reported by Nanoscope software for the quantitative analysis of the surface roughness.
2.5. Ultrafiltration
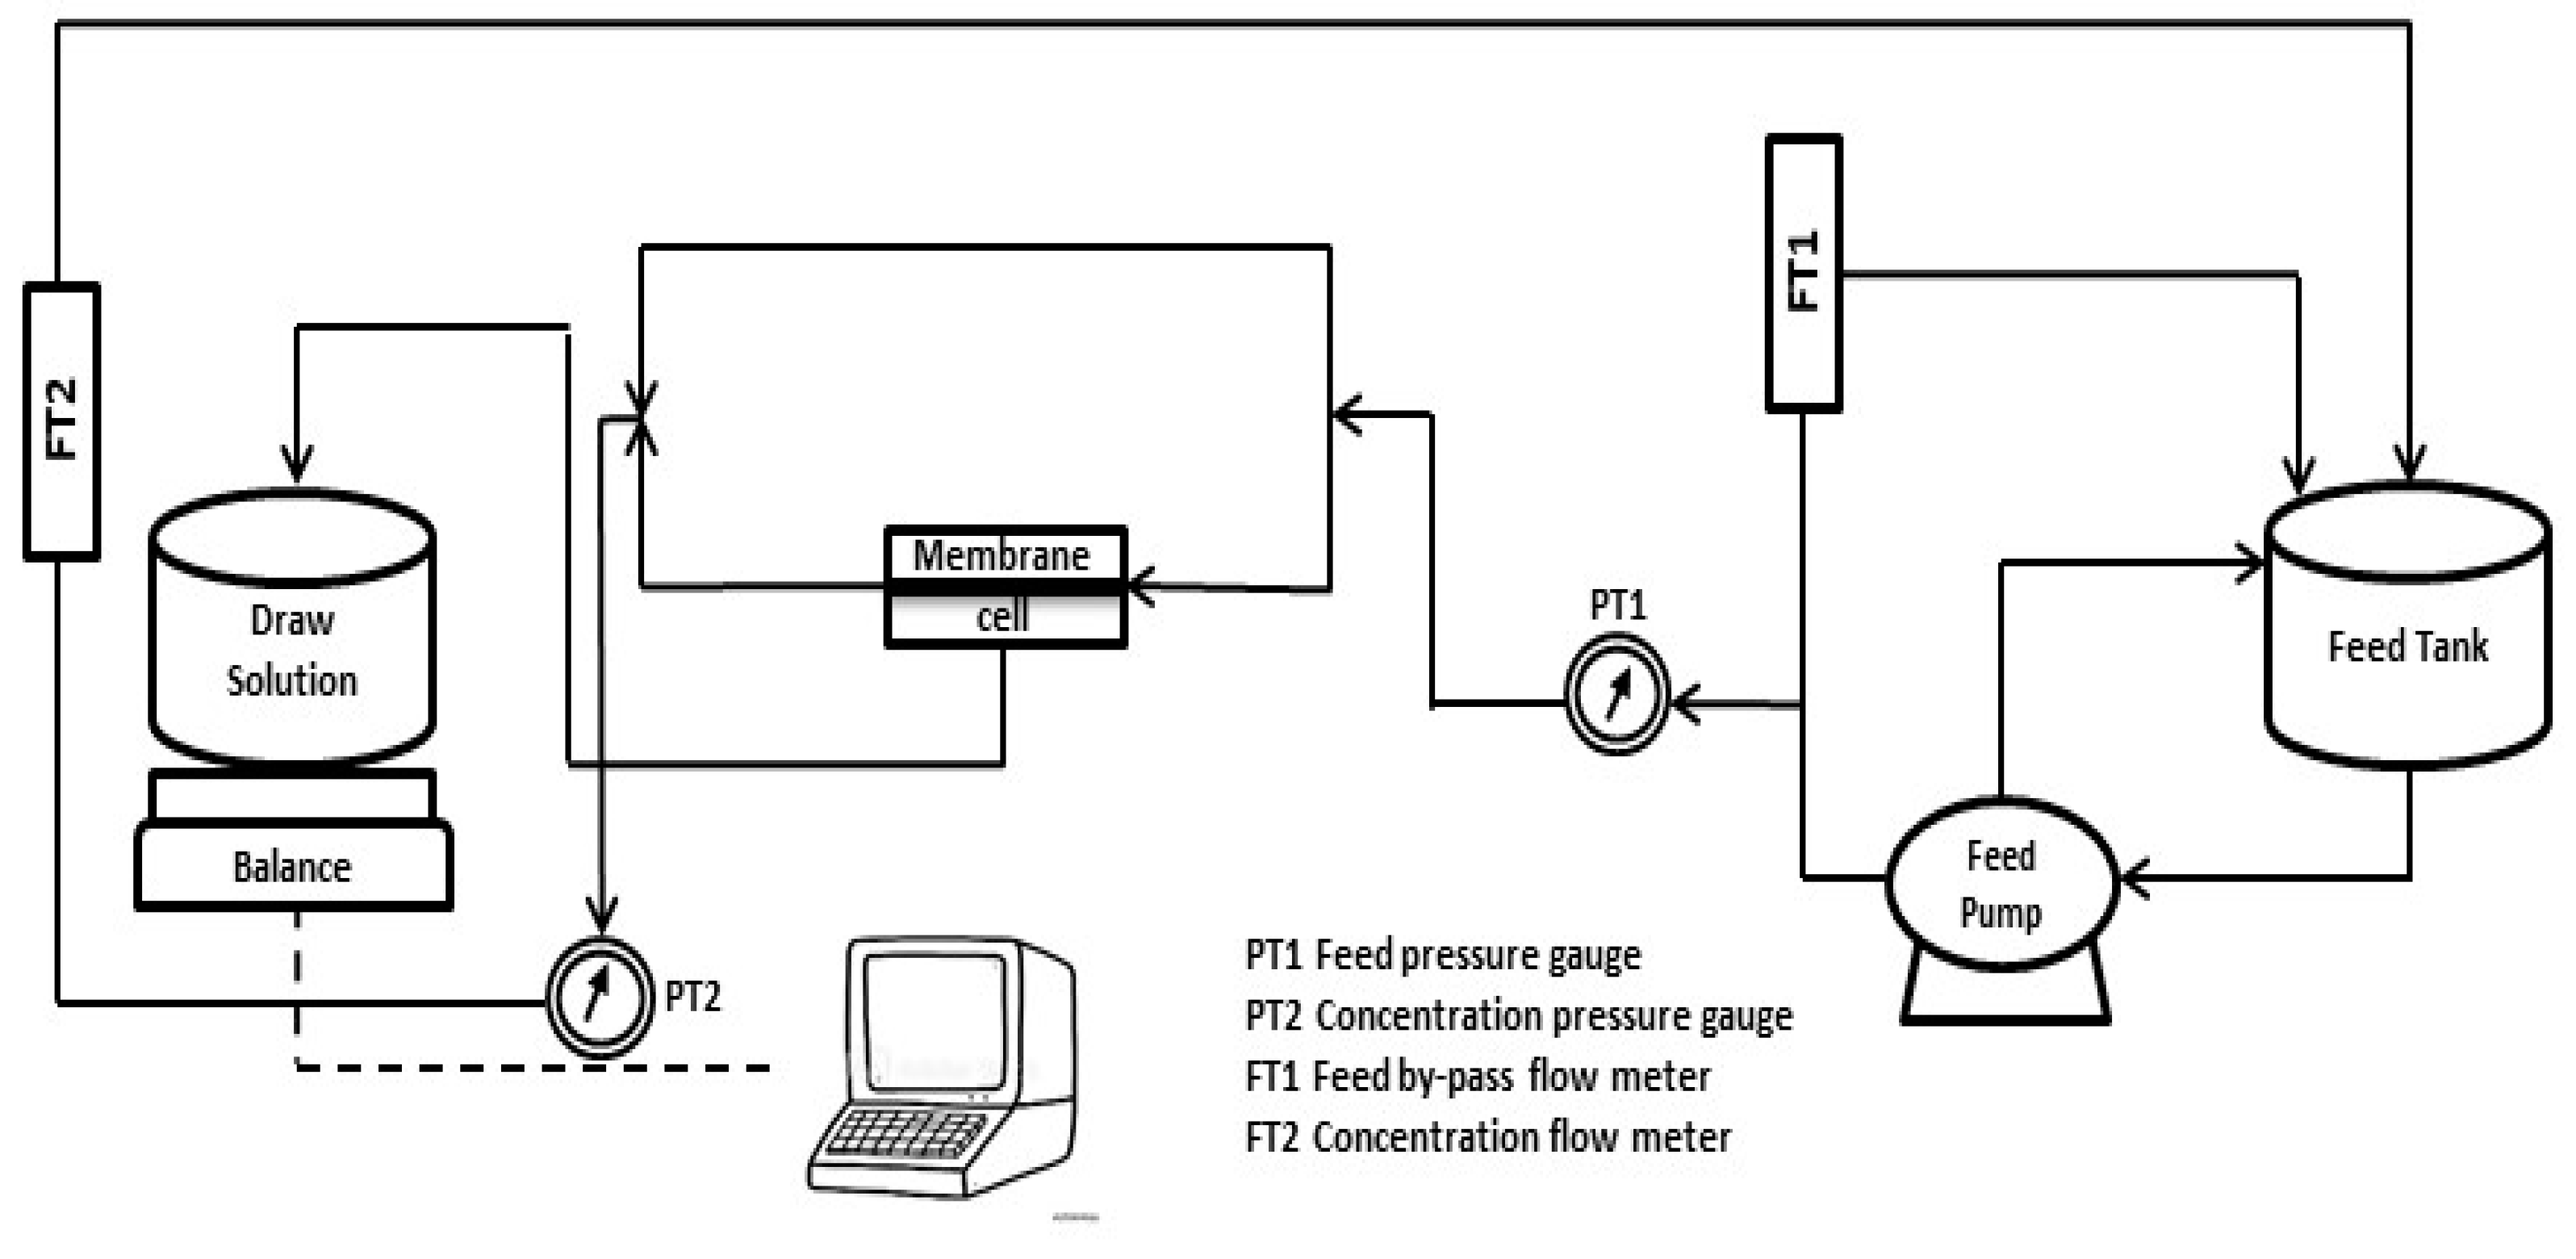
Before the UF experiments, PW was filtered through 0.45 μm filters under vacuum to remove suspended particles and residual oil. The MF mimics conventional oilfield treatment steps of settling and oil–water separation. The simple MF system that was used included a glass support base, a graduated glass funnel, an anodized aluminum clamp, a silicone stopper to hold the filter, and a vacuum pump. After the MF, PW was treated in the UF system. A membrane test cell system (Sterlitech, Kent, WA, USA) equipped with a variable frequency drive for flow control was used during the UF experiments. The system included a CF042 Test Cell, a stainless steel conical feed tank, a feed flow pump, a cell platform containing system controls, tubing, a chiller, a digital balance, and a computer to record data (Figure 1). The Membrane Test Cell System was operated at the recommended flux and transmembrane pressure (TMP), which were 80 GFD (gallons/ft2/day) and 50 psi, respectively. The pump speed was adjusted to 20.3 Hz to get the desired flow rate. The temperature of the feed in the tank was maintained at 20 °C using the chiller (PolyScience, Niles, IL, USA). The weight of the permeate was measured by a digital balance every 60 s and the permeate flux (Jw) was calculated using the weight change according to Equation (1). The UF experiments were conducted for 5 h.
The initial PW flux was determined as the average of 30 min from the UF starting values. After the UF experiments, the membranes were cleaned by backwashing with DI water. The cleaning lasted for 30 min with 1.5 times higher flow rate (3.4 LPM) compared to the UF experiments. The 30 min average PW flux was recorded again, and the flux values were compared before and after cleaning to observe the flux recovery.
2.6. Forward Osmosis
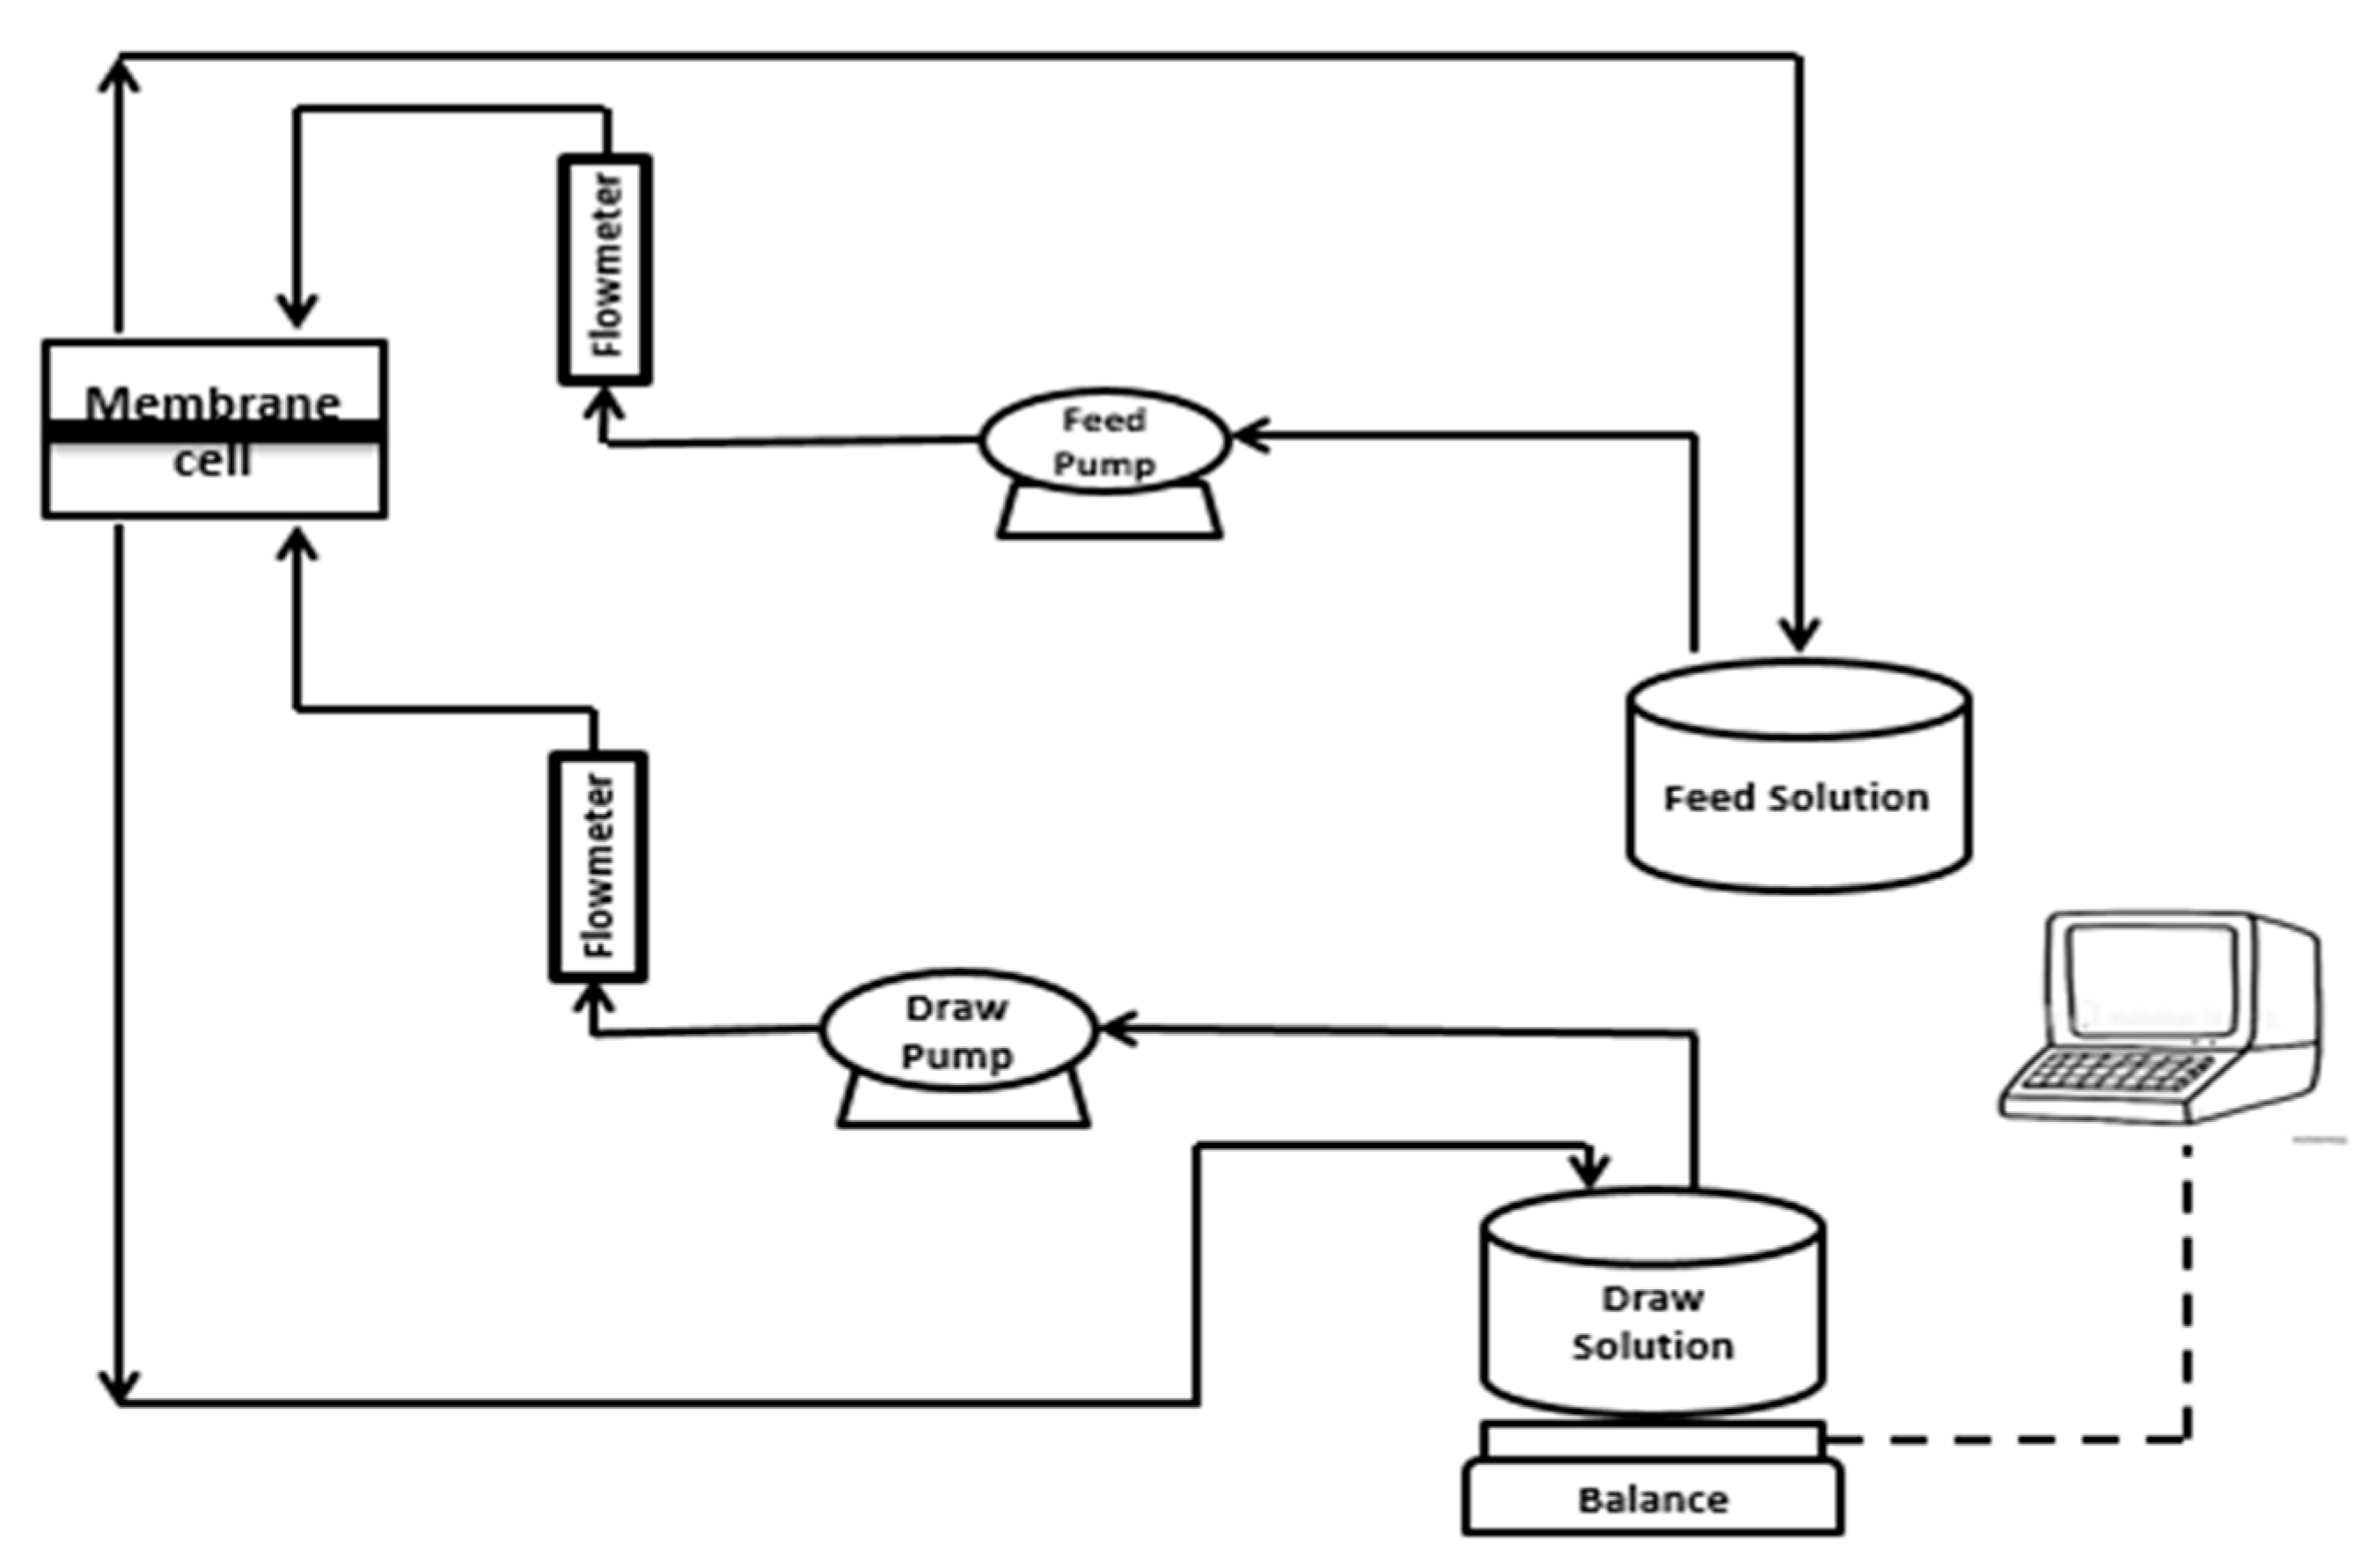
After the UF, PW was treated in a FO system to investigate the effect of UF pretreatment. The FO system (Figure 2) included a CF042 membrane test cell (Sterlitech, Kent, WA, USA), two gear pumps for solution circulation, a feed tank, a draw solution tank, a digital balance, and a computer. The weight of the permeate was measured by the balance every 60 s and the water flux was calculated similarly to the UF experiments aforementioned. The experiments were done in a pressure retarded osmosis (PRO) mode, in which the support layer of the membrane faced the feed side. The cross-flow rate was adjusted to 1.0 LPM (liters/minute). A total of 2 MgCl2 was used as the draw solution in all FO experiments due to its high osmotic pressure.
3. Results and Discussion
3.1. UF Membrane Characterization
3.1.1. Surface Hydrophilicity
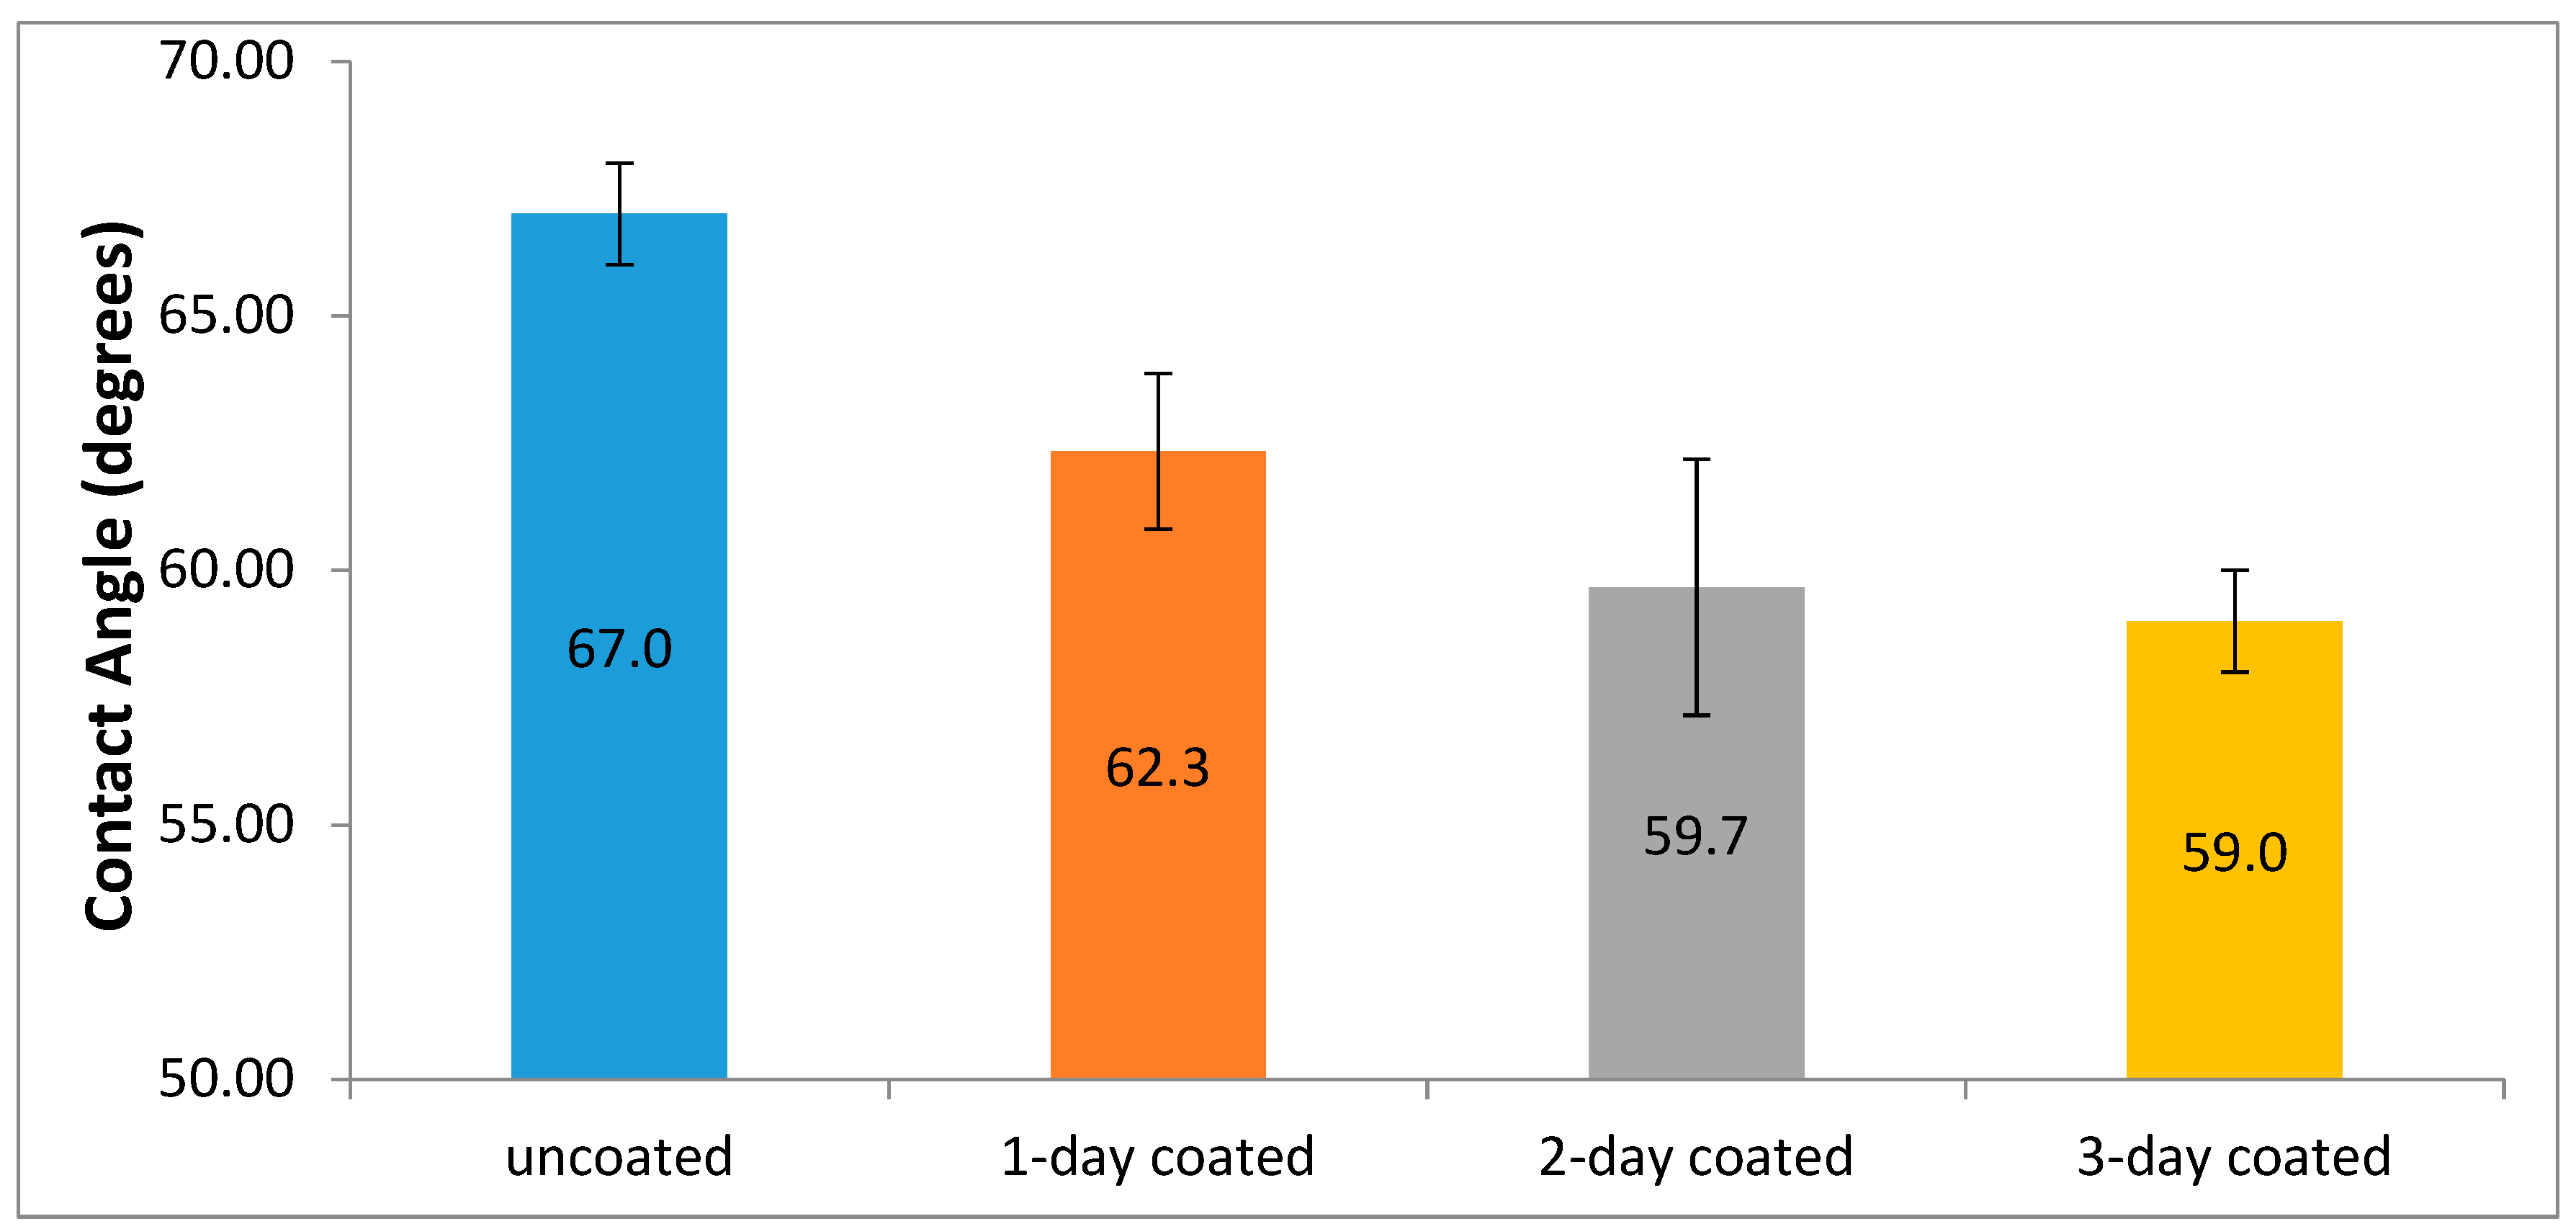
The contact angles of the uncoated and coated membranes were measured because the coating angles are directly associated with surface hydrophilicity [22]. It was expected that the coated membranes would have had smaller contact angles and; therefore, higher wettability because of the smoother surface after coating [23]. The results are shown in Figure 3 and are consistent with the previous findings [24]. As it is shown in the figure, the uncoated membrane had the highest contact angle of 67°. The contact angle decreased as the coating time increased. The three-day coated membrane had the lowest contact angle of 59°. The contact angle dropped to 62.3 from 67° for the one-day coated membranes and to 59.7° for the two-day coated membranes. However, the difference between the two-day coated and three-day coated membranes is marginal. Even though l-DOPA molecules will adhere to the membrane surface over time, the improvement in hydrophilicity cannot be achieved beyond some level. According to the results of the one-way analysis of variance test (ANOVA), there was a significant difference between the mean contact angle of uncoated and coated samples at the 95% confidence level. Overall, it was concluded that the wettability and the surface hydrophilicity of the membranes increased after the l-DOPA coating. The improved wettability would enhance the antifouling behavior of the membranes for the PW treatment.
3.1.2. UV-Vis Absorbance
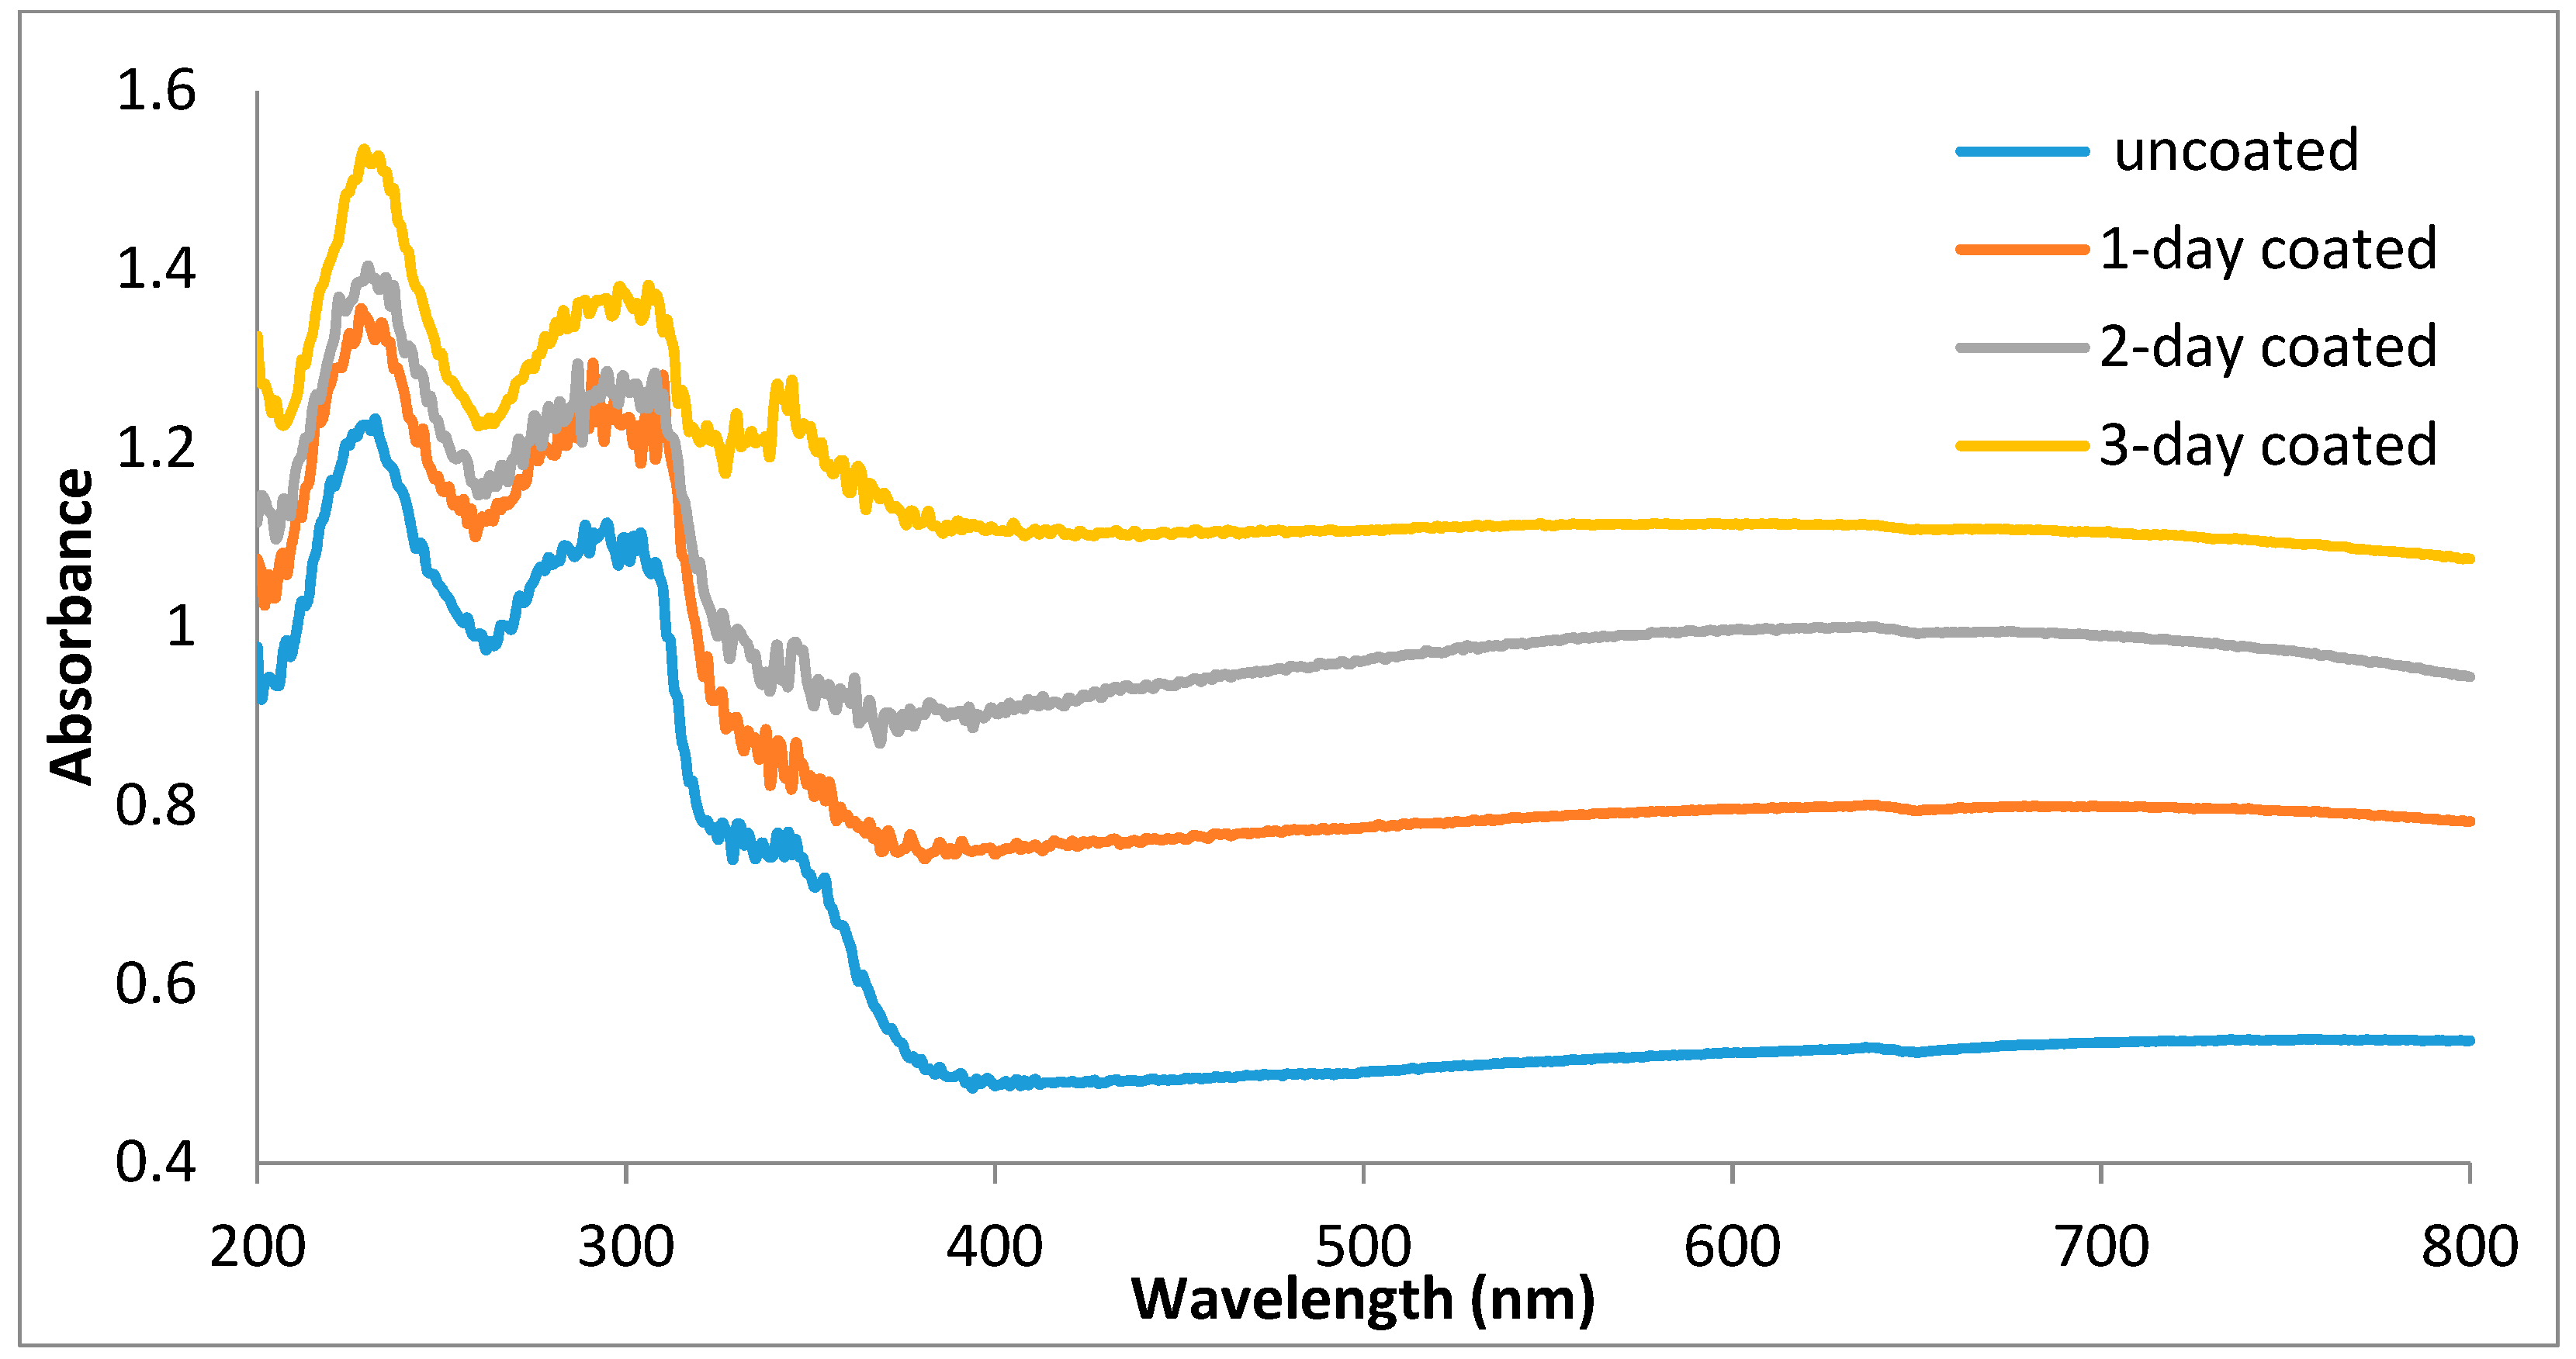
The UV-vis absorption behaviors of the uncoated and the coated membranes are plotted in Figure 4. The uncoated membrane had the lowest absorption among all the UF membranes. This is predictable because the uncoated membrane has a white smooth surface. The absorbance went higher and higher as the coating time increased. The three-day coated membrane showed the highest absorbance of the l-DOPA among the others. According to Bernsmann et al. [25] the absorption of the DOPA and dopamine-like materials do not exhibit distinctive peaks over the UV-vis range, and the increase in absorption is monotonous associated with the DOPA and dopamine deposition. This explains why l-DOPA coating did not show any distinct peak in the UV-vis range. Figure 5 illustrates how the membranes got darker in color due to l-DOPA accumulation on the membrane surface as the coating time increased.
3.1.3. Surface Functional Groups
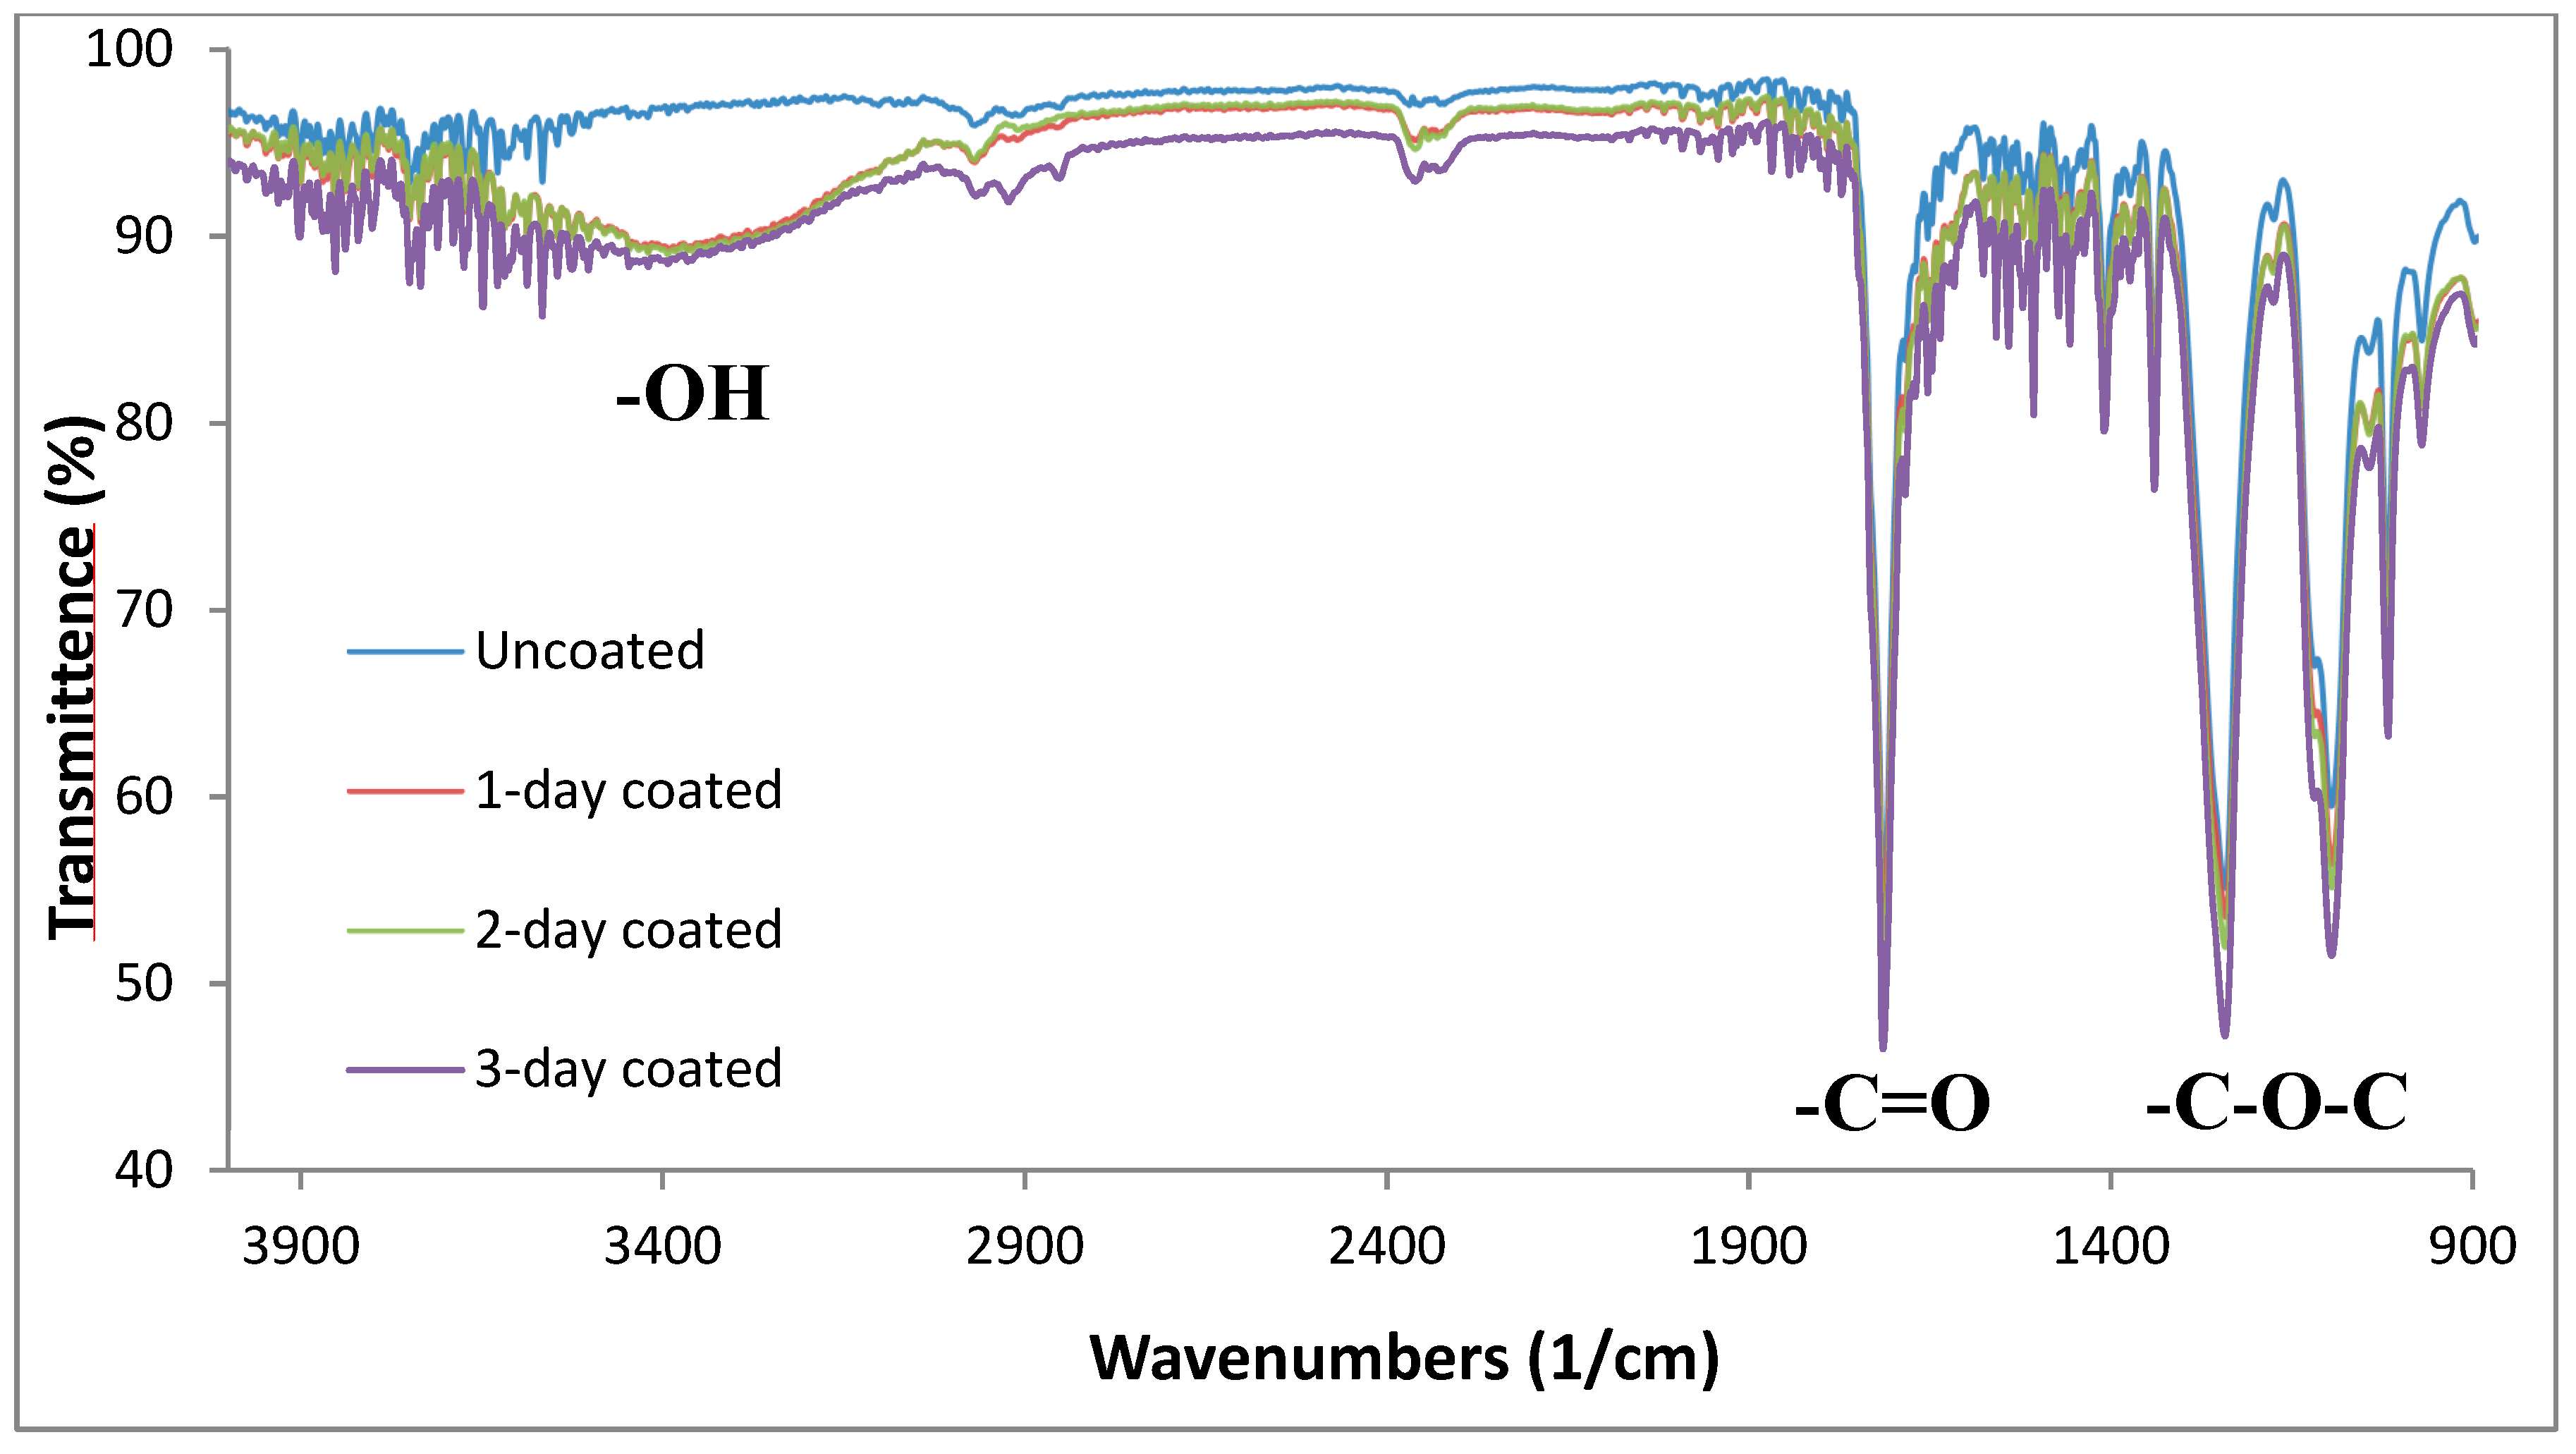
The ATR-FTIR spectra of the uncoated and the coated membranes are shown in Figure 6. Both uncoated and coated membranes had similar surface functional groups. This is expected because PES and l-DOPA are both hydrocarbon polymers and they share similar functional groups in their structure. A peak from 3000 to 3500 cm−1 indicates a free –O–H group formation on the membrane surface associated with the l-DOPA [26]. The other peaks observed are as following. The peak appearing around 1700 cm−1 corresponds to –C=O bond. The peaks appearing around 1250 and 1100 cm−1 belong to the –C–O–C bond [27]. The surface functional groups observed on the membrane surface are consistent with the previous findings and proved a successful l-DOPA coating on the membrane surface [26,27,28].
3.1.4. Zeta Potential
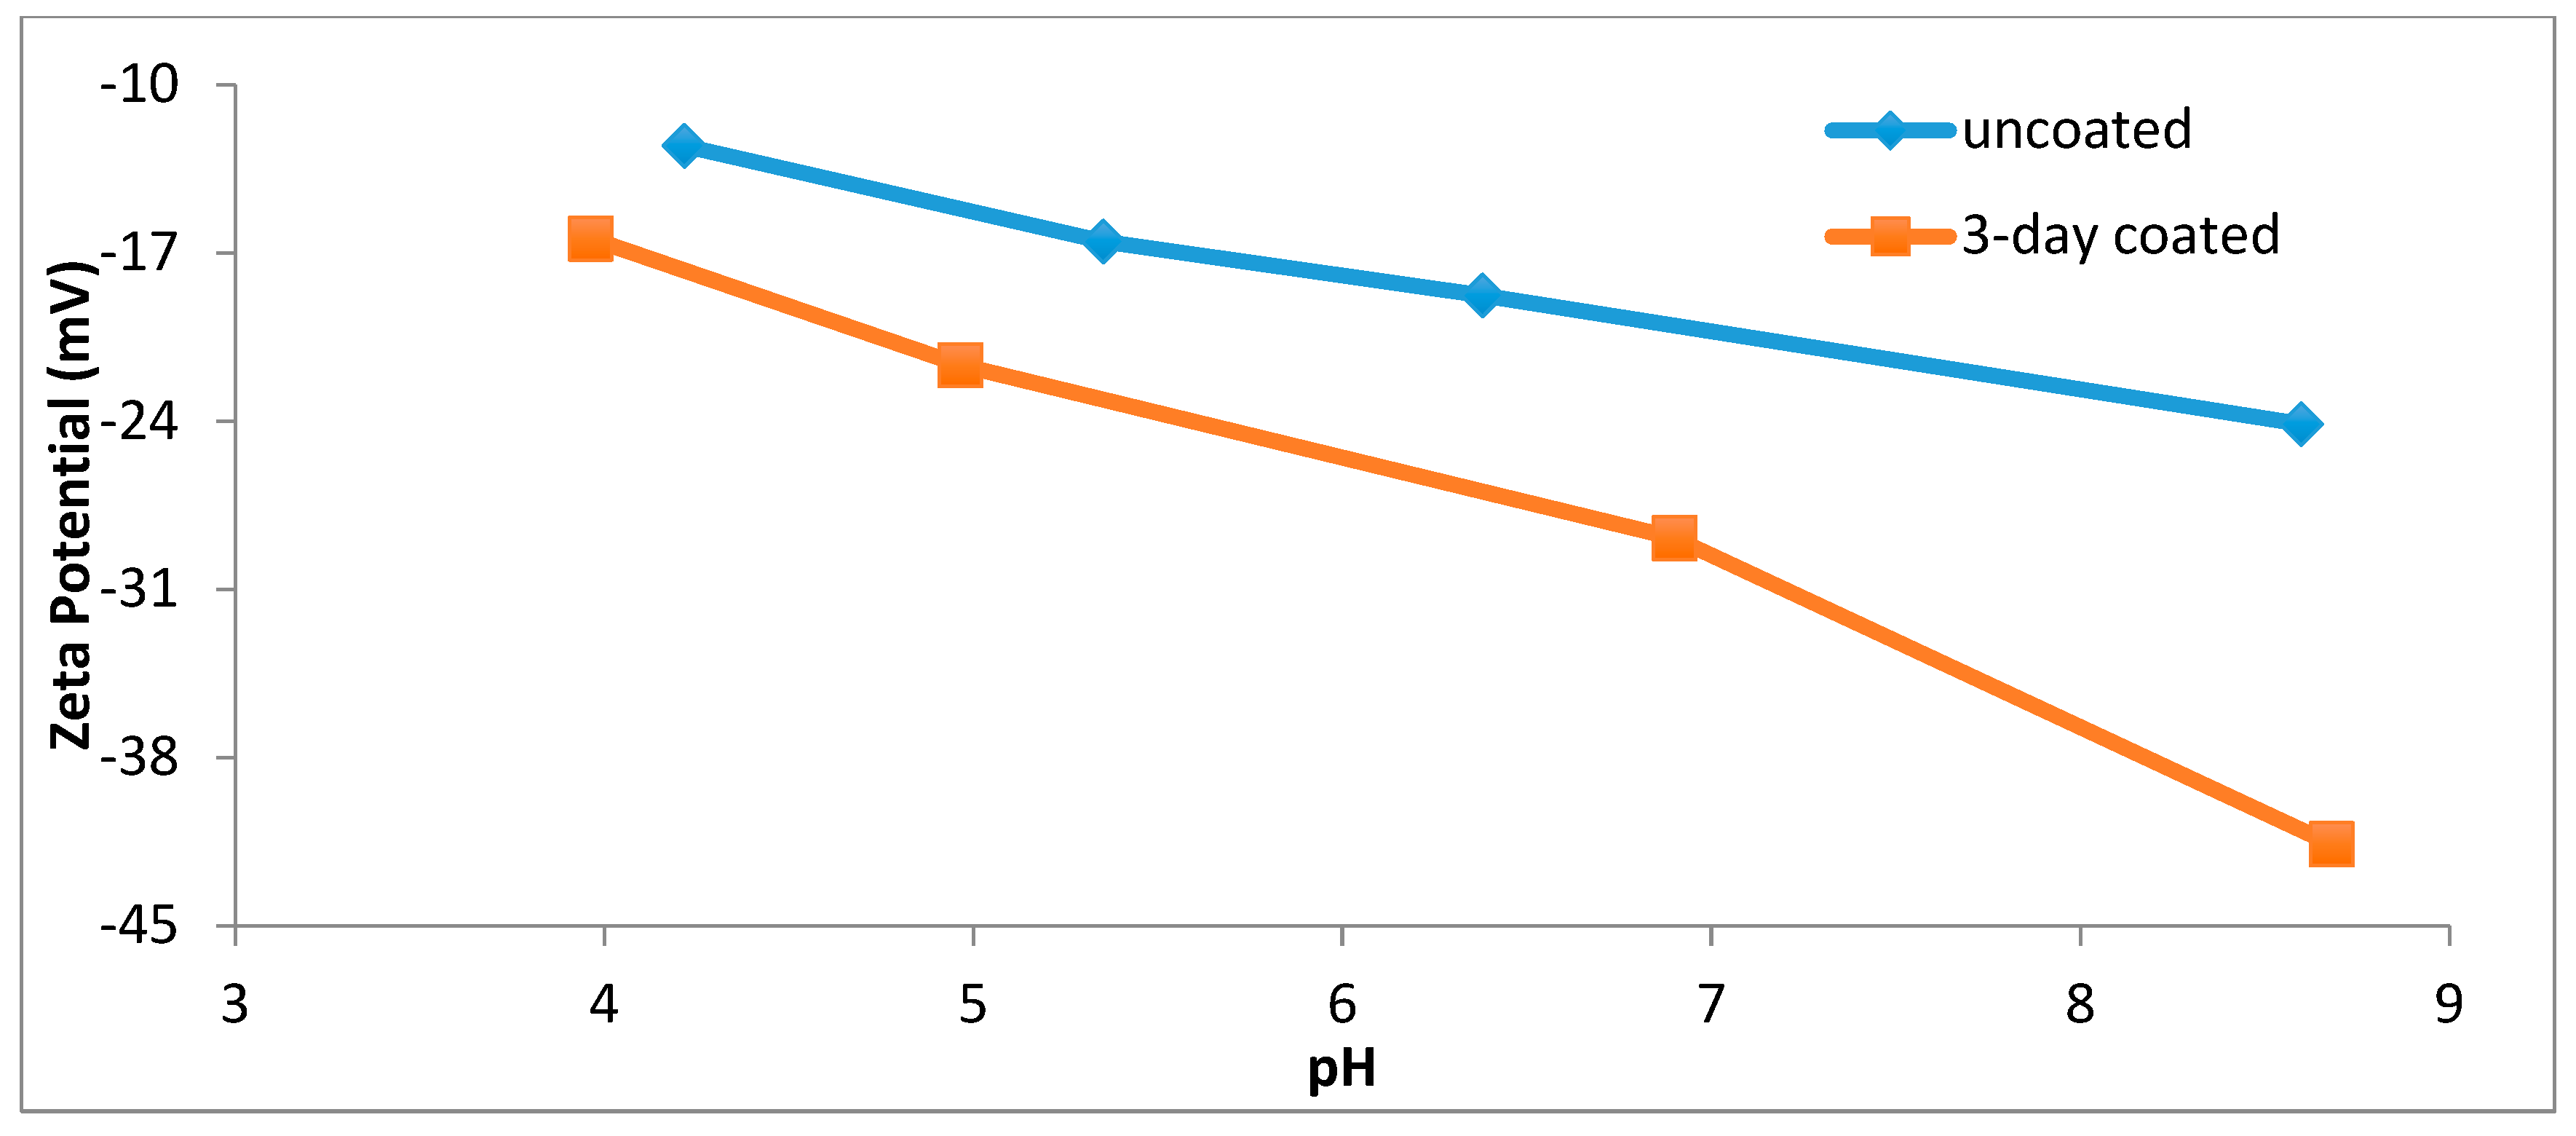
The zeta potentials of the uncoated and three-day coated membranes were plotted in the pH range of 4.0 and 8.5. Actual surface charge of the polymeric membranes comes from adsorption of ions from electrolyte solution and dissociation of ionizable groups on the polymer surface. KCl was used as the electrolyte since both K+ and Cl− ions show similar mobilities. However, results obtained with KCl are not sufficient to provide extra information for ion adsorption of different salts that may occur during the filtration of PW. As Figure 7 shows, PES membranes have negative zeta potential due to the deprotonation of the PES membrane surface in the studied pH ranges. When the pH of the solution increases, the measured zeta potential becomes more negative because of the dissociation of carboxylic group. The calculated zeta potentials for all membrane samples were negative across the entire pH range measured. The coated PES samples had more negative zeta potentials compared to the uncoated samples. This result is aligned with the previous findings [27]. It was expected because, in practice, when an amino acid is dissolved in water, the overall charge becomes more negative due to the carboxyl group contribution [29]. In general, more negative zeta potential of the surface should lead to less fouling by negatively-charged macromolecules because of the higher electrostatic repulsion between the negatively-charged surface and particles. The change of the zeta potential values with respect to pH is another evidence of successful l-DOPA coatings on the membrane surface.
3.1.5. Atomic Force Microscopy (AFM)
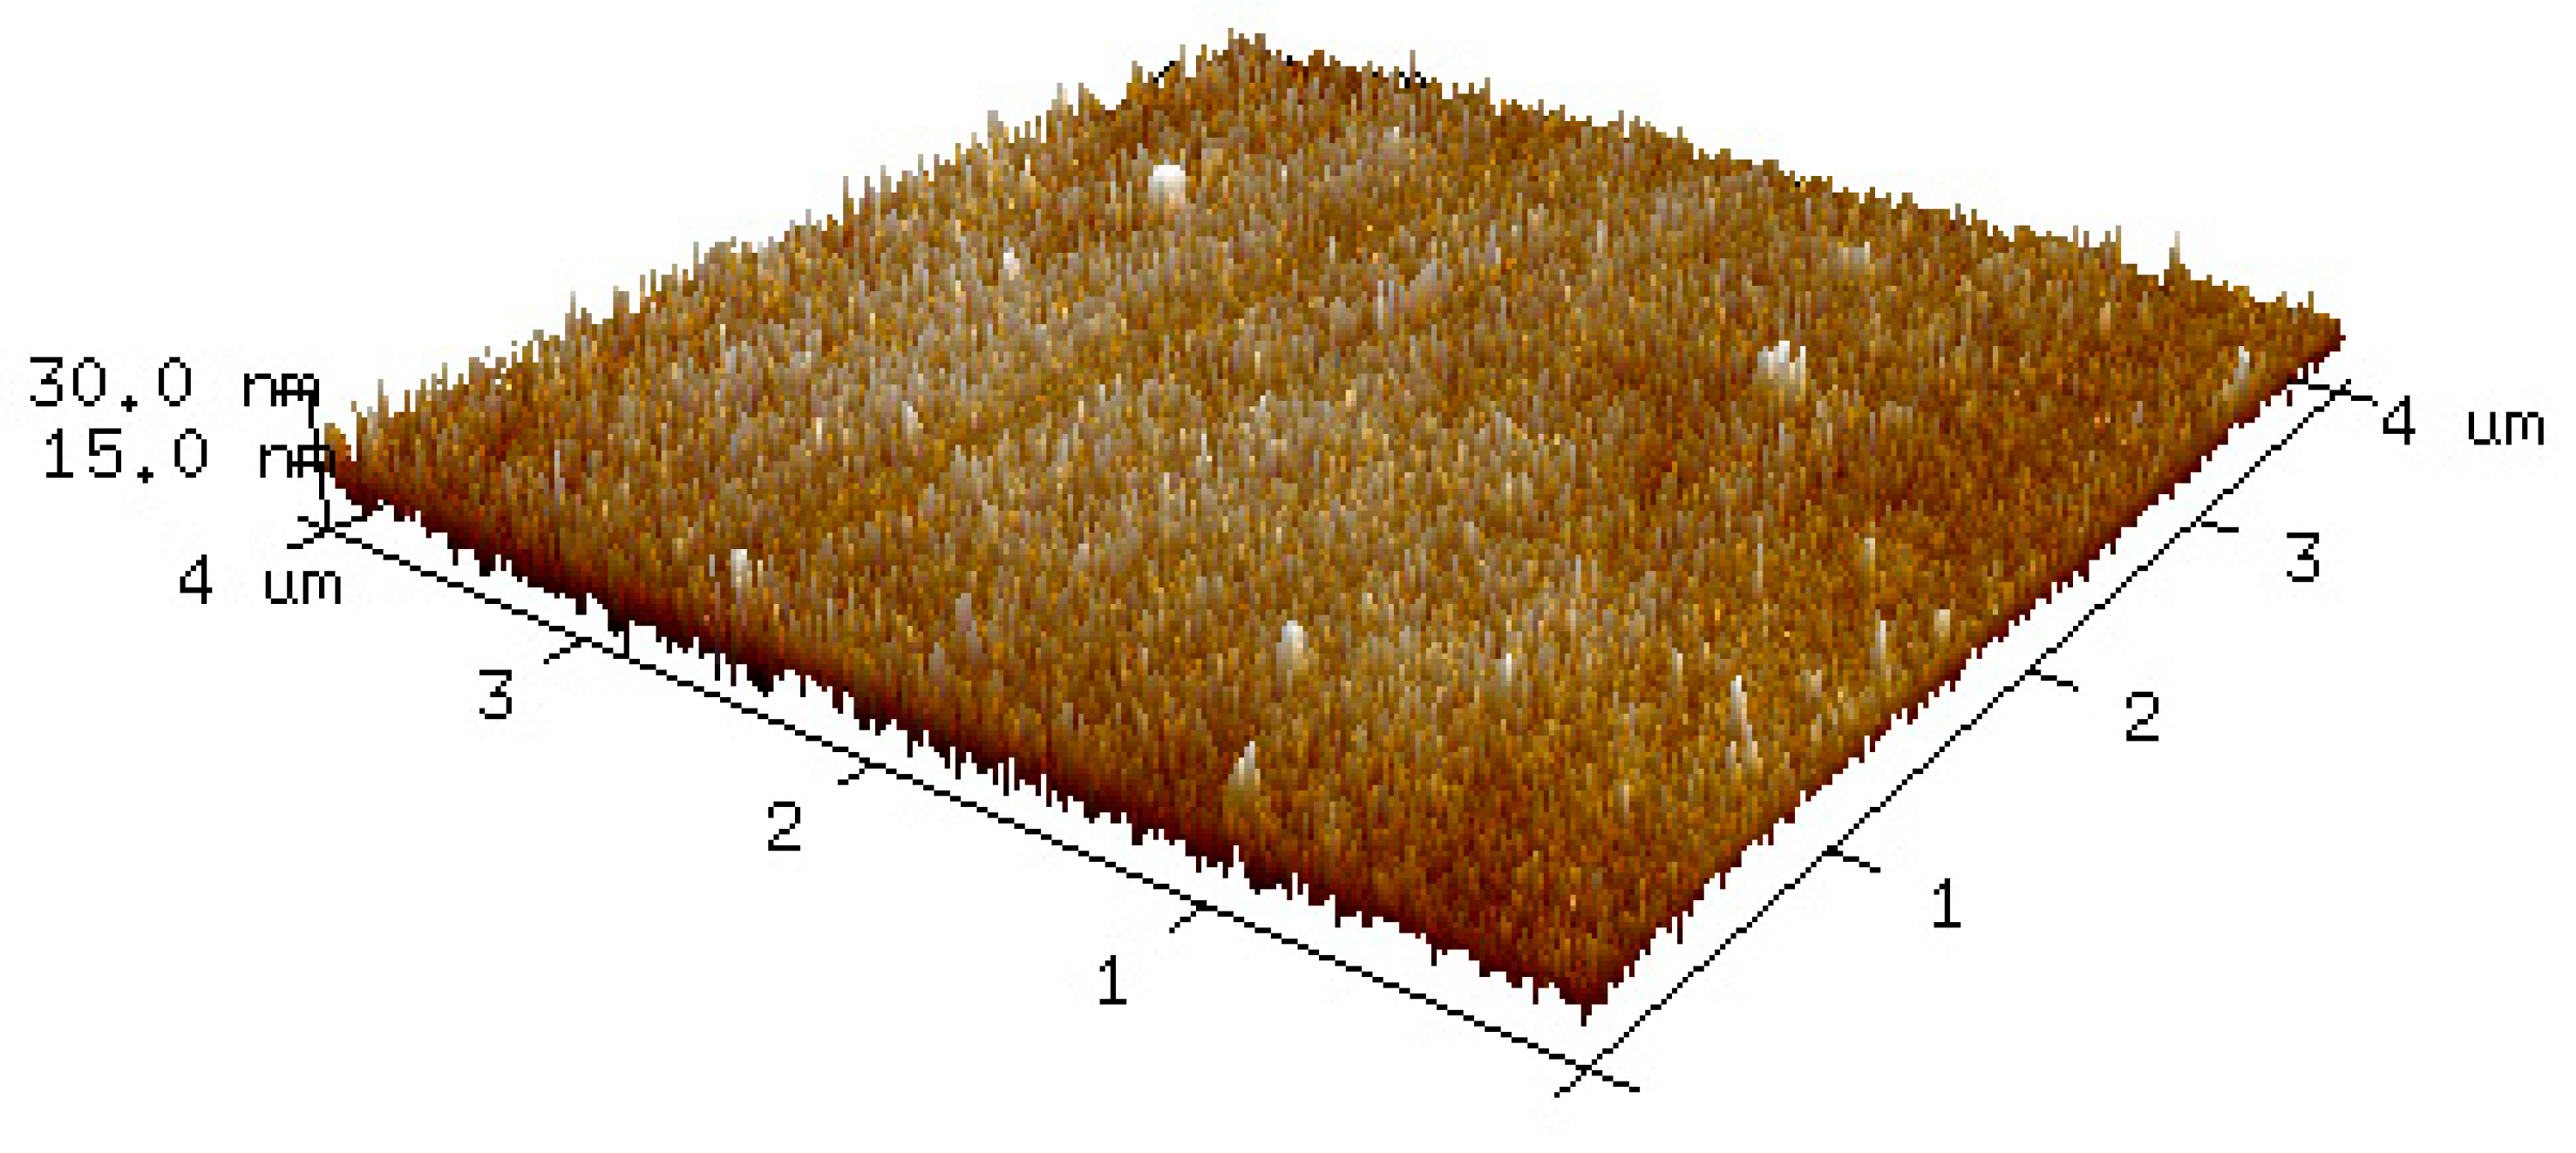
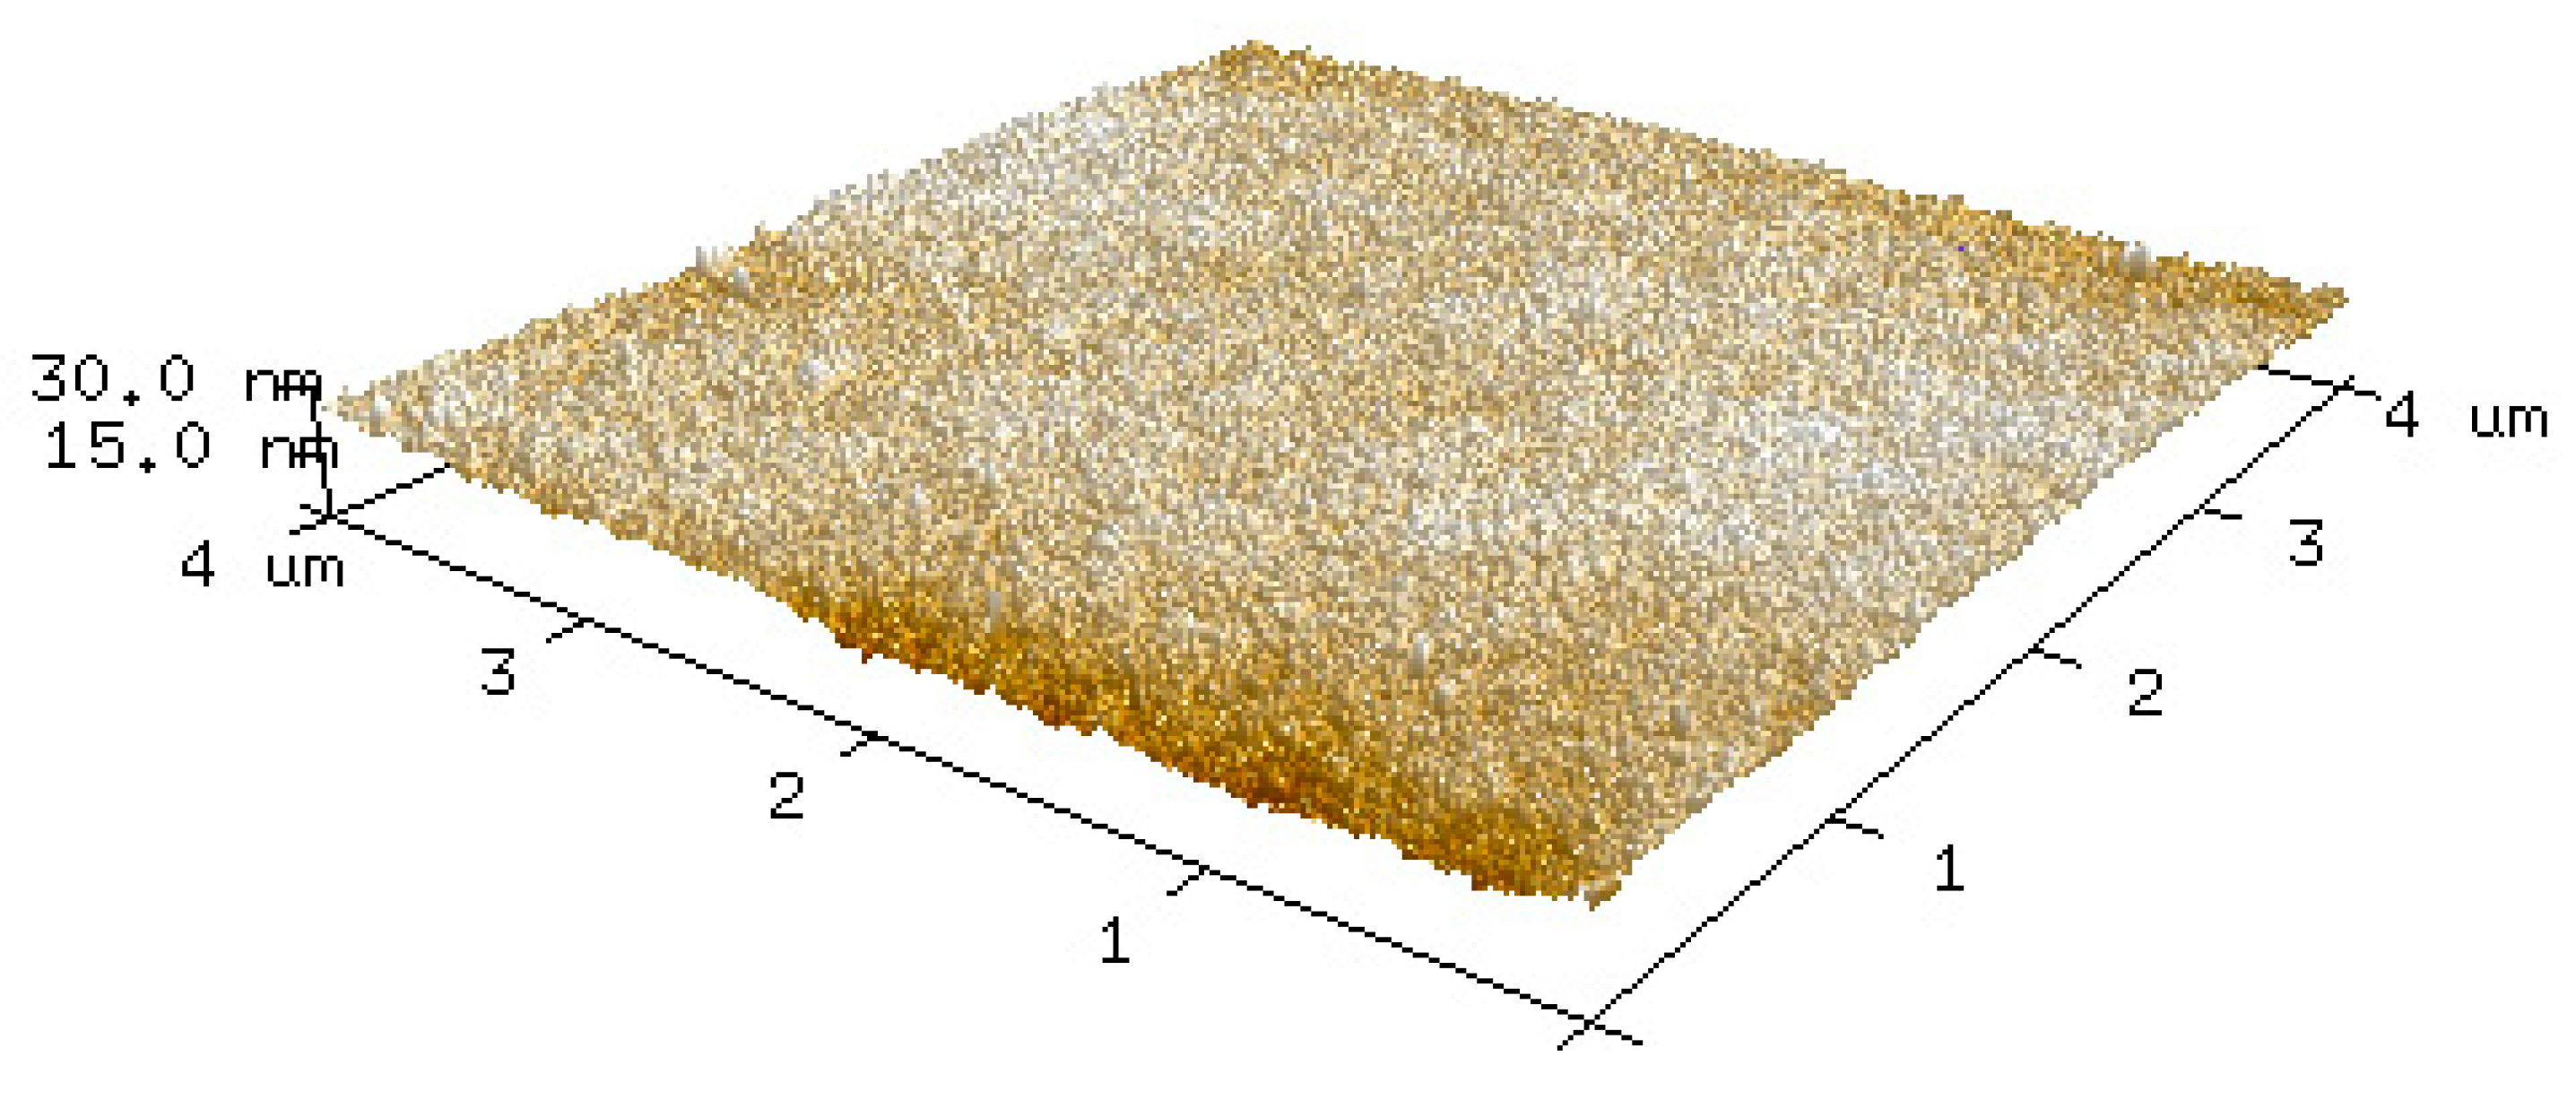
AFM was employed to examine the surface morphology and the roughness of the membranes. 3D images and roughness parameters are displayed in Figure 8 and Table 1. From the 3D images it is seen that both the uncoated and the coated membranes have relatively smooth surfaces, which is a main surface characteristic for the PES membranes [30]. However, it is obvious from the images that l-DOPA coating decreases the measured surface roughness of the PES membrane. The surface roughness parameters obtained from the Nanoscope software confirmed this and it is in agreement with previous studies [31]. After the coating, the average surface roughness Ra went down from 5.41 to 0.98 nm. The AFM results proved a successful l-DOPA coating on the surface.
3.2. Filtration Behavior of the UF Membranes
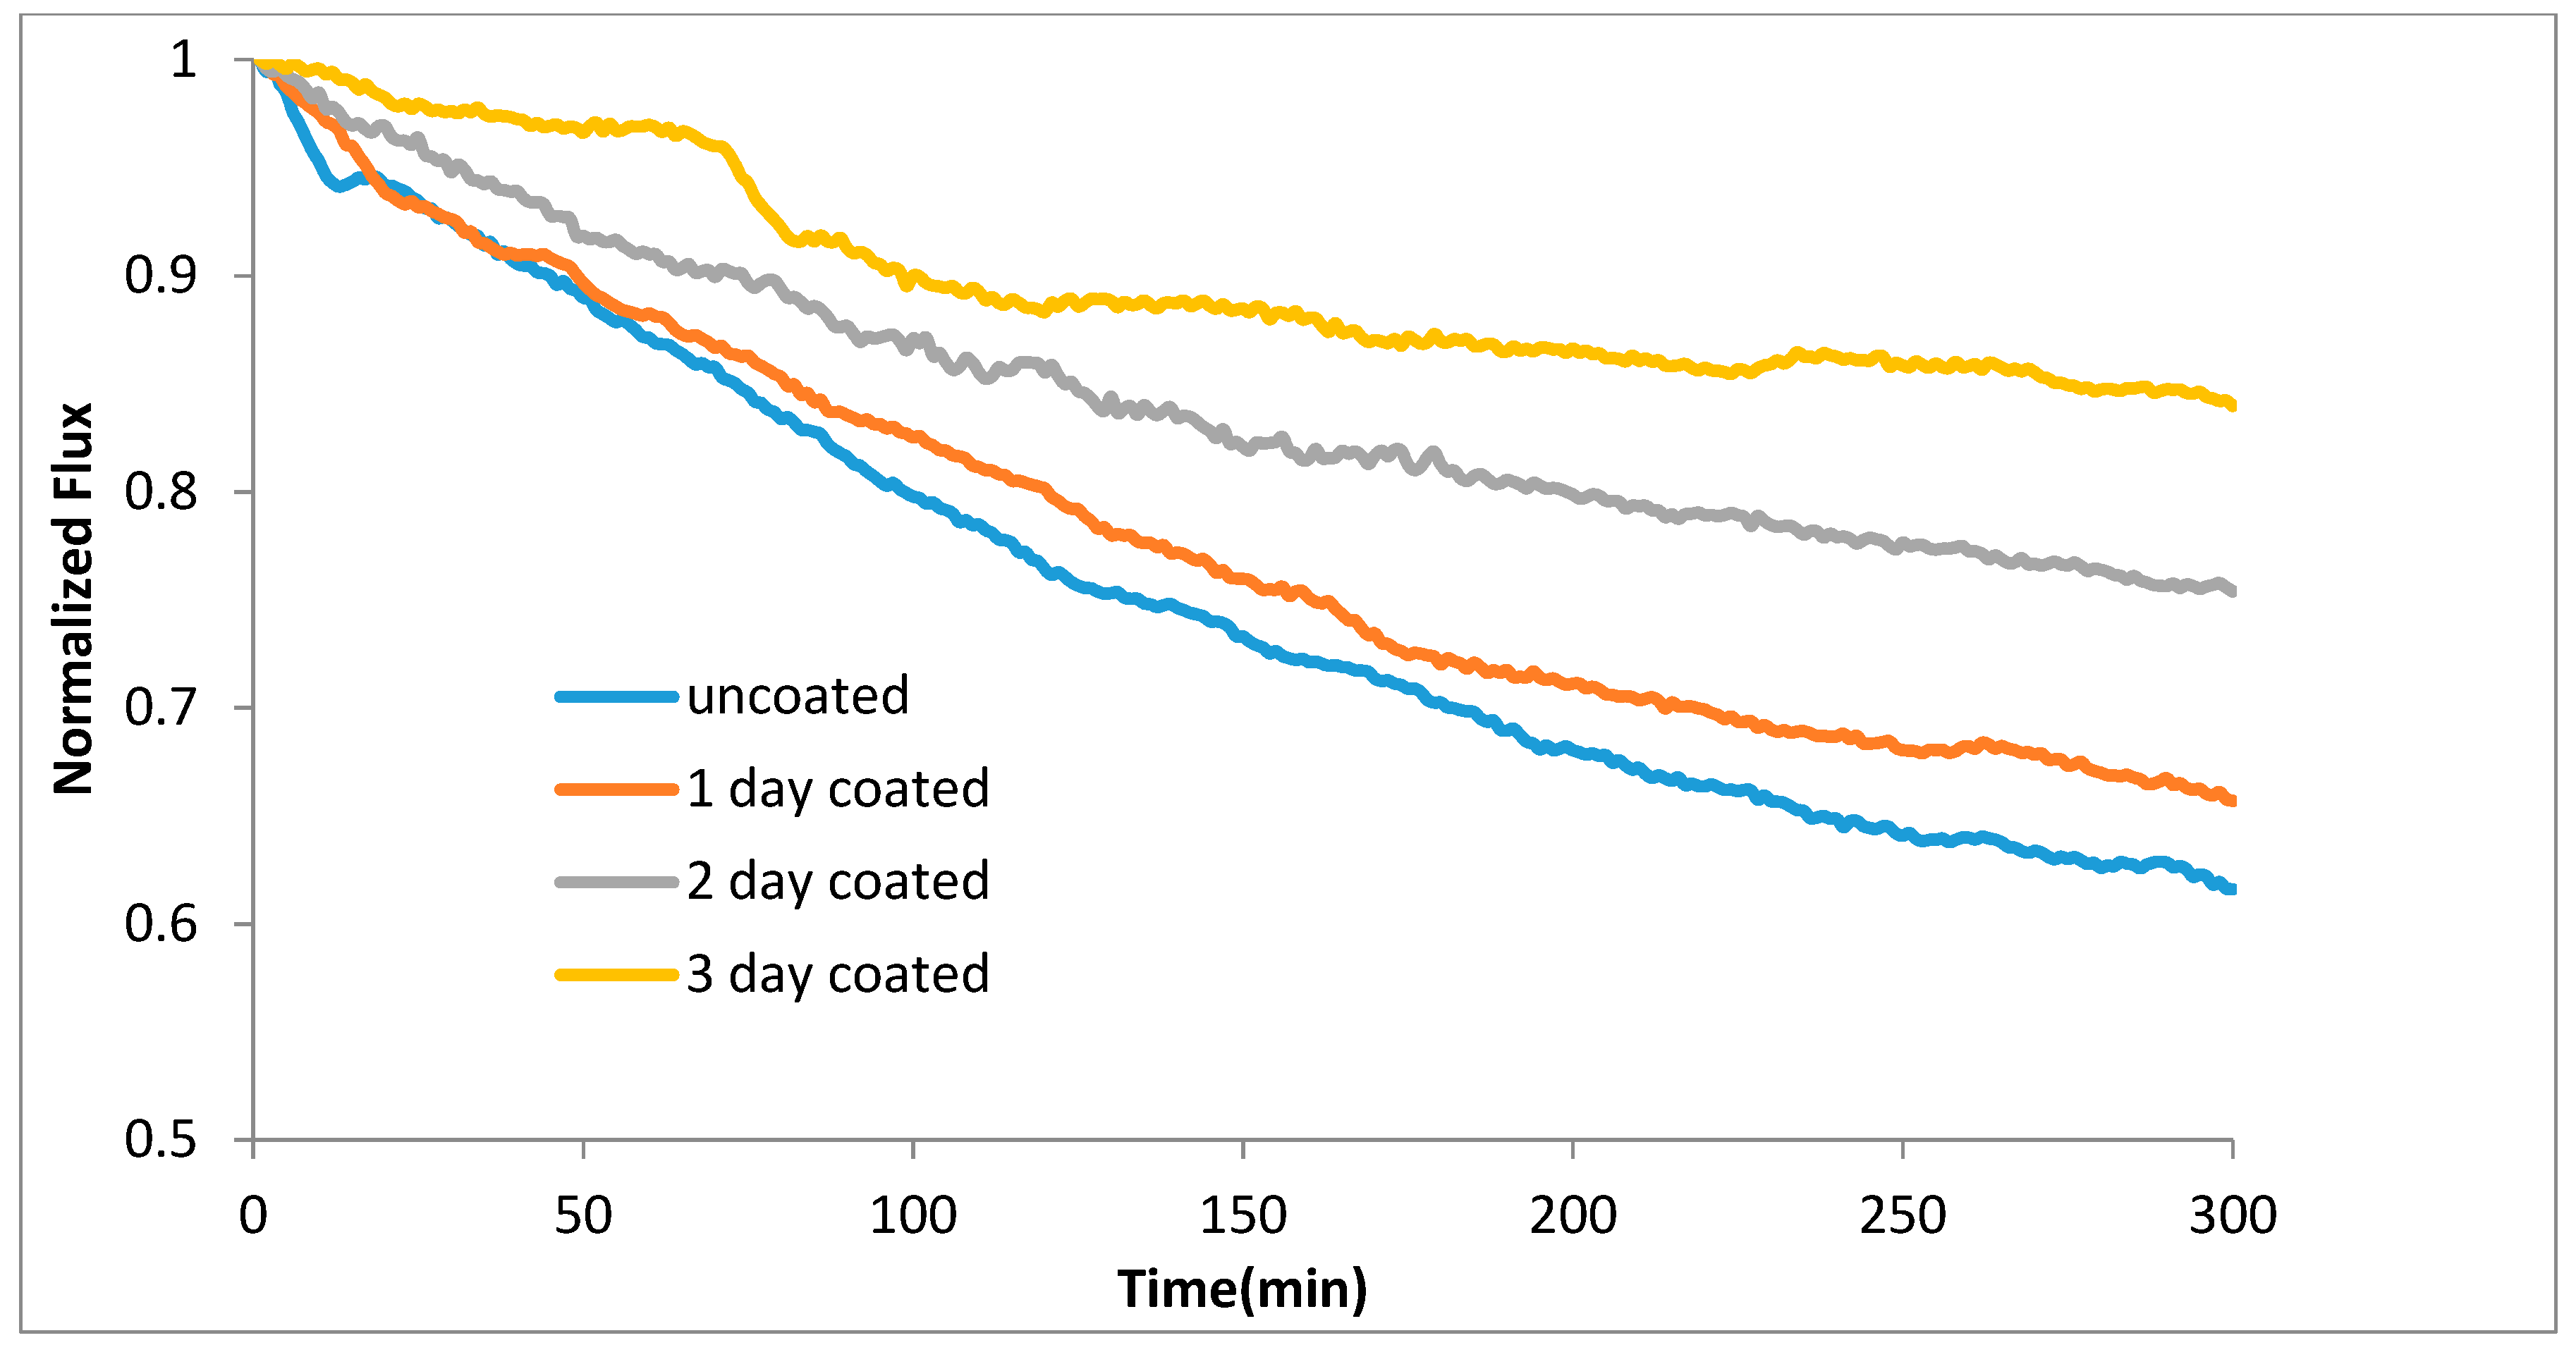
The UF experiments were conducted for 5 h to measure the flux decline of the coated and uncoated membranes due to exposure to PW. Because the observed initial flux values ranged from 42 to 127 LMH for the membranes, normalized flux was used to compare the flux behavior. The membranes exhibited different initial fluxes under identical operating conditions. The differences in observed initial flux values between the membranes were likely due to the two different batches of membranes obtained from the manufacturer. As presented in Figure 9, the uncoated membranes showed a 38.4% flux decline due to fouling over the 5 h experiment. The flux reduction was less for the coated membranes. The one-day and two-day coated membranes had 34.3% and 24.6% flux decline, respectively. The three-day coated membrane had the highest fouling resistance during the experiments. The flux decline due to fouling was only 16%.
The experiments showed a higher fouling resistance for the membranes after the l-DOPA coating as demonstrated by reduced flux decline for the coated membranes compared to the uncoated membranes. This was expected because the dopamine like materials were observed to improve the fouling behavior of the surface by increasing its hydrophilicity [32]. In the fouling experiments, the coated membranes performed better with the increased coating time. The maximum coating time of three days was studied because it was observed that even though the hydrophilicity of the membrane improved with proper poly(dopamine) coating time, an excessive coating might block the pores and decrease the water flux substantially [33].
The increase in the fouling resistance of membranes is due to the hydrophilic nature and the charge neutrality of l-DOPA coating. l-DOPA coating is assumed to increase the hydrophilicity by forming hydration layers on the surface between the charged groups and water molecules through electrostatic forces [15]. However, the charged groups of l-DOPA show a neutral charge when exposed to organic foulant particles to avoid any interaction. Membranes coated with l-DOPA also exhibit higher fouling resistance against mineral scaling by maintaining the strong hydration layers.
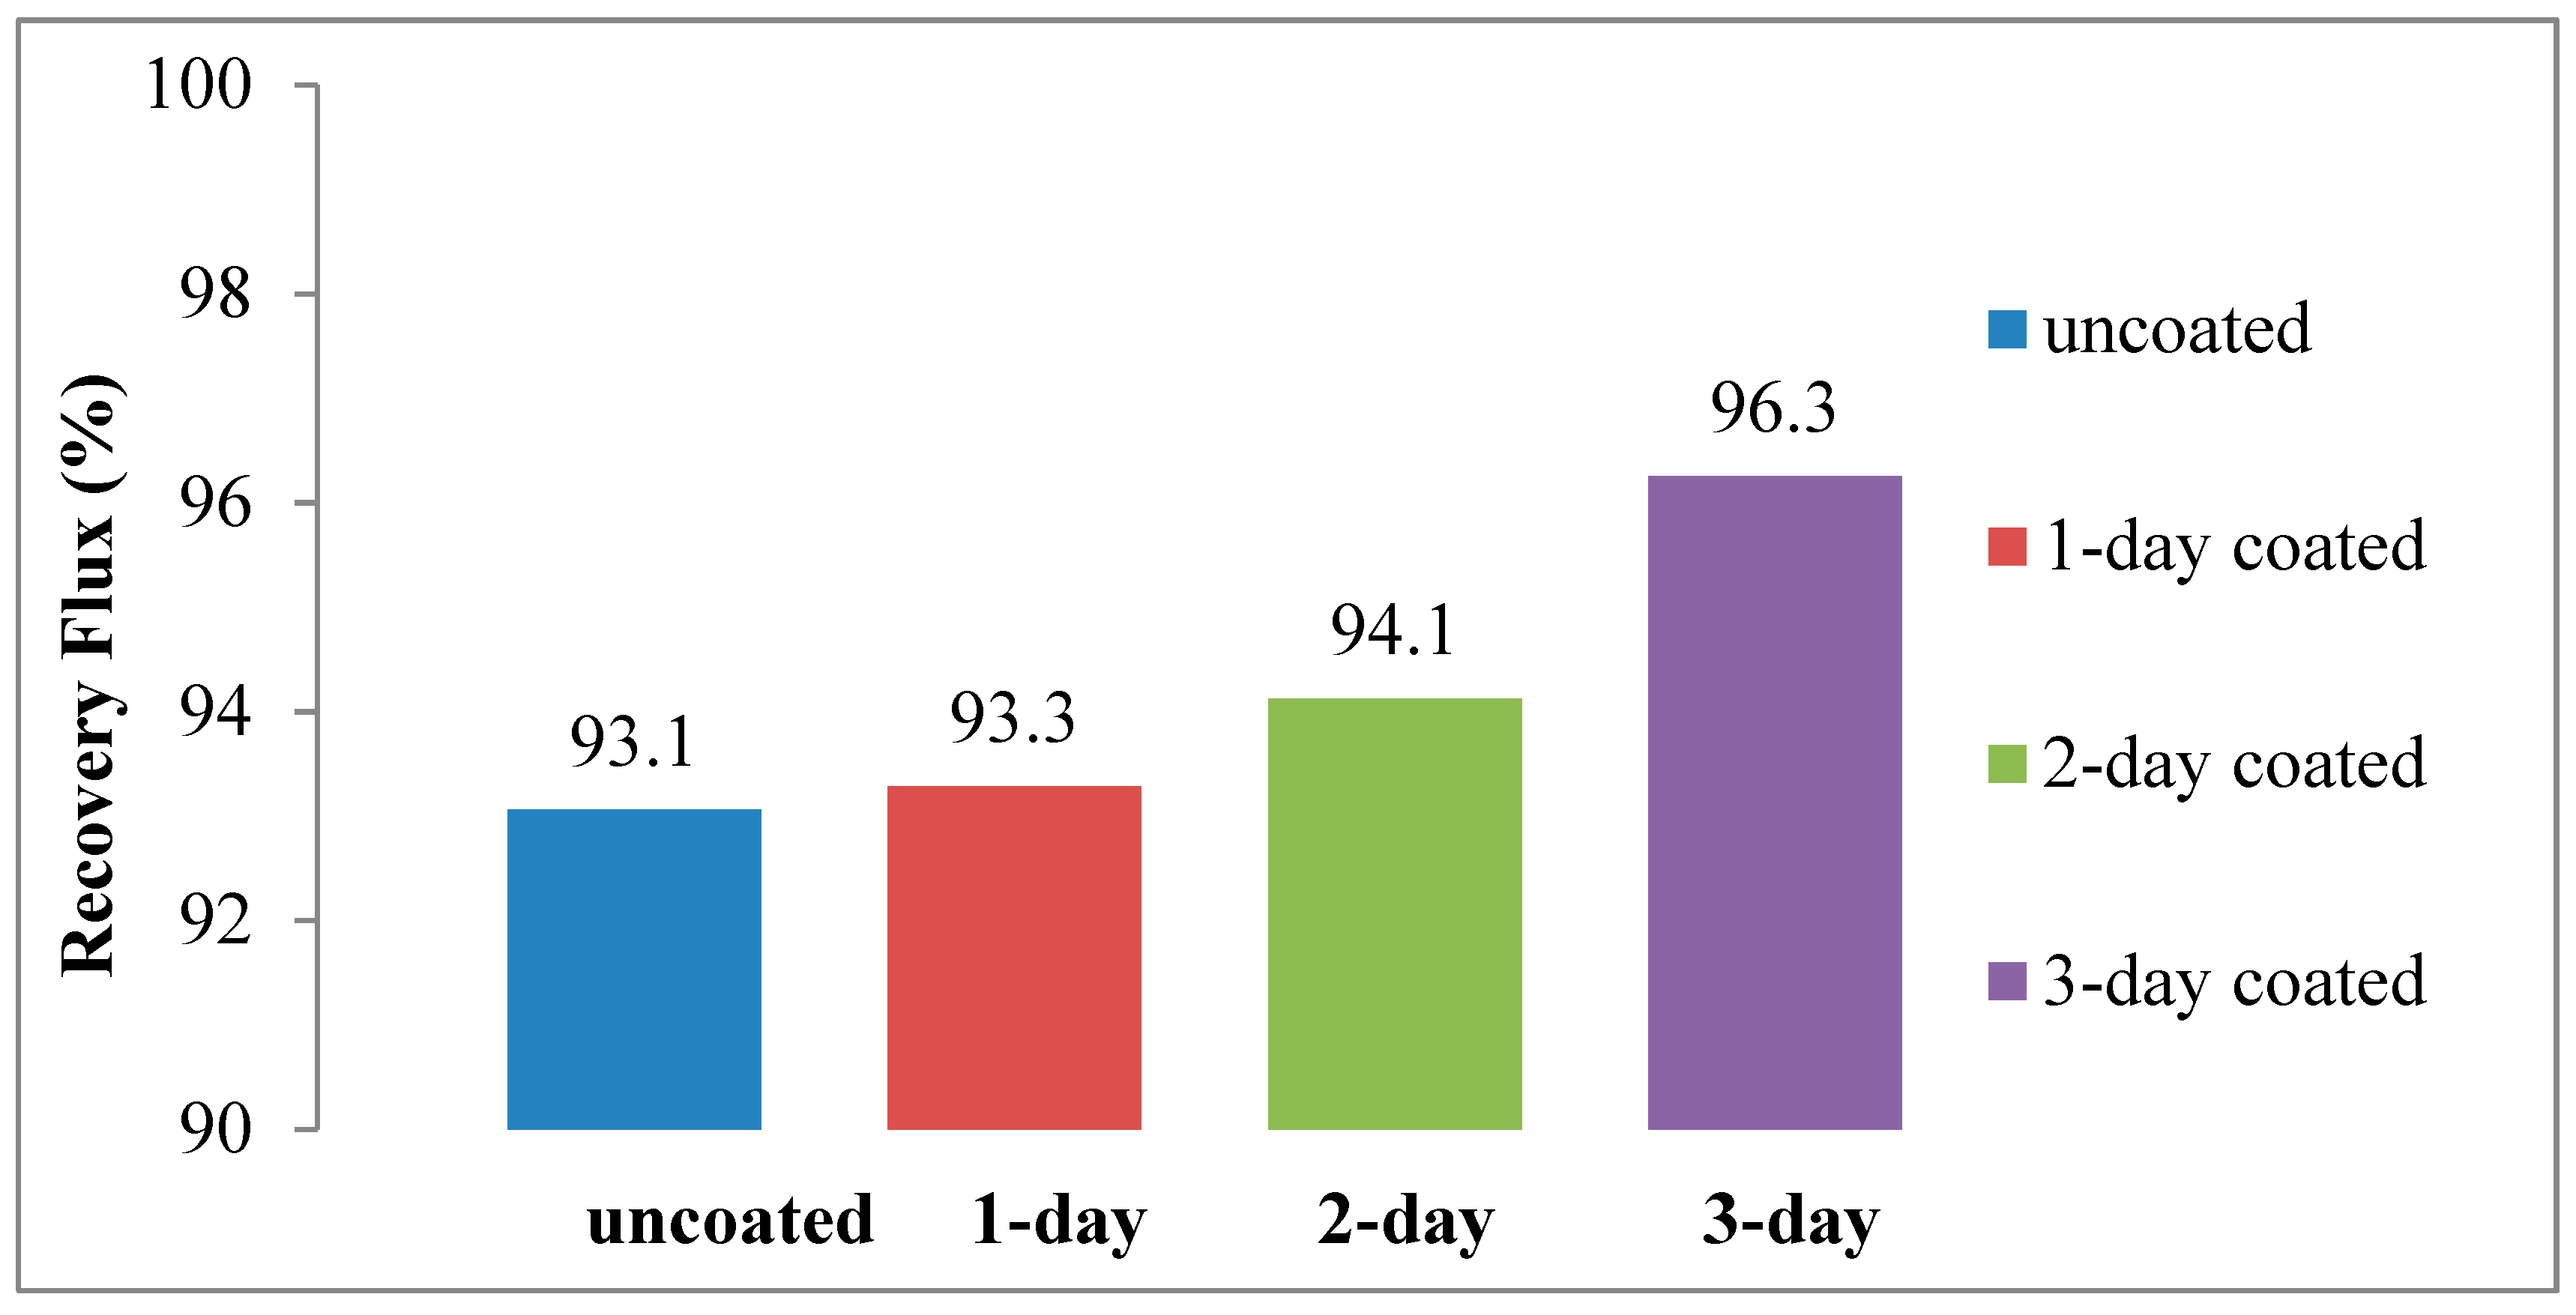
The UF membranes were cleaned by backwashing with DI water to test the flux recovery after fouling. The results are illustrated in Figure 10. It was observed that after 30 min of cleaning, the uncoated membrane regained 93.1% of its initial flux while the same was 96.3% for the three-day coated membrane. The coating helped the membrane to achieve a higher flux recovery. There was 3.2% improvement for the three-day coated membrane. This indicated that the improvement in hydrophilicity after l-DOPA coating helped the membranes to become more resistant against fouling. It is likely that the particles were more loosely attached to the surface of the coated membranes. Therefore, those particles were washed off relatively easily during the cleaning. It can also be concluded that the cleaning with water only was sufficient to achieve a higher flux recovery for coated membranes due to the reversible nature of the fouling particles on the surface. This will likely reduce the need for chemical cleaning and extend the operational life of the membranes.
3.3. The Effect of UF on the Flux Behavior of the FO Membranes
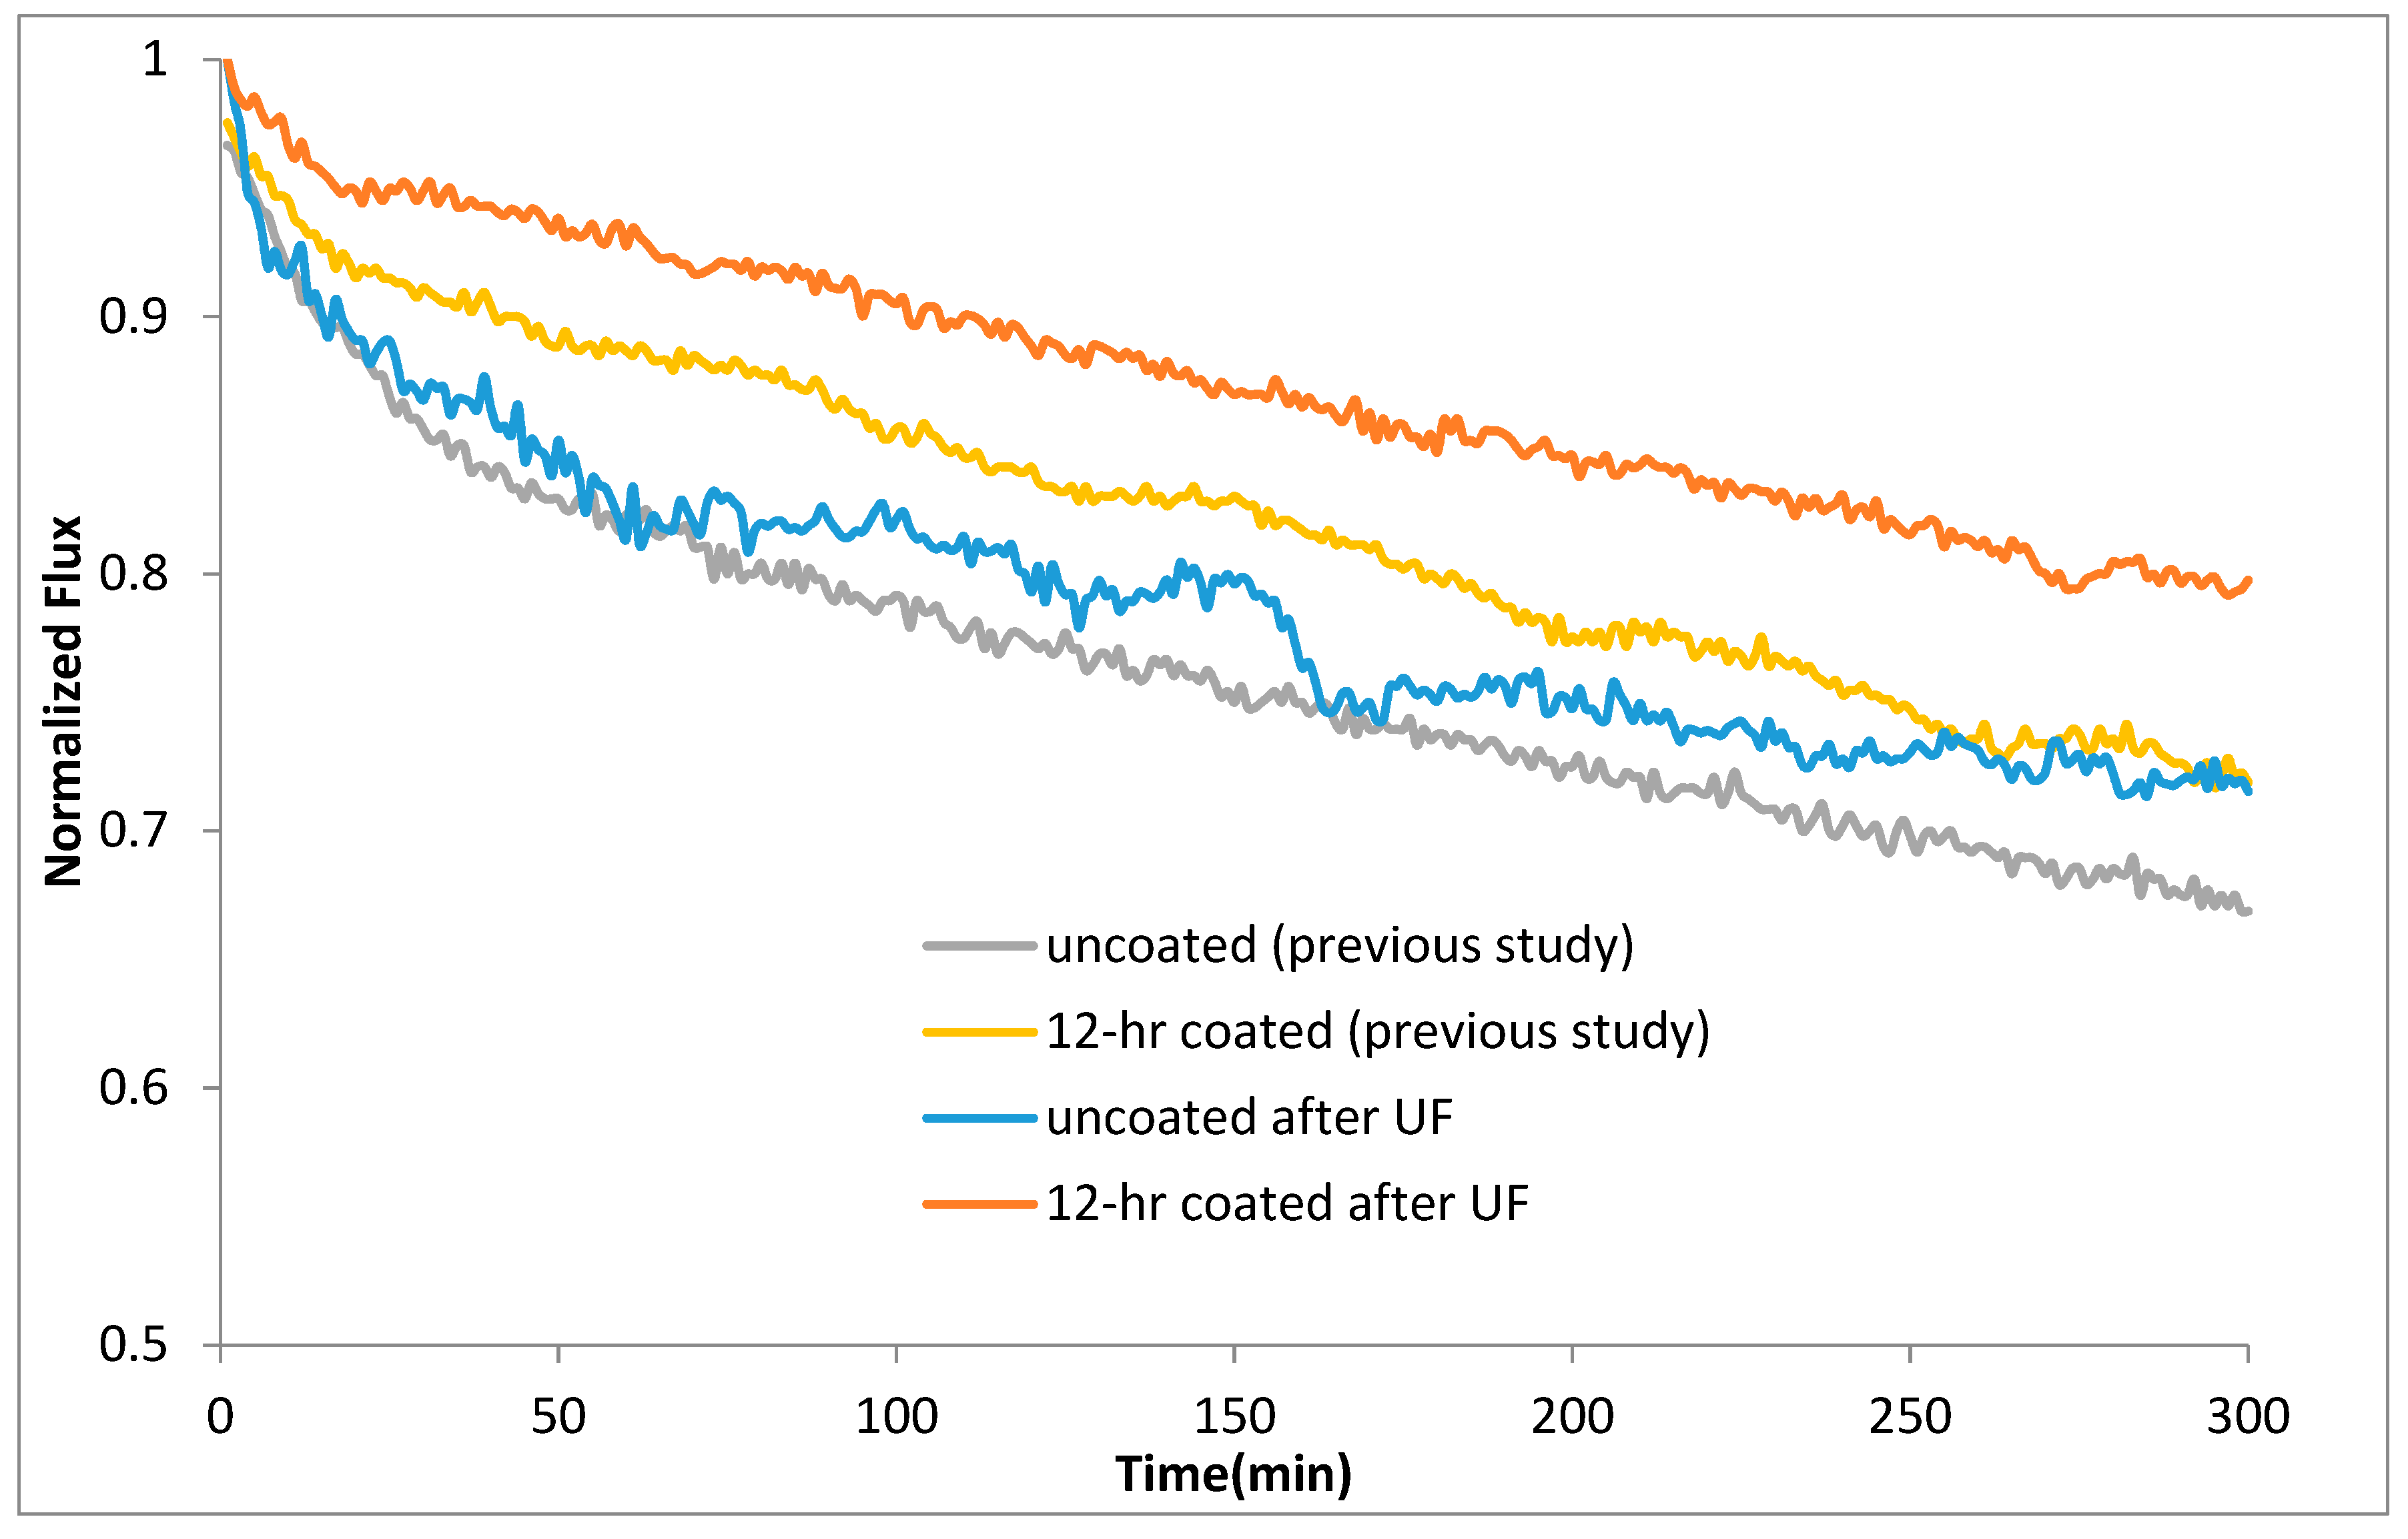
Finally, PW was treated in the FO system to examine the effect of UF pretreatment. FO was chosen as a later treatment because it effectively treated the shale oil and gas PW in our previous study [34]. In the previous study, the PW from the Permian Basin was treated in the FO system after the vacuum filtration using only 0.45 μm filters. The flux behaviors of the FO membranes in both studies were compared with each other to check the improvement. The PW used in the previous study had an average TDS of 120,000 mg/L. The PW used in the present study had an average TDS of 190,000 mg/L. Even though the TDS content of the previous PW used was almost 60% of the present one, a significant improvement after the UF pretreatment was observed. As shown in Figure 11, without the UF pretreatment, the normalized flux decreased to 66.9% after 300 min. The improvement after 12 h l-DOPA coating was not significant either. The flux was reduced to 71.9%. The 5.0% improvement was achieved after the coating. Moreover, even though there was an improvement after coating, the improved flux was not stable and the coated membrane performed the same as the uncoated one during most of the experiment time. The improvement occurred only towards the end of the experiment. However, after the UF, the fouling behavior of the FO was greatly improved. The flux was reduced to 71.5% for the uncoated one, similar to the coated membrane without the UF. After the l-DOPA coating, the reduction was less than that. The flux was reduced to 79.8%, showing a better improvement compared to the previous study. After 5 h, the flux reduction was only 20.2%, even with the PW that had very high concentration of solids. It was concluded that the improvement in the flux is most likely because of the effective pretreatment with UF. The quality of the PW should have been improved since the UF further removed the dissolved solids and organic materials present. It should also be noted that after the UF pretreatment, the FO membranes showed more stabilized flux. The findings proved that the UF had a positive effect on the flux behavior of the FO membranes.
3.4. Permeate Quality
Table 2 shows the permeate quality characterized as TDS, TOC, and COD after PW was treated with UF and FO. The TDS concentration after the UF treatment was still high. This indicates that the salt rejection in ultrafiltration was low. It is expected since the separation of the UF is based on a size exclusion principle. Because the size of salt ions present in the PW is smaller than the UF membrane pore size, these smaller ions pass through the membrane. The UF was more effective in the removal of the organics. After the UF, TOC was removed by 21% and the COD removal was around 23%. The effectiveness of the UF as a pretreatment is attributed to the rejection of organic contaminants.
The water quality analysis after FO represents the composite sample of diluted draw solution. FO was able to achieve high rejection rates of contaminants. The TOC and COD were found to be 1.5 and <20 mg/L, respectively. The TDS value simply reflects the fact that 2 M MgCl2 was used as draw solution to generate enough osmotic pressure gradient between the feed and draw solution. A post-treatment is required to further separate the pure water from diluted MgCl2 draw solution because the product after the FO is rarely usable. After the separation, the MgCl2 draw solution could be reused in the future to reduce the cost of the treatment. Membrane distillation could be used as a post-treatment to regenerate the draw solution. Overall, the FO results proved that it is effective in the removal of most of the contaminants from PW and FO can promote a high organic and inorganic contaminant rejection.
4. Conclusions
Shale oil PW was treated using UF in this research. The commercial UF membranes were coated to reduce the membrane fouling during the UF filtration. The membranes were coated for one, two, and three days using a dip coating technique with zwitterionic l-DOPA. The membrane characterization tests were performed for the UF membranes to check if the coating was successful. Among all the coated UF membranes, the three-day coated sample showed the highest fouling resistance. The flux was reduced by 16% for the three-day coated membrane while it was 38.4% for an uncoated membrane. Recovery of the flux was also higher for the coated UF membranes. After 30 min of backwashing, the coated UF membranes gained 96.3% of their initial flux while it was 93.1% for the uncoated membranes. The UF pretreatment also had a positive effect on the flux behavior of the FO system. It was concluded that the l-DOPA coating improved the fouling resistance of UF membranes and it can be used as a pretreatment for PW at high TDS concentrations. The l-DOPA coating is easy, relatively inexpensive, and can be used on commercially available membranes after fabrication.
Author Contributions
Conceptualization, H.D.; methodology, H.D. and M.B.; investigation, M.B.; resources, R.R.K.; data curation, M.B.; writing—original draft preparation, M.B.; writing—review and editing, H.D., V.S.V.B., R.R.K.; supervision, R.R.K.; project administration, R.R.K.; funding acquisition, R.R.K.
Funding
This research was funded by the National Science Foundation (NSF) through the Center for Energy and Environmental Sustainability (CEES) at Prairie View A&M University, CREST Award #1036593.
Acknowledgments
We appreciate the help for AFM experiments from Yordanos Bisrat at the Materials Characterization Facility, Texas A&M University in College Station, Texas.
Conflicts of Interest
The authors declare no conflicts of interest.
References
- Robinson, D. Oil and gas: Water treatment in oil and gas production—Does it matter? Filtr. Sep. 2010, 47, 14–18. [Google Scholar] [CrossRef]
- Mondal, S.; Wickramasinghe, S.R. Produced water treatment by nanofiltration and reverse osmosis membranes. J. Membr. Sci. 2008, 322, 162–170. [Google Scholar] [CrossRef]
- Guerra, K.; Dahm, K.; Dundorf, S. Texas Permian Basin Oil Production 2008 through 2017. 2018, p. 1. Available online: http://www.rrc.state.tx.us/media/41514/permianbasin_oil_perday.pdf: http://www.rrc.state.tx.us (accessed on 30 May 2019).
- Hildenbrand, Z.L.; Carlton, D.D.; Fontenot, B.E.; Meik, J.M.; Walton, J.L.; Thacker, J.B.; Korlie, S.; Shelor, C.P.; Kadjo, A.F.; Clark, A.; et al. Temporal variation in groundwater quality in the Permian Basin of Texas, a region of increasing unconventional oil and gas development. Sci. Total Environ. 2016, 562, 906–913. [Google Scholar] [CrossRef] [PubMed]
- Gaswirth, S.B.; Marra, K.R.; Lillis, P.G.; Mercier, T.J.; Leathers-Miller, H.M.; Schenk, C.J.; Klett, T.R.; Le, P.A.; Tennyson, M.E.; Hawkins, S.J.; et al. Assessment of Undiscovered Continuous Oil Resources in the Wolfcamp Shale of the Midland Basin, Permian Basin Province, Texas, 2016; U.S. Geological Survey Fact Sheet 2016–3092: Reston, VA, USA, 2016.
- Songchitruksa, P.; Henk, R.; Venglar, S.; Zeng, X. Dynamic Traffic Assignment Evaluation of Hurricane Evacuation Strategies for the Houston-Galveston, Texas, Region. Transp. Res. Rec. J. Trans. Res. Board 2012, 2312, 108–119. [Google Scholar] [CrossRef]
- Columbia Water Center. Barclays, the Water Challenge: Preserving a Global Resource; Columbia Water Center: New York, NY, USA, 2017. [Google Scholar]
- Guerra, K.; Dahm, K.; Dundorf, S. Oil and Gas Produced Water Management and Beneficial Use in the Western United States; U.S. Department of the Interior Bureau of Reclamation: Denver, CO, USA, 2011; pp. 1–113.
- Blondes, M.S.; Gans, K.D.; Engle, M.A.; Kharaka, Y.K.; Reidy, M.E.; Sawaswathula, V.; Thordsen, J.J.; Rowan, E.L.; Morrissey, E.A. U.S. Geological Survey National Produced Waters Geochemical Database v2.3; US Geological Survey, Eastern Energy Resources Science Center: Reston, VA, USA, 2017.
- Alzahrani, S.; Mohammad, A.W. Challenges and trends in membrane technology implementation for produced water treatment: A review. J. Water Process Eng. 2014, 4, 107–133. [Google Scholar] [CrossRef]
- Fakhru’l-Razi, A.; Pendashteh, A.; Abdullah, L.C.; Biak, D.R.A.; Madaeni, S.S.; Abidin, Z.Z. Review of technologies for oil and gas produced water treatment. J. Hazard. Mater. 2009, 170, 530–551. [Google Scholar] [CrossRef] [PubMed]
- Igunnu, E.T.; Chen, G.Z. Produced water treatment technologies. Int. J. Low-Carbon Technol. 2012, 9, 157–177. [Google Scholar] [CrossRef] [Green Version]
- Cheryan, M.; Rajagopalan, N. Membrane processing of oily streams. Wastewater treatment and waste reduction. J. Membr. Sci. 1998, 151, 13–28. [Google Scholar] [CrossRef]
- Wan Ikhsan, S.N.; Yusof, N.; Aziz, F.; Nurasyikin, M. A review of oilfield wastewater treatment using membrane filtration over conventional technology. Malays. J. Anal. Sci. 2017, 21, 643–658. [Google Scholar]
- Bilstad, T.; Espedal, E. Membrane separation of produced water. Water Sci. Technol. 1996, 34, 239–246. [Google Scholar] [CrossRef]
- Çakmakce, M.; Kayaalp, N.; Koyuncu, I. Desalination of produced water from oil production fields by membrane processes. Desalination 2008, 222, 176–186. [Google Scholar] [CrossRef]
- Ebrahimi, M.; Willershausen, D.; Ashaghi, K.S.; Engel, L.; Placido, L.; Mund, P.; Bolduan, P.; Czermak, P. Investigations on the use of different ceramic membranes for efficient oil-field produced water treatment. Desalination 2010, 250, 991–996. [Google Scholar] [CrossRef] [Green Version]
- Li, Y.S.; Yan, L.; Xiang, C.B.; Hong, L.J. Treatment of oily wastewater by organic–inorganic composite tubular ultrafiltration (UF) membranes. Desalination 2006, 196, 76–83. [Google Scholar] [CrossRef]
- Salahi, A.; Abbasi, M.; Mohammadi, T. Permeate flux decline during UF of oily wastewater: Experimental and modeling. Desalination 2010, 251, 153–160. [Google Scholar] [CrossRef]
- Teodosiu, C.C.; Kennedy, M.D.; van Straten, H.A.; Schippers, J.C. Evaluation of secondary refinery effluent treatment using ultrafiltration membranes. Water Res. 1999, 33, 2172–2180. [Google Scholar] [CrossRef]
- Shahkaramipour, N.; Tran, N.T.; Ramanan, S.; Lin, H. Membranes with Surface-Enhanced Antifouling Properties for Water Purification. Membranes 2017, 7, 13. [Google Scholar] [CrossRef]
- Xu, Z.; Zhang, J.; Shan, M.; Li, Y.; Li, B.; Niu, J.; Zhou, B.; Qian, X. Organosilane-functionalized graphene oxide for enhanced antifouling and mechanical properties of polyvinylidene fluoride ultrafiltration membranes. J. Membr. Sci. 2014, 458, 1–13. [Google Scholar] [CrossRef]
- Yu, L.-Y.; Xu, Z.-L.; Shen, H.-M.; Yang, H. Preparation and characterization of PVDF–SiO2 composite hollow fiber UF membrane by sol–gel method. J. Membr. Sci. 2009, 337, 257–265. [Google Scholar] [CrossRef]
- Hoseinpour, V.; Ghaee, A.; Vatanpour, V.; Ghaemi, N. Surface modification of PES membrane via aminolysis and immobilization of carboxymethylcellulose and sulphated carboxymethylcellulose for hemodialysis. Carbohydr. Polym. 2018, 188, 37–47. [Google Scholar] [CrossRef]
- Bernsmann, F.; Ball, V.; Addiego, F.; Ponche, A.; Michel, M.; Gracio, J.J.D.A.; Toniazzo, V.; Ruch, D. Dopamine–Melanin Film Deposition Depends on the Used Oxidant and Buffer Solution. Langmuir 2011, 27, 2819–2825. [Google Scholar] [CrossRef]
- Modi, A.; Verma, S.K.; Bellare, J. Extracellular matrix-coated polyethersulfone-TPGS hollow fiber membranes showing improved biocompatibility and uremic toxins removal for bioartificial kidney application. Colloids Surf. B Biointerfaces 2018, 167, 457–467. [Google Scholar] [CrossRef]
- Nguyen, A.; Azari, S.; Zou, L. Coating zwitterionic amino acid l-DOPA to increase fouling resistance of forward osmosis membrane. Desalination 2013, 312, 82–87. [Google Scholar] [CrossRef]
- Chu, K.H.; Huang, Y.; Yu, M.; Heo, J.; Flora, J.R.V.; Jang, A.; Jang, M.; Jung, C.; Park, C.M.; Kim, D.-H.; et al. Evaluation of graphene oxide-coated ultrafiltration membranes for humic acid removal at different pH and conductivity conditions. Sep. Purif. Technol. 2017, 181, 139–147. [Google Scholar] [CrossRef]
- Clark, J. The Acid-Base Behaviour of Amino Acids. 2004 2016/04. Available online: https://www.chemguide.co.uk/organicprops/aminoacids/acidbase.html (accessed on 22 June 2018).
- Mohd Shafie, Z.M.H.; Ahmad, A.L. Juxtaposition of PES based hollow fiber membrane: Antifouling and antibacterial potential of LiCl mediated PVA–ZnO blend. J. Ind. Eng. Chem. 2018, 62, 273–283. [Google Scholar] [CrossRef]
- Zhang, X.; Niu, L.; Li, F.; Yu, S.; Zhao, X.; Hu, H. Effect of gamma-ray irradiation at low doses on the performance of PES ultrafiltration membrane. Radiat. Phys. Chem. 2016, 127, 127–132. [Google Scholar] [CrossRef]
- Jiang, J.-H.; Zhu, L.-P.; Li, X.-L.; Xu, Y.-Y.; Zhu, B.-K. Surface modification of PE porous membranes based on the strong adhesion of polydopamine and covalent immobilization of heparin. J. Membr. Sci. 2010, 364, 194–202. [Google Scholar] [CrossRef]
- Xi, Z.-Y.; Xu, Y.-Y.; Zhu, L.-P.; Wang, Y.; Zhu, B.-K. A facile method of surface modification for hydrophobic polymer membranes based on the adhesive behavior of poly(DOPA) and poly(dopamine). J. Membr. Sci. 2009, 327, 244–253. [Google Scholar] [CrossRef]
- Pradeep Potluri, S. Shale Oil Produced Water Treatment Using Zwitterionic Amino Acid L-DOPA Modified Forward Osmosis Membranes, in Engineering. Master’s Thesis, Prairie View A & M University, Prairie View, TX, USA, 2017. [Google Scholar]
Figure 1.
Flow diagram for the ultrafiltration (UF) membrane test cell system.

Figure 2.
The flow diagram for the forward osmosis (FO) system.

Figure 3.
The contact angles of the uncoated and the coated membranes.

Figure 4.
The UV-vis absorbance of uncoated and coated membranes.

Figure 5.
The changes in the colors of the membranes due to coating.

Figure 6.
The Attenuated total reflection- Fourier Transform Infrared (ATR-FTIR) spectra of the uncoated and the coated membranes.
Figure 6.
The Attenuated total reflection- Fourier Transform Infrared (ATR-FTIR) spectra of the uncoated and the coated membranes.

Figure 7.
The zeta potentials of the uncoated and three-day coated membranes. Symbols represent the average of two measurements made at each pH value for each membrane sample.
Figure 7.
The zeta potentials of the uncoated and three-day coated membranes. Symbols represent the average of two measurements made at each pH value for each membrane sample.

Figure 8.
The 3D atomic force microscopy (AFM) images of an uncoated membrane (top) and a three-day coated membrane (bottom).
Figure 8.
The 3D atomic force microscopy (AFM) images of an uncoated membrane (top) and a three-day coated membrane (bottom).


Figure 9.
The normalized flux for the UF membranes (10 min average).

Figure 10.
Recovery of the water flux for the UF membranes after cleaning.

Figure 11.
The effect of UF on the fouling behavior of the uncoated and the coated FO membranes.


Table 1.
The surface roughness parameters of the membranes.
| Roughness Parameters (nm) | Uncoated | Three-Day Coated |
|---|---|---|
| Ra | 5.41 | 0.975 |
| Rq | 7.09 | 1.24 |
| Rmax | 188 | 23.3 |
Table 2.
Permeate quality parameters.
| Parameters (mg/L) | Before Ultrafiltration | After Ultrafiltration | After Forward Osmosis |
|---|---|---|---|
| TDS | 191,505 | 182,000 | 303,750 |
| TOC | 156 | 123 | 1.5 |
| COD | 3218 | 2493 | <20 |
© 2019 by the authors. Licensee MDPI, Basel, Switzerland. This article is an open access article distributed under the terms and conditions of the Creative Commons Attribution (CC BY) license (http://creativecommons.org/licenses/by/4.0/).
Share and Cite
MDPI and ACS Style
Babayev, M.; Du, H.; Botlaguduru, V.S.V.; Kommalapati, R.R. Zwitterion-Modified Ultrafiltration Membranes for Permian Basin Produced Water Pretreatment. Water 2019, 11, 1710. https://doi.org/10.3390/w11081710
AMA Style
Babayev M, Du H, Botlaguduru VSV, Kommalapati RR. Zwitterion-Modified Ultrafiltration Membranes for Permian Basin Produced Water Pretreatment. Water. 2019; 11(8):1710. https://doi.org/10.3390/w11081710
Chicago/Turabian StyleBabayev, Mirjalal, Hongbo Du, Venkata S. V. Botlaguduru, and Raghava R. Kommalapati. 2019. "Zwitterion-Modified Ultrafiltration Membranes for Permian Basin Produced Water Pretreatment" Water 11, no. 8: 1710. https://doi.org/10.3390/w11081710
Note that from the first issue of 2016, this journal uses article numbers instead of page numbers. See further details here.