Spatiotemporal Variations of Summer Precipitation and Their Correlations with the East Asian Summer Monsoon in the Poyang Lake Basin, China


1
Key Laboratory of Watershed Geographic Sciences, Nanjing Institute of Geography and Limnology, Chinese Academy of Sciences, Nanjing 210008, China
2
College of Resources and Environment, University of Chinese Academy of Sciences, Beijing 100049, China
3
Poyang Lake Research Center, Jiangxi Academy of Sciences, Nanchang 330096, China
*
Author to whom correspondence should be addressed.
Water 2019, 11(8), 1705; https://doi.org/10.3390/w11081705
Submission received: 27 June 2019
/
Revised: 3 August 2019
/
Accepted: 13 August 2019
/
Published: 16 August 2019
(This article belongs to the Special Issue Wetland Ecohydrology and Water Resource Management)
Abstract
:Poyang Lake Basin (PYLB) is located in Southeastern China where the precipitation is closely related to the East Asian Monsoon. Based on the monthly precipitation data of 18 meteorological stations from 1959 to 2018 in the PYLB, Empirical Orthogonal Function (EOF), Wavelet Analysis, and Pearson Correlation Analysis were used to investigate the spatiotemporal variations of summer precipitation and their correlations with the East Asian Summer Monsoon (EASM). The results demonstrate that there were two leading modes of summer precipitation at inter-annual time scales: the mode being consistent over the whole area and the mode of opposite relationship between the south/north PYLB. Both modes had obvious trend variations and periodic characteristics. The East Asian Summer Monsoon Index (EASMI) showed a decreasing trend of fluctuation, existing in periods of 2–3 years and 11 years. Cross Wavelet Transform revealed that the time coefficients of the second EOF mode and EASMI had an anti-phase resonance period of 2–3 years. Pearson Correlation Analysis also indicated that there was a significant negative correlation relationship between them. These results not only contribute to an understanding of characteristics of summer precipitation in the PYLB and the influences of the East Asian Summer Monsoon on them but also provide a reference for a regional response to climate change and precipitation prediction.
1. Introduction
The Intergovernmental Panel on Climate Change (IPCC) Fifth Assessment Report showed that climate change is already an undisputed fact [1]. Climate change has had increasingly dramatic impacts on regional water resources [2,3,4,5]. Precipitation is the primary source of regional water resources and the spatiotemporal change of precipitation has attracted increasing attention worldwide [6,7]. Due to the anomaly of the East Asian Monsoon, extreme climate events in the south of China have occurred very frequently, which seriously threatens regional economic development [8]. A number of studies have confirmed that the East Asian Summer Monsoon had significant inter-annual and inter-decadal variation [9,10,11,12]. With the inter-annual fluctuation of the East Asian Monsoon, the annual precipitation varies greatly in some regions. Therefore, it is of great scientific significance to explore the spatiotemporal laws of regional precipitation and their relationships with changes of the East Asian Monsoon in order to objectively understand the regional characteristics of climate change in the background of global change and the future management of water resources.
A number of studies were conducted on the spatiotemporal distribution and circulation characteristics of precipitation in different regions and seasons in China. Zhai et al. (2005) found that there were obvious regional and seasonal patterns in total precipitation extremes in China [13]. Xu et al. showed that precipitation increased in most regions of the Tibetan Plateau in recent decades [14]. Liu et al. illustrated that the precipitation in the Yellow River Basin had the characteristic of longitude zonal distribution but had no distinctive relationship with the latitude [15]. Pei et al. believed that several factors such as large-scale circulation, hydrologic engineering and local topography resulted in variations in extreme daily precipitation of the Middle and Lower Reaches of the Yangtze River [16]. Su et al. articulated that there were six extreme modes over the Yangtze River Basin [17]. Wang and Fan [18] analyzed the correlation between 25 monsoon indices and different modes where the summer precipitation in Eastern China was decomposed. Xiao et al. [19] used the REOF method to partition the Yangtze river Basin and studied the relationship between El Niño-Southern Oscillation (ENSO), North Atlantic Oscillation (NAO), Indian Ocean Dipole (IOD), Pacific Decadal Oscillation (PDO) and the seasonal precipitation in different regions, concluding that the winter precipitation in the southeast of the basin had an apparent significant relationship with ENSO in the same period. These studies focused on the precipitation vibration in large regions, but it is not clear how precipitation of regions at local scale are influenced by climate factors.
Located in the middle-lower Yangtze River Basin, the Poyang Lake Basin (PYLB) belongs to a typical humid subtropical monsoon climate region. The spatiotemporal distribution of precipitation in the PYLB is extremely uneven, with obvious seasonal and regional differences resulting in frequent floods and droughts [20]. The characteristics and causes of precipitation in the PYLB have been analyzed in different respects. For example, Li and Hu [21] found that extreme precipitation in the PYLB had been intensifying in the past 50 years, and the contribution rate of extreme precipitation reached 40–60%. Zhang et al. [22] investigated the relationship between rainy season precipitation in the PYLB and Nino-3.4, sea surface temperature (SST), and then explored the possible mechanism of water vapor flux in wet and dry seasons. Shao et al. [23] and Zhang et al. [24] discussed systematically the relationship between precipitation in the PYLB and climate indices such as ENSO, NAO, IOD and PDO. Most of the previous studies have focused on the extreme precipitation and the trend of precipitation variation in the PYLB and its connections with various influencing factors. However, a limited number of studies on spatiotemporal characteristics of summer precipitation in the PYLB and related physical mechanisms have been conducted. Moreover, rarely have studies examined the correlation between the East Asian Summer Monsoon and precipitation in the PYLB.
Overall, our main aims of this study are as follows: (1) examine the spatial distribution types of summer precipitation in the PYLB during 1959–2018; (2) explore the temporal evolution of the different types of summer precipitation, i.e., trends and periodic features; and (3) discuss the mechanisms behind the correlation between summer precipitation in the PYLB and the East Asian Summer Monson. To achieve the above objectives, spatiotemporal variations of summer precipitation and their correlations with the East Asian Summer Monsoon in the Poyang Lake Basin were analyzed. The results of this study provide a scientific basis for rational utilization of regional water resources, conservation of water and soil, and reduction of flood control and disaster.
2. Materials and Methods
2.1. Overview of Study Area
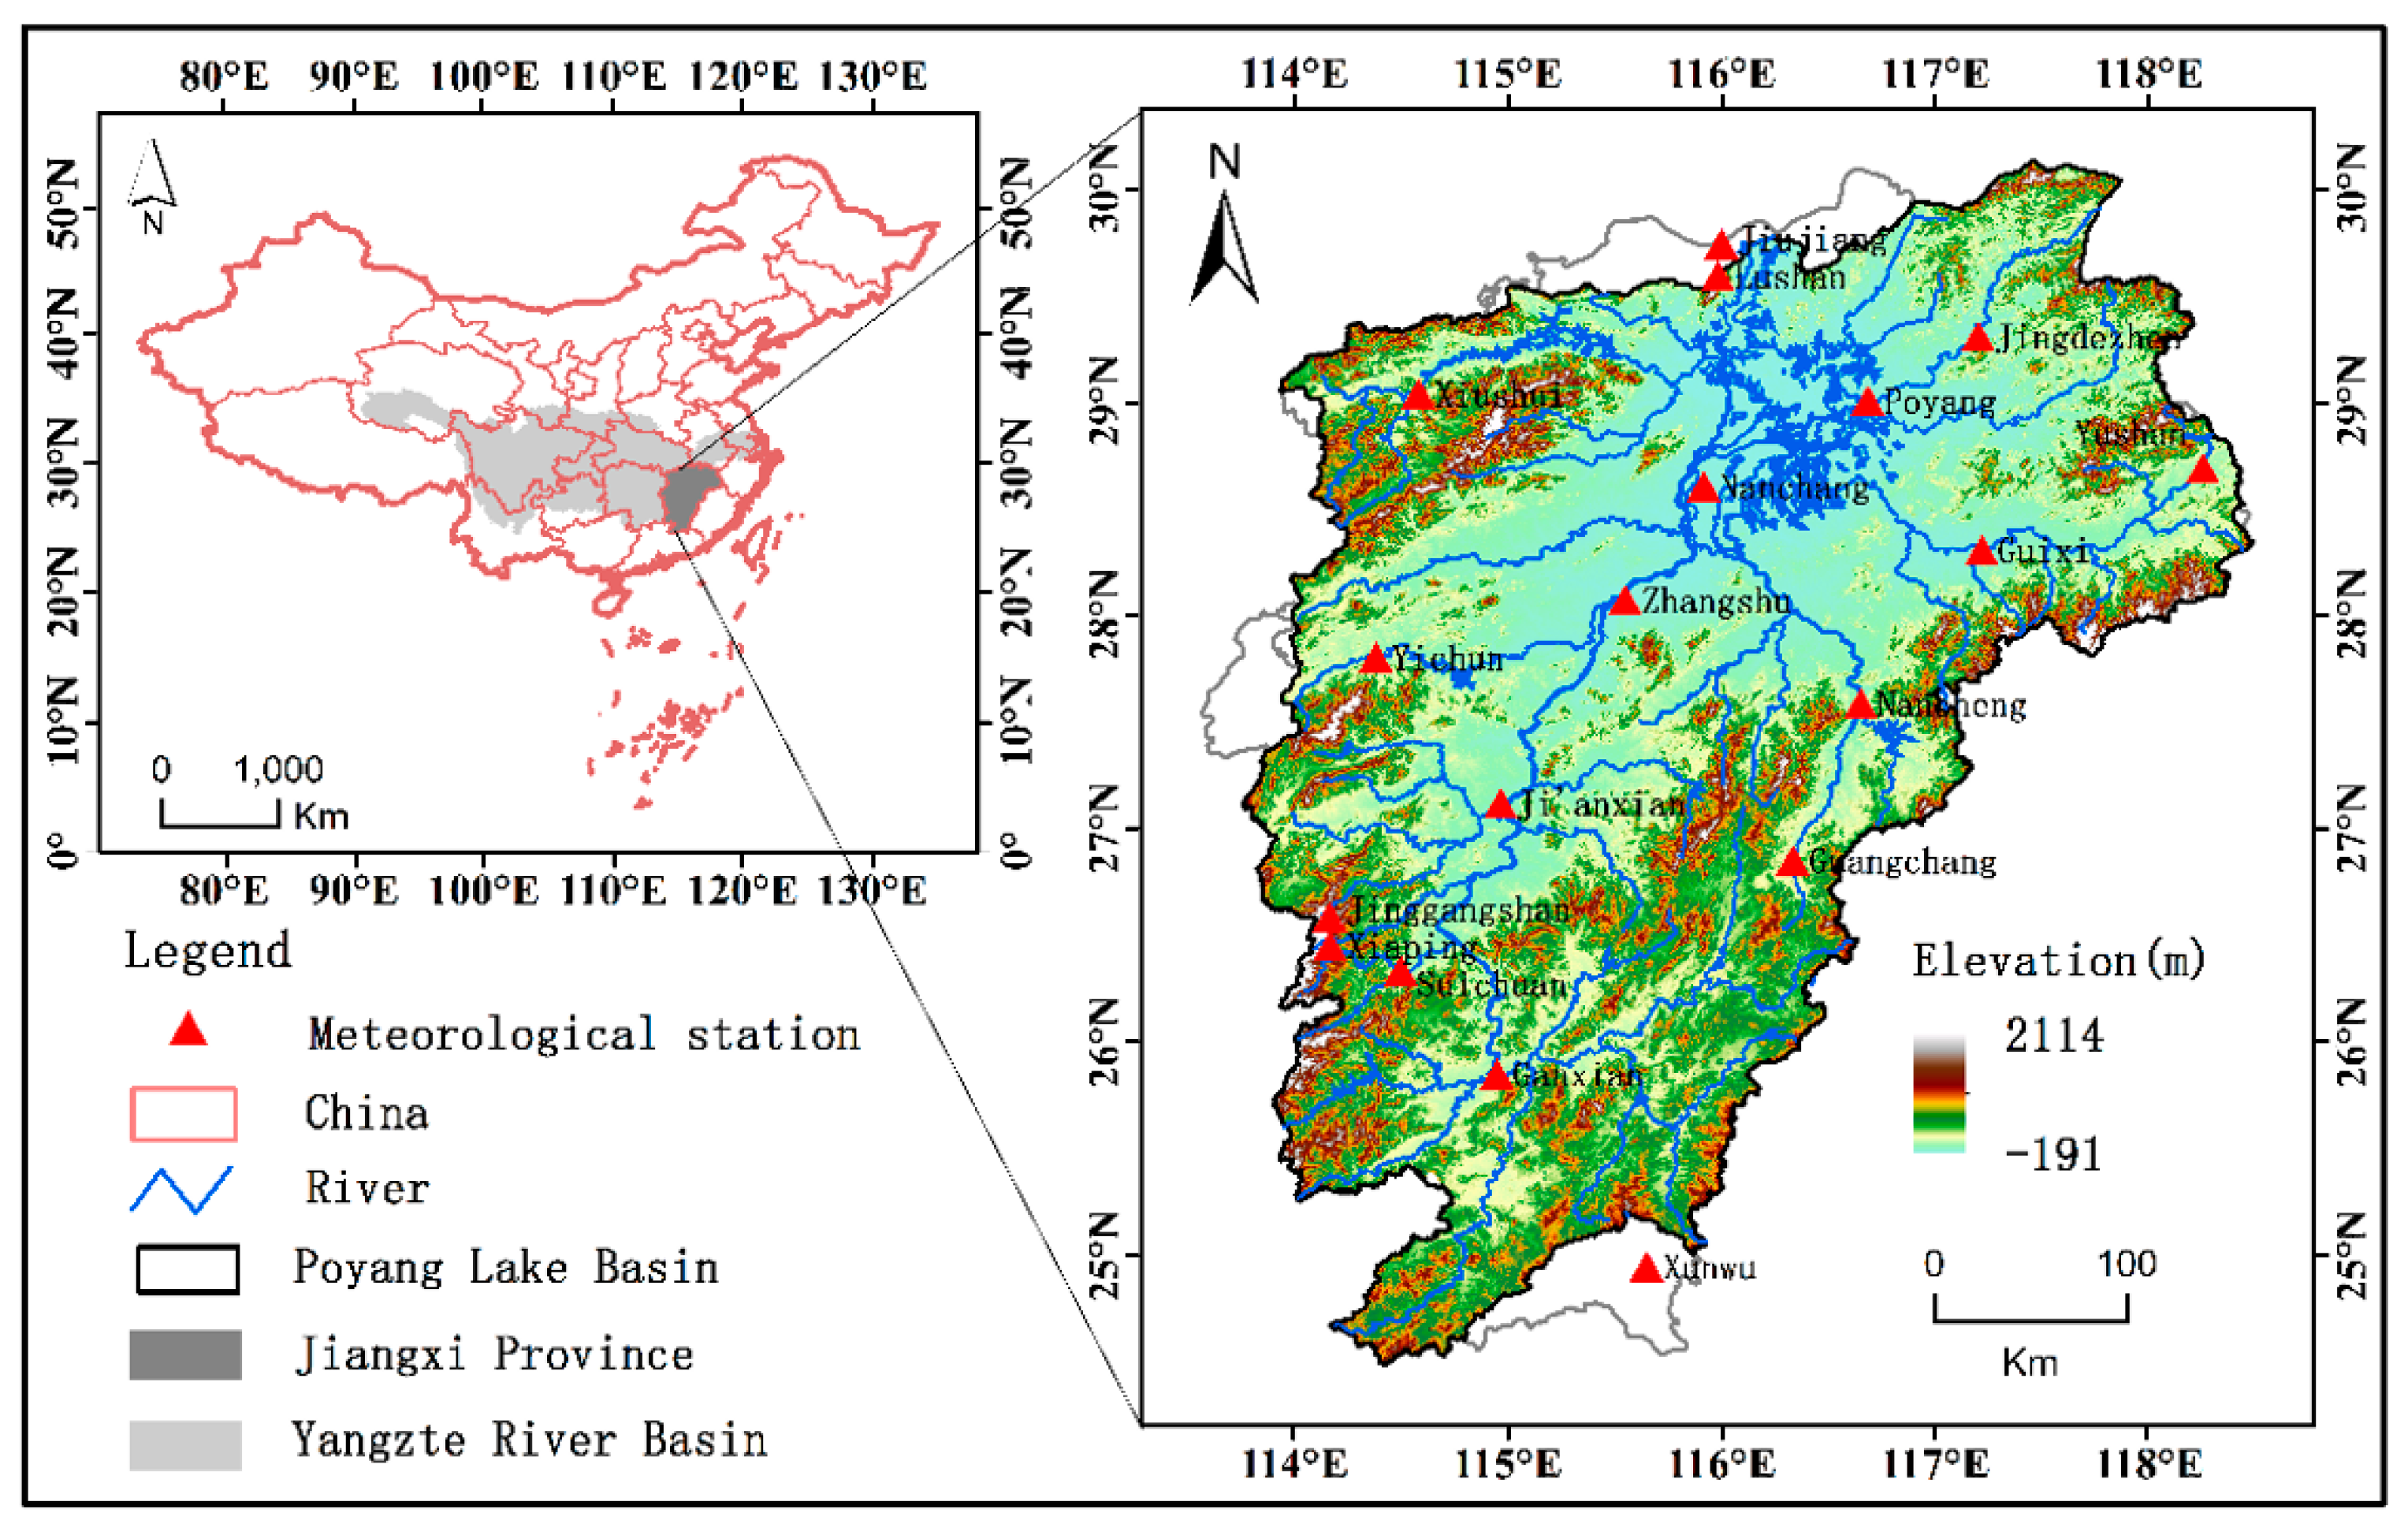
Situated on the south bank of the middle-lower reaches of the Yangtze River, the Poyang Lake Basin (24°24′–29°46′ N, 113°23′–118°46′ E) (Figure 1) is composed of five sub-catchments in its basin (i.e., the Ganjiang River Basin, the Fuhe River Basin, the Xinjiang River Basin, the Raohe River Basin, and the Xiushui River Basin) and the Poyang Lake [8,23,25]. The PYLB covers a drainage area of 162,200 km2, accounting for 9% of the total area of the Yangtze River basin and approximately 97% of the area of the Jiangxi province [26]. The topographical features of the PYLB are complex and diverse, varying from highly mountainous regions (2200 m above sea level) in the south of the PYLB to alluvial plains (30 m above sea level) around the lake [27,28]. The spatiotemporal distribution of precipitation in the PYLB is uneven with obvious seasonal and regional features. The PYLB has four distinct seasons with an average annual temperature of 17.5 °C and an average annual precipitation of 1680 mm [29,30,31]. The locations of the meteorological stations are shown in Figure 1. The sites are distributed in various terrains, so precipitation in these stations can represent that of the whole basin.
2.2. Data Source
The precipitation data used in this paper were derived from the gauged monthly precipitation dataset of 18 national meteorological stations around the PYLB from 1959 to 2018 which were obtained from the National Meteorological Information Center of China Meteorological Administration (http://data.cma.cn/). The summer precipitation in this paper was taken as the sum of the precipitation of June, July and August. The East Asian Monsoon dataset from June to August in 1959–2017 were taken from the website (http://ljp.gcess.cn/dct/page/65577). In this paper, normalized indices belonging to the above dataset from June, July and August of 1959 to 2017 were selected as the East Asian Summer Monsoon Index series to maintain the consistency of the period of the summer precipitation. The Niño 3.4 and NAO indices were derived from the Climate Prediction Center of NOAA (http://www.cpc.ncep.noaa.gov). The IOD index was obtained from JAMSTEC (http://www.jamstec.go.jp/frsgc/research/d1/iod/e/index.html). The PDO index used here was taken from ESRL of NOAA (http://www.esrl.noaa.gov/psd/data/correlation/pdo.data). There was no missing data or any weird value in the above data.
2.3. Methods
The Empirical Orthogonal Function method (EOF) was conducted by Compaq Visual FORTRAN 6.6 to explore the spatiotemporal characteristics of summer precipitation in the PYLB. Surfer15 was adopted to perform Kriging interpolation of space eigenvectors from the result of EOF, and the contour map was drawn. Matlab2016b was used to analyze the power spectrum estimations of EASMI. SPSS25.0 was taken to study the correlation between summer precipitation and the EASMI. Wavelet Analysis was employed by Matlab2016b to investigate the periodic characteristics of summer precipitation and EASMI. Pearson Correlation Analysis was used to analyze the correlation between EASMI and summer precipitation in the Poyang Lake Basin.
2.3.1. Climate Indices
From different perspectives, many scholars have defined the corresponding monsoon index to describe quantitatively the outbreak, advance and retreat, and intensity of the East Asian Monsoon [32,33,34,35,36,37,38,39]. Li and Zeng (2002, 2003) defined the East Asian Summer Monsoon Index (EASMI) as an area-averaged seasonally (i.e., June, July, August) dynamical normalized seasonality (DNS) at 850 hpa within the East Asian monsoon domain (10°–40° N, 110°–140° E). Based on intensity of the normalized seasonality of wind field, the DNS index [40,41] is given by
where and are the January climatological wind vector and the mean of January and July climatological wind vectors at 850 hpa, respectively, and is the monthly wind vector at 850 hpa for year n, and month m.
The Niño 3.4 index is the average sea surface temperature (SST) anomaly in the Niño 3.4 region (5° N–5° S, 120–170° W), which indicates the El Niño-Southern Oscillation (ENSO). The NAO index is defined as the difference of sea-level atmospheric pressure between 2 stations situated near Iceland and the Azores, indicating the intensity of westerlies in the North Atlantic mid-latitudes. The IOD index is measured by an index (sometimes referred to as the Dipole Mode Index, or DMI) difference between the western equatorial Indian Ocean (50°–70° E, 10°S–10° N) and the south eastern equatorial Indian Ocean (90°–110° E, 10° S–0° N). The PDO index is defined as the projections of monthly mean SST anomalies in the North Pacific Ocean (north of 20° N).
2.3.2. EOF Method
The meteorological variable field can be decomposed as a series of orthogonal functions by the EOF method. A number of orthogonal typical modes decomposed by EOF can reflect most of the information of the original variable field. The eigenvectors of different modes can reflect the spatial distribution structure of meteorological elements, and the values of the eigenvector can reflect the change degree of the elements. The time coefficients can represent the temporal variations corresponding to spatial modes.
The EOF method [42,43] can be described as follows:
where m is the number of observation stations and n is the length of observation data. The matrix X is decomposed into the product of many mutually orthogonal functions (i.e., space functions and the time coefficients).
where can be seen as a linear combination of several spatial functions and time coefficients. The eigenvectors from the EOF analysis are tested for significance using the North criterion. The error range of eigenvalues λ can be expressed by the following formula:
where n represents the sample size. When the adjacent eigenvalues meet the inequality below, the corresponding Empirical Orthogonal Function is deemed to be valid.
2.3.3. Wavelet Analysis
Continuous Wavelet Transform (CWT) is a signal analysis tool that introduces a window function based on the Fourier transform, which can extract periodic information hidden in time series in the time-frequency domain. The transformation formula [44] is
where represents the displacement factor varying from 0 to n, and a is scale factor reflecting the length of the wavelet period. The value of 1/a represents the frequency and represents the mother wavelet function. The Morlet wavelet is taken as the mother wavelet function in this paper.
Cross Wavelet Transform (XWT) is a signal analysis technique combining wavelet analysis and cross spectrum analysis to analyze the multi-scale relationship between two time series in the time-frequency domain. The correlation of two time series in different frequency domains is determined by the power spectral density of the cross wavelet. For two time series X and Y [45],
where is the complex conjugation of and represents the time lag. The cross wavelet power spectrum is defined as , which indicates the degree of correlation between the two time series. The red noise standard spectrum was used to test the significance of the cross wavelet power spectrum. The test method is shown as follows:
The expected spectrum of time series X and Y are and respectively. Both of them are the red noise spectrum. k represents the Fourier frequency index. The distribution of the cross wavelet power spectrum can be expressed by the following equation:
where and are standard deviations of the series and respectively, represents the confidence associated with probability p, and v represents the degree of freedom.
3. Results
3.1. Spatial Distribution of Summer Precipitation
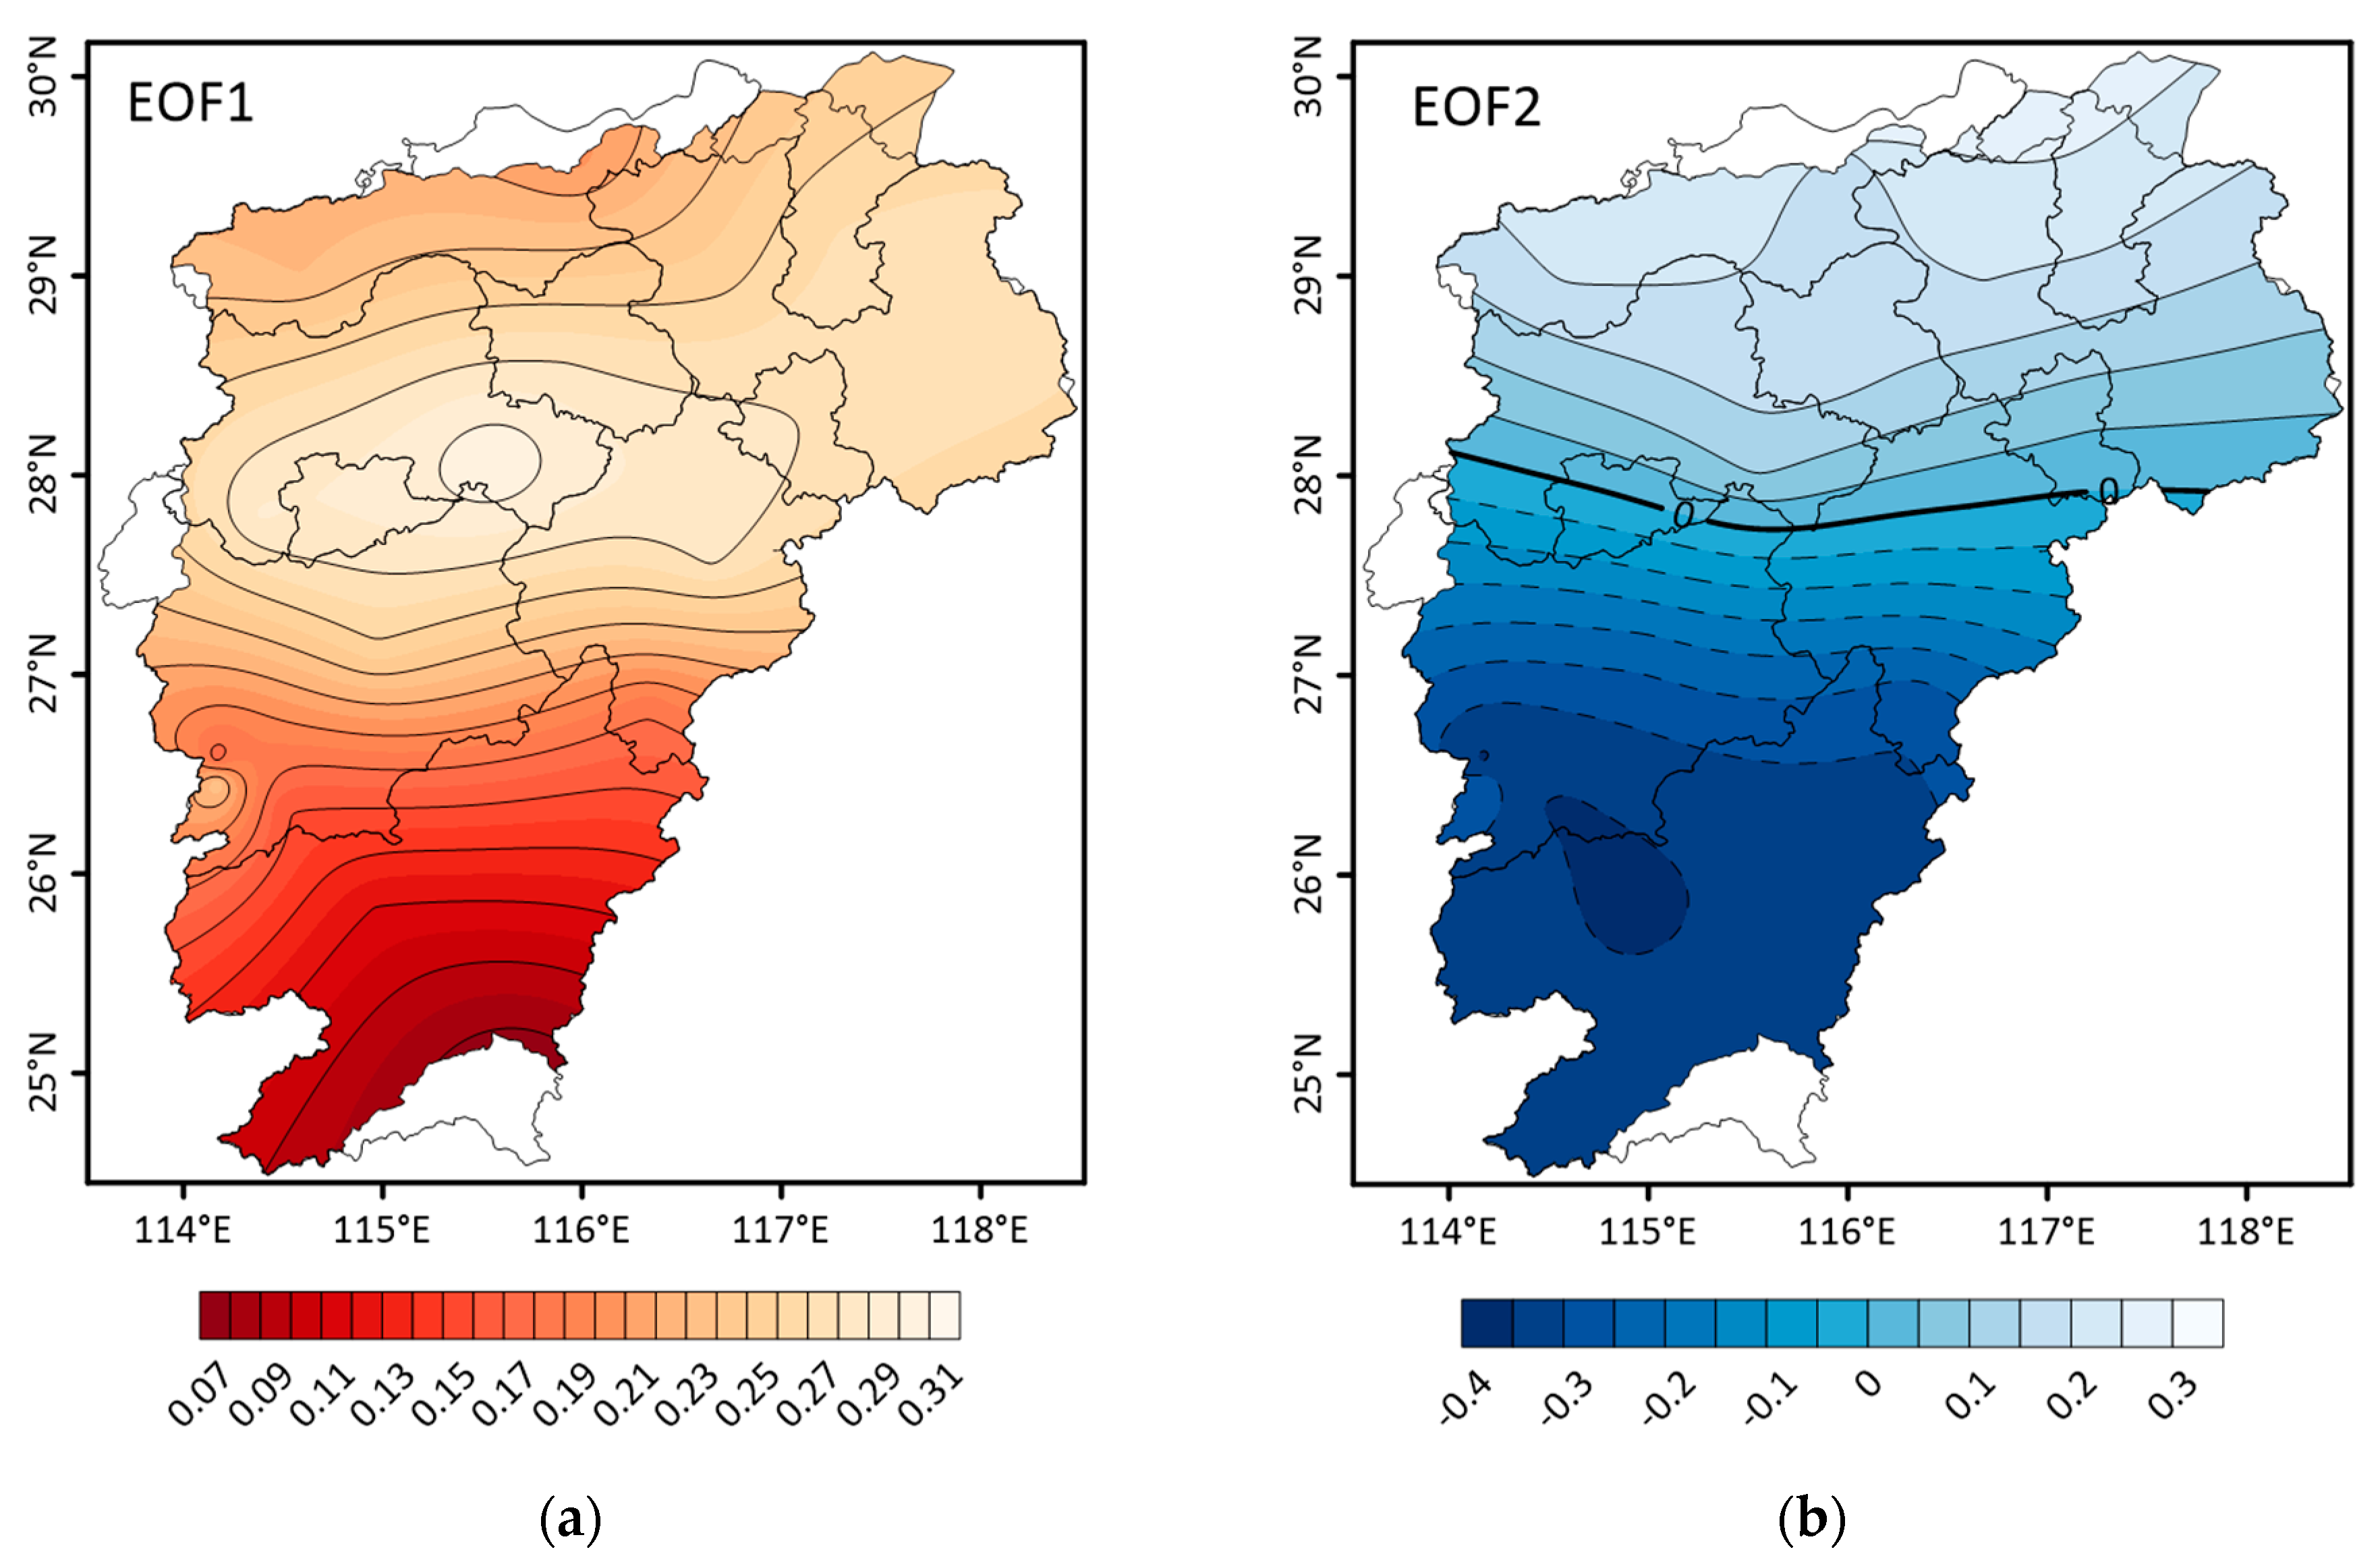
The Empirical Orthogonal Function method (EOF) was applied to analyze summer precipitation in the PYLB, and several spatial modes and their corresponding standardized time series were obtained. Table 1 shows the variance and cumulative variance contribution rates of the first 10 eigenvectors. As Table 1 shows, the variance contribution rates of the first two eigenvectors were 42.1% and 22.4% respectively, and the cumulative variance contribution rate reached 64.5%. The values of the variance contribution rates decreased rapidly after the third eigenvector. According to the result of the North Test, spatial modes corresponding to the first two eigenvectors could be effectively separated, reflecting spatiotemporal variation characteristics of summer precipitation in the PYLB.
Figure 2a shows the contour lines of the eigenvectors of the first mode. As Figure 2a shows, the values of the eigenvectors in the Poyang Lake Basin were positive, which demonstrates that summer precipitation over the whole area had a good spatial consistency. The high value center of the eigenvectors was located in Zhangshu city, indicating that the summer precipitation there was largely above or below the normal level. The values of the eigenvectors in the north and middle of the basin were symmetrically distributed along the 28° N, which showed that the summer precipitation of the two regions was consistent in some years. The values of the eigenvectors in the southern part of the basin were small, indicating that summer precipitation in this region was not largely above or below the normal level.
In the contour map (Figure 2b) of the eigenvectors of the second mode, the whole basin was divided into two parts of north and south by 28° N. The values of the eigenvectors of the north part were positive, and that of the south part were negative. There were little differences between the absolute values of the positive and negative eigenvectors. The high value center of the eigenvectors was located in the north and south of the PYLB. The results demonstrate that the northern and south-central PYLB had the spatial distribution characteristics of opposite phase in some years.
3.2. Temporal Variations of Summer Precipitation
3.2.1. Inter-Annual and Inter-Decadal Variations of Summer Precipitation
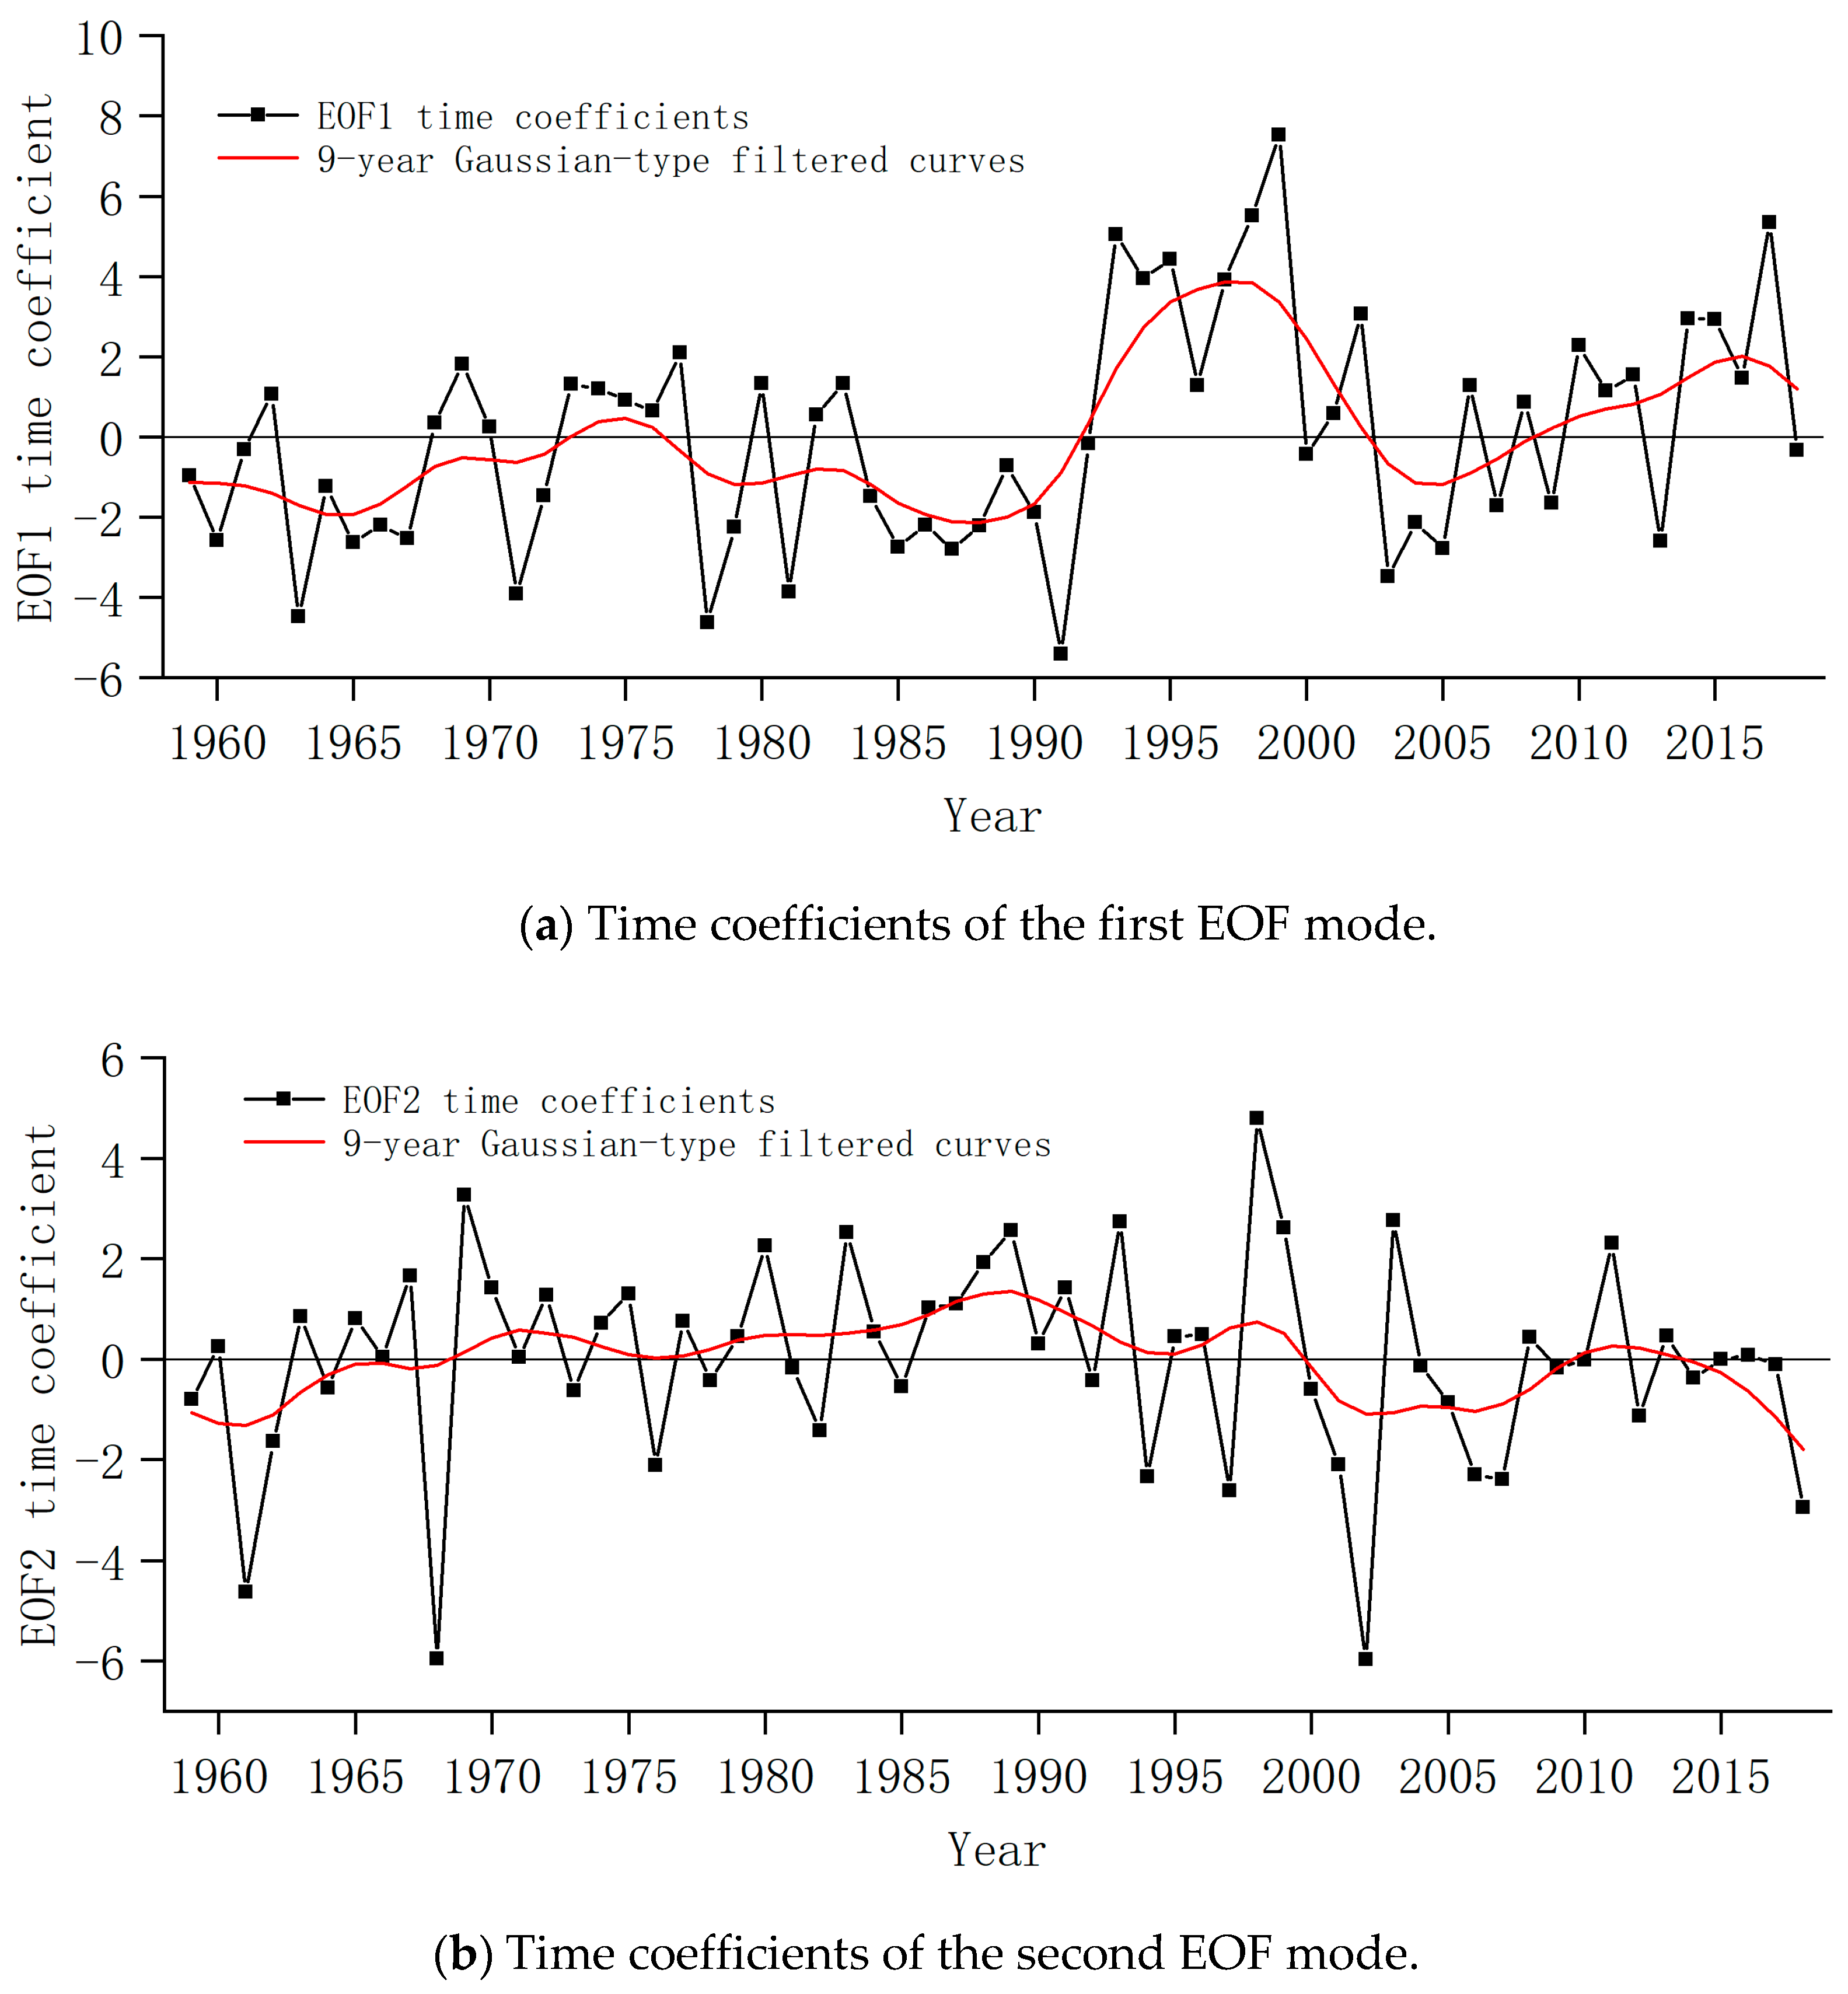
As can be seen from the time coefficients of the first mode (Figure 3a), the values of time coefficients in some years were high and positive (e.g., 1993, 1994, 1995, 1997, 1998, 1999 and 2017). This shows that there was an above normal precipitation during those years in the PYLB. The values of the time coefficients in other years were low and negative (e.g., 1963, 1971, 1978, 1981 and 1991), which indicates that there was a low level of precipitation during those years in the PYLB. As seen in the 9-year Gaussian-type filtered curve (Figure 3a), the basin received below normal precipitation from 1960s to mid-1990s. The summer precipitation had been increasing significantly since mid-1990s.
It can be seen from the time coefficients of the second mode (Figure 3b) that the values of the time coefficients in some years were high and positive (e.g., 1969, 1980, 1983, 1989, 1993, 1998, 1999, 2003 and 2011) in the north of the PYLB. This means that there was above normal precipitation in the north of the PYLB but below normal precipitation in the south of the PYLB in those years, and there was below normal precipitation in the north of the PYLB but above that in the south of the PYLB in other years (e.g., 1961, 1968, 1976, 1994, 1997, 2001, 2002, 2006, 2007 and 2018). Figure 3b shows the 9-year Gaussian-type filtered curve of the time coefficients of the second mode. Based on Figure 3b, the summer precipitation in the north of the PYLB from the 1980s to the 1990s was relatively higher than that in the south of the PYLB, and vice versa during the rest of the periods.
3.2.2. Period Characteristics of Summer Precipitation
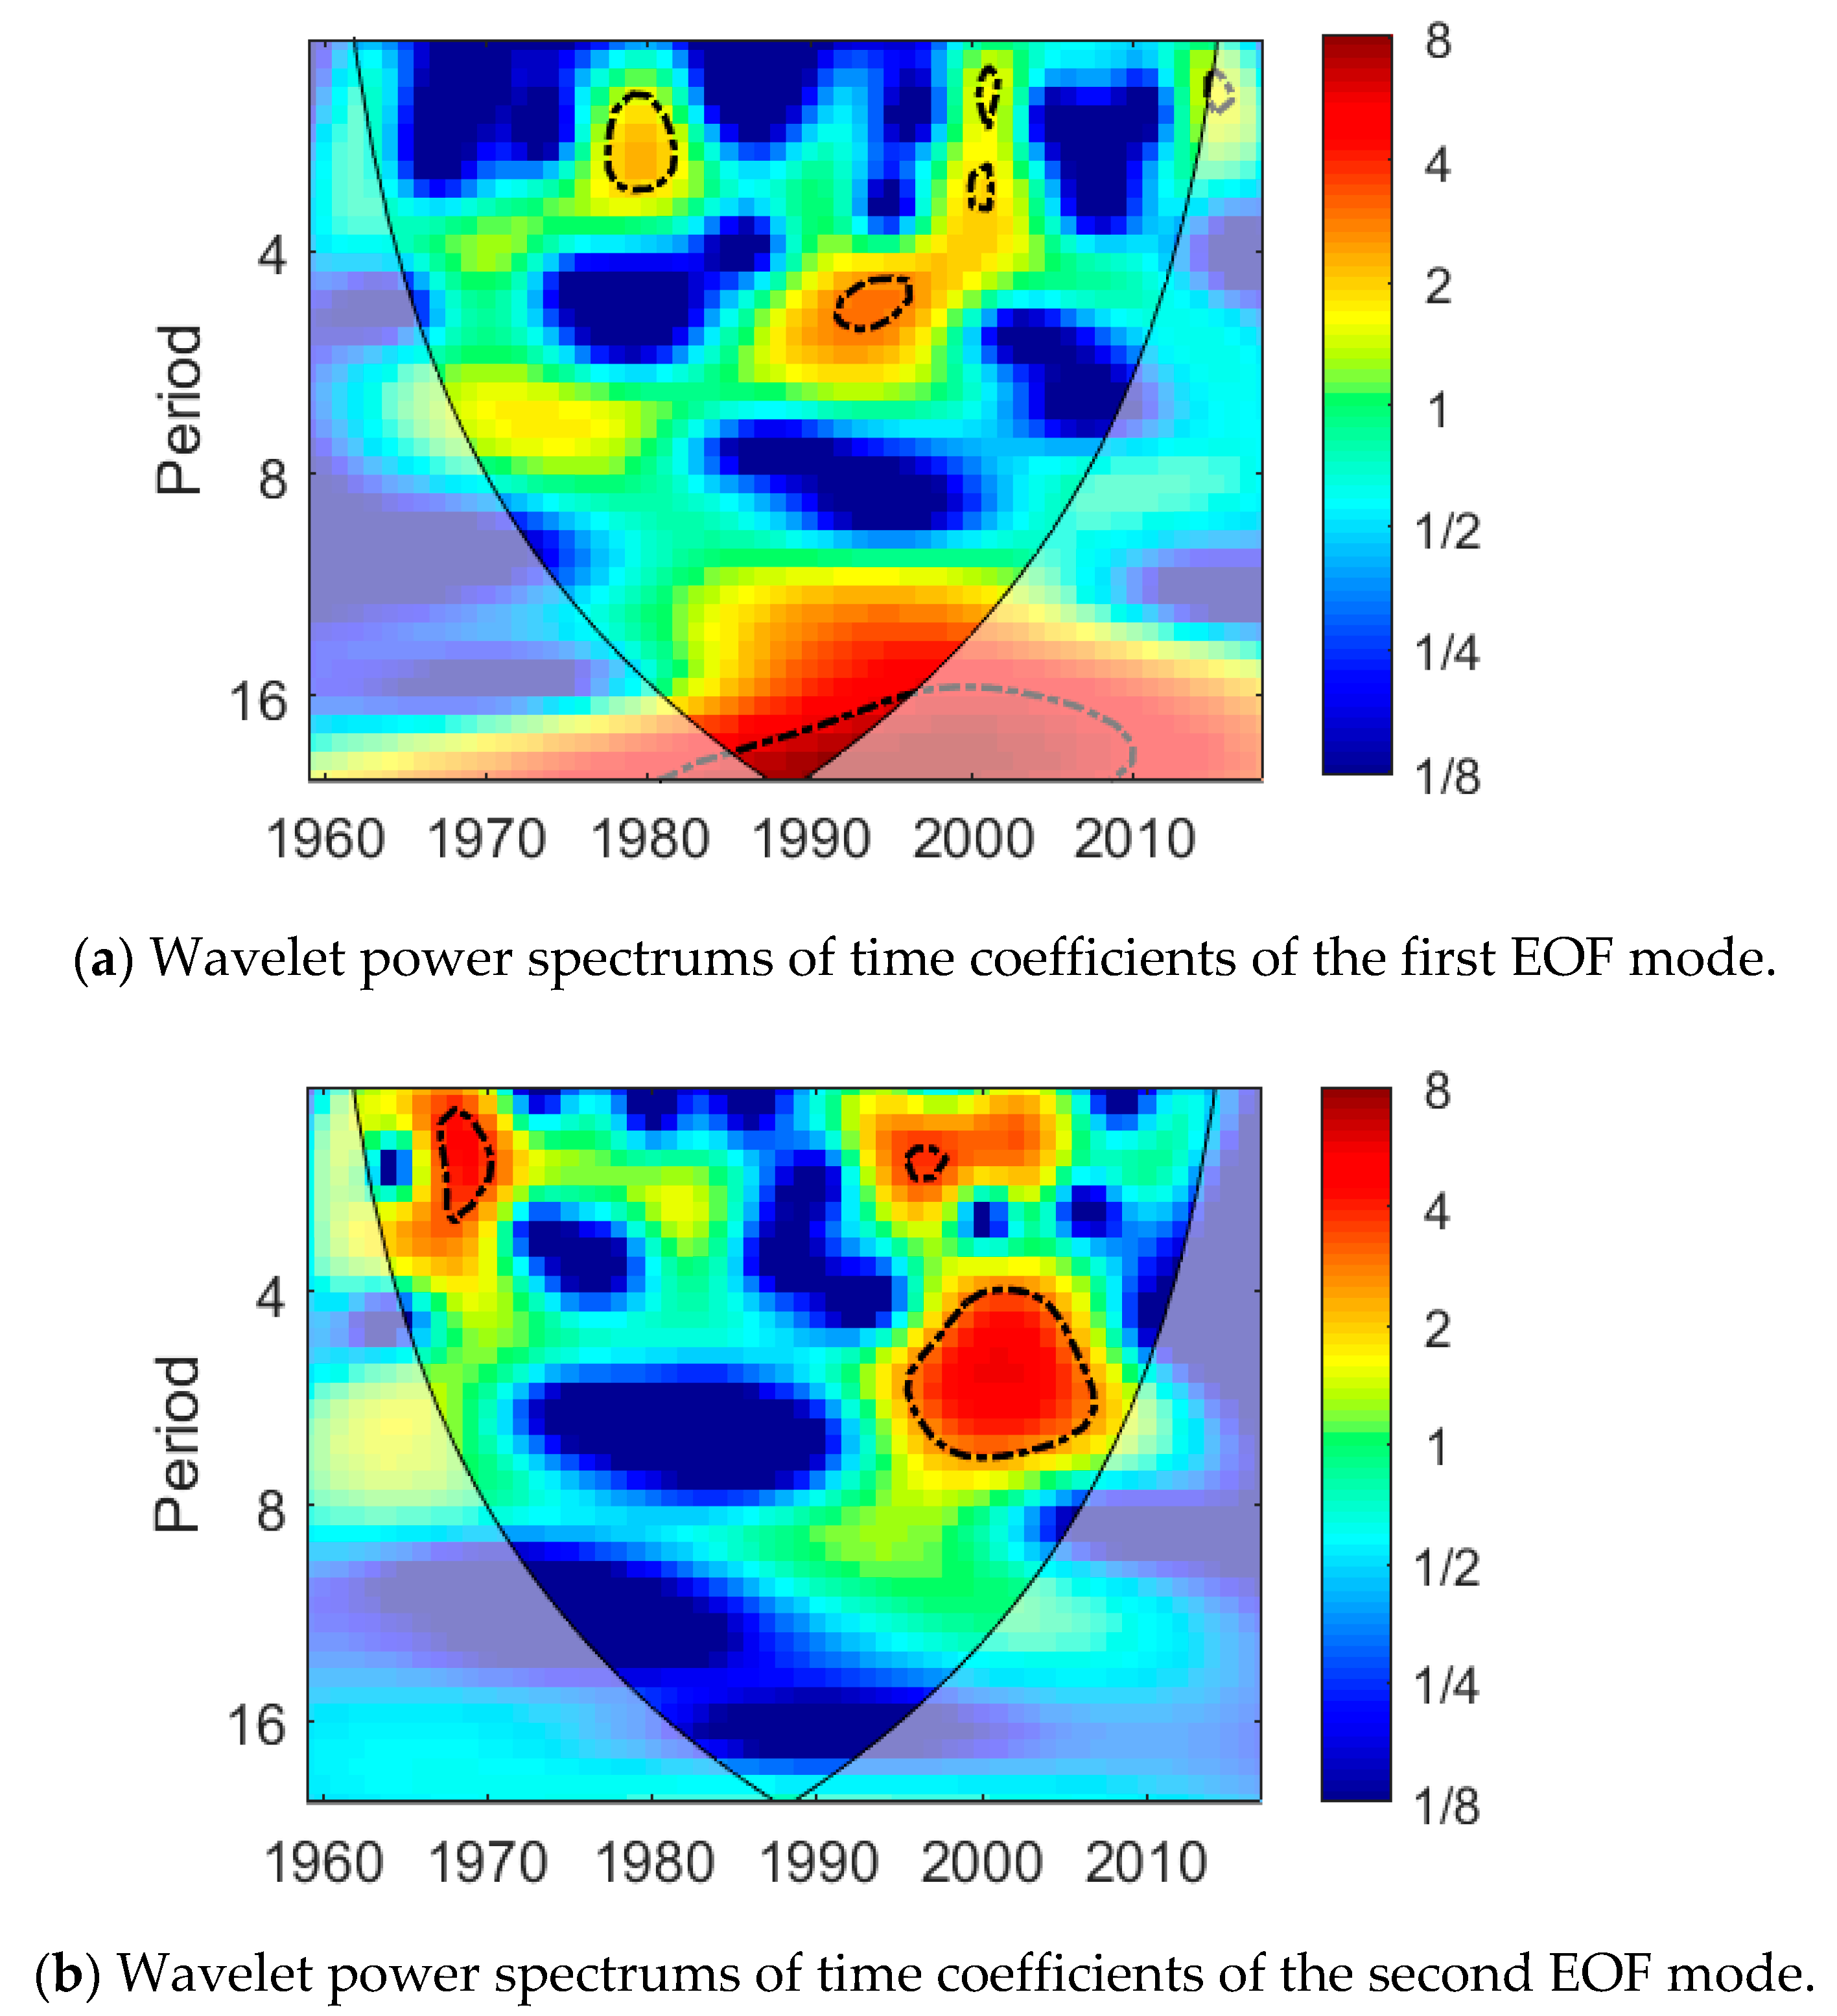
Wavelet power spectrums can reflect the energy intensity of the time series at different time scales. The significance of the period is determined by the energy intensity. Morlet wavelet analysis was performed on the time coefficients of the first two spatial modes of summer precipitation in the PYLB, and the corresponding wavelet power spectrums (Figure 4) were obtained.
Figure 4a shows the wavelet power spectrums of the first mode time coefficients of summer precipitation. It can be shown from Figure 4a that the energy of the time coefficients of the first mode in the basin was strong at the scale of 2–3 years and 5 years in the late 1970s and in the early 1990s respectively. Both of them passed the confidence test at the 0.05 level. At the inter-decadal scale, the periodic oscillation of about 16 years ran through the whole research period, which was significant in 1984–1996. In addition, the energy of the wavelet power spectrums in 1996–2010 was also strong. However, due to the influence of the boundary effect, the wavelet power spectrums were located outside the conic line.
The time coefficients of the second spatial mode of summer precipitation in the basin mainly included periodic oscillations around 2–3 years and 4–6 years (Figure 4b). The period at the scale of about 2–3 years was significantly located in 1965–1970 and 1995–1997. The period (4–6 years) was mainly located in 1996–2005.
3.3. The Connection between Summer Precipitation and East Asian Summer Monsoon
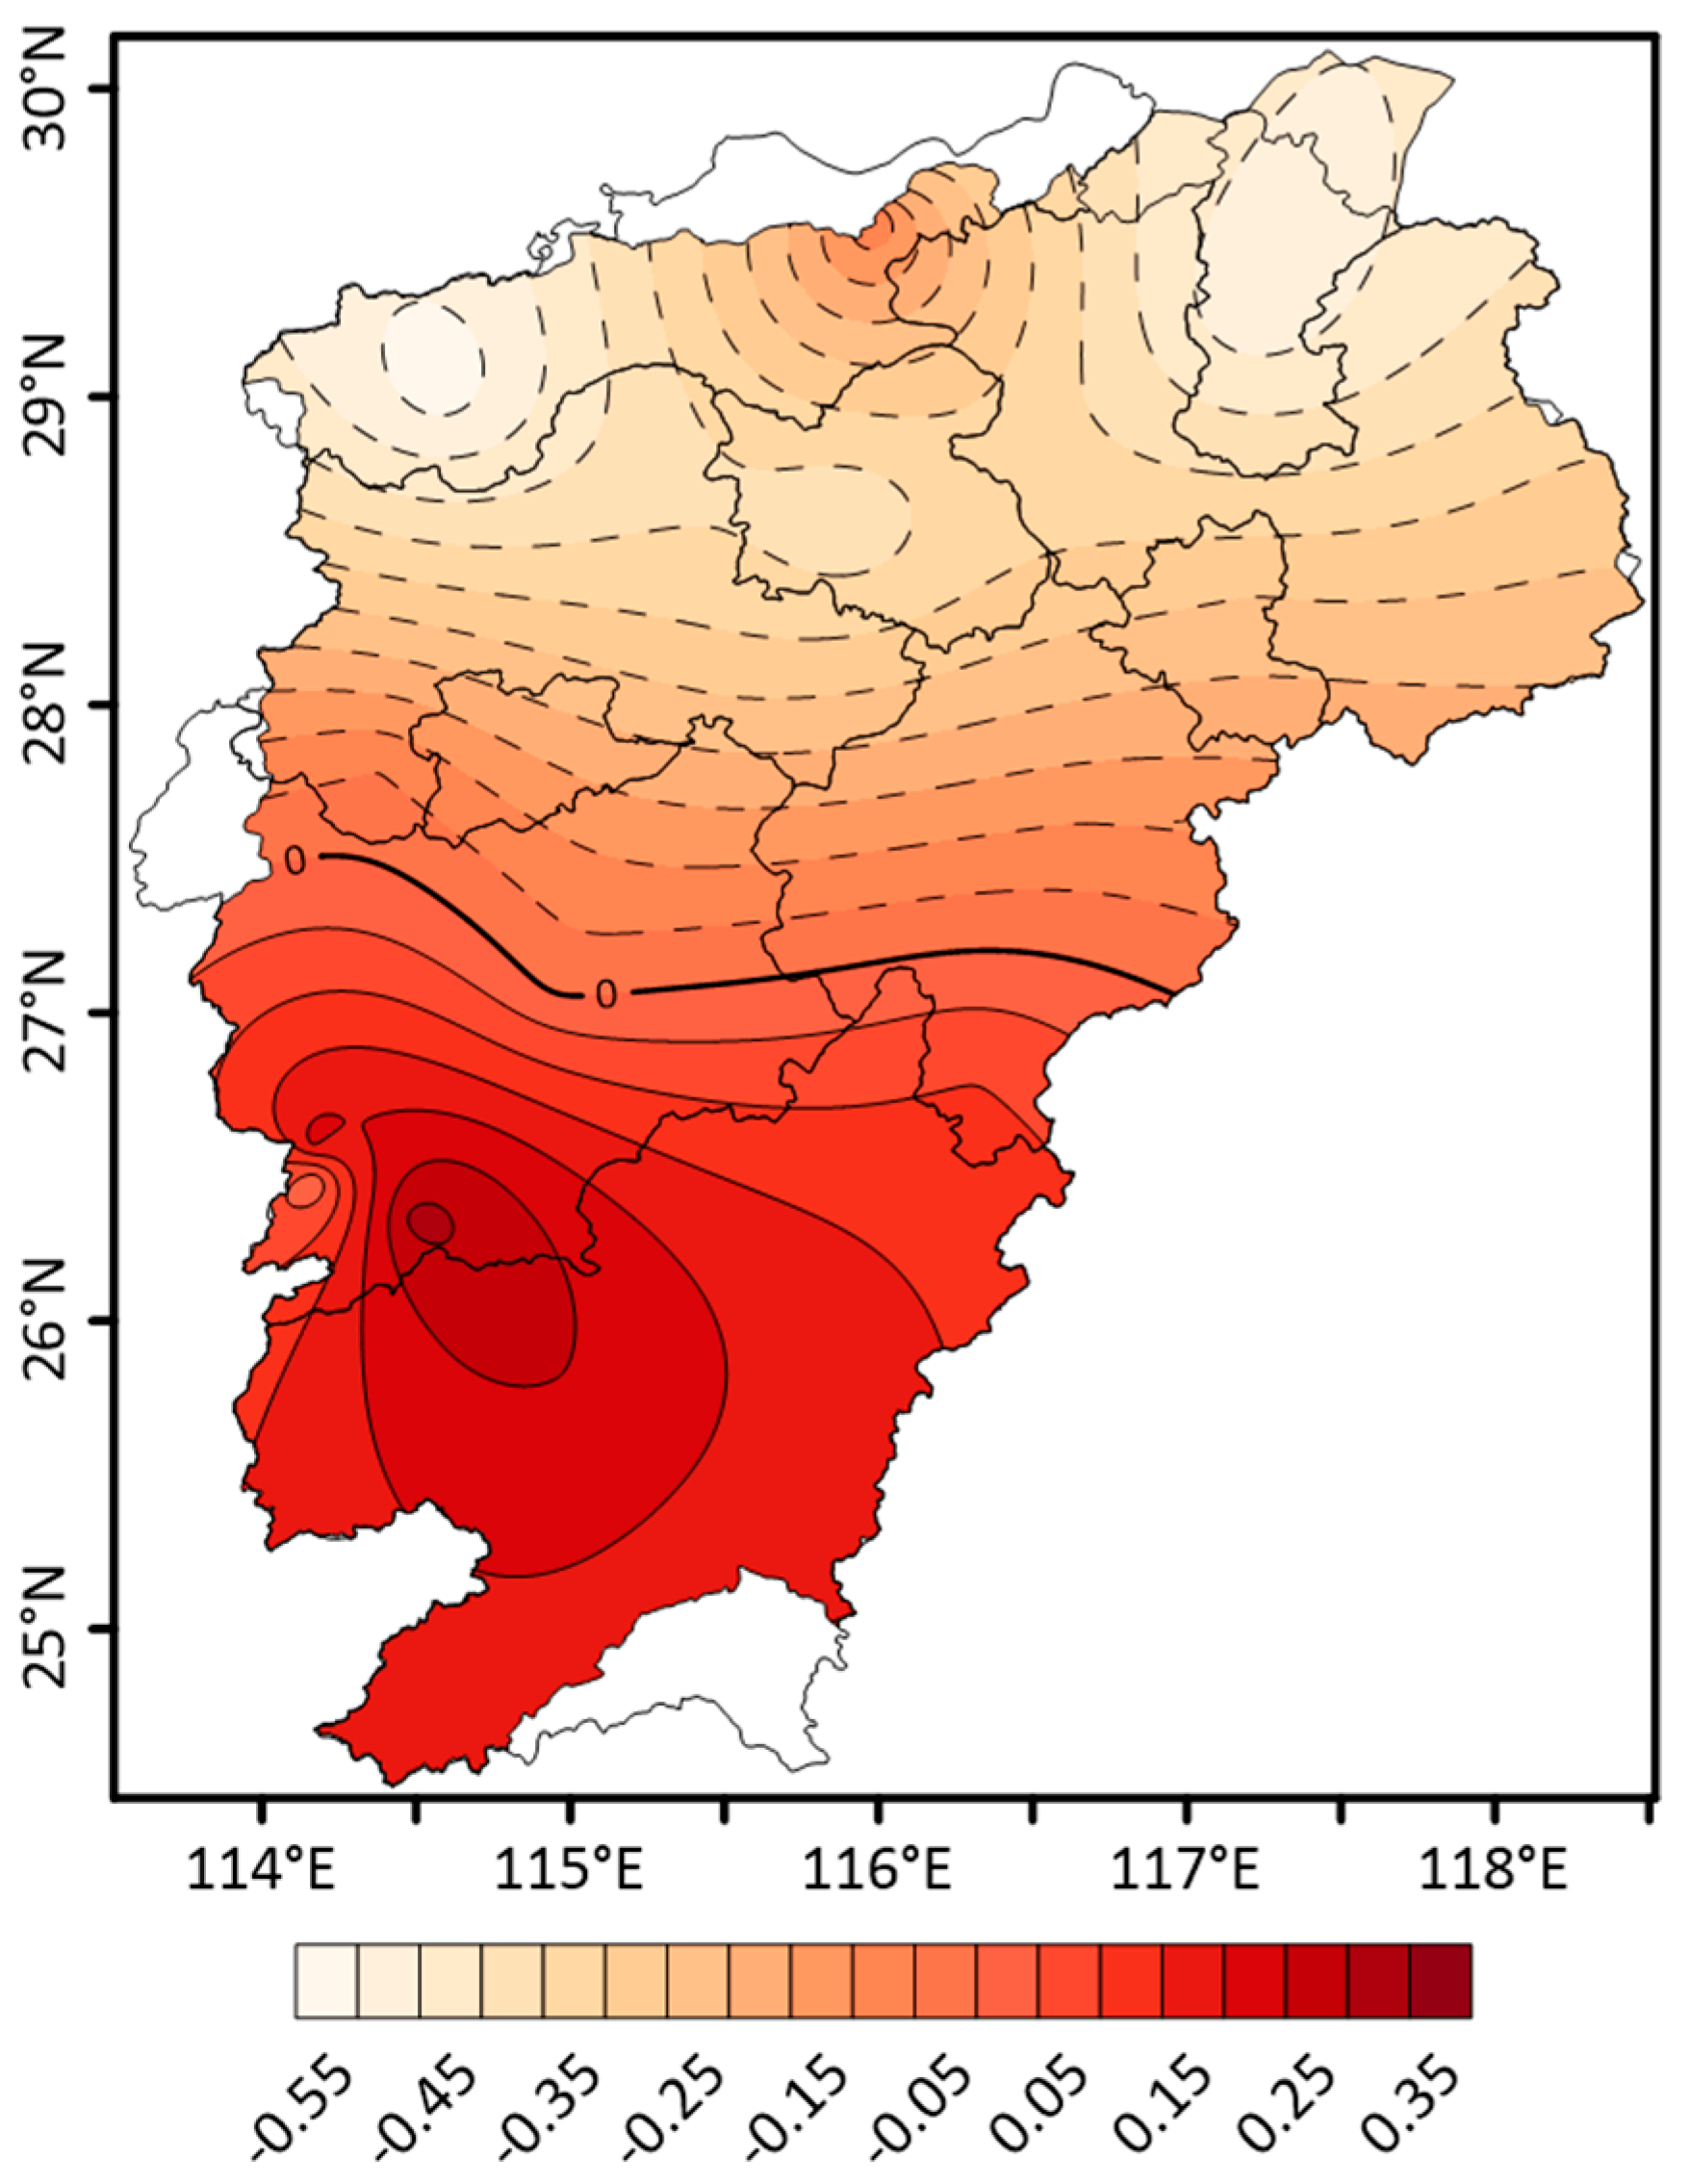
The correlation coefficients between EASMI and summer precipitation are listed in Table 2. As can be seen from Table 2, the maximum value of the correlation coefficients was located in the Jingdezhen station and the minimum value in the Xiaping station. There were 12 stations where summer precipitation was negatively correlated with EASMI. There were six stations where the correlation coefficients between EASMI and summer precipitation were positive.
Table 2 and Figure 5 show that sites where EASMI negatively correlated with summer precipitation were located in the northern PYLB, whereas sites in which EASMI positively correlated with summer precipitation were located in the southern PYLB. Comparing Table 2 with Figure 5, the load value distribution of correlation coefficients between EASMI and summer precipitation in the PYLB was just opposite that of EOF2. Therefore, this correlation distribution reflected the summer precipitation corresponding to EOF2, and there was a negative correlation relation between them. Therefore, the spatial distribution of the EOF2 in the PYLB was influenced by EASM. In addition, the correlation coefficients between EOF1 time series (T1), EOF2 time series (T2) and EASMI were calculated. The correlation coefficient between EASMI and T2 reached −0.438, which was significant at the 0.01 level. The correlation coefficient between EASMI and T1 was only −0.234. Therefore, there was an apparent negative correlation between the EASM and the summer precipitation of the opposite relationship between the south/north of PYLB. In addition, there was little correlation between EASM and summer precipitation corresponding to the mode being consistent over the whole area.
The cross wavelet spectrum of the time coefficients of the second spatial mode and EASMI are shown in Figure 6. As can be seen, within the range of the cone line (elimination of boundary effect), the common high energy region between sequences was mainly distributed at the time scale of 2–3 years, which implies that there existed a strong resonance period (2–3 years) between summer precipitation corresponding to the second mode and EASMI in 1976–1978, 1980–1982 and 1993–2003. According to the direction of arrows enclosed by the thick black line, the conclusion can be drawn that they had an apparent negative correlation in some years.
4. Discussion
As can be seen from the above analyses, the variance contribution rate of the first mode was the largest, and summer precipitation over the whole basin showed a good spatial consistency, which indicates that summer precipitation in the PYLB might be affected by the same large-scale weather system.
The correlation coefficients between the EOF1 time series (T1), the EOF2 time series (T2) and the average summer precipitation (ASMP) were calculated. The correlation coefficient between T1 and ASMP was as high as 0.99, passing the confidence test at the 0.01 level, while the correlation coefficient between T2 and ASMP was only −0.06. This demonstrates that the time coefficients of the first mode reflected the temporal variations of ASMP in the PYLB and the summer precipitation corresponding to EOF2 did not represent ASMP in the PYLB.
In order to find out which factors affect the consistent precipitation over the whole Poyang Lake Basin, correlation analyses were applied between T1, T2 and the main global climate indices such as Niño 3.4, PDO, IOD, NAO, respectively (Table 3). Herein, Niño 3.4, PDO, IOD, NAO represent the El Niño-Southern Oscillation (ENSO), the Pacific Decadal Oscillation, the Indian Ocean Dipole and the North Atlantic Oscillation, respectively. The correlation coefficients are listed in Table 3 between these indices and T1, T2. As Table 3 shows, the IOD at the same year was positively correlated with T1. The correlation coefficient was 0.248, which was quite evident although it did not reach the 0.05 significance level. This indicates that the leading mode of summer precipitation positively correlated with IOD during the same year. This is in agreement with the results of Xiao et al. that the positive (negative) IOD event on the same year tends to increase (decrease) the summer rainfall in the southeastern part of the Yangtze River basin [19]. Liu et al. also pointed out that summer precipitation would be more than normal in Southern China in the years of positive IOD occurring independently [46]. Yuan et al. demonstrated that in the summer following an IOD year, a weakened (an enhanced) 500-hPa Western Pacific Subtropical High with a eastward-retreating (an westward-advancing) high ridge would be induced by a negative (positive) IOD and that this would decrease (increase) precipitation in the upper and middle reaches of the Yangtze River Basin, China [47]. Therefore, these were considered as the physical mechanisms behind the variations of summer precipitation caused by IOD and were also the physical reason why the main mode was positive over the Poyang Lake Basin.
The summer precipitation of the opposite relationship between the south of the PYLB and the north of the PYLB was divided into two parts by 28° N. This result might be related to the location of the subtropical high ridge and the intensity of the East Asian Summer Monsoon. The Western Pacific Subtropical High moves from north to south seasonally, leading a lower precipitation in the area of the Yangtze River Basin. However, the area of the Yangtze River Basin uncontrolled by the Subtropical High receives more precipitation, coupling with the frequent activities of typhoons. Table 3 and Figure 5 also prove that summer precipitation corresponding to EOF2 was affected by EASM. Some studies also proved that the anomaly changes of Asian Monsoon, Subtropical High and other climatic factors had important impacts on the summer precipitation in the Yangtze River Basin [23,48]. Comparing Figure 5 and Figure 2b, it can be seen that there was a slight distance deviation between the dividing line of EOF2 and the distribution of the correlation coefficient. During the movement of EASM from south to north, due to topographic resistance to EASM, the actual distribution of the precipitation was influenced by topographic factors to some extent.
Because EASM did not have a significant influence on PC1, it did not modulate the most important precipitation component in the whole PYLB. On the contrary, EASM was modulating the PYLB precipitation in opposite ways in the northern/southern PYLB. Furthermore, this behavior was coherent with the EOF2 pattern. According to the location of the precipitation station, this fact was consistent with the correlations in Table 2.
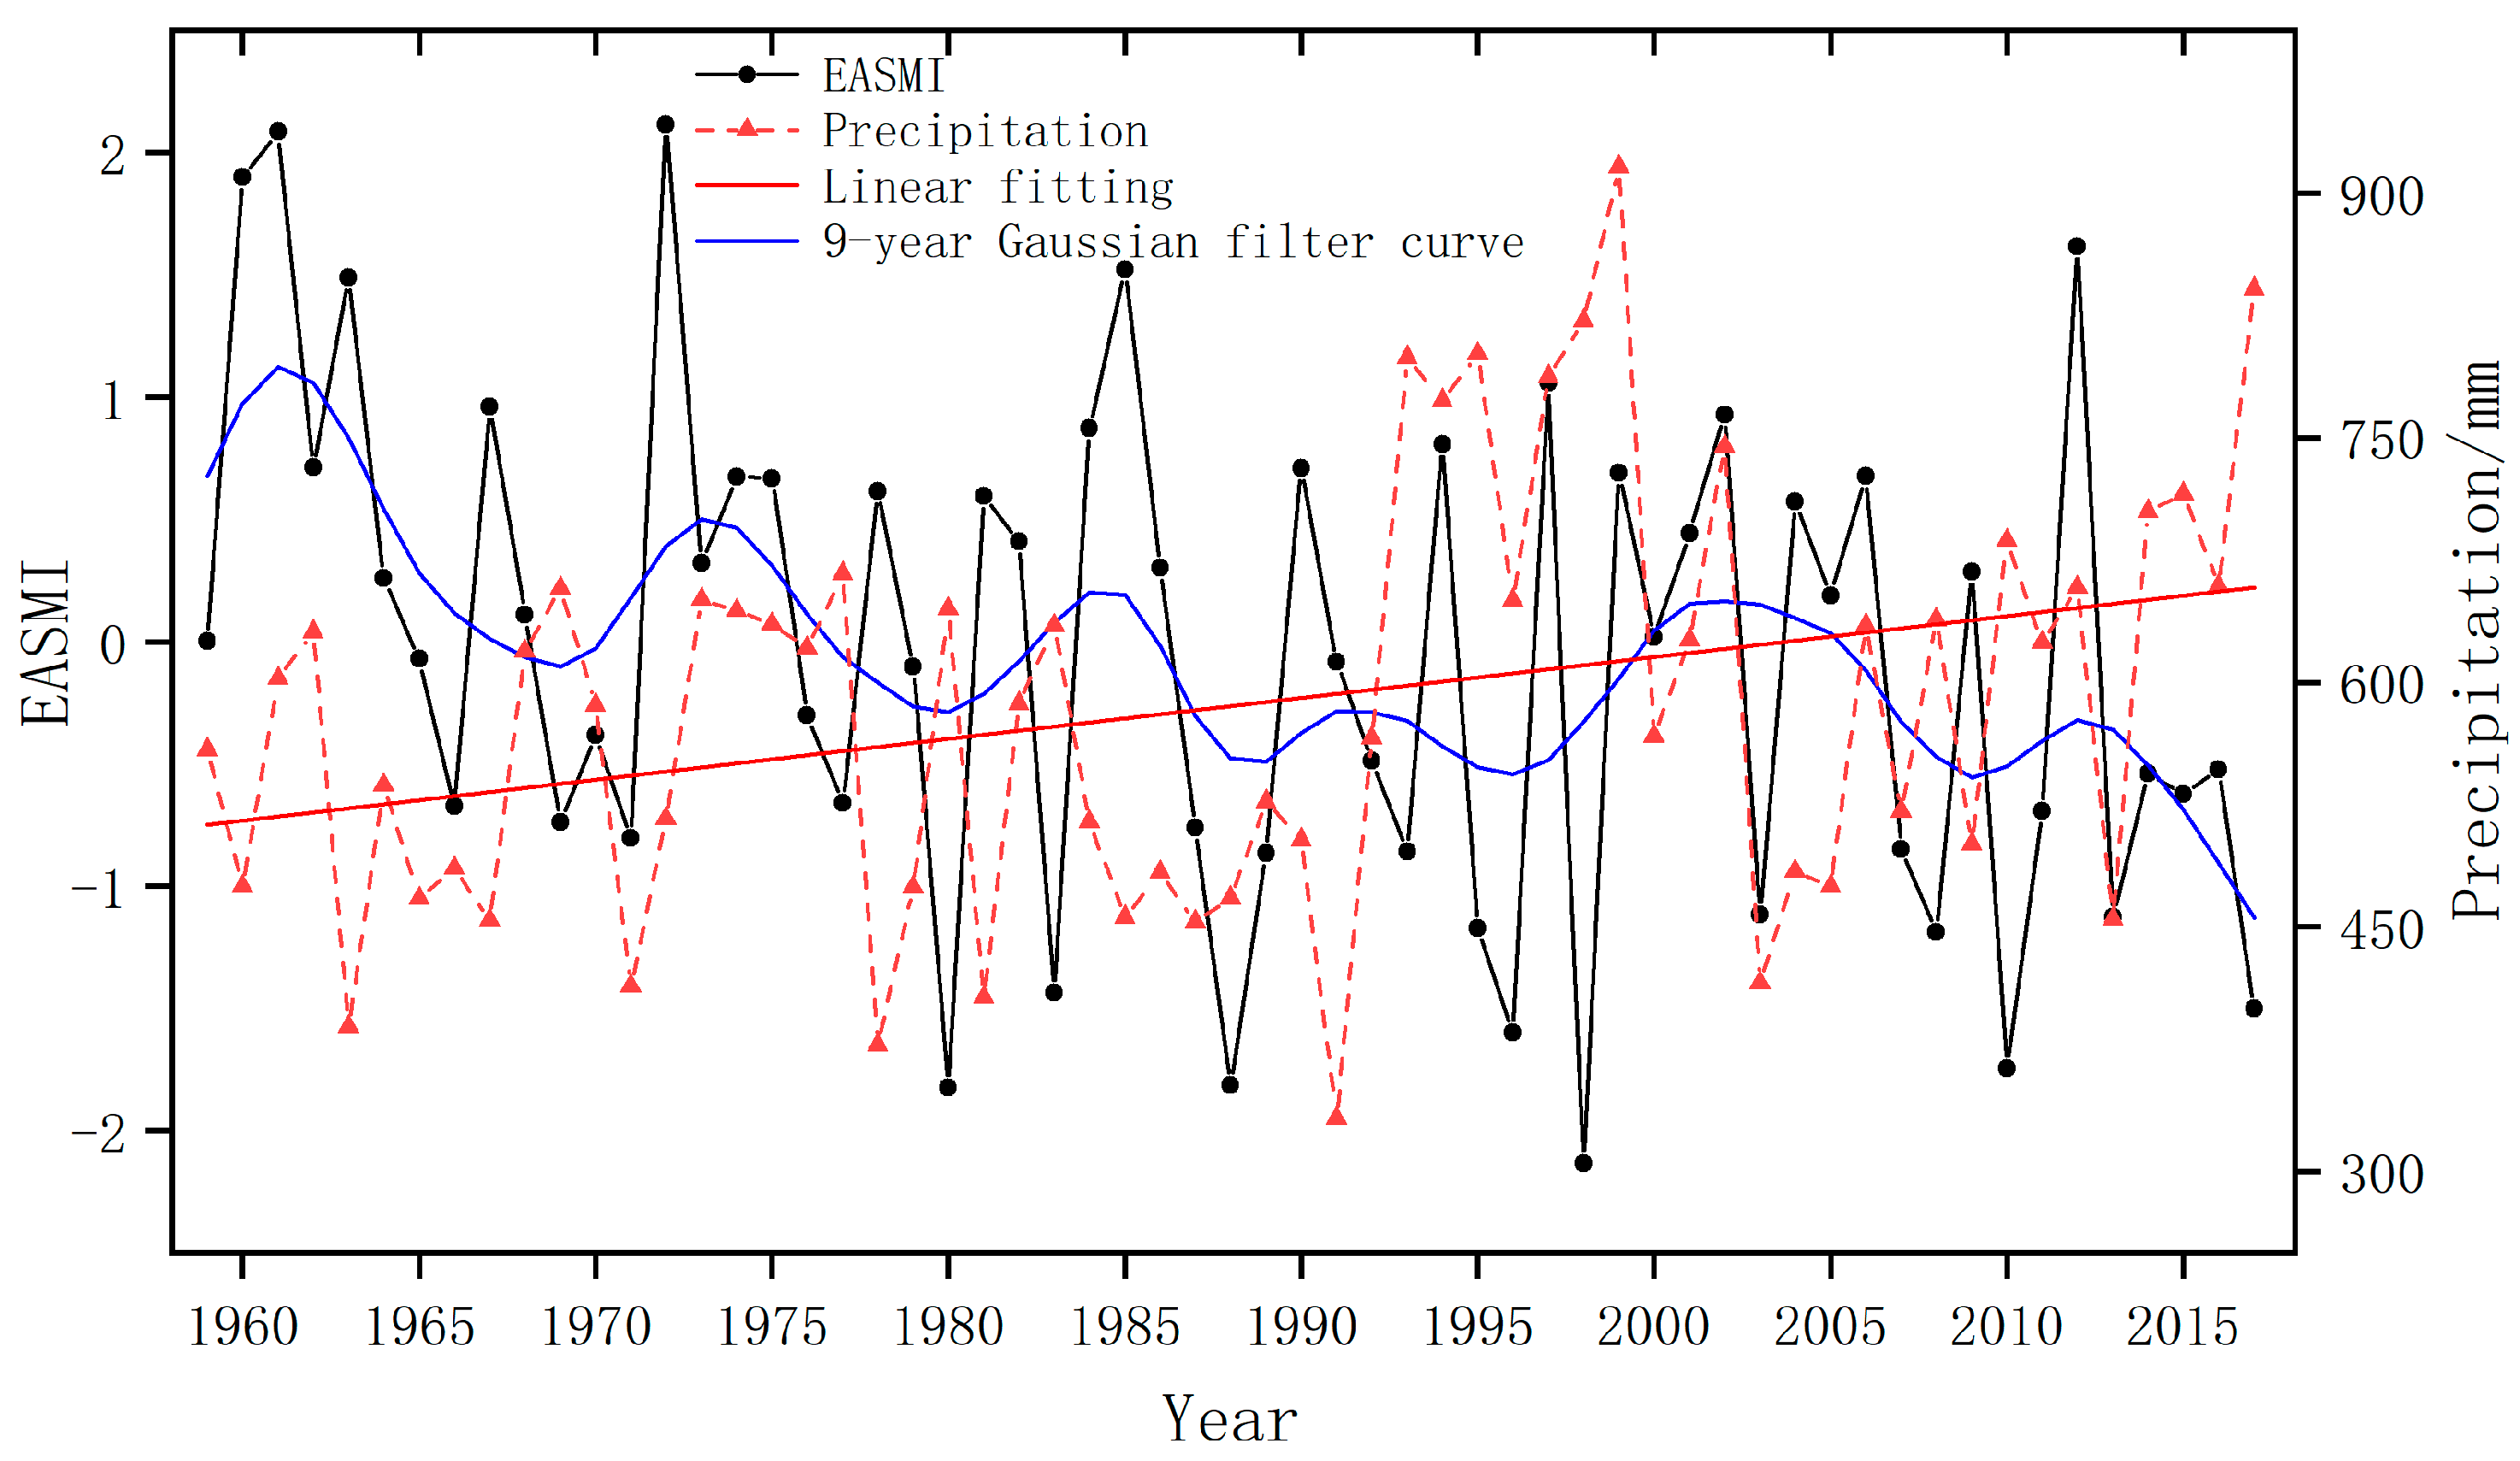
Figure 7 indicates the trend of the average summer precipitation in the PYLB and the 9-year Gaussian filter curve of the EASMI. As can be seen from the figure, the average summer precipitation in the PYLB presents an upward trend and the EASMI presents a downward trend during 1959–2017. Wang et al. also showed that the Asian Summer Monsoon had the same trend [49]. These were consistent with the results of GAO et al. that the trend of the East Asian Summer Monsoon varies from strong to weak, which leads to an increase in precipitation in the middle and lower reaches of the Yangtze river, indicating that drought summer over the basin is associated with the strong EASM and flood summer with the weak EASM [9]. Ding et al. also found the same relationship between the summer precipitation over the middle and lower reaches of the Yangtze River and the Asian Summer Monsoon [11].
Poyang Lake is the largest fresh lake in china, which may play a role in the local climate variations. The water level of Xingzi station in the Poyang Lake was selected to replace the change of lake area to investigate how the Poyang Lake regulates the local climate. As Figure 8 shows, the first mode of precipitation in the PYLB was influenced by the Poyang Lake. The standardized values of both EOF1 coefficients and water levels of the Xingzi station had good consistency. The correlation coefficients between them attained 0.596, passing the 0.01 significant confidence level. This shows that the lake area could affect local precipitation to some extent. With the reduction of the lake area, the ability of the Poyang Lake to regulate local climate was weakened, which consequently led to larger variation of EOF1 time coefficients.
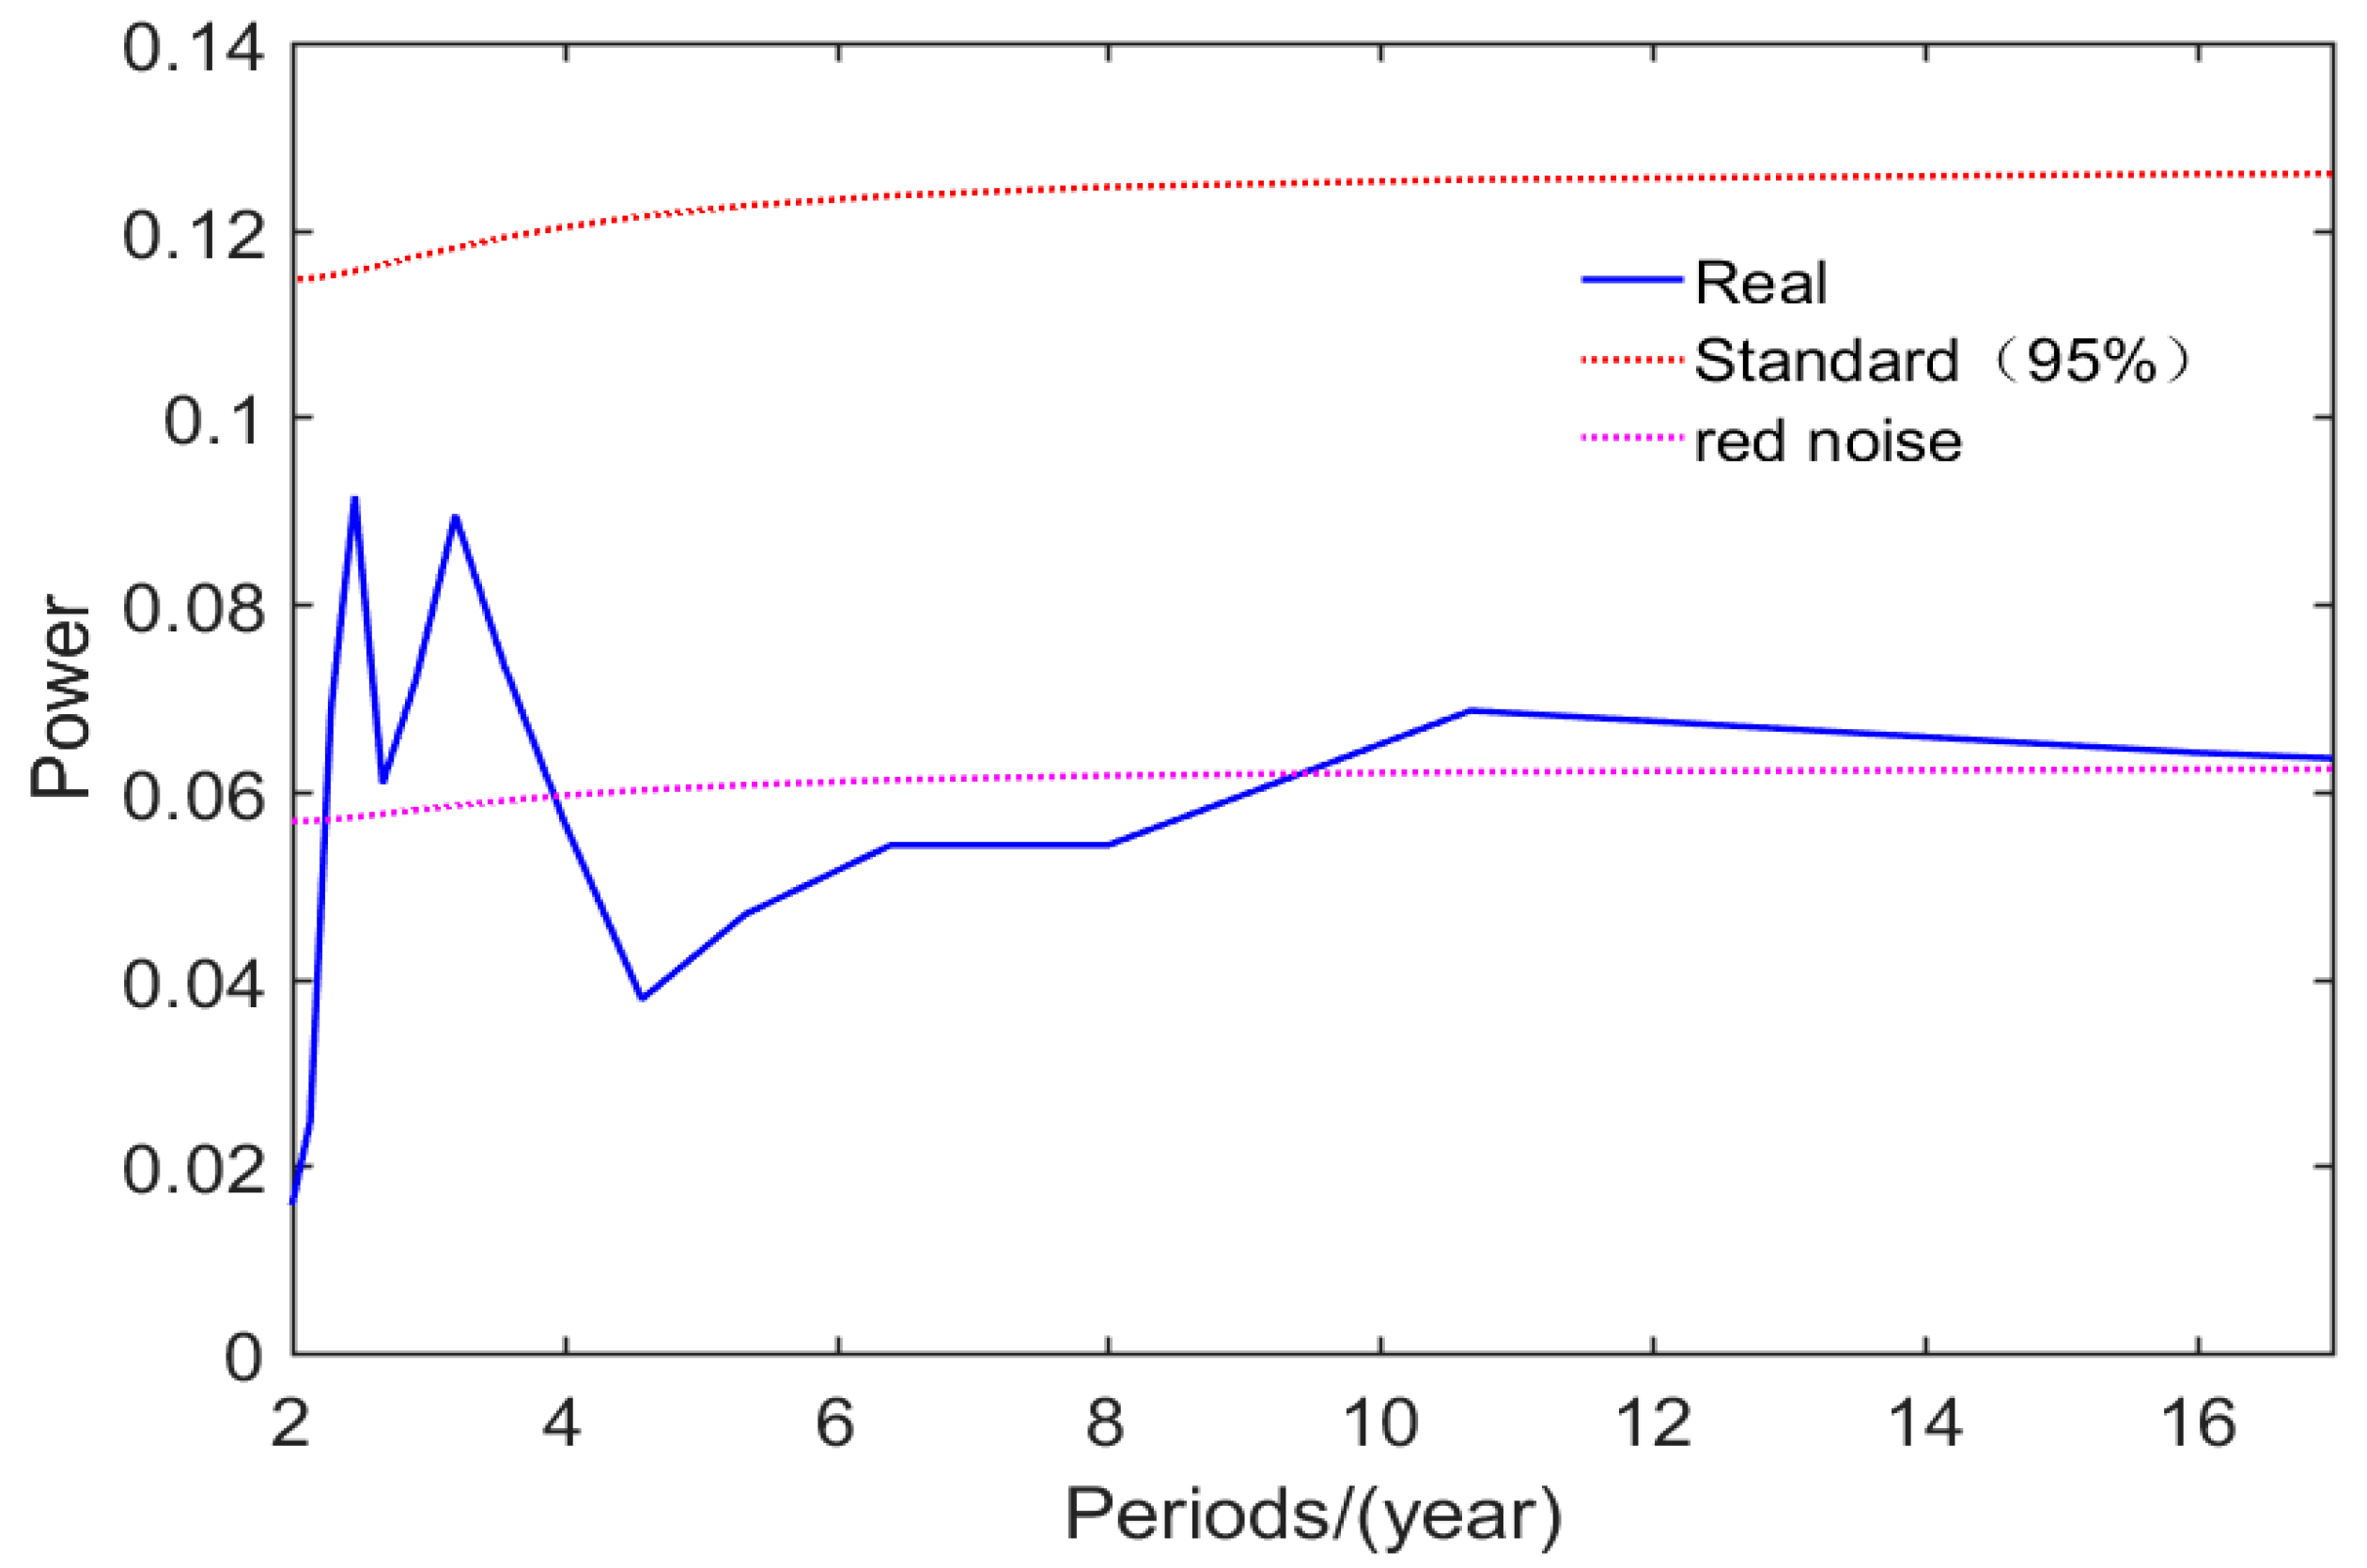
Figure 9 shows the power spectrums estimations of the EASMI from 1959 to 2017. Evidently, the EASMI had the characteristics of periodic oscillation about quasi-2–3 years and 11 years, and both of them passed the red noise standard spectrum test at the 0.05 level. The period (11 years) was consistent with periodic variation of sunspots, indicating that the EASM was correlated with sunspots at a larger scale. JIN et al. also concluded that decadal variations of the EASM were forced by the 11-year insolation cycle [50]. On the other hand, the existence of the quasi-2–3-year cycle in the EASM was also consistent with the results of previous studies [51,52,53], wherein periodic variation (2–3 years) was consistent with the quasi-biennial oscillation characteristic put forward by Belmont and Dartt in 1968, which indicated the ubiquitous quasi-biennial oscillation of climate elements.
In conclusion, there was a significant negative correlation between the second mode summer precipitation and EASMI in the Poyang Lake Basin. In order to clarify the influence of the East Asian Summer Monsoon on the 2–3 years cycle of summer precipitation corresponding to the second mode in the PYLB, a cross wavelet analysis was carried out between them. We found that the second spatial mode time coefficients of summer precipitation in the PYLB and the EASMI had a common period (2–3 years), indicating that the north–south opposite precipitation type in the PYLB was closely related to the East Asian Summer Monsoon. Previous studies also confirmed that the summer precipitation in the Yangtze River Basin was influenced by the East Asian Summer Monsoon. The weakening of the EASM limited the extension of Pacific water vapor to the northward, increasing the total summer precipitation in the Poyang Lake Basin [11,54,55]. Previous studies showed that the EASM and the precipitation in the PYLB were controlled by larger scale climatic factors such as ENSO, NAO, IOD and PDO et al. [19,56,57]. In addition, this study focused on the spatiotemporal change characteristics of summer precipitation and their relationships with large-scale climatic factors in the PYLB, China. However, topography is also an important factor affecting precipitation change. Therefore, future studies need to consider the coupling impacts of large-scale circulation factors and the local topography on precipitation in the basin.
5. Conclusions
Precipitation in the PYLB is mainly affected by the EASM. With the variations of the East Asian Summer Monsoon, the spatial and temporal characteristics of summer precipitation in the PYLB also change correspondingly. In this study, the spatial and temporal information of summer precipitation in the PYLB was separated by the EOF method. EASMI, as an indicator of EASM intensity, was used to explore its correlation with summer precipitation in the PYLB. The main conclusions are summarized below.
- (1)
- There were two modes of summer precipitation in the PYLB: the mode that is consistent over the whole area and the mode of the opposite relationship between the south of PYLB and the north of PYLB. The first mode effectively reflects the spatial consistency of summer precipitation in the PYLB. The second mode effectively reflects the summer precipitation of the opposite relationship between the south of PYLB and the north of PYLB in the basin.
- (2)
- The summer precipitation in the PYLB had apparent trend changes and inter-decadal features. The basin received below normal precipitation from the 1960s to the mid-1990s. The summer precipitation has been increasing significantly since the mid-1990s. The summer precipitation in the north of the PYLB from the 1980s to the 1990s was relatively higher than that in the south of the PYLB, and the rest of the periods vice versa. The summer precipitation of the first two modes also had multi-time-scale periodic characteristics. The summer precipitation corresponding to the first mode had cycles of 2–3 years, 5 years, and 16 years. The summer precipitation corresponding to the second mode had cycles of 2–3 years and 4–6 years.
- (3)
- There was no significant correlation between EASMI and summer precipitation corresponding to the mode being consistent over the whole area. However, there was a significant negative correlation between EASMI and summer precipitation corresponding to the mode of the opposite relationship between the south of the PYLB and the north of the PYLB, and both of them had common variation characteristics of the quasi-2–3 years oscillation period.
Author Contributions
Conceptualization, H.Z. and L.X.; methodology, H.Z.; software, H.Z.; validation, L.X., J.J. and H.F.; visualization, H.Z.; writing—original draft, H.Z.; writing—review and editing, L.X., J.J. and H.F.
Funding
This research was funded by National Key R&D Program of China (grant number 2018YFC0407606), Jiangxi Province Key Project of Research and Development Plan (20171BBH80015), Science and Technology Planning Project of Qinghai Province (2019-HZ-818, STS key projects of the Chinese Academy of Sciences (KFJ-STS-QYZD-098) and National Natural Science Foundation of China (grant number 41771235).
Acknowledgments
We greatly thank the anonymous reviewers for their professional comments, which have noticeably improved the final manuscript. We also thank Li Jianping’s team at the College of Global Change and Earth System Science, Beijing Normal University for freely providing the time series of the EASMI.
Conflicts of Interest
The authors declare no conflict of interest.
References
- IPCC. Climate Change 2014: Mitigation of Climate Change. Available online: https://www.ipcc.ch/report/ar5/wg3/ (accessed on 16 September 2014).
- Zhang, Q.; Wang, Y.; Singh, V.P.; Gu, X.; Kong, D.; Xiao, M. Impacts of ENSO and ENSO Modoki+A regimes on seasonal precipitation variations and possible underlying causes in the Huai River basin, China. J. Hydrol. 2016, 533, 308–319. [Google Scholar] [CrossRef]
- Feng, L.; Hu, C.; Chen, X.; Cai, X.; Tian, L.; Gan, W. Assessment of inundation changes of Poyang Lake using MODIS observations between 2000 and 2010. Remote Sens. Environ. 2012, 121, 80–92. [Google Scholar] [CrossRef]
- Grimm, A.M.; Tedeschi, R.G. ENSO and Extreme Rainfall Events in South America. J. Clim. 2009, 22, 1589–1609. [Google Scholar] [CrossRef]
- Stocker, T.F.; Raible, C.C. Climate change—Water cycle shifts gear. Nature 2005, 434, 830–833. [Google Scholar] [CrossRef]
- Guo, R.F.; Liu, Y.B. Evaluation of Satellite Precipitation Products with Rain Gauge Data at Different Scales: Implications for Hydrological Applications. Water Sui 2016, 8, 281. [Google Scholar] [CrossRef]
- Zhang, Q.A.; Liu, Y.; Yang, G.D.; Zhang, Z.X. Precipitation and hydrological variations and related associations with large-scale circulation in the Poyang Lake basin, China. Hydrol. Process. 2011, 25, 740–751. [Google Scholar] [CrossRef]
- Li, X.H.; Ye, X.C. Spatiotemporal Characteristics of Dry-Wet Abrupt Transition Based on Precipitation in Poyang Lake Basin, China. Water Sui 2015, 7, 1943–1958. [Google Scholar] [CrossRef] [Green Version]
- Gao, H.; Jiang, W.; Li, W. Changed relationships between the East Asian summer monsoon circulations and the summer rainfall in eastern China. J. Meteorol. Res. 2014, 28, 1075–1084. [Google Scholar] [CrossRef]
- Liu, H.W.; Zhou, T.J.; Zhu, Y.X.; Lin, Y.H. The strengthening East Asia summer monsoon since the early 1990s. Chin. Sci. Bull. 2012, 57, 1553–1558. [Google Scholar] [CrossRef] [Green Version]
- Ding, Y.; Sun, Y.; Wang, Z.; Zhu, Y.; Song, Y. Inter-decadal variation of the summer precipitation in China and its association with decreasing Asian summer monsoon Part II: Possible causes. Int. J. Clim. 2009, 29, 1926–1944. [Google Scholar] [CrossRef]
- Wang, B.; Ho, L. Rainy Season of the Asian–Pacific Summer Monsoon. J. Clim. 2002, 15, 386–398. [Google Scholar] [CrossRef]
- Zhai, P.; Zhang, X.; Wan, H.; Pan, X. Trends in Total Precipitation and Frequency of Daily Precipitation Extremes over China. J. Clim. 2005, 18, 1096–1108. [Google Scholar] [CrossRef]
- Xu, Z.X.; Gong, T.L.; Li, J.Y. Decadal trend of climate in the Tibetan Plateau—regional temperature and precipitation. Hydrol. Process. 2008, 22, 3056–3065. [Google Scholar] [CrossRef]
- Liu, Q.; Yang, Z.; Cui, B. Spatial and temporal variability of annual precipitation during 1961–2006 in Yellow River Basin, China. J. Hydrol. 2008, 361, 330–338. [Google Scholar] [CrossRef]
- Pei, F.; Wu, C.; Qu, A.; Xia, Y.; Wang, K.; Zhou, Y. Changes in Extreme Precipitation: A Case Study in the Middle and Lower Reaches of the Yangtze River in China. Water 2017, 9, 943. [Google Scholar] [CrossRef]
- Su, Z.; Hao, Z.; Yuan, F.; Chen, X.; Cao, Q. Spatiotemporal Variability of Extreme Summer Precipitation over the Yangtze River Basin and the Associations with Climate Patterns. Water 2017, 9, 873. [Google Scholar] [CrossRef]
- Wang, B.; Fan, Z. Choice of South Asian Summer Monsoon Indices. Bull. Am. Meteorol. Soc. 1999, 80, 629–638. [Google Scholar] [CrossRef] [Green Version]
- Xiao, M.Z.; Zhang, Q.; Singh, V.P. Influences of ENSO, NAO, IOD and PDO on seasonal precipitation regimes in the Yangtze River basin, China. Int. J. Climatol. 2015, 35, 3556–3567. [Google Scholar] [CrossRef]
- Huang, T.; Xu, L.G.; Fan, H.X. Drought Characteristics and Its Response to the Global Climate Variability in the Yangtze River Basin, China. Water Sui 2019, 11, 13. [Google Scholar] [CrossRef]
- Li, X.H.; Hu, Q. Spatiotemporal Changes in Extreme Precipitation and Its Dependence on Topography over the Poyang Lake Basin, China. Adv. Meteorol. 2019. [Google Scholar] [CrossRef]
- Zhang, Y.; You, Q.; Ye, L.; Chen, C. Spatio-temporal characteristics and possible mechanisms of rainy season precipitation in Poyang Lake Basin, China. Clim. Res. 2017, 72, 129–140. [Google Scholar] [CrossRef]
- Shao, J.; Wang, J.; Lv, S.; Bing, J. Spatial and temporal variability of seasonal precipitation in Poyang Lake basin and possible links with climate indices. Hydrol. Res. 2016, 47, 51–68. [Google Scholar] [CrossRef]
- Zhang, Q.; Xiao, M.; Singh, V.P.; Chen, Y.D. Max-stable based evaluation of impacts of climate indices on extreme precipitation processes across the Poyang Lake basin, China. Glob. Planet. Chang. 2014, 122, 271–281. [Google Scholar] [CrossRef]
- Zhang, L.; Chen, X.; Lu, J.; Fu, X.; Zhang, Y.; Liang, D.; Xu, Q. Precipitation projections using a spatiotemporally distributed method: A case study in the Poyang Lake watershed based on the MRI-CGCM. Hydrol. Earth Syst. Sci. 2019, 23, 1649–1666. [Google Scholar] [CrossRef]
- Wang, Y.; Ma, J.; Xiao, X.; Wang, X.; Dai, S.; Zhao, B. Long-Term Dynamic of Poyang Lake Surface Water: A Mapping Work Based on the Google Earth Engine Cloud Platform. Remote Sens. 2019, 11, 313. [Google Scholar] [CrossRef]
- Zhang, Q.; Xiao, M.; Li, J.; Singh, V.P.; Wang, Z. Topography-based spatial patterns of precipitation extremes in the Poyang Lake basin, China: Changing properties and causes. J. Hydrol. 2014, 512, 229–239. [Google Scholar] [CrossRef]
- Ye, X.; Zhang, Q.; Liu, J.; Li, X.; Xu, C.Y. Distinguishing the relative impacts of climate change and human activities on variation of streamflow in the Poyang Lake catchment, China. J. Hydrol. 2013, 494, 83–95. [Google Scholar] [CrossRef]
- Fan, H.; Xu, L.; Tao, H.; Feng, W.; Cheng, J.; You, H. Accessing the Difference in the Climate Elasticity of Runoff across the Poyang Lake Basin, China. Water 2017, 9, 135. [Google Scholar] [CrossRef]
- Dai, X.; Wan, R.; Yang, G. Non-stationary water-level fluctuation in China’s Poyang Lake and its interactions with Yangtze River. J. Geogr. Sci. 2015, 25, 274–288. [Google Scholar] [CrossRef]
- Xu, L.; Zhu, M.; He, B.; Wang, X.; Zhang, Q.; Jiang, J.; Razafindrabe, B.H. Analysis of Water Balance in Poyang Lake Basin and Subsequent Response to Climate Change. J. Coast. Res. 2014, 68, 136–143. [Google Scholar] [CrossRef]
- Park, H.J.; Kryjov, V.N.; Ahn, J.B. One-Month-Lead Predictability of Asian Summer Monsoon Indices Based on the Zonal Winds by the APCC Multimodel Ensemble. J. Clim. 2018, 31, 8945–8960. [Google Scholar] [CrossRef]
- Chen, J.; Wei, H.; Jin, L.Y.; Chen, J.H.; Chen, S.Q.; Chen, F.H. A climatological northern boundary index for the East Asian summer monsoon and its interannual variability. Sci. China Earth Sci. 2018, 61, 13–22. [Google Scholar] [CrossRef]
- Chen, W.; Guan, Z. A joint monsoon index for East Asian-Australian monsoons during boreal summer. Atmos. Sci. Lett. 2017, 18, 403–408. [Google Scholar] [CrossRef] [Green Version]
- Wright, J.S.; Huang, W.; Wang, B. A potential vorticity-based index for the East Asian winter monsoon. J. Geophys. Res. Atmos. 2016, 121, 9382–9399. [Google Scholar] [Green Version]
- Zhao, G.; Huang, G.; Wu, R.; Tao, W.; Gong, H.; Qu, X.; Hu, K. A New Upper-Level Circulation Index for the East Asian Summer Monsoon Variability. J. Clim. 2015, 28, 9977–9996. [Google Scholar] [CrossRef] [Green Version]
- Cao, J.; Hu, J.; Tao, Y. An index for the interface between the Indian summer monsoon and the East Asian summer monsoon. J. Geophys. Res. Space Phys. 2012, 117, 108. [Google Scholar] [CrossRef]
- Goswami, B.; Krishnamurthy, V.; Annamalai, H. A broad-scale circulation index for the interannual variability of the Indian summer monsoon. Q. J. R. Meteorol. Soc. 1999, 125, 611–633. [Google Scholar] [CrossRef]
- Lau, K.M.; Yang, S. Seasonal Variation, Abrupt Transition, and Intraseasonal Variability Associated with the Asian Summer Monsoon in the GLA GCM. J. Clim. 1996, 9, 965–985. [Google Scholar] [CrossRef] [Green Version]
- Li, J.P.; Zheng, Q.C. A new monsoon index and the geographical distribution of the global monsoons. Adv. Atmos. Sci. 2003, 20, 299–302. [Google Scholar]
- Li, J.P.; Zeng, Q.C. A unified monsoon index. Geophys. Res. Lett. 2002, 29, 1274. [Google Scholar] [CrossRef]
- Lorenz, E.N. Section of planetary sciences: The predictability pf hydrodynamic flow. Trans. New York Acad. Sci. 2012, 25, 409–432. [Google Scholar] [CrossRef]
- North, G.R.; Bell, T.L.; Cahalan, R.F.; Moeng, F.J. Sampling Errors in the Estimation of Empirical Orthogonal Functions. Mon. Weather. Rev. 1982, 110, 699–706. [Google Scholar] [CrossRef]
- Torrence, C.; Compo, G.P. A Practical Guide to Wavelet Analysis. Bull. Am. Meteorol. Soc. 1998, 79, 61–78. [Google Scholar] [CrossRef] [Green Version]
- Grinsted, A.; Moore, J.C.; Jevrejeva, S. Application of the cross wavelet transform and wavelet coherence to geophysical time series. Nonlinear Process. Geophys. 2004, 11, 561–566. [Google Scholar] [CrossRef]
- Liu, X.F.; Yuan, H.Z.; Guan, Z.Y. Effects of enso on the relationship between iod and summer rainfall in china. J. Trop. Meteorol. 2009, 15, 59–62. [Google Scholar]
- Yuan, Y.; Yang, H.; Zhou, W.; Li, C. Influences of the Indian Ocean dipole on the Asian summer monsoon in the following year. Int. J. Clim. 2008, 28, 1849–1859. [Google Scholar] [CrossRef]
- Zou, X.K.; Ren, F.M. Changes in Regional Heavy Rainfall Events in China during 1961–2012. Adv. Atmos. Sci. 2015, 32, 704–714. [Google Scholar] [CrossRef]
- Wang, R.; Zhang, J.; Guo, E.; Zhao, C.; Cao, T. Spatial and temporal variations of precipitation concentration and their relationships with large-scale atmospheric circulations across Northeast China. Atmos. Res. 2019, 222, 62–73. [Google Scholar] [CrossRef]
- Jin, C.; Liu, J.; Wang, B.; Yan, M.; Ning, L. Decadal Variations of the East Asian Summer Monsoon Forced by the 11-Year Insolation Cycle. J. Clim. 2019, 32, 2735–2745. [Google Scholar] [CrossRef]
- Wei, F.Y.; Zhang, T. Oscillation characteristics of summer precipitation in the Huaihe River valley and relevant climate background. Sci. China Earth Sci. 2010, 53, 301–316. [Google Scholar] [CrossRef]
- Chang, C.P.; Zhang, Y.; Li, T. Interannual and Interdecadal Variations of the East Asian Summer Monsoon and Tropical Pacific SSTs. Part I: Roles of the Subtropical Ridge. J. Clim. 2000, 13, 4310–4325. [Google Scholar] [CrossRef] [Green Version]
- Giorgetta, M.A.; Bengtsson, L.; Arpe, K. An investigation of QBO signals in the east Asian and Indian monsoon in GCM experiments. Clim. Dyn. 1999, 15, 435–450. [Google Scholar] [CrossRef]
- Zhang, Q.; Xu, C.Y.; Zhang, Z.; Chen, Y.D.; Liu, C.L.; Lin, H. Spatial and temporal variability of precipitation maxima during 1960–2005 in the Yangtze River basin and possible association with large-scale circulation. J. Hydrol. 2008, 353, 215–227. [Google Scholar] [CrossRef]
- Ding, Y.; Wang, Z.; Sun, Y. Inter-decadal variation of the summer precipitation in East China and its association with decreasing Asian summer monsoon.Part I: Observed evidences. Int. J. Clim. 2008, 28, 1139–1161. [Google Scholar] [CrossRef]
- Zhang, Q.; Xiao, M.Z.; Singh, V.P.; Wang, Y.Q. Spatiotemporal variations of temperature and precipitation extremes in the Poyang Lake basin, China. Theor. Appl. Climatol. 2016, 124, 855–864. [Google Scholar] [CrossRef]
- Ouyang, R.; Liu, W.; Fu, G.; Liu, C.; Hu, L.; Wang, H. Linkages between ENSO/PDO signals and precipitation, streamflow in China during the last 100 years. Hydrol. Earth Syst. Sci. 2014, 18, 3651–3661. [Google Scholar] [CrossRef] [Green Version]
Figure 1.
Location of the Poyang Lake Basin and distribution of eighteen meteorological stations.

Figure 2.
Spatial distribution of the first two leading Empirical Orthogonal Function (EOF) modes of summer precipitation in the Poyang Lake Basin (PYLB). (a,b) indicate the spatial distribution of EOF1 and EOF2 respectively.
Figure 2.
Spatial distribution of the first two leading Empirical Orthogonal Function (EOF) modes of summer precipitation in the Poyang Lake Basin (PYLB). (a,b) indicate the spatial distribution of EOF1 and EOF2 respectively.

Figure 3.
Normalized time coefficient series of the first two leading EOF modes of summer precipitation in the PYLB and 9-year Gaussian-type filtered curves.
Figure 3.
Normalized time coefficient series of the first two leading EOF modes of summer precipitation in the PYLB and 9-year Gaussian-type filtered curves.

Figure 4.
Wavelet power spectrums of the first two time coefficients. The dashed lines indicate that the wavelet power spectrums enclosed by them passed the confidence test at the 0.05 level. The thin black line represents the influence cone, beyond which the wavelet power spectrums are invalid. The unit of the power spectrums is dimensionless power/variance ratio.

Figure 5.
Spatial distribution of correlation coefficients between EASMI and summer precipitation in the Poyang Lake Basin.
Figure 5.
Spatial distribution of correlation coefficients between EASMI and summer precipitation in the Poyang Lake Basin.

Figure 6.
The time-frequency spectrums of the Cross Wavelet Transform (XWT) between summer precipitation and EASMI in the PYLB. The arrows represent relative phase differences. The arrow to the right indicates consistency of phase changes. The arrow to the right indicates the opposite change of phases. The thick black lines represent that the wavelet power spectrums enclosed by them passed confidence test at the 0.05 level. The thin black line is the influence cone, wherein the power spectrums are valid. The unit of the power spectrums is dimensionless power/variance ratio.

Figure 7.
The solid black line indicates the normalized time series of the EASMI for the period of 1959–2017. The solid blue line indicates 9-year Gaussian-type filtered values of the EASMI. The dashed red line represents the average summer precipitation in the PYLB during 1959–2017. The solid red line represents its trend.

Figure 8.
The black solid line indicates the trend of the standardized value of water level in the PYLB during 1959–2015. The red dashed line represents the trend of standardized value of EOF1 time coefficient during 1959–2015.
Figure 8.
The black solid line indicates the trend of the standardized value of water level in the PYLB during 1959–2015. The red dashed line represents the trend of standardized value of EOF1 time coefficient during 1959–2015.

Figure 9.
Estimations of EASMI power spectrums. The blue line indicates the power spectrum curve of EASMI and the dotted lines indicate the red and the white noise standard spectrum. The peak value of the power spectrum estimation between the red and white noise test lines passed the confidence test at the 0.05 level.


Table 1.
Variance and cumulative variance contribution rates of the first 10 eigenvectors.
| Eigenvectors | 1 | 2 | 3 | 4 | 5 | 6 | 7 | 8 | 9 | 10 |
|---|---|---|---|---|---|---|---|---|---|---|
| Variance contribution rates (%) | 42.1 | 22.4 | 6.6 | 5.1 | 3.6 | 3.3 | 2.9 | 2.6 | 2.4 | 1.6 |
| Cumulative variance contribution rates (%) | 42.1 | 64.5 | 71.1 | 76.2 | 79.8 | 83.1 | 86.0 | 88.6 | 91.0 | 92.6 |
Table 2.
Correlation coefficients between the East Asian Summer Monsoon Index (EASMI) and summer precipitation (SMP).
Table 2.
Correlation coefficients between the East Asian Summer Monsoon Index (EASMI) and summer precipitation (SMP).
| SMP (station) | EASMI | SMP (station) | EASMI |
|---|---|---|---|
| SMP (Xiushui) | −0.534 ** | SMP (Poyang) | −0.353 ** |
| SMP (Yichun) | −0.054 | SMP (Jingdezhen) | −0.495 ** |
| SMP (Ji’anxian) | −0.025 | SMP (Nanchang) | −0.39 ** |
| SMP (Xiaping) | 0.013 | SMP (Zhangshu) | −0.262 * |
| SMP (Jinggangshan) | 0.213 | SMP (Guixi) | −0.237 |
| SMP (Suichuan) | 0.32 * | SMP (Yushan) | −0.283 * |
| SMP (Ganxian) | 0.253 | SMP (Nancheng) | −0.092 |
| SMP (Jiujiang) | −0.268 * | SMP (Guangchang) | 0.093 |
| SMP (Lushan) | −0.051 | SMP (Xunxwu) | 0.148 |
The signs ** and * represent significant correlation coefficients at the 0.01 and 0.05 level respectively.
Table 3.
Correlation coefficients between ENSO, the Pacific Decadal Oscillation (PDO), the Indian Ocean Dipole (IDO), the North Atlantic Oscillation (NAO), T1 and T2.
Table 3.
Correlation coefficients between ENSO, the Pacific Decadal Oscillation (PDO), the Indian Ocean Dipole (IDO), the North Atlantic Oscillation (NAO), T1 and T2.
| Niño 3.4-0 | Niño 3.4-1 | PDO-0 | PDO-1 | IOD-0 | IOD-1 | NAO-0 | NAO-1 | |
|---|---|---|---|---|---|---|---|---|
| T1 | −0.043 | 0.043 | 0.081 | 0.182 | 0.248 | 0.222 | −0.037 | 0.040 |
| T2 | −0.110 | 0.242 | 0.049 | 0.152 | −0.190 | 0.115 | 0.147 | −0.049 |
The climate indices with a suffix of ‘-0’ and ‘-1’ denote the climate indices with 0- and 1-year ahead, respectively.
© 2019 by the authors. Licensee MDPI, Basel, Switzerland. This article is an open access article distributed under the terms and conditions of the Creative Commons Attribution (CC BY) license (http://creativecommons.org/licenses/by/4.0/).
Share and Cite
MDPI and ACS Style
Zhu, H.; Xu, L.; Jiang, J.; Fan, H. Spatiotemporal Variations of Summer Precipitation and Their Correlations with the East Asian Summer Monsoon in the Poyang Lake Basin, China. Water 2019, 11, 1705. https://doi.org/10.3390/w11081705
AMA Style
Zhu H, Xu L, Jiang J, Fan H. Spatiotemporal Variations of Summer Precipitation and Their Correlations with the East Asian Summer Monsoon in the Poyang Lake Basin, China. Water. 2019; 11(8):1705. https://doi.org/10.3390/w11081705
Chicago/Turabian StyleZhu, Hua, Ligang Xu, Jiahu Jiang, and Hongxiang Fan. 2019. "Spatiotemporal Variations of Summer Precipitation and Their Correlations with the East Asian Summer Monsoon in the Poyang Lake Basin, China" Water 11, no. 8: 1705. https://doi.org/10.3390/w11081705
Note that from the first issue of 2016, this journal uses article numbers instead of page numbers. See further details here.