Sustainable Water Resources Management in Small Greek Islands under Changing Climate
by
Ioannis M. Kourtis
1, 
Konstantinos G. Kotsifakis
2,
Elissavet G. Feloni
2,* and 
Evangelos A. Baltas
2 1
Laboratory of Reclamation Works and Water Resources Management, School of Rural and Surveying Engineering, National Technical University of Athens, 15780 Athens, Greece
2
Department of Water Resources and Environmental Engineering, School of Civil Engineering, National Technical University of Athens, 15780 Athens, Greece
*
Author to whom correspondence should be addressed.
Water 2019, 11(8), 1694; https://doi.org/10.3390/w11081694
Submission received: 28 June 2019
/
Revised: 6 August 2019
/
Accepted: 12 August 2019
/
Published: 15 August 2019
(This article belongs to the Special Issue Hydrologic Modelling for Water Resources and River Basin Management)
Abstract
:Five different water resource management scenarios are examined on eight dry islands of the Aegean Sea in Greece, pitting the current practice of water hauling via ship against alternative water supply schemes in delivering a sustainable solution for meeting water demand. The first scenario employs current water supply practices along with the operation of domestic rainwater harvesting systems. Desalinated water, provided through the operation of wind-powered desalination plants, is considered the main source of potable water in the rest of scenarios. Wind-powered desalination may be combined with rainwater harvesting as a supplementary source of water and/or seawater pumping and an additional source of energy that is supplied to the system. All different alternatives are evaluated for a 30-year lifespan, and an optimal solution is proposed for each island, based on a life cycle cost (LCC) analysis. The performance of this solution is then assessed under six climate change (CC) scenarios in terms of the rate of on-grid versus off-grid renewable energy that is required in order to achieve a certain reliability level. Overall, the examined scenarios show a decreasing performance in terms of reliability under CC for the eight islands.
1. Introduction
According to the World Water Assessment Programme [1] global water demand has increased approximately by 1% per year from the 1980s and is expected to continue to rise with a similar rate until 2050, ending up in a 20%–30% increase above the current global water demand. This is due to many factors, such as population growth, changes in consumption patterns, increased water needs of municipal, agricultural and industrial sectors, and socio–economic and technological development [1,2]. Moreover, fresh water availability is expected to decrease because of climate change (CC) and water quality degradation. According to Sustainable Development Goal (SDG) No. 6 [3], the availability and sustainable management of water and sanitation must be ensured for all people now and for the future. As a result, all the above projections are in direct conflict with this target of the United Nations [4].
Greece is a typical example of challenging water resources management (WRM) for many reasons. First of all, its geomorphology in combination with its geographical position in the eastern part of the Mediterranean Sea leads to the inhomogeneous distribution of annual precipitation depth, an attribute that affects the hydrological and hydrogeological regime of the mainland. Secondly, around 100 islands in Greece are inhabited, most of which have insufficient water resources and need to be supplied via water importation (Table 1). In general, islands face water scarcity at a higher intensity compared to the mainland, and, at the same time, they have a higher degree of autonomy, which can speed up the implementation of innovative processes [5]. Thus, current practices to ensure water supply in small dry islands in Greece are not fully sustainable and effective, especially during summer months, as needs increase significantly due to tourism. Various WRM practices are used for the islands’ water supply, including rainwater harvesting (RWH), water transportation and desalination.
RWH, a water management practice followed for over 4000 years, has gained more and more ground as a modern and simple water saving technology [6]. RWH can augment a water supply to meet urban and rural needs by adding flexibility and robustness to a system while avoiding more costly expansions in infrastructure [7]. Untreated harvested rainwater can be used for non-potable uses, such as toilet flushing, cloth washing, other household uses and garden irrigation, while potable uses are also common in several countries (e.g., Australia and Spain), but the appropriate treatment of harvested rainwater might be required, depending on its quality [8]. Several studies (e.g., [9,10,11,12]) have shown that RWH can be a viable alternative source for domestic water, with quantities saved ranging from 12% to 100% of the overall demand [13], depending on the specific environmental conditions and the technical characteristics of the system selected (e.g., tank size). The potential use of RWH combined with greywater recycling—which is defined as the urban wastewater that includes water from baths, showers, hand basins, washing machines, dishwashers and kitchen sinks but excludes steams from toilets [14,15]—is another option which could lead to an even further reduction of publicly-supplied water [16,17,18]. Regarding design parameters, the rainfall depth is the factor that directly affects the operational efficiency of the system, with other factors including the rooftop area, tank volume, water demand and the efficiency of runoff collection and the filter [19]. Despite the benefits obtained, RWH is still limited in many countries, including Greece, as, among other reasons, the cost of installation and maintenance can lead to long payback periods [20,21].
An evolving technology for water supply is sea and brackish water desalination. As reported by the International Desalination Association (2019), the global installed capacity of the desalination plants is about 100 million m3/d, with about 59% of the installed global desalination capacity using seawater as the feed-water type. Technological improvements regarding membrane processes, energy recovery systems and desalination plants integrated with renewable energy sources (RES) can provide opportunities for cost reduction (e.g., [4,22]). Consequently, desalination is an increasingly attractive technology that can be considered an economical and efficient solution to the water scarcity problem of remote areas and islands, especially for freshwater production (e.g., [3,11,23,24,25,26]). However, the main disadvantage of desalination technologies is the high energy consumption requirements [2,4,27]. Indicatively, the energy usage for seawater desalination lies between 0.5–16 kWh/m3, depending on the technology used (e.g., [2,28,29]). According to Gude [27], desalination technologies are classified in two main categories: Thermal and membrane processes. About 65% of the total global fresh water produced is by utilizing membrane processes and, particularly, by reverse osmosis (RO) technology [30]. RO is expected to remain the dominant technology in the new era due to the lower energy consumption it requires, its lower construction, operation and maintenance (O and M) costs, and its technological improvements [4,27,28].
During the few last decades, there has been an increasing interest regarding the use of RES as power supplies for desalination plants (e.g., [2,24,26,27,28,29,31,32,33,34]). As García Latorre et al. [35] reported, this is mainly attributed to the limited availability of fossil fuels and to the unpredictability of their cost. The environmental issues of fossil fuels are also factors that encourages the change to RES [36]. Solar, wind and geothermal energy are the main sources of renewable energy integrated with desalination technology, accounting for approximately 90% of renewable energy desalination worldwide [26]. Among them, wind energy is the most frequently used in coastal areas, given the high wind-potential that is usually available [25,37], with wave energy being also suitable in some cases. Regarding the latter, however, although it is a source with significant potential [38], its application still entails many uncertainties [39] because it is a rather new technology. Besides the technical aspects, the estimation of cost is a major one [40].
Finally, various studies [41,42,43,44,45] have evaluated the role of seawater pumping as power supply to desalination plants; this particular practice is called seawater pumped hydro storage (SPHS). SPHS methods are considered already mature and widely applied technologies [46]. It must be stated that the operation of a system with a single reservoir is proposed for minimizing the costs [45]. Therefore, SPHS can be proved to be an attractive option for the remote islands of Greece. Caldera et al. [2] tried to estimate whether it is possible for a seawater RO desalination plant, powered solely by RES, to cover the global water demand by 2030. Katsaprakakis et al. [43] present, in detail, a wind powered pumped storage system (WP-PSS) at which electricity surplus could be used in RO desalination plants for producing potable water. Segurado et al. [47] optimized sizing regarding an operational strategy of an integrated power and water supply system that consisted of a wind-powered desalination and pumped hydro storage system.
The objective of this research paper is to evaluate five different WRM scenarios for meeting the increasing water demand in small remote islands of the Aegean Sea. These scenarios include: (i) Domestic rainwater harvesting combined with water transportation, (ii) wind-powered seawater desalination, (iii) wind-powered seawater desalination and domestic rainwater harvesting, (iv) wind-powered seawater desalination combined with seawater pumping, and (v) wind-powered seawater desalination combined with seawater pumping and domestic rainwater harvesting. Each alternative was examined for a 30-year time period, taking into account an increase in population and tourism, and evaluated in respect to cost, using the life cycle cost (LCC) methodology. As the performance of each alternative is directly related to the variability of meteorological conditions (e.g., wind speed for wind turbines operation and precipitation for rainwater harvesting), the best solution, as determined, was also assessed under six different climate change scenarios. While most of the above alternatives have either been proposed or implemented for water supply in various arid Greek islands, this is the first time that these different measures and combinations have been assessed and compared on the regional scale in seek of an optimal solution. This paper focused on eight small islands of the Aegean Sea which face significant water scarcity problems; however, the presented methodological framework and findings are applicable to other arid or semi-arid insular or isolated coastal regions of the mainland.
2. Materials and Methods
2.1. Study Area
The study was carried out for eight small dry islands located in the Aegean Sea at Eastern Greece which belong to the Cyclades and Dodecanese complexes; they are named Kimolos, Heraklia, Schinoussa, Koufonisi, Donousa and Lipsi, Chalki and Megisti (Figure 1).
All the aforementioned islands face water scarcity problems, especially during summer months as demand increases due to tourism. Typically, the number of tourists during the high season (July–August) is about five times the population of the islands; however, it can reach up to fifteen times the population in some cases (e.g., Koufonisi Island). In these islands, local water resources are not sufficient and are often of low quality. Thus, water transportation is employed mainly from the mainland (Lavrion port in the East of Athens) for the Cyclades complex and from Rhodes (which is located to the east of Chalki) for the Dodecanese complex. Rainwater is also exploited for various uses, as many households, especially older properties, use RWH tanks. Furthermore, the majority of the aforementioned islands are in the stages of construction or early operation of desalination plants. Table 2 presents the characteristics of each island, including their location, total area, maximum elevation, population, mean annual precipitation (as calculated from available historical records of the neighboring islands for the period of 2008–2017) and the mean annual quantity of water being transported using 2010–2014 as a reference period (data from Table 1). In general, population and quantity of fresh water being transported show correlation—except for Koufonisi Island, which is characterized by high tourism.
2.2. WRM Scenarios and Design Parameters
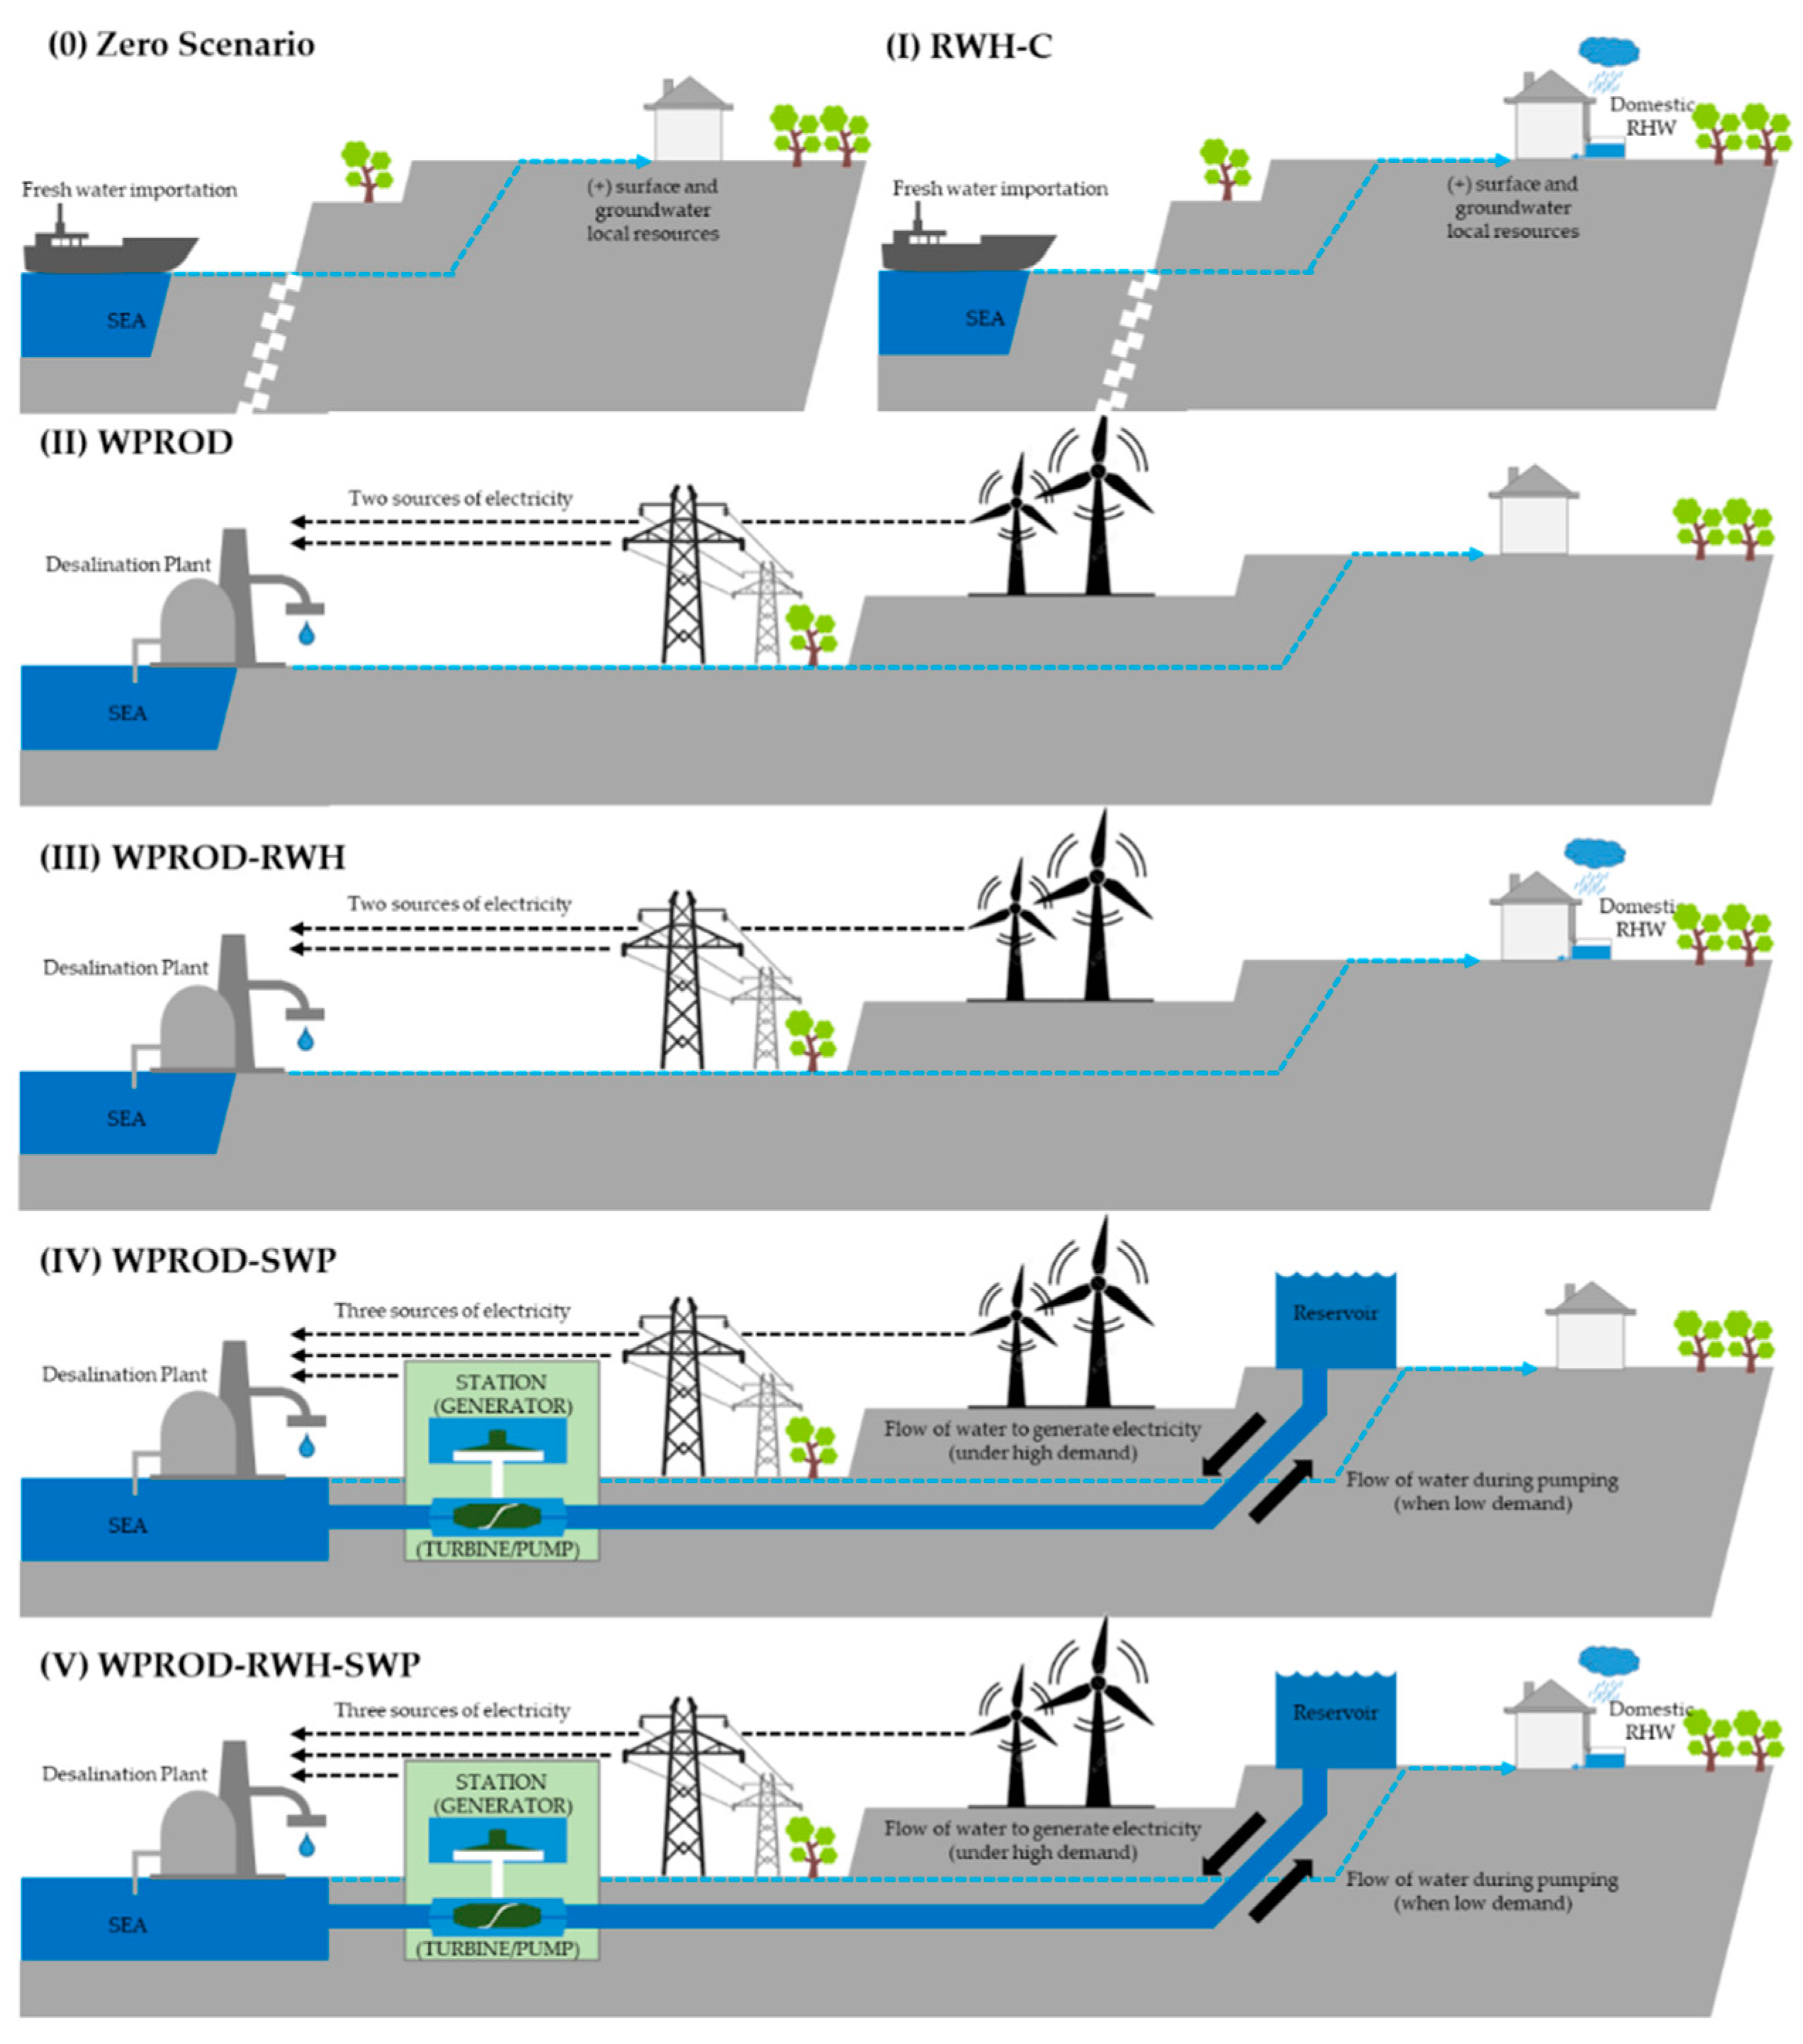
Five different scenarios for meeting water demand for domestic and tourist-related uses at a 99.9% reliability level were developed, implemented and evaluated regarding their overall LCC over an examined lifespan of 30 years. Figure 2 presents a schematic representation of each scenario (I–V).
An average daily consumption of 0.18 m3/cap/d was assumed for the permanent population [8], and 0.20 m3/cap/d was assumed for visitors and tourists. In addition, the number of the permanent residents was considered to increase with an annual rate of 1.5%. Finally, according to local tourism authorities, the number of visitors and tourists per island was assumed to be between five and 15 times the number of permanent residents, distributed during a seven-month period from April to October, varying per month from 5% to 30% of the total number of tourists.
2.2.1. RWH-C
This scenario involves the use of domestic RWH, as a supplementary source of water for meeting specific non-potable needs, combined with the current water supply practices (RWH-C). The objective is to reduce the amount of water transported to the islands and, in this way, to reduce the corresponding costs entailed. RWH systems cannot be considered a realistic solution for visitors and tourists, given the very low precipitation during summer months. Thus, RWH contributes only to the reduction of water supply of the permanent population.
For RWH sizing, the collection area (A) per household was used to quantify the inflow of rainwater to the tank. To determine this value as a function of the number of residents per house, statistical data regarding the household characteristics (i.e., number of households per island, area per capita and residents per household) were acquired by the Hellenic Statistical Authority [48]. The mean unit area per capita (in m2) for each category of household (i.e., households of 1–6 members) was calculated separately for each island. This number varied slightly per island, with values ranging from 31.54 to 34.23 m2. RWH sizing is also controlled by the water demand (D) that the system is designed to meet. Regarding this parameter, fixed values [6] of 15% of the daily water consumption for laundry and 30% for toilet flushing demand, non-fixed values for domestic garden irrigation demand, expressed as a percentage of the daily total water demand—as well as the combinations of them—were examined. The simulation of the inflow, outflow and change in storage capacity of the RWH system was performed using the behavioral model proposed by Jenkins et al. [49], while the yield-after-spillage (YAS) operation rule was implemented using a daily time interval, as follows:
where Y (m3) is the yield from the storage tank during interval t, D (m3) is the water demand during interval t, V (m3) is the volume in store during interval t, and S (m3) is the tank storage capacity.
The daily harvested rainwater volume (runoff), Qt (m3) collected from a roof area was calculated as follows:
where C is the runoff coefficient, A is the rainwater collection area (m2), and Peff,t is the effective rainfall (m) during the time interval t.
Similarly to Londra et al. [6], the rooftop runoff coefficient was assumed equal to 0.9, and the daily effective rainfall (Peff,t) was set equal to the daily rainfall minus a first flush. The latter was introduced so as to take into account the amount of water needed for removing concentrations of dust, leaves and bird droppings from rainfall collection areas and was assumed to be equal to 0.2 mm.
Regarding sizing, this scenario was not designed for a standard target of reliability but for reducing total water needs per household to a certain degree. Thus, in order to select an efficient tank size among the different alternatives, a common rule was followed in all cases; similarly to Domènech and Saurí [50], the most suitable tank was the one at which water savings increased less than 1% after increasing tank size by 1 m3, and this was tested for all water consumption scenarios. Among the different uses examined, the most suitable tank was selected as the one for which the fraction of water saving to tank volume was minimized, setting an upper tank size limit of 30 m3.
2.2.2. WPROD
Under this scenario, the installation and operation of a wind powered reverse osmosis desalination (WPROD) plant was examined, with the aim of meeting water demand of domestic and tourist-related uses for a reliability level of 99.9%. The scenario was based on the operation of a hybrid system, i.e., energy requirements were mainly covered by the wind turbines operation, and, as an additional source, the on-grid power was used when the RES energy was unavailable. The existing infrastructure in the study areas (e.g., water tanks capacity, position and altitudes, pipes drainage capacity) was taken into account for the analysis as well.
Reliability (R) was the objective function (target R = 99.9%) for the determination of the desalination plant maximum capacity (m3/d). Mean annual reliability was calculated as follows:
where R is the reliability, F accounts for the total number of failures, and n is the project lifetime.
Regarding energy requirements for the operation of the desalination plant, the daily energy demand was calculated in order to set a target of at least 80% RES energy supply on a project lifetime basis. Particularly, the RES energy production was based on the wind turbine power coefficient as a function of wind speed, the hours of operation, and the wind turbine’s power curve. Two different types of wind turbine were considered: The Enercon E-53/800, one of a rated power equal to 800 kW, commonly used in small Greek islands, and the E-33/300, in cases when the system’s energy needs were limited. The daily energy production of energy was calculated as follows:
where E is daily energy production (kWh), CP is the performance coefficient, HO are the hours of operation of the power plant (h), N is the number of wind turbines, and p is the power (hp). Daily power was calculated based on the wind turbine power curve provided by the manufacturer (https://www.enercon.de/). For each island, the daily deficit or excess of energy was also determined and used for RES sizing, as well as for the LCC analysis. In case there was a deficit of energy, the RO desalination plant operated by using the local electricity network (on-grid energy). The required energy for the WPROD operation was calculated using a standard energy consumption of 5 kWh/m3 [2,21], and the WPROD system was assumed to be interconnected to the electricity grid of the study area, as shown in Figure 2.
2.2.3. WPROD-RWH
A combined scenario named WPROD-RWH was analyzed in terms of sizing a WPROD system for a lower standard requirement, as a portion of water demand was met by domestic RWH. Similarly to the abovementioned scenarios, the same methodology for each component was followed, as presented in Figure 2.
2.2.4. WPROD-SWP
This WRM scheme incorporated the operation of wind turbines and a seawater pumping (SWP) system for covering energy requirements of the WPROD plant (Figure 2). The system function was based on the principle that when water demand was low and the desalination unit did not operate, seawater pumping was performed, provided that a surplus of wind-powered energy was available. Thus, this scenario involved the sizing of an upper reservoir that was used as a power storage available under high water demand and wind-powered energy deficit. The WPROD plant was designed based on the procedure described in Section 2.2.2. Reservoir capacity was determined as follows:
In case there was energy surplus, seawater was pumped in the reservoir based on Equation (6):
where QP is the amount of water pumped in the reservoir (m3), ES is the energy surplus (kWh), nP is the performance coefficient for the pump, g is the gravity of earth (m/s2), and H is the pressure head (m).
The volume of the reservoir was determined based on Equation (7):
where Vn is the volume of seawater in the reservoir (m3), Vn−1 is the volume of seawater in the reservoir the day-ahead (m3), QP is the seawater pumped for storing energy (m3), and QI is the amount of water used for producing energy. QI was calculated based on Equation (8):
where QI is the seawater used for energy production (m3), Ed is the deficit of energy (kWh), g is the gravity of earth (m/s2), and H is the pressure head (m). The failures and the total energy reliability for the scenario were calculated as well. The reservoir was also designed for covering energy requirements of the RO desalination unit for the same reliability level.
2.2.5. WPROD-RWH-SWP
WPROD-RWH-SWP was the last scenario examined and is similar to the WPROD-SWP. The difference lies on the fact that, under this scenario, the operation of the WPROD plant was based on the energy production of both the wind turbines and the seawater pumping system.
2.3. Life Cycle Cost
The life-cycle cost (LCC) method was used for the economic evaluation of each scenario. Traditionally, LCC is a type of investment calculus used to rank different investment alternatives [51] and has been proven to be an effective tool for environmental decision making [51]. Table 3 presents the values of the parameters used for cost estimation, along with all the details regarding cost assumptions (e.g., [2,23,52,53]), as well as the technical specifications of each proposed investment (e.g., [2,21,23,24]). A range of unit cost values is also provided, when applicable, in order to highlight the uncertainty in cost estimates; values in parenthesis denote the ones adopted for the analysis. For RWH, data were collected from various sources, including personal communication with local technicians along with values from the literature (e.g., [52,53]) and corresponding to the national market prices. For scenarios including desalination, costs were selected taking into account projects of similar scale in Greece. To quantify the difference in the cumulative cost of each scenario per island, the unit LCC (in €/yr) was introduced, calculated by dividing the cumulative LCC with the 30-year lifespan. Finally, water production cost (in €/m3) was also calculated for further evaluation of the examined scenarios.
2.4. Climate Change Scenarios
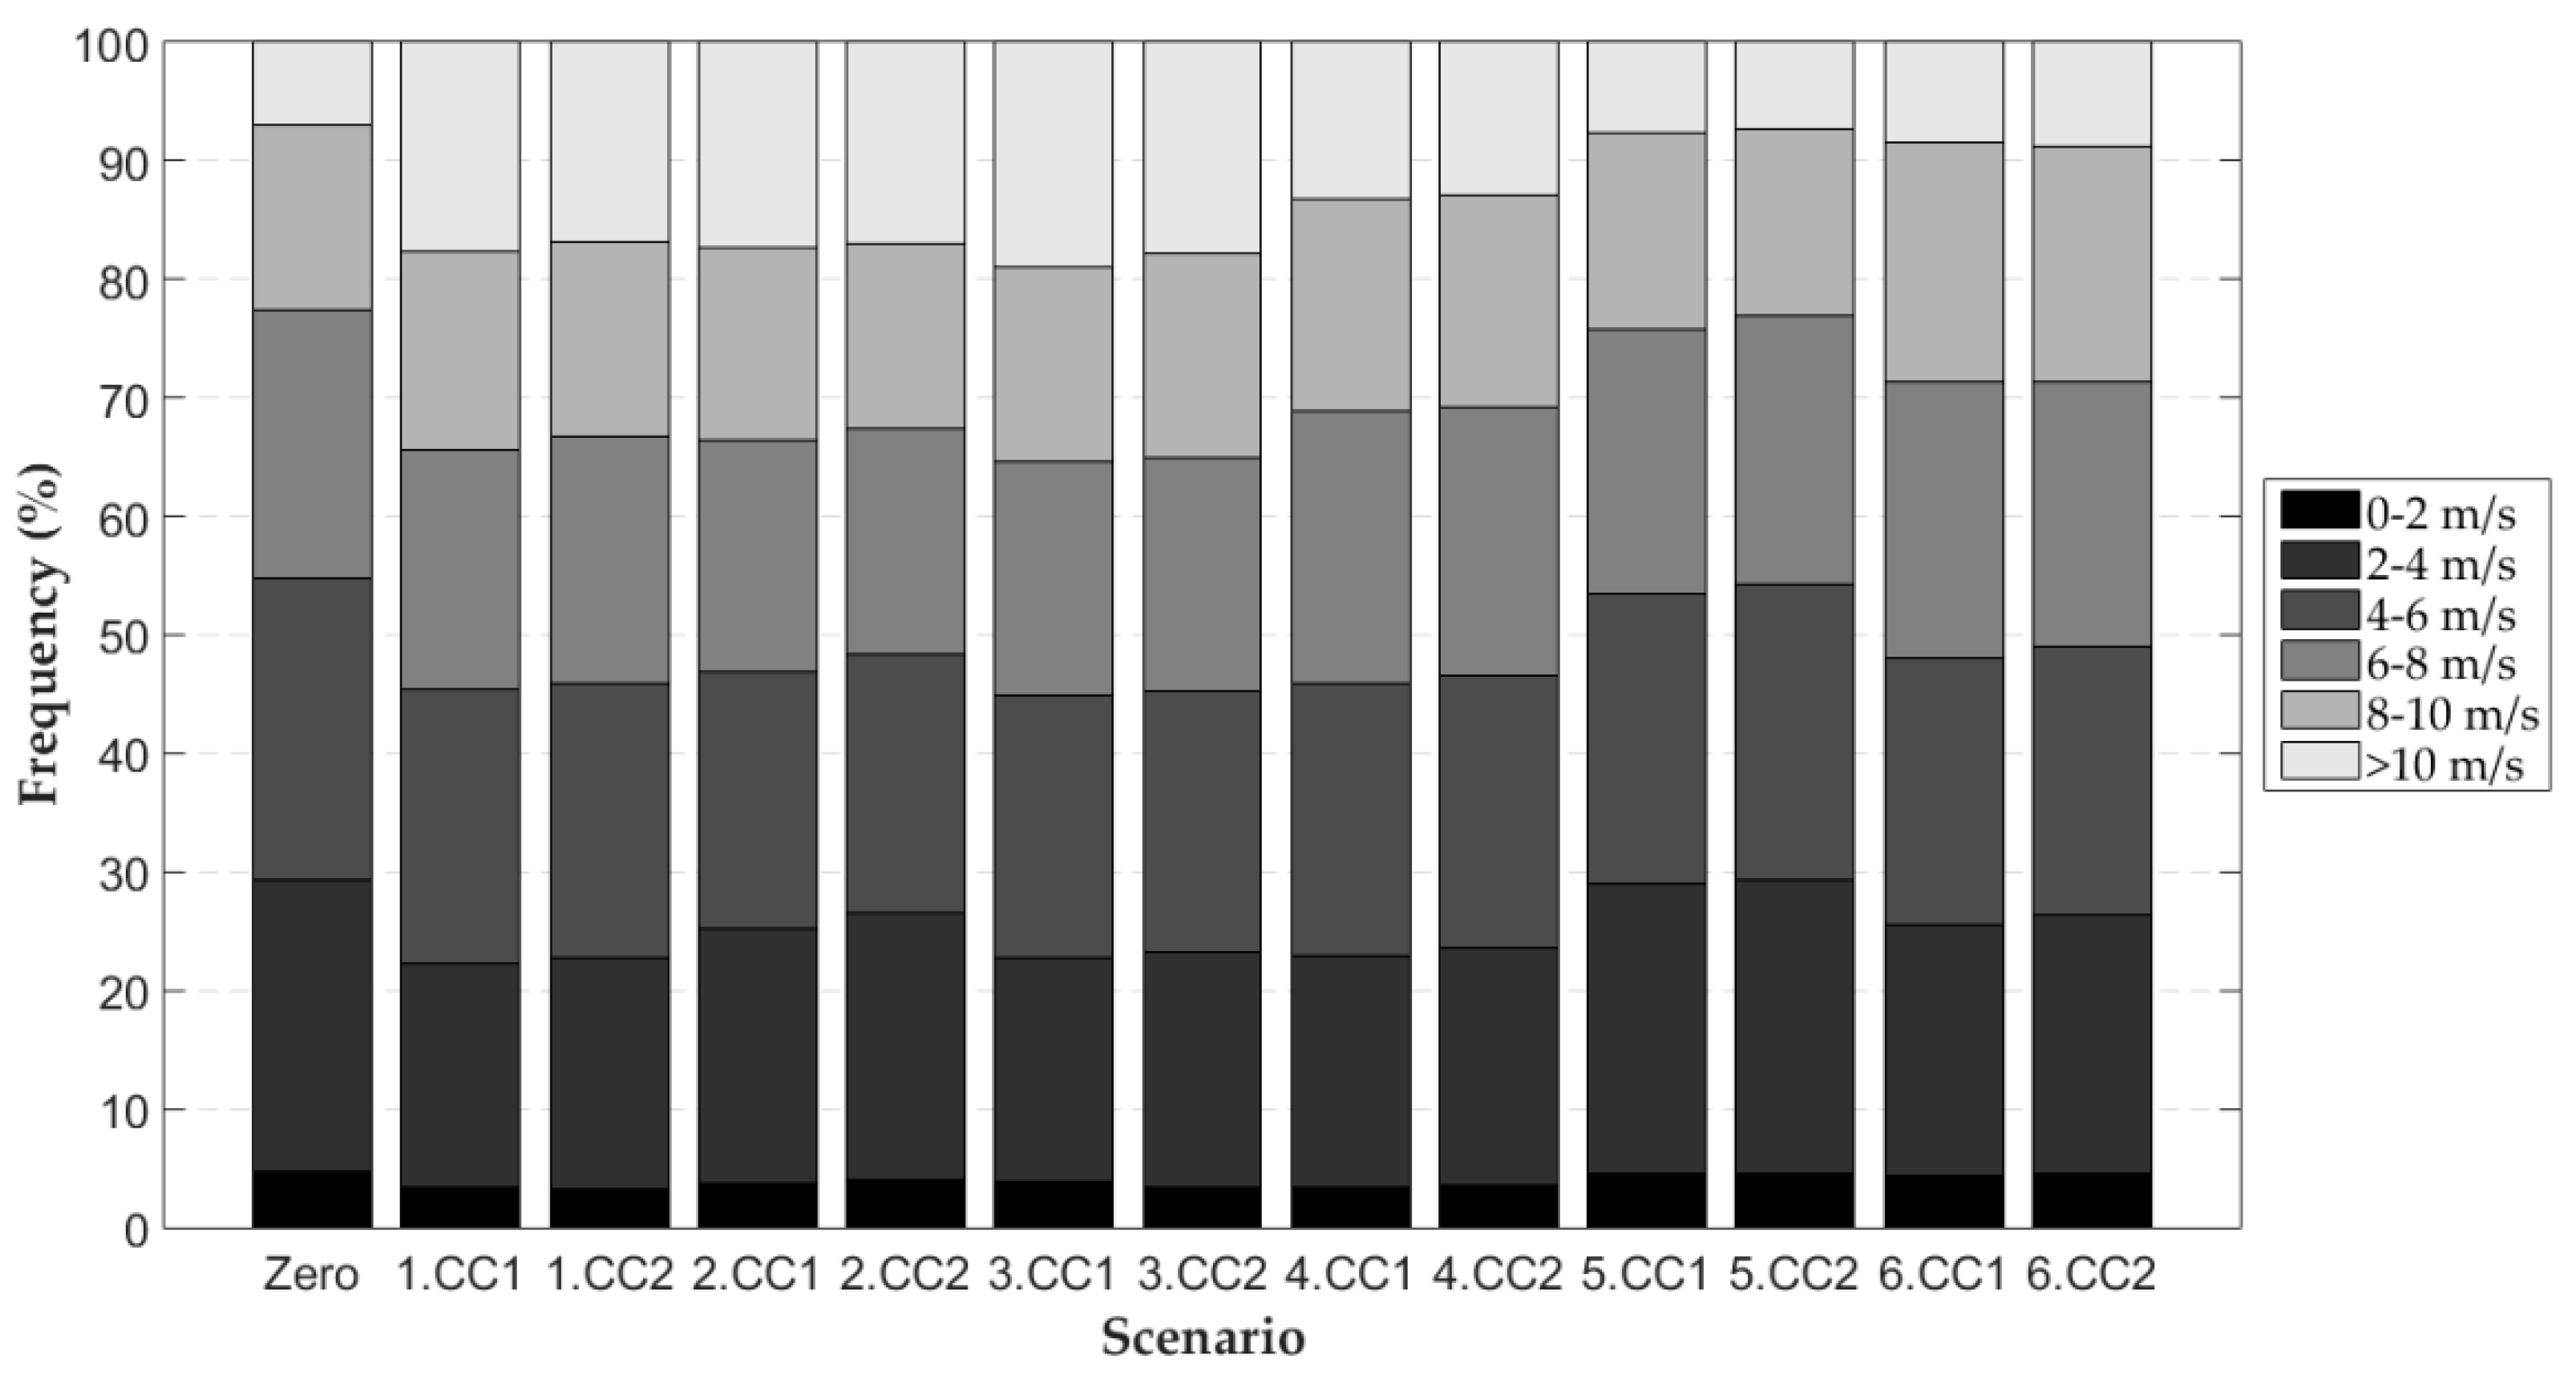
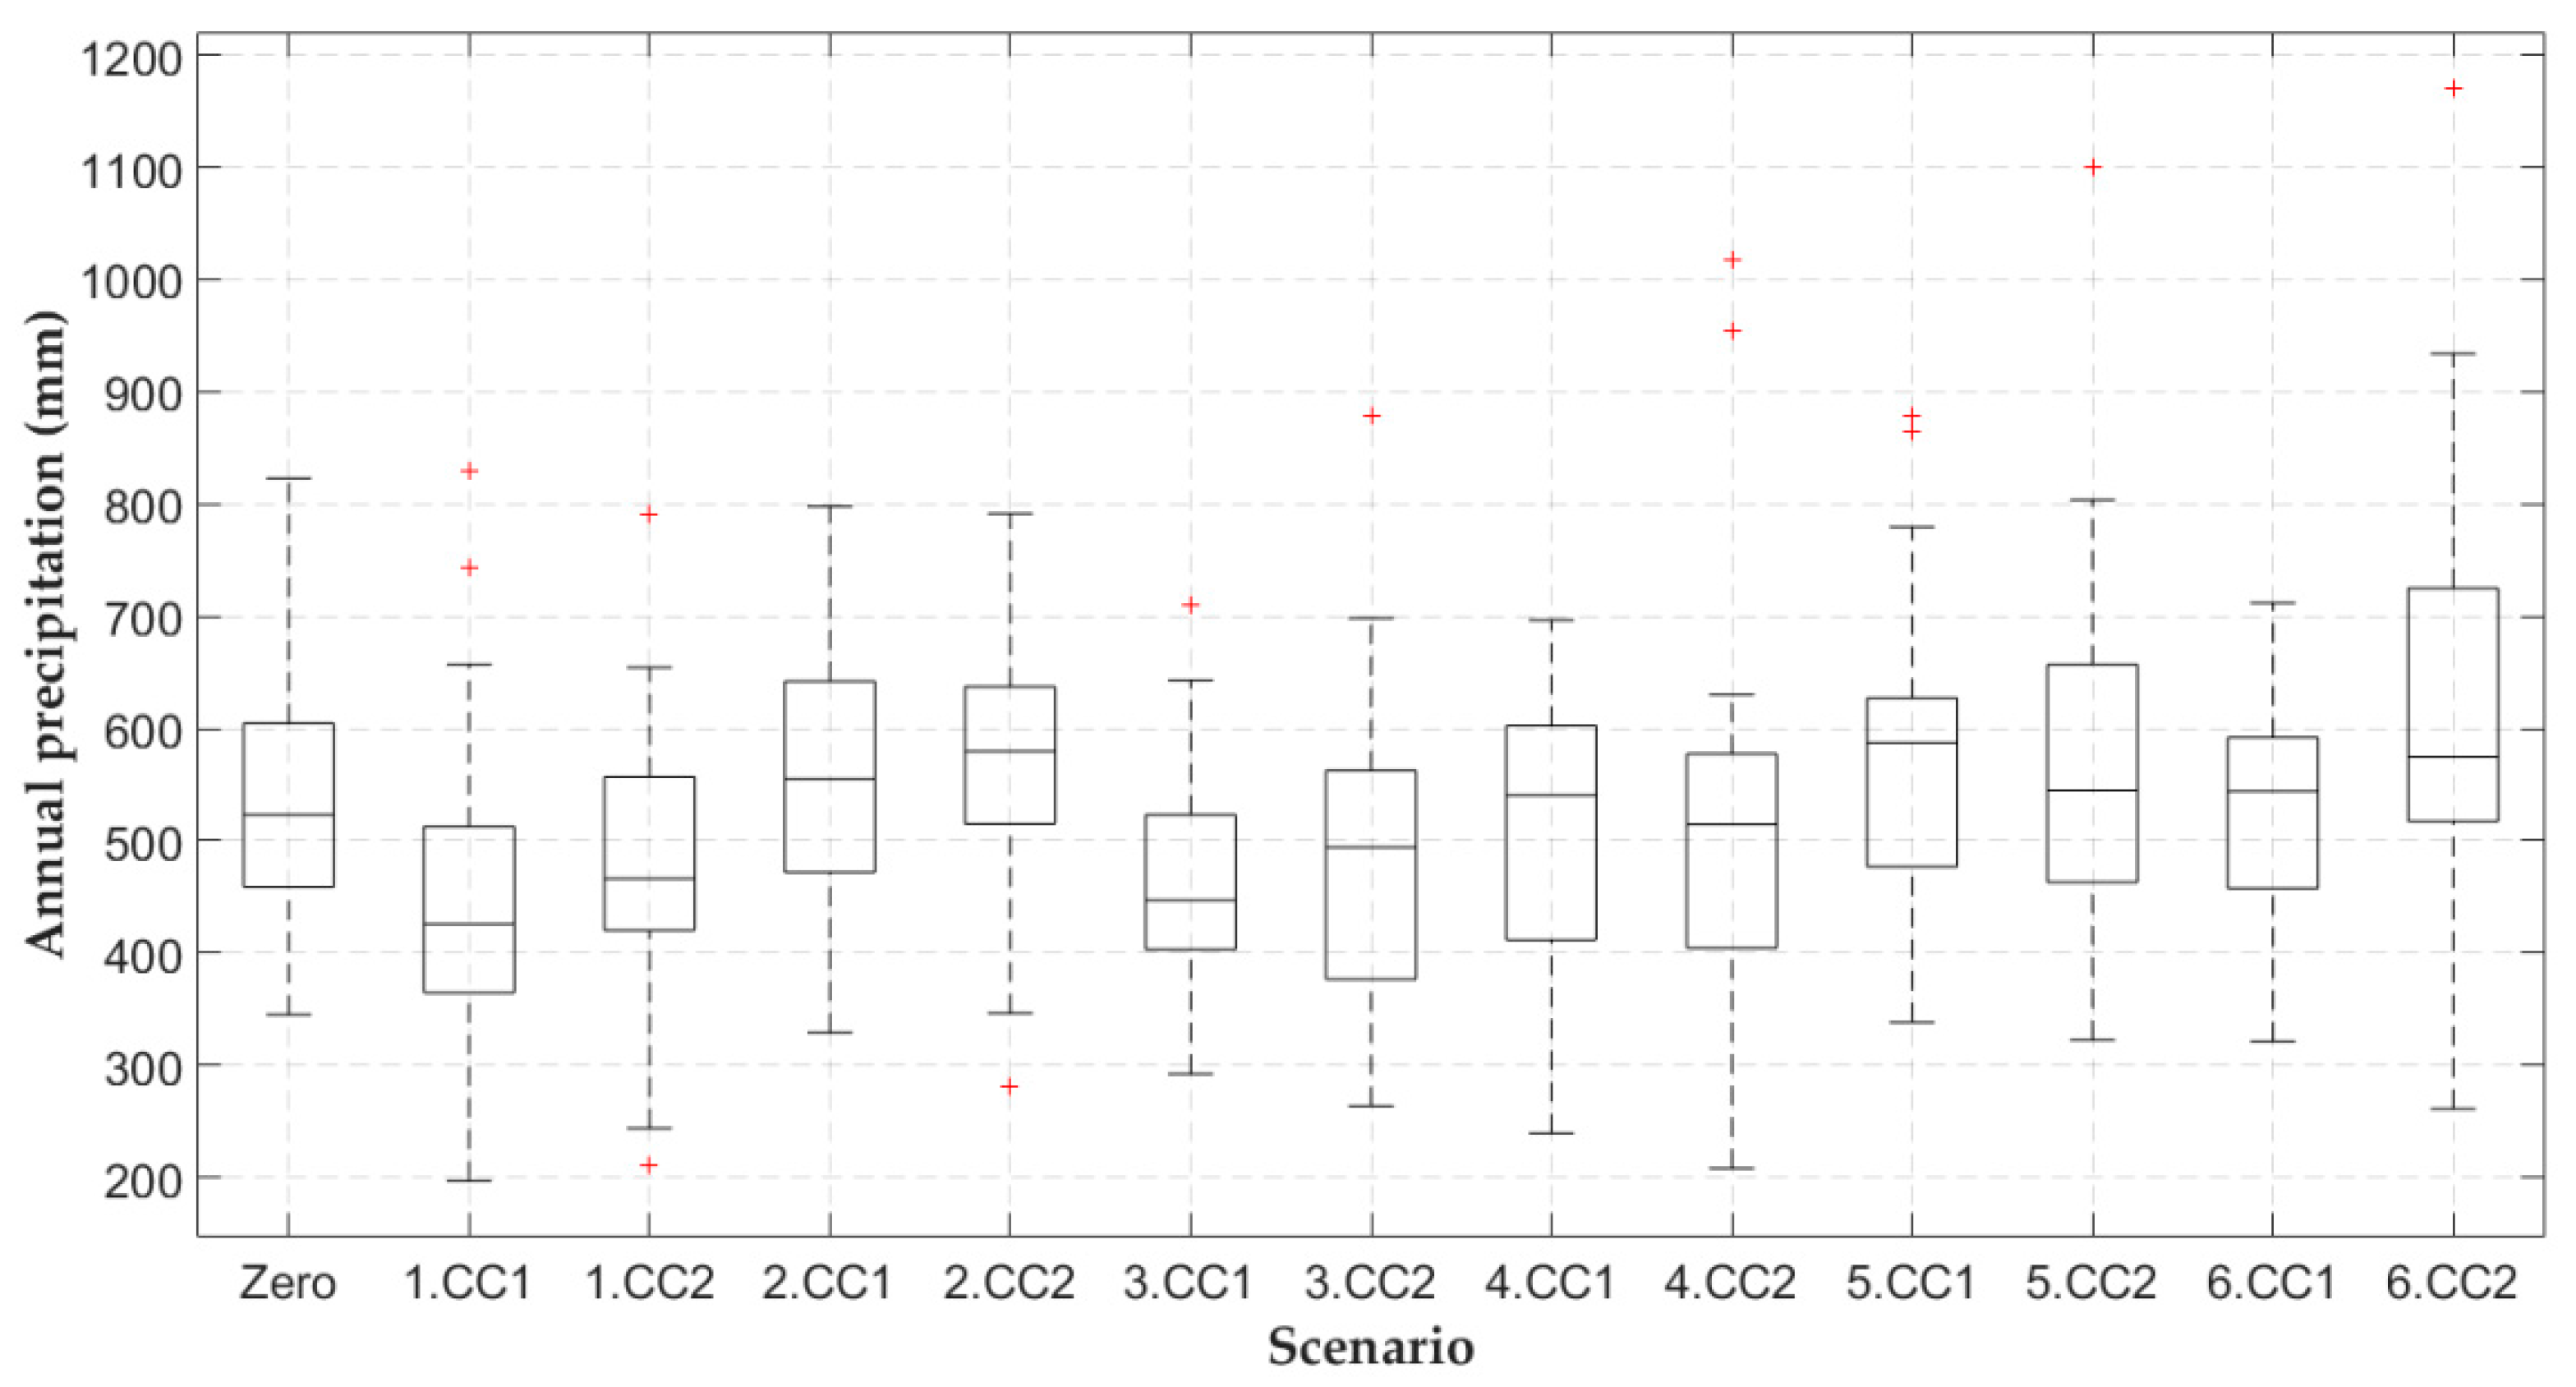
Finally, after the WRM scenarios evaluation under no climate change conditions (zero scenario; Figure 3 and Figure 4, indicatively for Lipsi Island), an assessment regarding lifelong performance under changing climate was undertaken. For this purpose, the freely available data of the Coordinated Regional Downscaling Experiment (CORDEX) research program (http://www.euro-cordex.net/060378/index.php.en), provided by the DEAR-Clima (Data Extraction Application for Regional Climate) were used. The regional climate model (RCM) data (http://meteo3.geo.auth.gr:3838/) have a high spatial resolution (0.11°) over the European domain and are available over the Aegean Sea for a time period from 1950 to 2100. The historical dataset of each experiment refers to the period between 1950 and 2005, while the future projections cover the 2006–2100 period under the influence of the three representative concentration pathways (RCPs) adopted by the Intergovernmental Panel on Climate Change (IPCC) [55] for its fifth assessment report (AR5): RCP2.6, RCP4.5 and RCP8.5. The simulation experiments were products of various regional climate models (RCMs) driven by several global climate model (GCMs). In the present study, the performance of the WRM alternatives was evaluated under six different climatic scenarios for RCP4.5 and RCP8.5, as shown in Table 4.
Figure 3 and Figure 4 present the statistical characteristics for each timeseries: Daily wind speed frequency and distribution of annual precipitation depth, respectively. The zero scenario corresponds to the historic one, while the other 12 timeseries correspond to each climatic scenario, as shown in Table 4. Among all scenarios, wind speed frequencies do not differ significantly between the two emission scenarios, while among the different combinations of RCM-GCM (Table 4; 1–6), a slight variance can be observed. In particular, in 5.CC1 and 5.CC2, there is a clear overestimation of low mean daily wind speed (classes of 0–2 and 2–4 m/s). Regarding precipitation totals, both the median and the range of annual precipitation for the 30-year periods (i.e., 1976–2005 for zero and 2021–2050 for climatic scenarios) are characterized by variability. Finally, only a limited number of RCM-GCM combinations overestimate the annual precipitation (e.g., 5.CC1, 6.CC2).
3. Results
3.1. Implementation of the Scenarios and Performance
Coupling desalination processes with RES or employing more traditional techniques, such as RWH, can be proven to be an effective solution for water supply. Based on the methodology presented in Section 2, five scenarios for meeting water needs in eight remote islands in the Aegean Sea were examined and evaluated. Table 5 presents a summary of the main results for each scenario and for each island separately. Specifically, for the RWH-C scenario, the optimal tank volume (m3) and the range of the daily water needs met (%) are presented. For the other scenarios, which include the operation of desalination plants, the capacity of the plants (in m3/d), the number of wind turbines and the volume of reservoir (m3) required in case of SWP, are shown. As mentioned in the previous section, desalination capacity was designed for a 99.9% reliability level, while, regarding its energy supply, at least 80% was provided by RES.
Under the RWH-C scenario, tank volumes required ranged from 3 m3 (for the one-resident households in Heraklia and Schinoussa) to 25 m3 (for the six-resident households in Megisti). With these tank sizes, the percentage of domestic water needs met lied between 11.6–28.7%. These numbers are particularly low and could be attributed to the low annual precipitation (439–889 mm), as well as, to the rooftop areas of the households (31.5–34.2 m2 per capita). In all cases, the water amount not supplied by RWH would be provided via water transportation by ship and by the limited local water resources (Figure 2). On the other hand, under the WPROD scenario, no water importation would take place. Regarding the design parameters, the capacities of the desalination plants designed varied considerably between 140 and 780 m3/d as a result of the variability in the number of residents and tourists among the islands. For meeting energy demand, the number of wind turbines required ranged from two to five, also depending on the characteristics of each island (Table 5). Under the WPROD-RWH scenario, both the capacity of the desalination and the number of wind turbines used were slightly reduced, compared to the WPROD scenario, as a portion of total water demand was met by the RWH systems. Desalination capacity ranged from 138 to 775 m3/d, while the resulting number of wind turbines was between two and four. A relatively low reduction in desalination capacity was achieved by the incorporation of domestic RWH to the system, lying in the range of 2.63%–0.43%. This slight decrease was expected, as RWH systems were designed with the aim of meeting only the permanent population demand. During summer months, when precipitation was low and water demand was highly increased, the contribution of RWH was insignificant. Thus, in order to meet peak demands, the capacity of the desalination plant needed to remain at the same levels, as in the previous scenario (i.e., WPROD). The fourth alternative examined, WPROD-SWP, aimed at meeting energy requirements by combining the wind turbines with a seawater pumping storage system. Under this scenario, the desalination unit was of equal capacity as in WPROD. However, the number of wind turbines was decreased and lied between one and two. Finally, the capacity of the seawater storage tank ranged from 500 to 27,500 m3. The last examined scenario, named WPROD-RWH-SWP, combined all the aforementioned scenarios. The desalination plant capacity, the number of the wind turbines, the average daily coverage of the RWH tanks and the capacity of the seawater storage reservoirs lied in the range of 138–775 m3/d (same as in the WPROD-RWH scenario), one to two wind turbines (same as in the WPROD-RWH scenario), 0%–55%, and 500–30,000 m3, respectively. The energy reliability of this scenario ranged from 80% to 83%, depending on the examined island.
3.2. Economic Evaluation of the Scenarios
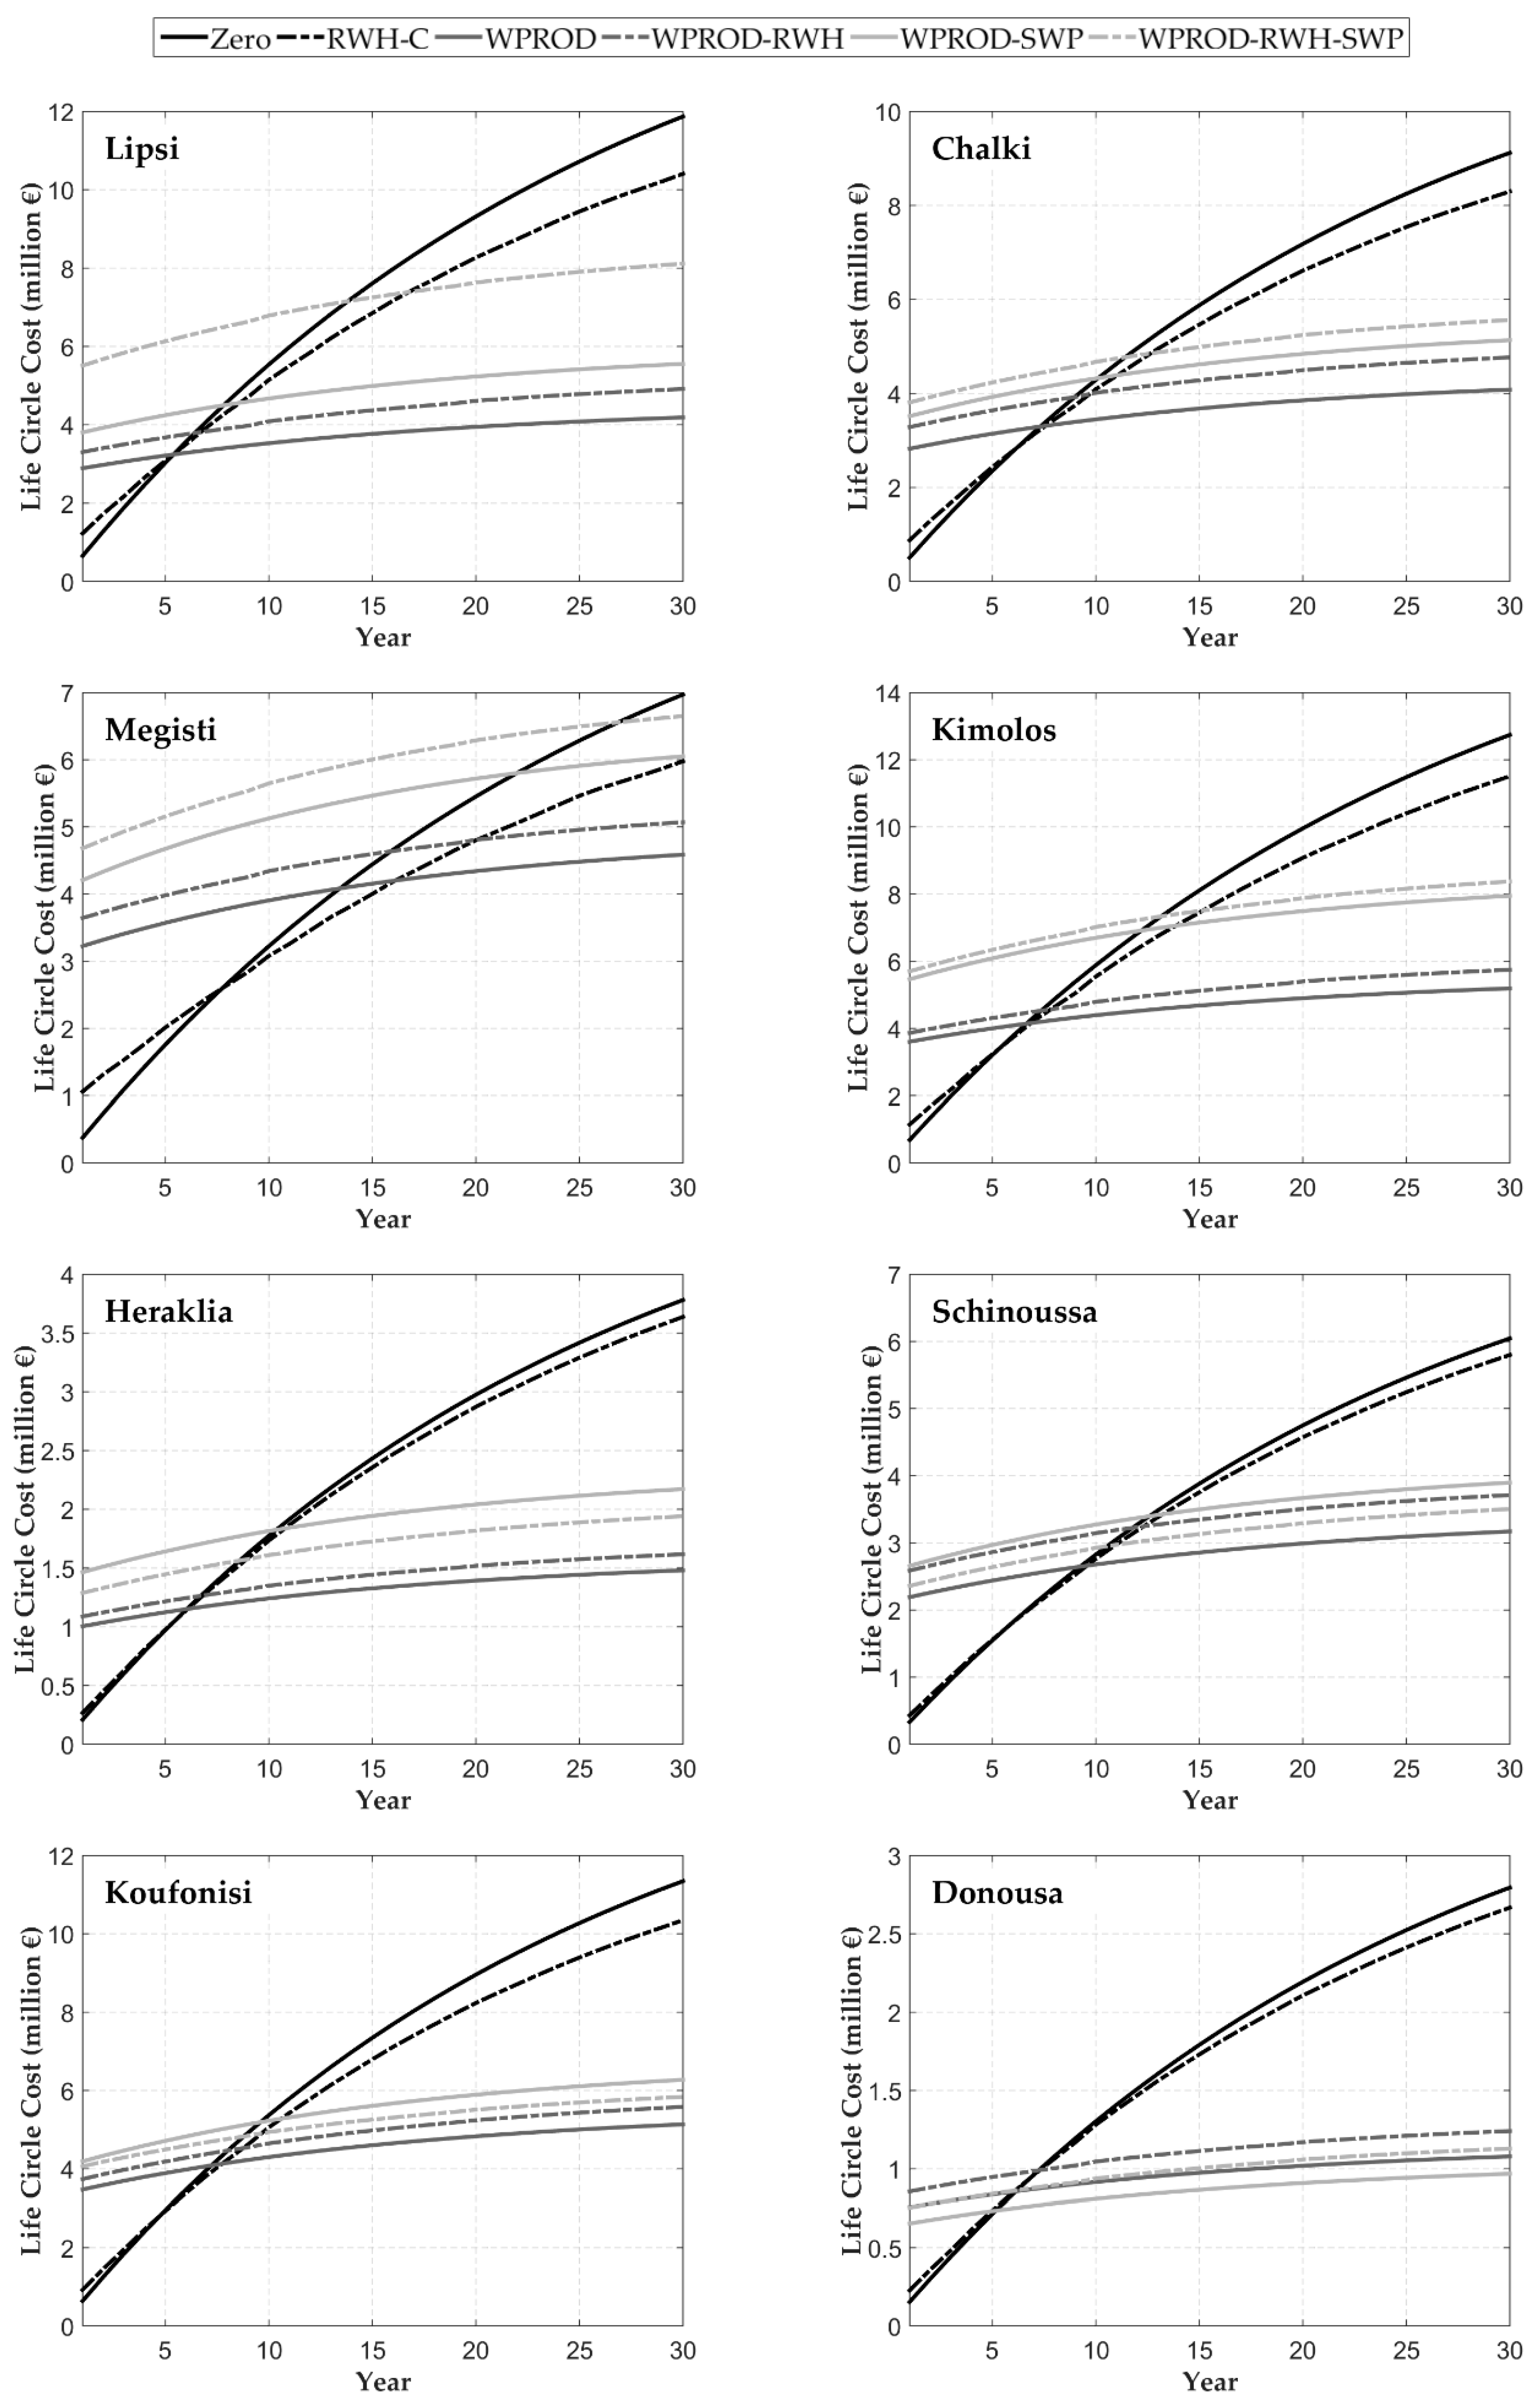
The LCC assessment took place for a project lifespan of 30 years. All the economic details and assumptions regarding the five examined scenarios have been previously presented (Table 3). The LCC for the five alternatives and for each one of the eight islands is presented in Figure 5. WPROD was found to be the most efficient solution from an economic standpoint for all the islands except for Donousa Island. At Donousa, implementation of the WPROD-SWP scenario resulted in the lowest unit cost. Under this scenario, one wind turbine combined with a small reservoir (about 500 m3) was adequate for achieving the RES energy reliability target of 80%. In contrast, under the WPROD scenario, the operation of a single wind turbine led to a reliability slightly lower than the target; thus, the installation of two was required, a fact that resulted in an increase of initial investment cost. The zero scenario, which is linked mainly to water importation, was systematically the worst alternative for all islands, as the mean cost of water transportation is about 11 €/m3 according to the River Basin Management Plan for River Basin District GR14–Aegean Islands, Greece [56]. Table 6 presents unit LCC (€/yr) for all scenarios examined and for each island as an indicative measure to compare alternatives for a standard lifespan. The lifespan LCC for the entire period of the project operation (€/yr) ranged from 32,294 (WPROD-SWP, Donousa Island) to 424,695 €/yr (zero, Kimolos) considering all results. It should be mentioned that environmental and economic benefits from gas reduction produced by the examined approaches and the zero scenario were not taken into account in the present work. Moreover, other costs, such as the noise, visual nuisance and easiness of construction, were not taken into consideration.
Finally, in order to examine the possible range in costs estimated, a further LCC analysis was performed for each study area, assuming both the minimum and maximum unit costs of the investment (Table 3; min–max values). Indicatively for WPROD, it was found that the 30-year cumulative cost can differ from the values presented in Figure 5, as not only the investment, but also the O and M cost per year changes; the maximum reduction in LCC (−40.2%) was found in Heraklia Island, while the maximum increase (+56.8%) was found in Megisti Island. Similarly, under the WPROD-SWP scenario, a maximum reduction of 48.6% and a maximum increase of 59.9% were estimated for Heraklia and Megisti, respectively. Regarding overall results, the average range of the 30-year LCC lied between −44% and +44.6% of the values presented in Figure 5; nevertheless, the corresponding ranking of solutions remains the same.
3.3. Scenarios Performance under Changing Climate
After determining the design parameters and comparing the proposed alternative solutions on an economic basis, a further analysis was conducted in order to assess the potential impact of CC on system performance and thus on water supply of the islands. For this purpose, only the best solution for each island, as determined from the above analysis, was examined, and system operation was simulated using the RCM data for the 2021–2050 period. Given the fact that RWH was not included in any of the selected scenarios, only wind speed datasets were utilized for RES desalination simulation under CC conditions. Based on this fact, a change in the system performance was expressed in terms of change in energy supply reliability using RES, as compared to the reliability level achieved for the particular design (Table 5) under no CC conditions.
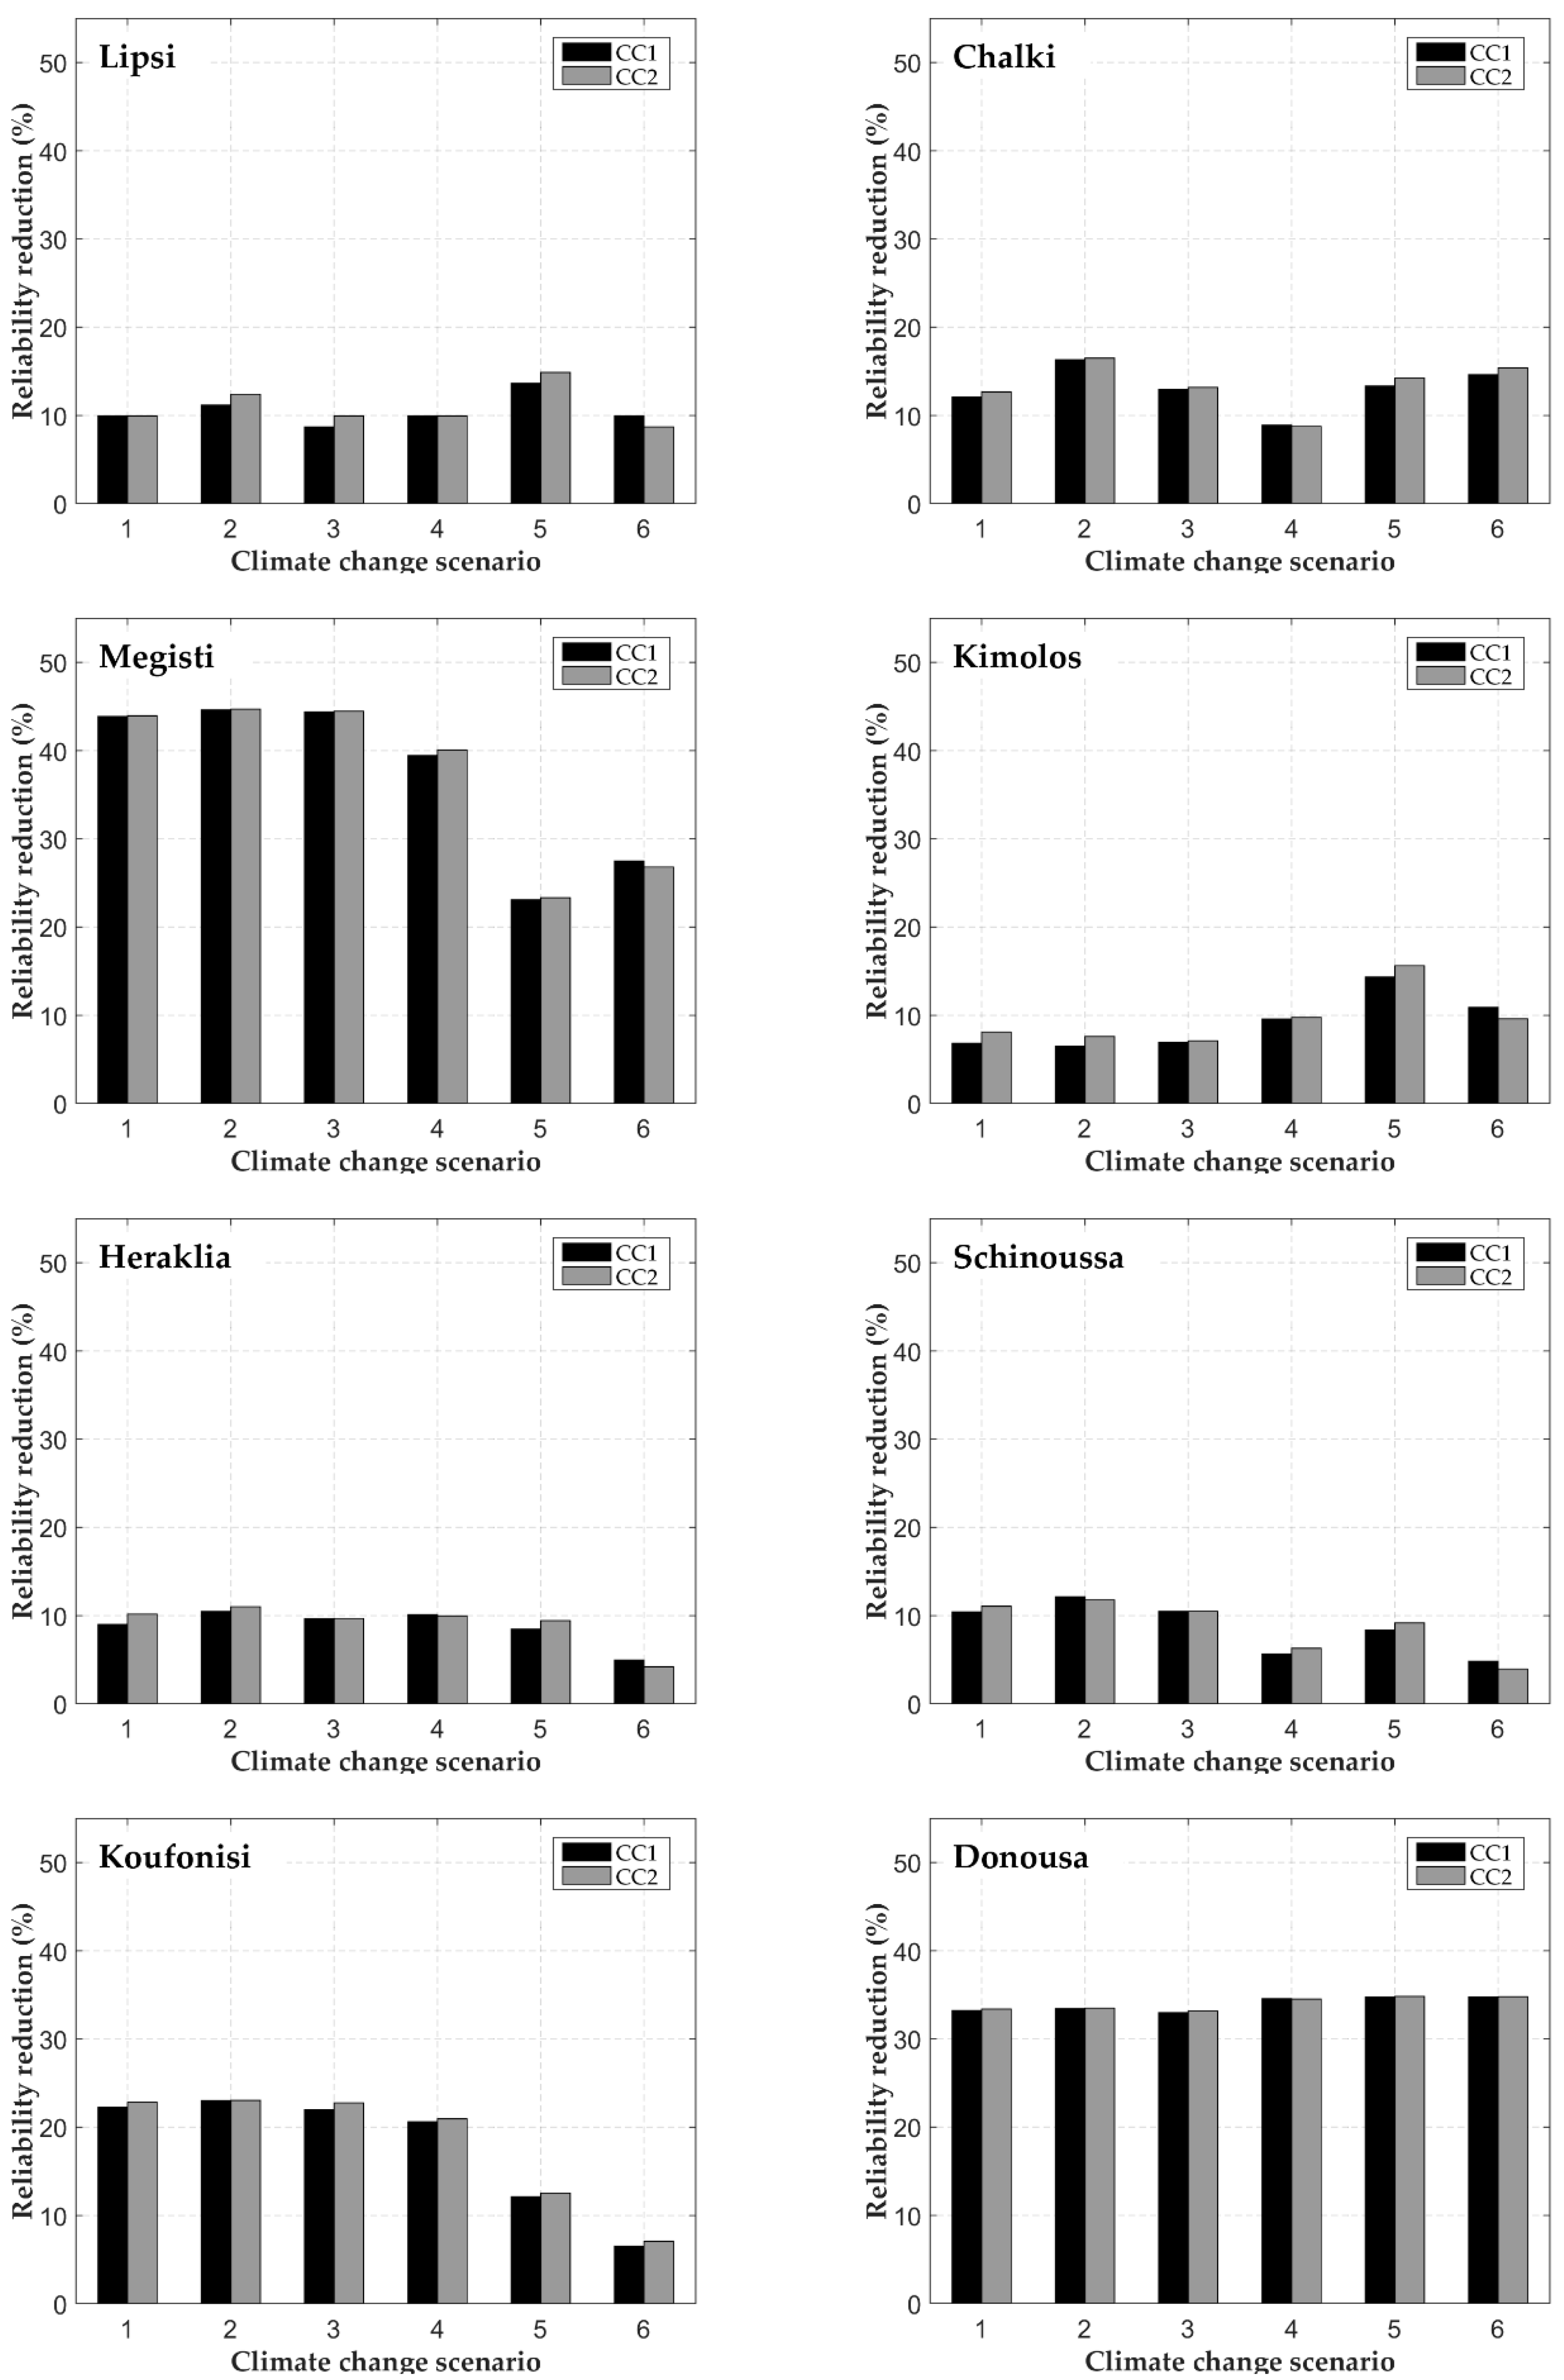
For the best WRM solution, Figure 6 presents the change in the RES-based energy supply reliability under all CC scenarios for each island separately. In all cases, a reduction in the system reliability was noticed. Bars in black represent the percentage reduction in reliability, as resulted from the simulation of the RCP4.5 CC scenarios, while grey bars correspond to RCP8.5. As observed, a reduction in the system reliability level was projected under all CC scenarios. The lowest reduction was observed for the islands of Heraklia and Schinoussa (approximately 5%; Figure 6), while the maximum reduction was found in Megisti, where an initial reliability of approximately 80% decreased by 44%.
In general, the percentage change ranges considerably from island to island but not on an island basis (Figure 6). Megisti and Koufonisi were characterized by the highest variance in reliability percentage change due to CC, with values of 22% and 17%, respectively. Finally, the absolute difference between the initial (RZero) and the resulting mean reliability (RMeanCC) was determined for each island. The highest absolute difference (|RZero - RMeanCC|) could be observed in Donoussa and Megisti islands, which was 30% and 27%, respectively. The average one (11%–14 %) is shown in Koufonisi and Chalki, while the remaining islands were characterized by a mean reduction of about 8%—this was the minimum observed. In general, the relative frequency of the classes of wind speed formulated the resulting RES energy supply reliability.
4. Discussion
Water demand has been steadily increasing in the last decades in small Greek islands [5], mainly as a result of tourism increases. Due to the limited local water resources, current water management practices depend on water importation by ship, a solution that entails significant costs, as validated by the implementation of the Directive 2000/60/EC for the Aegean Islands, Greece [56]. In this frame, five different alternatives for meeting water needs were examined and compared for eight small islands located in the Aegean Sea based on their economic performance.
Domestic RWH can contribute to the reduction of the overall amount needed, but it can only be considered a supplementary source of water. In particular, water savings ranged between 11.6%–28.7% of the daily domestic water demand for the eight islands examined and for the tank capacities selected. In other studies conducted at the regional scale, the potential potable water saving was found to range between 12% and 79% in southeastern Brazil [9], 29.9%–32.3% for high-rise buildings in Australia [57] and 0.27%–19.7% in Jordan [11]. Based on the findings of Londra et al. [6] for the island of Naxos that is located in the Aegean Sea of Greece and is characterized by similar meteorological characteristics with the islands examined in the present study, only 30% of total water needs for a three-resident household could be fully satisfied. However, a tank capacity larger than 50 m3 and a rainfall collection area larger than 150 m2 would be required for this purpose.
On the other hand, desalinated water is a solution which can lead to the water autonomy of the islands, eliminating their dependency from imported water. Many studies have addressed the technical and economic issues of different technologies for powering desalination units [32,58,59,60,61,62]. The investment cost of seawater reverse osmosis desalination plants lies in the range of 900–2500 €/m3/d [28,63]. In the present study, a cost of 2500 €/m3/d was used, given the relatively small capacity of the plants selected in all cases (140–780 m3). The unit production cost of water (including all capital and maintenance costs) [2], reflects the cost (€) required to produce the total quantity of desalted water (m3). According to other researchers (e.g., [2,64]), unit production cost lies between 0.6 and 12 €/m3. Here, it was found to range from 1 to 5 €/m3 in relation to the examined scenario and the characteristics of each island. Among the alternatives, wind-powered desalination was found to be the most cost efficient in seven out of the eight islands. The only exception was the island of Donousa, at which RES desalination combined with sea water pumping for energy storage outperformed.
Overall, water desalination can become a key in meeting the increasing water needs, especially in water-stressed isolated areas with easy access to seawater, such as the small dry islands located in the Aegean Sea. Further, the gradual phasing-in of renewable energy sources to power desalination plants, such as the WPROD, WPROD-RWH, WPROD-SWP and WPROD-SWP-RWH scenarios examined, will help to ensure the long-term sustainability of such projects. At the same time, against the current unsustainable practices, the integration of RES can reduce impact on the environment, as freshwater can be provided without significantly increasing greenhouse gas emissions. In terms of cost, despite the fact that a high initial investment is typically required, funds expended were recouped in all cases examined, with payback periods ranging from five to fifteen years, depending on the technological solution chosen and the characteristics of each island. However, it should be addressed that as the best scenario’s performance under CC revealed a systematic decrease in the reliability of an RES-based supply, a fact that should be taken into account in water resources management in isolated islands.
5. Conclusions
The main objective of this paper was to investigate various water resource management scenarios regarding their performance in meeting fresh water demand. The analysis was carried out in eight small islands of the Aegean Sea, Greece, which face significant water scarcity problems. Most of the examined measures have been proposed or implemented in other similar cases in Greece; however, no previous study has focused on comparing this set of different options and combinations with the aim of determining the optimal one. The examined scenarios refer to five combinations that incorporate current water supply practices, domestic rainwater harvesting systems and desalinated water provided through the operation of wind-powered desalination plants and/or seawater pumping. All scenarios were evaluated for a 30-year lifespan, and an optimal solution was determined for each island, based on a life cycle cost analysis. Finally, the performance of the best solution regarding energy supply reliability was assessed under six climate change scenarios.
Results highlighted that the current water supply practices (mainly water hauling via ships) is neither sustainable nor economical. Among the different alternatives, wind-powered desalination was found to be the most efficient in most of the cases. The LCC analysis revealed that, despite the high initial investment that is typically required, capital return can be achieved after short periods, depending on the design parameters of the system and the characteristics of each island. Additionally, a decrease in the systems’ performance under all CC scenarios and for all islands was found. For the period 2021–2050, a systematic decrease in the scenarios performance, expressed in terms of decrease in renewable energy supply, was observed. The highest percentage reduction was found about 44%. Despite the inherent uncertainty of climate change models, the systematic reduction in RES reliability highlights the necessity of incorporating climate change in the design process of such projects.
The present work reveals that an integrated approach that includes the combination of different alternatives is essential in determining the best course of action for dealing with water resources management problems. In this respect, other potential technological solutions not examined here, such as greywater recycling and wave energy coupled with seawater desalination, need to be included and evaluated in a framework similar to the one presented. The latter, in particular, is a method with significant potential for coastal areas. Furthermore, issues related to environmental impacts and costs need to be assessed and incorporated into the future research.
Author Contributions
Conceptualization, I.M.K., K.G.K. and E.G.F.; methodology, I.M.K., K.G.K. and E.G.F.; software, I.M.K. and K.G.K.; validation, E.G.F. and E.A.B.; investigation, I.M.K., K.G.K. and E.G.F.; resources, E.G.F.; data curation, I.M.K. and K.G.K.; writing—original draft preparation, I.M.K., K.G.K. and E.G.F.; writing—review and editing, E.A.B.; visualization, K.G.K. and E.G.F.; supervision, E.A.B.; project administration, E.A.B.; funding acquisition, I.M.K., K.G.K., E.G.F. and E.A.B.
Funding
This research is co-financed by Greece and the European Union (European Social Fund-ESF) through the Operational Program «Human Resources Development, Education and Lifelong Learning 2014-2020» in the context of the project “Development of a combined rain harvesting and renewable energy-based system for covering domestic and agricultural water requirements in small dry Greek Islands” (MIS 5004775).
Acknowledgments
The authors would like to thank the Hellenic National Meteorological Service and the Institute of Environmental Research and Sustainable Development of the National Observatory of Athens for the provision of the available meteorological data of the stations located in the Aegean Islands. The authors also thank DEAR-Clima for making freely available the timeseries of CORDEX research program. Lastly, the authors acknowledge the anonymous reviewers who have contributed significantly to improving the quality of the paper.
Conflicts of Interest
The funders had no role in the design of the study; in the collection, analyses, or interpretation of data; in the writing of the manuscript, or in the decision to publish the results.
References
- WWAP (UNESCO World Water Assessment Programme). The United Nations World Water Development Report 2019: Leaving No One Behind; UNESCO: Paris, France, 2019; ISBN 978-92-3-100309-7. 2019; Available online: https://unesdoc.unesco.org/ark:/48223/pf0000367306 (accessed on 1 June 2019).
- Caldera, U.; Bogdanov, D.; Breyer, C. Local cost of seawater RO desalination based on solar PV and wind energy: A global estimate. Desalination 2016, 385, 207–216. [Google Scholar] [CrossRef]
- Goal 6. Sustainable Development Knowledge Platform. Available online: https://sustainabledevelopment.un.org/sdg6 (accessed on 21 June 2019).
- Jones, E.; Qadir, M.; van Vliet, M.T.; Smakhtin, V.; Kang, S. The state of desalination and brine production: A global outlook. Sci. Total Environ. 2018. [Google Scholar] [CrossRef] [PubMed]
- Gikas, P.; Tchobanoglous, G. Sustainable use of water in the Aegean Islands. J. Environ. Manag. 2009, 90, 2601–2611. [Google Scholar] [CrossRef] [PubMed]
- Londra, P.A.; Theocharis, A.T.; Baltas, E.; Tsihrintzis, V.A. Optimal sizing of rainwater harvesting tanks for domestic use in Greece. Water Resour. Manag. 2015, 29, 4357–4377. [Google Scholar] [CrossRef]
- Lopes, V.A.R.; Marques, G.F.; Dornelles, F.; Medellin-Azuara, J. Performance of rainwater harvesting systems under scenarios of non-potable water demand and roof area typologies using a stochastic approach. J. Clean. Prod. 2017, 148, 304–313. [Google Scholar] [CrossRef]
- Mimikou, M.A.; Baltas, E.A.; Tsihrintzis, V.A. Hydrology and Water Resource Systems Analysis; Taylor & Francis Group, CRC: Boca Raton, FL, USA, 2016; ISBN 978-1-4665-8130-2. [Google Scholar]
- Ghisi, E.; Bressan, D.L.; Martini, M. Rainwater tank capacity and potential for potable water savings by using rainwater in the residential sector of southeastern Brazil. Build. Environ. 2007, 42, 1654–1666. [Google Scholar] [CrossRef]
- Ward, S.; Memon, F.A.; Butler, D. Rainwater harvesting: Model-based design evaluation. Water Sci. Technol. 2010, 61, 85–96. [Google Scholar] [CrossRef]
- Abdulla, F.A.; Al-Shareef, A.W. Roof rainwater harvesting systems for household water supply in Jordan. Desalination 2009, 243, 195–207. [Google Scholar] [CrossRef]
- Muthukumaran, S.; Baskaran, K.; Sexton, N. Quantification of potable water savings by residential water conservation and reuse—A case study. Resour. Conserv. Recycl. 2011, 55, 945–952. [Google Scholar] [CrossRef]
- Palla, A.; Gnecco, I.; Lanza, L.G.; La Barbera, P. Performance analysis of domestic rainwater harvesting systems under various European climate zones. Resour. Conserv. Recy. 2012, 62, 71–80. [Google Scholar] [CrossRef]
- Jefferson, B.; Laine, A.; Parsons, S.; Stephenson, T.; Judd, S. Technologies for domestic wastewater recycling. Urban Water 2000, 1, 285–292. [Google Scholar] [CrossRef]
- Otterpohl, R.; Albold, A.; Oldenburg, M. Source control in urban sanitation and waste management: Ten systems with reuse of resources. Water Sci. Technol. 1999, 39, 153–160. [Google Scholar] [CrossRef]
- García-Montoya, M.; Bocanegra-Martínez, A.; Nápoles-Rivera, F.; Serna-González, M.; Ponce-Ortega, J.M.; El-Halwagi, M.M. Simultaneous design of water reusing and rainwater harvesting systems in a residential complex. Comput. Chem. Eng. 2015, 76, 104–116. [Google Scholar] [CrossRef]
- Dixon, A.; Butler, D.; Fewkes, A. Water saving potential of domestic water reuse systems using greywater and rainwater in combination. Water Sci. Technol. 1999, 39, 25–32. [Google Scholar] [CrossRef]
- Li, Z.; Boyle, F.; Reynolds, A. Rainwater harvesting and greywater treatment systems for domestic application in Ireland. Desalination 2010, 260, 1–8. [Google Scholar] [CrossRef] [Green Version]
- Mun, J.S.; Han, M.Y. Design and operational parameters of a rooftop rainwater harvesting system: Definition, sensitivity and verification. J. Environ. Manag. 2012, 93, 147–153. [Google Scholar] [CrossRef]
- Santos, C.; Taveira-Pinto, F. Analysis of different criteria to size rainwater storage tanks using detailed methods. Resour. Conserv. Recycl. 2013, 71, 1–6. [Google Scholar] [CrossRef]
- Devkota, J.; Schlachter, H.; Apul, D. Life cycle based evaluation of harvested rainwater use in toilets and for irrigation. J. Clean. Prod. 2015, 95, 311–321. [Google Scholar] [CrossRef]
- Pinto, F.S.; Marques, R.C. Desalination projects economic feasibility: A standardization of cost determinants. Renew. Sustain. Energy Rev. 2017, 78, 904–915. [Google Scholar] [CrossRef]
- Garcia-Rodriguez, L.; Romero-Ternero, V.; Gómez-Camacho, C. Economic analysis of wind-powered desalination. Desalination 2001, 1–3, 259–265. [Google Scholar] [CrossRef]
- Espino, T.; Peñate, B.; Piernavieja, G.; Herold, D.; Neskakis, A. Optimised desalination of seawater by a PV powered reverse osmosis plant for a decentralised coastal water supply. Desalination 2003, 156, 349–350. [Google Scholar] [CrossRef]
- García-Rodríguez, L. Renewable energy applications in desalination: State of the art. Sol. Energy 2003, 75, 381–393. [Google Scholar] [CrossRef]
- Alkaisi, A.; Mossad, R.; Sharifian-Barforoush, A. A Review of the Water Desalination Systems Integrated with Renewable Energy. Energy Procedia 2017, 110, 268–274. [Google Scholar] [CrossRef]
- Gude, G. Renewable Energy Powered Desalination Handbook: Application and Thermodynamics; Butterworth-Heinemann: Oxford, UK, 2018; ISBN 978-0-12-815428-1. [Google Scholar]
- Ghaffour, N.; Missimer, T.M.; Amy, G.L. Technical review and evaluation of the economics of water desalination: Current and future challenges for better water supply sustainability. Desalination 2013, 309, 197–207. [Google Scholar] [CrossRef] [Green Version]
- Bertsiou, M.; Feloni, E.G.; Baltas, E. Cost-benefit analysis for a Hybrid renewable energy system in Fournoi island. In Proceedings of the Sixth International Conference on Environmental Management, Engineering, Planning and Economics (CEMEPE) and to the SECOTOX Conference, Thessaloniki, Greece, 25–30 June 2017. [Google Scholar]
- Burn, S.; Hoang, M.; Zarzo, D.; Olewniak, F.; Campos, E.; Bolto, B.; Barron, O. Desalination techniques—A review of the opportunities for desalination in agriculture. Desalination 2015, 364, 2–16. [Google Scholar] [CrossRef]
- Zejli, D.; Benchrifa, R.; Bennouna, A.; Zazi, K. Economic analysis of wind-powered desalination in the south of Morocco. Desalination 2004, 165, 219–230. [Google Scholar] [CrossRef]
- Koroneos, C.; Dompros, A.; Roumbas, G. Renewable energy driven desalination systems modelling. J. Clean. Prod. 2007, 15, 449–464. [Google Scholar] [CrossRef]
- Gude, V.G.; Nirmalakhandan, N.; Deng, S. Renewable and sustainable approaches for desalination. Renew. Sustain. Energy Rev. 2010, 14, 2641–2654. [Google Scholar] [CrossRef]
- Novosel, T.; Ćosić, B.; Pukšec, T.; Krajačić, G.; Duić, N.; Mathiesen, B.V.; Lund, H.; Mustafa, M. Integration of renewables and reverse osmosis desalination–Case study for the Jordanian energy system with a high share of wind and photovoltaics. Energy 2015, 92, 270–278. [Google Scholar] [CrossRef]
- García Latorre, F.J.; Pérez Báez, S.O.; Gómez Gotor, A. Energy performance of a reverse osmosis desalination plant operating with variable pressure and flow. Desalination 2015, 366, 146–153. [Google Scholar] [CrossRef]
- Shatat, M.; Worall, M.; Riffat, S. Opportunities for solar water desalination worldwide: Review. Sustain. Cities Soc. 2013, 9, 67–80. [Google Scholar] [CrossRef]
- Ma, Q.; Lu, H. Wind energy technologies integrated with desalination systems: Review and state-of-the-art. Desalination 2011, 277, 274–280. [Google Scholar] [CrossRef]
- OES Annual Report 2017|OES–Ocean Energy Systems. 2017. Available online: https://report2017.ocean-energy-systems.org/ (accessed on 21 July 2019).
- Leijon, J.; Boström, C. Freshwater production from the motion of ocean waves—A review. Desalination 2018, 435, 161–171. [Google Scholar] [CrossRef]
- Corsini, A.; Tortora, E.; Cima, E. Preliminary Assessment of Wave Energy Use in an Off-grid Minor Island Desalination Plant. Energy Procedia 2015, 82, 789–796. [Google Scholar] [CrossRef] [Green Version]
- Pina, A.; Ioakimidis, C.S.; Ferrao, P. Economic modeling of a seawater pumped-storage system in the context of São Miguel. In Proceedings of the 2008 IEEE International Conference on Sustainable Energy Technologies, Singapore, 24–27 November 2008; pp. 707–712. [Google Scholar]
- McLean, E.; Kearney, D. An Evaluation of Seawater Pumped Hydro Storage for Regulating the Export of Renewable Energy to the National Grid. Energy Procedia 2014, 46, 152–160. [Google Scholar] [CrossRef] [Green Version]
- Katsaprakakis, D.A.; Christakis, D.G.; Stefanakis, I.; Spanos, P.; Stefanakis, N. Technical details regarding the design, the construction and the operation of seawater pumped storage systems. Energy 2013, 55, 619–630. [Google Scholar] [CrossRef]
- Katsaprakakis, D.A.; Christakis, D.G. Seawater pumped storage systems and offshore wind parks in islands with low onshore wind potential. A fundamental case study. Energy 2014, 66, 470–486. [Google Scholar] [CrossRef]
- Ioakimidis, C.S.; Genikomsakis, K.N. Introduction of Plug-in Hybrid Electric Vehicles in an Isolated Island System: Advances in Building Energy Research: Volume 12, No 1. Available online: https://www.tandfonline.com/doi/full/10.1080/17512549.2017.1314833?scroll=top&needAccess=true (accessed on 22 June 2019).
- Hessami, M.A.; Bowly, D.R. Economic feasibility and optimisation of an energy storage system for Portland Wind Farm (Victoria, Australia). Appl. Energy 2011, 88, 2755–2763. [Google Scholar] [CrossRef]
- Segurado, R.; Madeira, J.F.A.; Costa, M.; Duić, N.; Carvalho, M.G. Optimization of a wind powered desalination and pumped hydro storage system. Appl. Energy 2016, 177, 487–499. [Google Scholar] [CrossRef] [Green Version]
- Hellenic Statistical Authority (ELSTAT). Available online: http://www.statistics.gr/ (accessed on 22 June 2019).
- Jenkins, D.; Pearson, F. Feasibility of Rainwater Collection Systems in California; California University: Oakland, CA, USA, 1978. [Google Scholar]
- Domènech, L.; Saurí, D. A comparative appraisal of the use of rainwater harvesting in single and multi-family buildings of the Metropolitan Area of Barcelona (Spain): Social experience, drinking water savings and economic costs. J. Clean. Prod. 2011, 19, 598–608. [Google Scholar] [CrossRef]
- Gluch, P.; Baumann, H. The life cycle costing (LCC) approach: A conceptual discussion of its usefulness for environmental decision-making. Build. Environ. 2004, 39, 571–580. [Google Scholar] [CrossRef]
- Tam, V.W.Y.; Tam, L.; Zeng, S.X. Cost effectiveness and tradeoff on the use of rainwater tank: An empirical study in Australian residential decision-making. Resour. Conserv. Recycl. 2010, 54, 178–186. [Google Scholar] [CrossRef]
- Koumoura, K.A.; Feloni, E.G.; Londra, P.A.; Baltas, E.A.; Tsihrintzis, V.A. Uncertainty analysis in sizing rainwater harvesting tanks in an isolated island with limited water resources. Glob. NEST J. 2018, 20, 534–540. [Google Scholar]
- Agence internationale de l’énergie; Organisation de coopération et de développement économiques. Energy Technology Perspectives: Scenarios & Strategies to 2050: In Support of the G8 Plan of Action; OECD/IEA: Paris, France, 2006; ISBN 978-92-64-10982-7. [Google Scholar]
- Intergovernmental Panel on Climate Change (IPCC). Climate Change 2013: The Physical Science Basis, Contribution of Working Group I to the Fifth Assessment Report of the Intergovernmental Panel on Climate Change; Cambridge University Press: Cambridge, UK, 2013. [Google Scholar]
- RBMP-GR14. River Basin Management Plan for River Basin District GR14–Aegean Islands, Greece. Report In Greek. Approved in 2015 according to the requirements of the Framework Directive 2000/60/EC. 2015. Available online: http://wfdver.ypeka.gr/el/project/gr14-00-approved-legislation-fek-gr/ (accessed on 28 July 2018).
- Zhang, Y.; Chen, D.; Chen, L.; Ashbolt, S. Potential for rainwater use in high-rise buildings in Australian cities. J. Environ. Manag. 2009, 91, 222–226. [Google Scholar] [CrossRef] [PubMed]
- Voivontas, D.; Arampatzis, G.; Manoli, E.; Karavitis, C.; Assimacopoulos, D. Water supply modeling towards sustainable environmental management in small islands: The case of Paros, Greece. Desalination 2003, 156, 127–135. [Google Scholar] [CrossRef]
- Raluy, R.G.; Serra, L.; Uche, J.; Valero, A. Life-cycle assessment of desalination technologies integrated with energy production systems. Desalination 2004, 167, 445–458. [Google Scholar] [CrossRef]
- Kaldellis, J.K.; Kavadias, K.A.; Kondili, E. Energy and clean water coproduction in remote islands to face the intermittent character of wind energy. Int. J. Glob. Energy Issues 2006, 25, 298–312. [Google Scholar] [CrossRef]
- Shahabi, M.P.; McHugh, A.; Anda, M.; Ho, G. Environmental life cycle assessment of seawater reverse osmosis desalination plant powered by renewable energy. Renew. Energy 2014, 67, 53–58. [Google Scholar] [CrossRef]
- Jia, X.; Klemeš, J.J.; Varbanov, P.S.; Wan Alwi, S.R. Analyzing the Energy Consumption, GHG Emission, and Cost of Seawater Desalination in China. Energies 2019, 12, 463. [Google Scholar] [CrossRef]
- Voivontas, D.; Misirlis, K.; Manoli, E.; Arampatzis, G.; Assimacopoulos, D. A tool for the design of desalination plants powered by renewable energies. Desalination 2001, 133, 175–198. [Google Scholar] [CrossRef]
- Kaldellis, J.K.; Kondili, E.M. The water shortage problem in the Aegean archipelago islands: Cost-effective desalination prospects. Desalination 2007, 216, 123–138. [Google Scholar] [CrossRef]
Figure 1.
Map of the study area. White circles indicate the location of each island.

Figure 2.
Schematic representation of water resources management scenarios.

Figure 3.
Wind speed frequency under all examined scenarios for Lipsi Island.

Figure 4.
Boxplots for annual precipitation depth under all examined scenarios for Lipsi Island.

Figure 5.
LCC analysis for all examined scenarios.

Figure 6.
Reduction in renewable energy reliability under climate change (CC) for the best water resources management (WRM) scenario per island.
Figure 6.
Reduction in renewable energy reliability under climate change (CC) for the best water resources management (WRM) scenario per island.


Table 1.
Volume of freshwater shipped to selected Greek islands of the Aegean Sea during 2010–2014 1.
Table 1.
Volume of freshwater shipped to selected Greek islands of the Aegean Sea during 2010–2014 1.
| Island | Fresh Water Quantity Imported Per Year (m3/yr) | ||||
|---|---|---|---|---|---|
| 2010 | 2011 | 2012 | 2013 | 2014 | |
| Lipsi | 55,992 | 53,934 | 69,669 | 53,707 | 16,641 |
| Chalki | 54,381 | 48,555 | 47,711 | 48,560 | 2816 |
| Megisti | 37,688 | 15,444 | 24,647 | 36,347 | 23,992 |
| Kimolos | 46,488 | 46,602 | 48,107 | 52,027 | 55,340 |
| Heraklia | 16,190 | 16,839 | 17,245 | 17,298 | 14,714 |
| Schinoussa | 28,766 | 27,054 | 17,394 | 35,309 | 19,938 |
| Koufonisi | 49,372 | 51,614 | 53,101 | 56,461 | 51,117 |
| Donousa | 15,383 | 11,781 | 8296 | 12,602 | 10,386 |
1 Data provided by the technical report on the Directive 2000/60/EC implementation for the River Basin District (RBD) GR14 of Greece.
Table 2.
Characteristics of the eight islands.
| Name of the Island | Lat. | Lon. | Area (km2) | Elevation (m) | Population (2011 Census) | Mean Annual Precipitation (mm) | Average Quantity of Water Being Transported (m3) |
|---|---|---|---|---|---|---|---|
| Dodecanese complex | |||||||
| Lipsi | 37.301 | 26.681 | 15.84 | 277 | 790 | 576 | 49,989 |
| Chalki | 36.222 | 27.602 | 26.99 | 593 | 478 | 889 | 40,405 |
| Megisti | 36.150 | 29.584 | 9.11 | 273 | 492 | 858 | 27,624 |
| Cyclades complex | |||||||
| Kimolos | 36.793 | 24.556 | 37.43 | 364 | 910 | 439 | 49,713 |
| Heraklia | 36.845 | 25.378 | 18.08 | 419 | 141 | 445 | 16,457 |
| Schinoussa | 36.871 | 25.506 | 8.14 | 133 | 227 | 448 | 25,692 |
| Koufonisi | 36.934 | 25.570 | 5.77 | 107 | 391 | 452 | 52,333 |
| Donoussa | 37.100 | 25.786 | 13.65 | 385 | 167 | 483 | 11,690 |
Table 3.
Investment and operation costs.
| Investment | Category | Price/Value | Units | Reference |
|---|---|---|---|---|
| RWH | Tank (10–30 m3) | 1320–4050 | € | Market prices (as a function of the tank size) |
| Pump | 200 | € | [53] | |
| Water distribution system | 170 | € | ||
| Filters | 160 | € | ||
| First Flushing Separator | 100 | € | ||
| Backflow prevention device | 120 | € | ||
| Operation and maintenance | 0.05 | €/m3 | [52] | |
| Additional Maintenance | 20 | €/yr | ||
| Pump replacement | 10 | yrs | - | |
| Discount rate | 6 | % | - | |
| RO Desalination plant | Investment | 900–2500 (2500) | €/m3/d | [23,26] |
| Operation and maintenance | 4% of investment | € | [2] | |
| Discount rate | 6 | % | - | |
| Taxes | 24 | % | - | |
| Wind Turbines | Investment | 800–1500 (800) | €/kW | [2,54] |
| Operation and maintenance | 2% of investment | € | ||
| Discount rate | 6 | % | - | |
| Taxes | 24 | % | - | |
| SWP | Investment | 500–2000 (1100) | €/kW | [42,45] |
| Operation and maintenance | 2% of investment | € | ||
| Discount rate | 6 | % | - | |
| Taxes | 24 | % | - |
Table 4.
Climatic scenarios.
| Regional Climate Model | Global Climate Model | Timeseries for RCP4.5 | Timeseries for RCP8.5 |
|---|---|---|---|
| CLMcom-CCLM4-8-17 | CNRM-CERFACS-CNRM-CM5 | 1.CC1 | 1.CC2 |
| CLMcom-CCLM4-8-17 | MOHC-HadGEM2-ES | 2.CC1 | 2.CC2 |
| CLMcom-CCLM4-8-17 | MPI-M-MPI-ESM-LR | 3.CC1 | 3.CC2 |
| MPI-CSC-REMO2009 | MPI-M-MPI-ESM-LR | 4.CC1 | 4.CC2 |
| SMHI-RCA4 | CNRM-CERFACS-CNRM-CM5 | 5.CC1 | 5.CC2 |
| SMHI-RCA4 | MOHC-HadGEM2-ES | 6.CC1 | 6.CC2 |
Table 5.
Design parameters for each scenario.
| Scenario | Zero | RWH-C | WPROD | WPROD-SWP | WPROD-RWH | WPROD-RWH-SWP | |||||
|---|---|---|---|---|---|---|---|---|---|---|---|
| Water Saved Per Year (%/cap) | Optimal Tank Volume (m3) | Number of Wind Turbine(s) | Desalination Capacity (m3/d) | Reservoir Volume (m3) | Number of Wind Turbine(s) | Number of Wind Turbine(s) | Desalination Capacity (m3/d) | Reservoir Volume (m3) | Number of Wind Turbine(s) | ||
| Lipsi | Fresh water importation (mainly) & Local Resources (secondarily) | 22.5 | 6–13 | 3 (800 kW) | 560 | 15,000 | 2 (800 kW) | 2 (800 kW) | 555 | 30,000 | 1 (800 kW) |
| Chalki | 21.8 | 6–13 | 3 (800 kW) | 530 | 12,500 | 2 (800 kW) | 3 (800 kW) | 520 | 6500 | 2 (800 kW) | |
| Megisti | 28.7 | 13–25 | 5 (800 kW) | 380 | 25,000 | 2 (800 kW) | 4 (800 kW) | 370 | 18,000 | 2 (800 kW) | |
| Kimolos | 16.7 | 4–11 | 4 (800 kW) | 680 | 27,500 | 2 (800 kW) | 3 (800 kW) | 675 | 22,700 | 2 (800 kW) | |
| Heraklia | 13.5 | 3–10 | 2 (300 kW) | 235 | 7000 | 1 (300 kW) | 2 (300 kW) | 234 | 4000 | 1 (300 kW) | |
| Schinoussa | 14.1 | 3–10 | 2 (800 kW) | 440 | 8000 | 1 (800 kW) | 2 (800 kW) | 435 | 3000 | 1 (800 kW) | |
| Koufonisi | 27.6 | 8–14 | 3 (800 kW) | 780 | 12,750 | 2 (800 kW) | 2 (800 kW) | 775 | 7000 | 2 (800 kW) | |
| Donoussa | 11.6 | 4–8 | 2 (300 kW) | 140 | 500 | 1 (300 kW) | 2 (300 kW) | 138 | 500 | 1 (300 kW) | |
Table 6.
Unit life cycle cost (LCC) for all the scenarios (€/yr) and all the islands examined.
| Scenarios/Islands | WPROD | WPROD-RWH | WPROD-SWP | WPROD-RWH-SWP | RWH-C | Zero |
|---|---|---|---|---|---|---|
| Lipsi | 139,577 | 163,810 | 185,196 | 270,449 | 346,895 | 395,649 |
| Megisti | 152,889 | 169,005 | 201,708 | 221,661 | 199,232 | 232,366 |
| Chalki | 136,044 | 158,900 | 171,126 | 185,443 | 276,600 | 303,945 |
| Koufonisi | 171,210 | 186,076 | 209,143 | 194,634 | 344,923 | 378,133 |
| Kimolos | 173,041 | 191,557 | 264,975 | 279,189 | 386,687 | 424,695 |
| Heraklia | 49,359 | 53,911 | 72,399 | 64,706 | 121,244 | 126,027 |
| Schinoussa | 105,672 | 123,733 | 129,925 | 116,819 | 193,294 | 201,489 |
| Donousa | 35,980 | 41,391 | 32,294 | 37,658 | 88,909 | 93,168 |
© 2019 by the authors. Licensee MDPI, Basel, Switzerland. This article is an open access article distributed under the terms and conditions of the Creative Commons Attribution (CC BY) license (http://creativecommons.org/licenses/by/4.0/).
Share and Cite
MDPI and ACS Style
Kourtis, I.M.; Kotsifakis, K.G.; Feloni, E.G.; Baltas, E.A. Sustainable Water Resources Management in Small Greek Islands under Changing Climate. Water 2019, 11, 1694. https://doi.org/10.3390/w11081694
AMA Style
Kourtis IM, Kotsifakis KG, Feloni EG, Baltas EA. Sustainable Water Resources Management in Small Greek Islands under Changing Climate. Water. 2019; 11(8):1694. https://doi.org/10.3390/w11081694
Chicago/Turabian StyleKourtis, Ioannis M., Konstantinos G. Kotsifakis, Elissavet G. Feloni, and Evangelos A. Baltas. 2019. "Sustainable Water Resources Management in Small Greek Islands under Changing Climate" Water 11, no. 8: 1694. https://doi.org/10.3390/w11081694
Note that from the first issue of 2016, this journal uses article numbers instead of page numbers. See further details here.