Quantifying Vertical Deformation in the Tigris–Euphrates Basin Due to the Groundwater Abstraction: Insights from GRACE and Sentinel-1 Satellites


1
Bureau of Economic Geology, Jackson School of Geosciences, University of Texas at Austin, Austin, TX 78758, USA
2
Department of Geomatics, National Cheng Kung University, Tainan 701, Taiwan
*
Author to whom correspondence should be addressed.
Water 2019, 11(8), 1658; https://doi.org/10.3390/w11081658
Submission received: 10 July 2019
/
Revised: 5 August 2019
/
Accepted: 7 August 2019
/
Published: 10 August 2019
(This article belongs to the Section Hydrology)
Abstract
:This study explores the occurrences of land subsidence in response to dropping groundwater levels in the central part of the Tigris–Euphrates basin. We estimated the groundwater depletion related to human and climate drivers between 2003 and 2017 based on estimates from the Gravity Recovery and Climate Experiment (GRACE) and two global hydrological models (NOAH-3.3 and WGHM-2.2d). The cumulative displacement was calculated using Small Baseline Subset Interferometric Synthetic Aperture Radar (SBAS-InSAR) for 96 interferograms, which were generated by 31 images acquired by the Sentinel-1 satellite. The results show that the basin is experiencing a decline in groundwater storage at a rate of −7.56 km3/year with a total loss of 106.81 km3. This depletion rate has led to inelastic compaction and has resulted in subsidence near the city of Baghdad at a rate of −10 mm/year. The measured coherence phase between the two signals is ~0.67, and the depletion precedes the subsidence by ~1.5 months. The new data from GRACE-Follow on, Sentinel-1, and the piezometric water level could help to constrain the rate of depletion and displacements in the basin. Combining these remote sensing techniques provides an independent tool for water management in areas where in-situ data are scarce.
1. Introduction
The Tigris–Euphrates basin (TEB) is transboundary basin bounding two river systems (Tigris and Euphrates), which originate from eastern Turkey, follow through Syria, Iraq, Jordan, Saudi Arabia, and Iran and end in the Persian Gulf [1]. Most of the basin has recently suffered from water risk, especially downstream, which is a result of the extensive use of surface water and groundwater and the frequent occurrence of droughts (Figure 1). For example, the dry spell from 2007 to 2009 caused declines in flow and reservoir storage to less than 70% of their normal levels [2,3].
The scarcity of surface water is putting more pressure on groundwater aquifers, which has resulted in a higher extraction rate [4] and decreases in storage by −25.6 ± 3.7 km3/year, with a total loss of −76.9 ± 10.1 km3 [3]. In theory, the decline in groundwater level to historical levels without replenishment could lead the aquifer sediments to compact and the land to subside [5]. Such phenomena are persistent in urban and agriculture regions throughout the world, such as the San Joaquin Valley [6], Santa Clara Valley, California [7], Mekong Delta [8], México [9], and northern Beijing Plains [10].
In the surrounding regions of the basin, such as Iran, the subsidence related to the drying of groundwater wells has been a persistent problem in the last decade [11]. In the Rafsanjan plains, the subsidence rate is estimated to be >5 cm/year and has increased to 30 cm/year in local regions based on the interferometric synthetic aperture radar (InSAR) technique [11]. This research investigates whether the aquifers in the TEB are suffering inelastic compaction due to the massive groundwater extraction, the decline of water levels, and the progressive drought in recent years.
We address this question by first providing evidence for the groundwater depletion and land subsidence in the TEB. Then, we prove that such subsidence is related to the rapid extraction of the groundwater in recent years. The impetus for this investigation is the scarcity of real in-situ data, including piezometric water levels and sufficient subsidence monitoring systems (e.g., levelling systems and the Global Positioning System (GPS)). To overcome this issue, we combine information from the geodetic satellites (Gravity Recovery and Climate Experiment (GRACE) and Sentinel-1) with Global Hydrological Models (GHMs) to better understand the changes in groundwater storage (GWS) and explore the climate and human-driven depletion in the basin.
GRACE is sensitive to the total mass variation based on temporal changes of the gravity field [12]. Thus, it can provide the changes and trends of GWS with the help of GHMs. Sentinel-1 satellites offer a tool to estimate the crustal deformations at the millimeter scale, which can be seen as a change of the hydraulic head in aquifer regions. We used the Small Baseline Subset Interferometric Synthetic Aperture Radar (SBAS-InSAR) [13] for data from the Sentinel-1 satellite between 2015 and 2018 to resolve the temporal and spatial subsidies in the central part of TEB. To determine the relationship between the depletion and land subsidence, we filtered the two-time series in time and space, and we found the common power, coherence, and consistent phase by applying the cross-wavelet transform [14].
2. Materials and Methods
2.1. Estimating the Groundwater Storage (GWS) Change
GRACE satellites have been used over the last 16 years to investigate the changes of GWS indirectly with the help of GHMs, such as the Global Land Assimilation System (GLDAS). GRACE represents the integrated vertical column of the water change, including the soil moisture (), snow water equivalent (), surface water storage , canopy (), and GWS, while GLDAS simulates these storages except for GWS and SWS. GWS can be obtained by subtracting the GLDAS simulated storages from the total water storage (TWS) obtained with GRACE based on the water budget approach [16].
The errors of the GWS based on Equations (1) and (2), can be formulated as
where is one sigma errors of the storage.
We used the GRACE mascon solutions, which use the mass concentrations as a prior constraint to derive the reduction of the temporal changes of the gravity field and increase the signal-to-noise ratio [17,18,19]. To represent the TWS in the TEB between January 2003 and June 2017, we used the average of the three mascon solutions released by three different institutes: the Center for Space Research, the University of Texas at Austin (UT-CSR), NASA Jet Propulsion Laboratory (JPL), and NASA’s Goddard Space Flight Center (GSFC). For other components, we used the outputs of the GLDAS-2.1 (NOAH-3.3) model for the same period. The NOAH-3.3 model provides optimized states for the storages at a depth of 2 m for four soil layers [20] but does not simulate (e.g., rivers, lakes, wetlands, and reservoirs). Therefore, we obtained other outputs from the WaterGAP Global Hydrology Model (WGHM 2.2d). WGHM uses water balance estimation (e.g., irrigation, water management) to simulate all storages and water fluxes, such as surface and subsurface runoffs, river discharge, lakes, wetlands, GWS, human withdrawals, snow, rivers, and canopy) [21,22,23]. The data are available at a resolution of 0.5° (55 km at the equator) for the period of 1979 to 2016. We used two versions of the model and considered human impact to emphasize the role of human interventions in the basin (e.g., irrigation and groundwater extraction).
2.2. Temporal Land Deformation in Tigris–Euphrates Basin (TEB)
The response of the aquifer system to the decline of the water level was investigated using the coherence small baseline subset [24] and atmospheric corrections for the Sentinel-1 data. Coherence SBAS relies on the combination of redundant series of unwrapped interferograms with good coherence that can be attained using pairs with narrow temporal and spatial baselines. The deformation signal in the interferometric phase at time is contaminated by phase errors (e.g., atmospheric and ionospheric errors, antenna noise), and other errors arise from sources such as the topography according to Equation (4) [25,26].
Assuming that has a random distribution, the errors can be estimated by applying common point stacking [26] and then subtracting from the interferometric phase, which leads to increases in accuracy and strengthens the deformation phase. We used 31 image datasets from the C-band of the Sentinel-1 satellites, which are operated by the European Space Agency (ESA) [27]. The datasets represent an ascending orbit with 72 paths and 106 frames acquired from 26 May 2015 to 10 April 2018 over the central part of the TEB (Figure 1 and Table 1). The SAR images are co-registered pixel by pixel based on a geometric approach while accounting for topographic variations. This is done with the help of a 30 m digital elevation model (DEM) [28] and the provided orbital information [25,29].
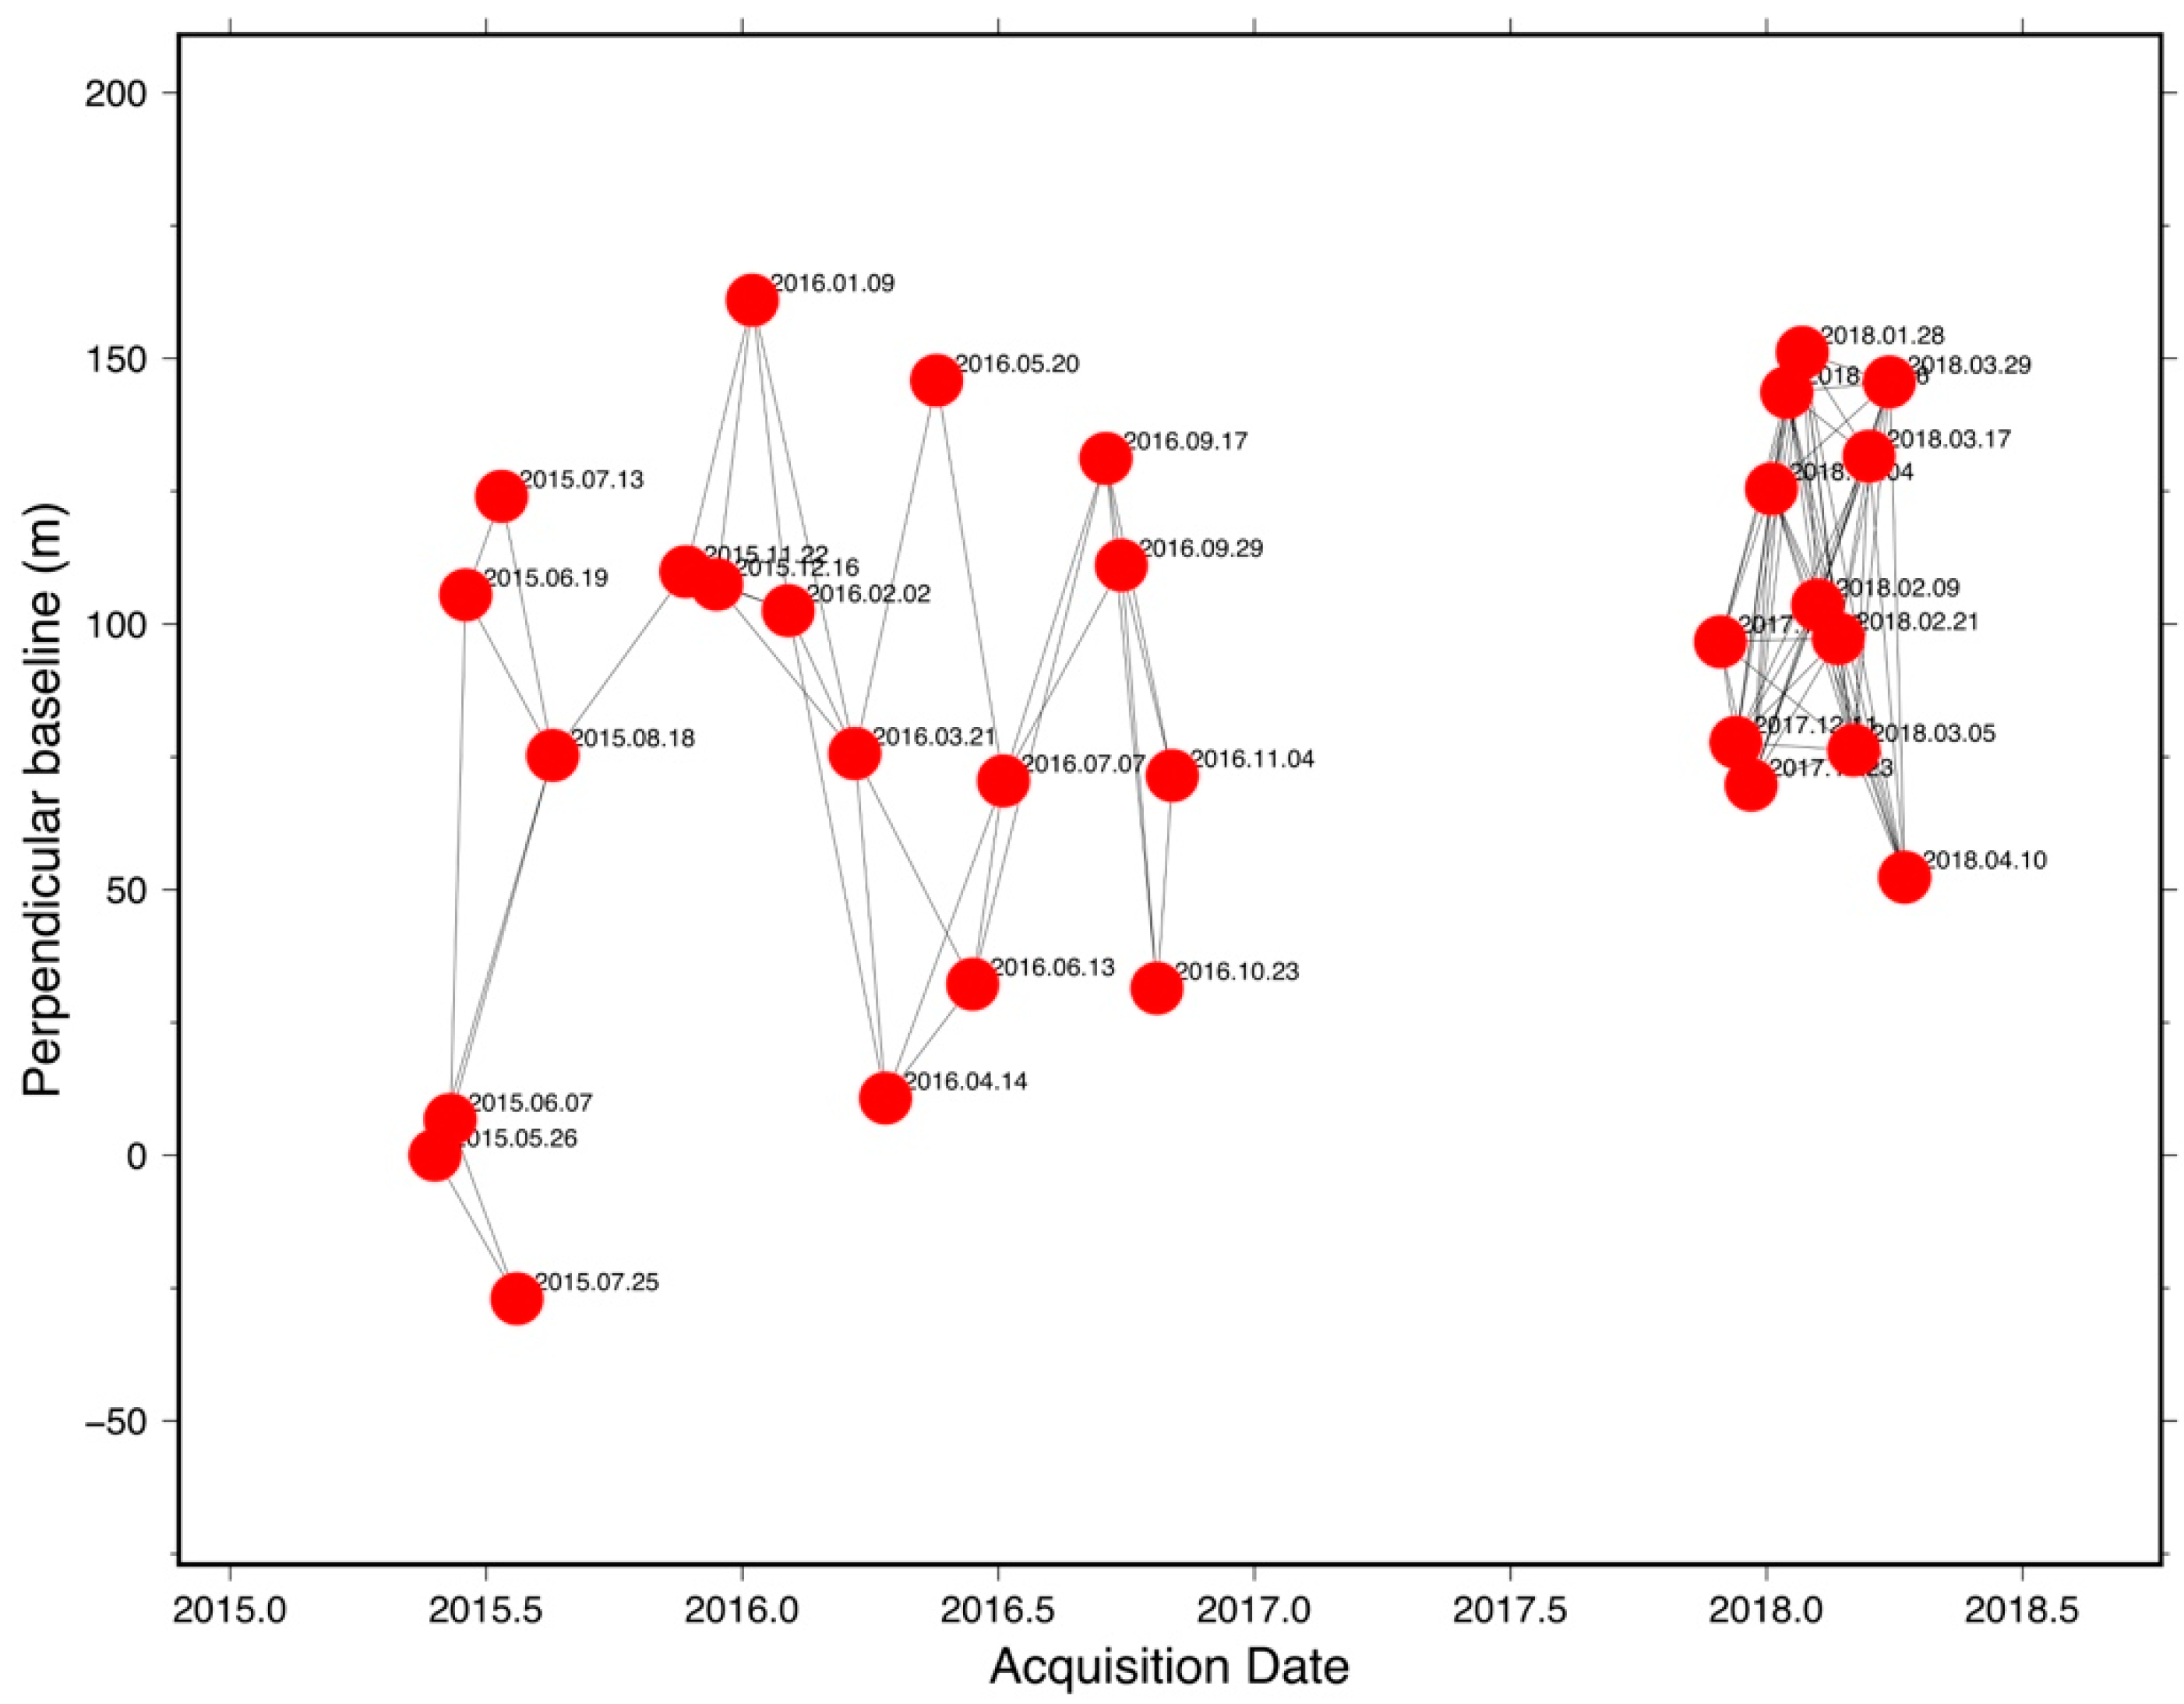
The 31 SAR images are aligned to a super master image captured on 11 April 2016, which has the minimum difference in baseline elevations between the images (Figure 2). The 96 interference patterns between the images are constructed based on the minimum spatial baseline of 100-m in the acquired data. The topographic phase and the flat-earth effect are removed by using the 30-m resolution DEM. Next, a Gaussian low-pass filter is applied with 300 wavelengths. The unwrapped phase is obtained by using the Statistical-Cost Network-Flow Algorithm for Phase Unwrapping (SNAPHU) software [30]. We generated a rate deformation map that represents the cumulative vertical displacements in the TEB from 2015 to 2018 based on stacking the unwrapped phases and the time series of the deformations at the acquisitions dates. The time and frequency phase of the mean series of vertical displacements are compared with the derived GWS depletion using a cross-wavelet transform to identify the possible connection with ground deformations in the TEB.
2.3. Cross-Wavelet Transform between Depletion and Displacements
The continuous-wavelet transform (CWT) is a band-pass filter technique to extract the possible physical relationships between two geophysical time series in time-frequency space based on the findings of a consistent phase angle (time lag), common power, and coherence [14]. CWT can be defined as:
where and are continuous wavelets that represent the relative phase between the two time series in X and Y (the derived GWS and the vertical displacements) with length and standard deviation is the level of confidence associated with the probability (p) density function of the two product root square distributions, and PK is the background power spectrum.
The correlation is significant between the two signals when the left-hand side of Equation (5) is larger than the maximum power spectrum of the red noise. The cross-wavelet transform (XWT) treats the Morlet wavelet as a mother function, which balances between localizing the signal in time and frequency. The extracted significant periodic signal is represented by the cone of influence (COI), where the phase discontinuity drops by at the boundary of the COI. The CWT is used to define the relationship between different geophysical processes—for example, the Baltic maximum sea ice extent and Arctic Oscillation index [14], land subsidence and GWS volume change [31], and climate, vegetation factors, and ΔTWS [32]. We employed the CWT to expand the groundwater volume changes and vertical displacements with corresponding time into a time-frequency space. Then, the XWT is employed based on the two CWTs to expose the regions in time-frequency space with a local correlation locked phase under a statistical significance level. The statistical significance was determined by the Monte Carlo method [14].
3. Results and Discussion
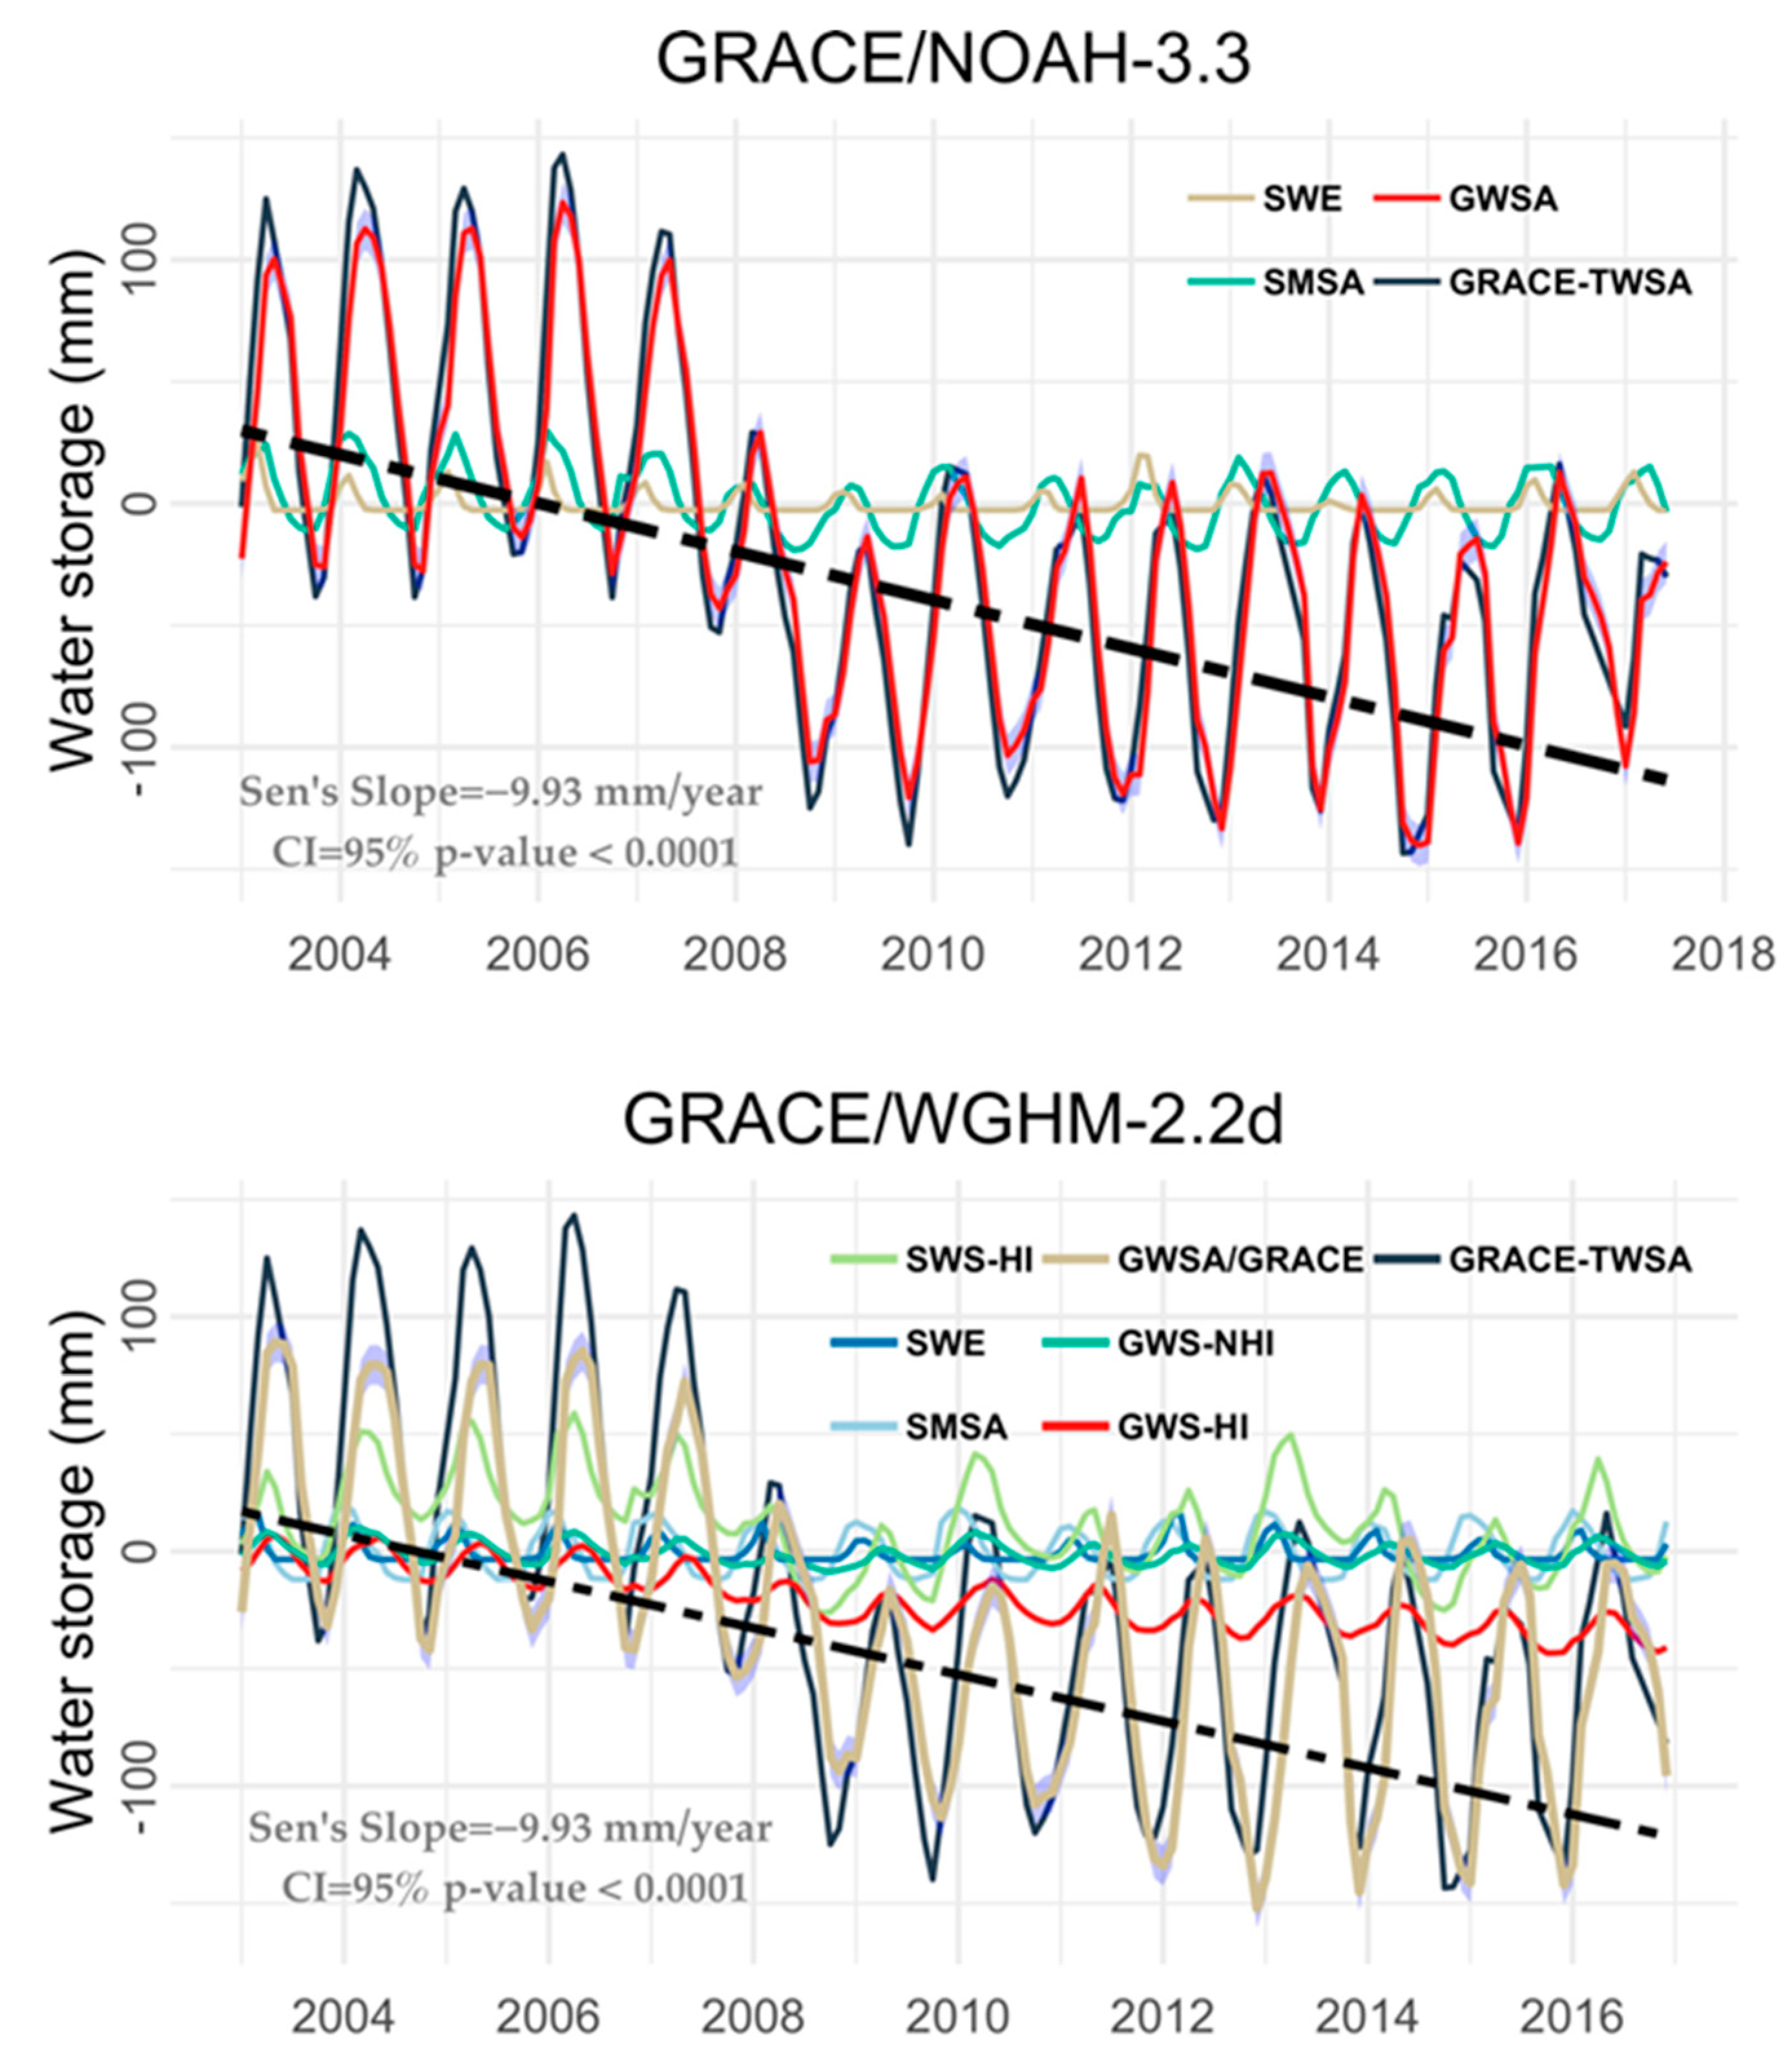
Figure 3 shows the time series of the storage components and the derived GWS. GWS is plotted with the uncertainty obtained from Equation (3). We also present the simulated GWS from WGHM-2.2d under two scenarios regarding the impact of human intervention. The long-term trend was calculated using the Sen slope [33] under a 95% confidence interval and p-value < 0.0001. From January 2003 to June 2017, the long-term rate of the GWS depletion in the TEB basin is about −9.93 ± 2 mm/year, which is equal to −7.56 km3/year with a total loss of 106.81 km3. Much of this loss occurred after 2007, when the basin experienced an intense drought.
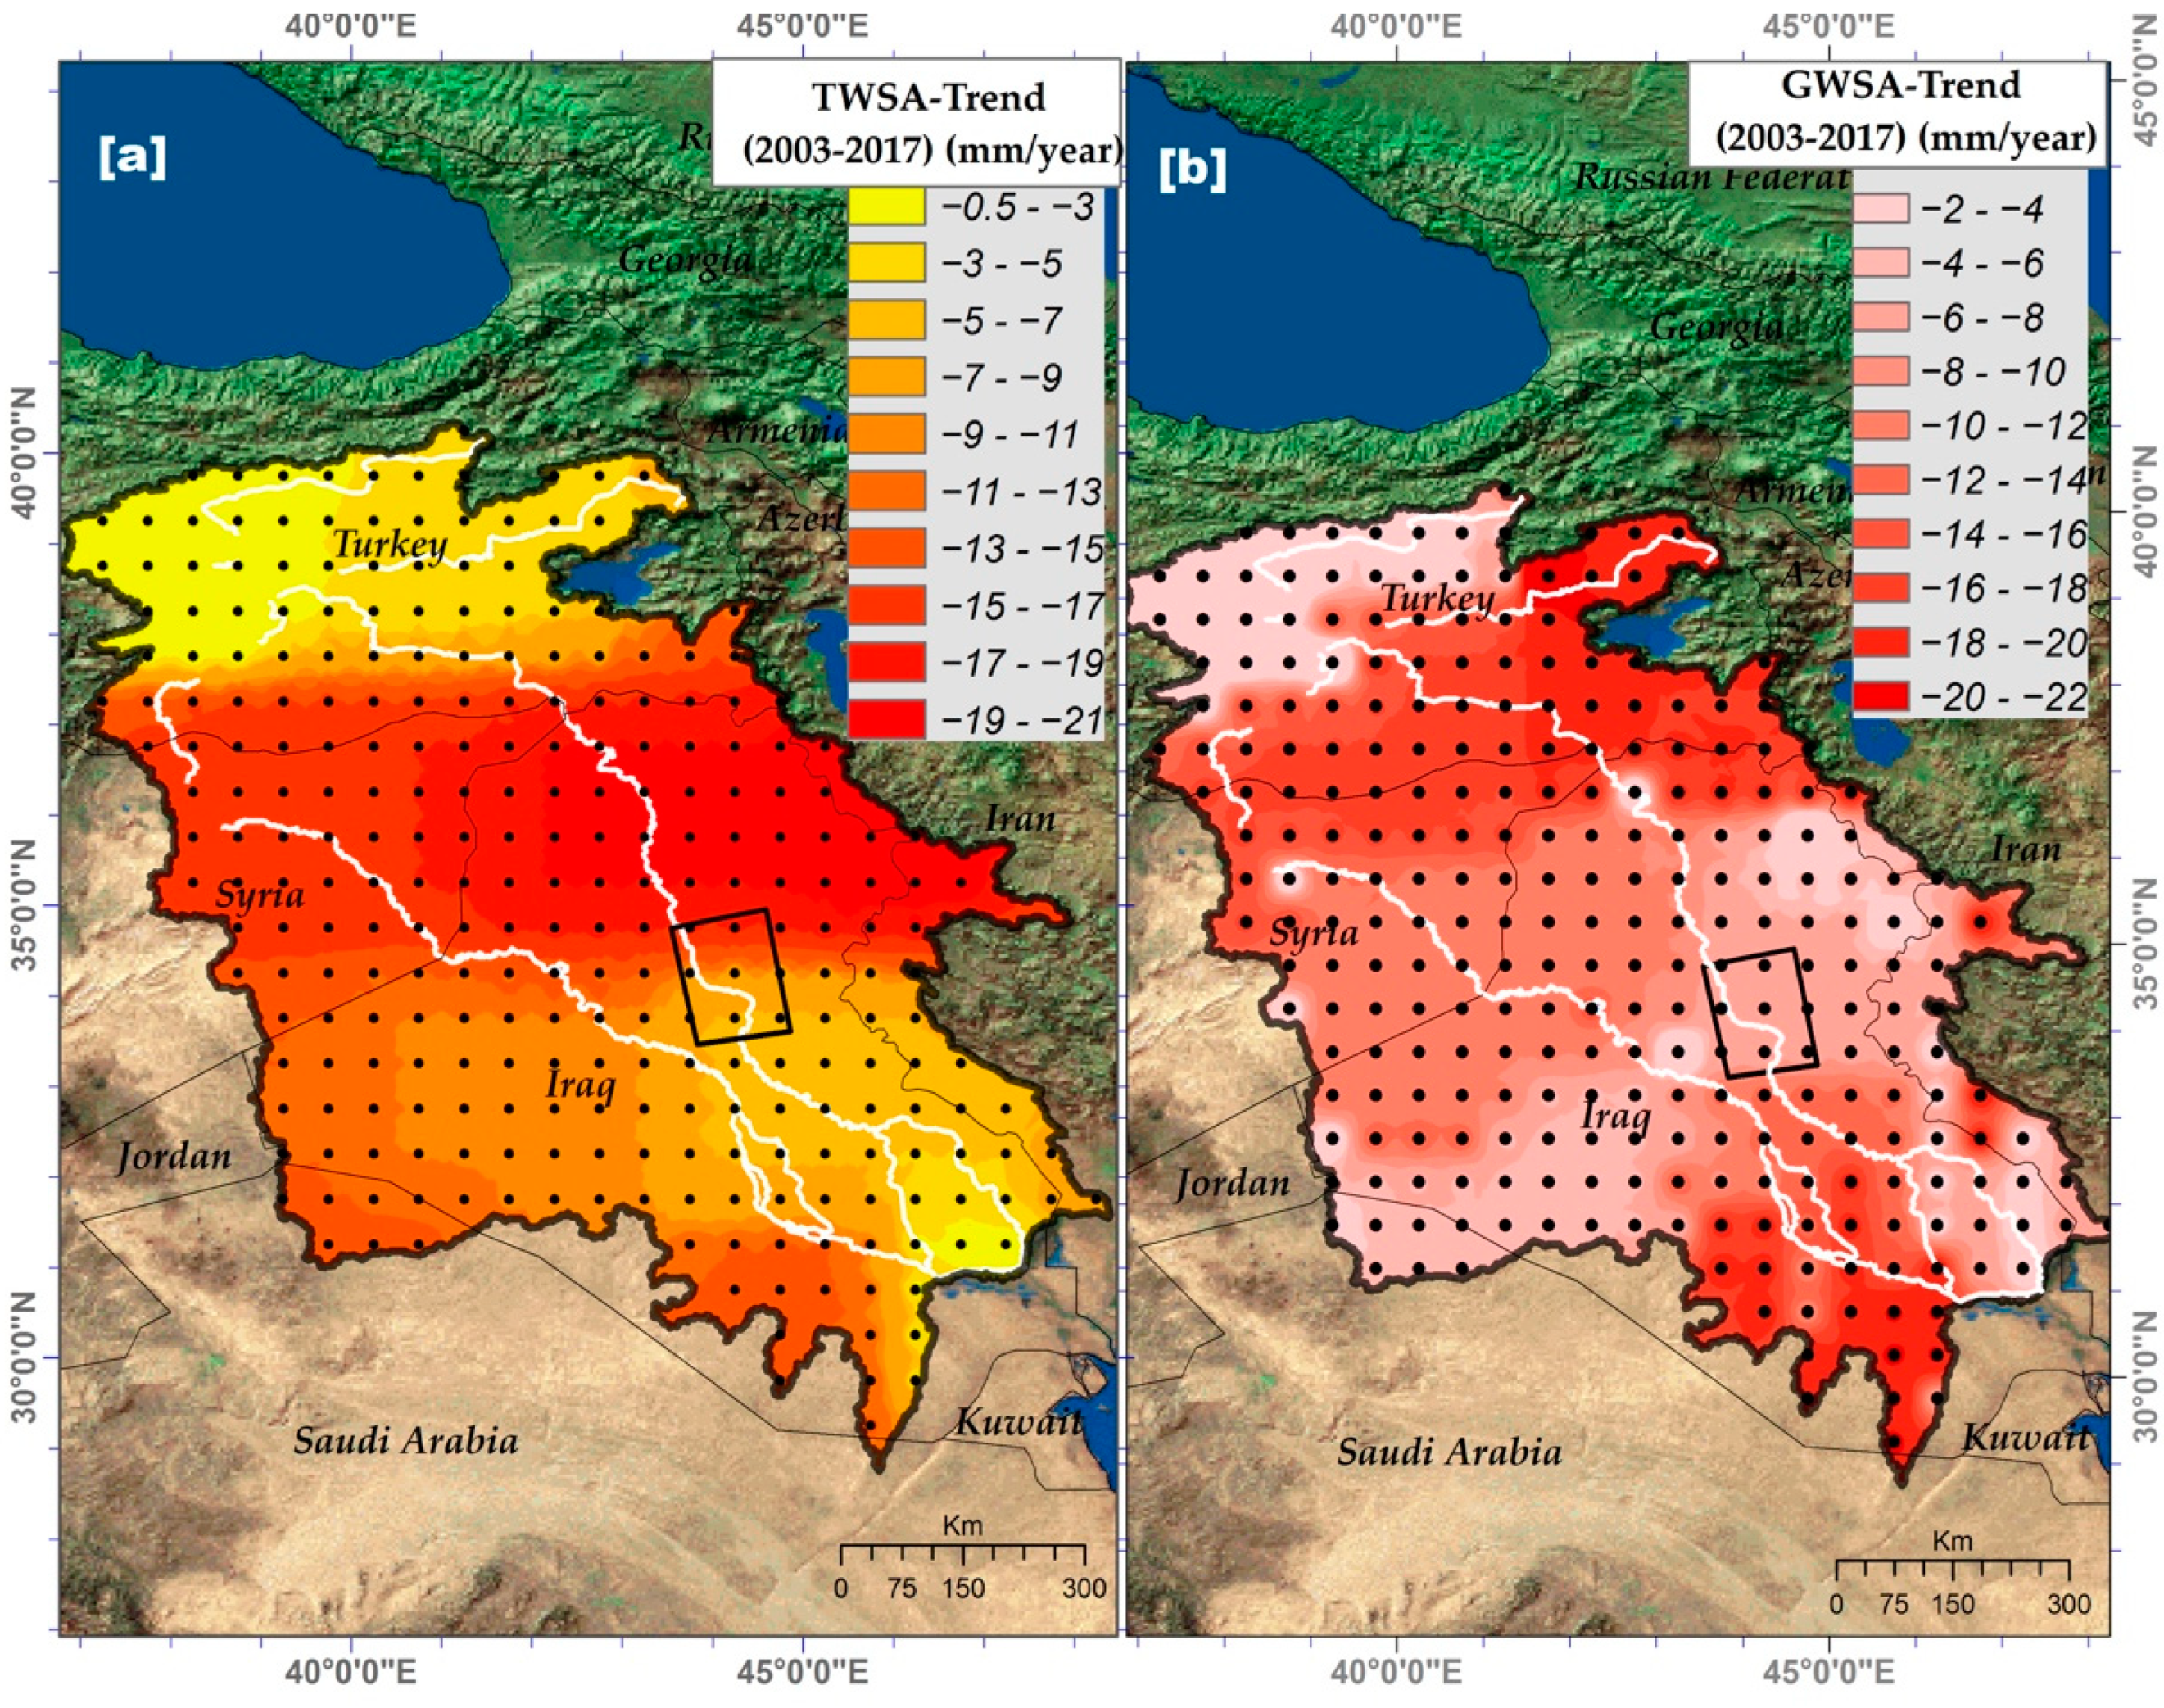
The mean lower uncertainty for the GRACE-GWS is −39.71 mm, and the upper uncertainty is approximately −22.30 mm. The spatial variations of the TWS and GWS trends show that the maximum depletion occurs in central section of the basin as opposed to the northern and southern sections (Figure 4). The depletion of TWS has a range of −11 to −21 m/year in the central section and decreases to <−7 mm/year in the upper stream in Turkey and to <−9 mm/year downstream in Iraq. Similarly, the GWS has a depletion rate of 11 to −21 m/year in the central and downstream sections of the basin. The upper stream has a relatively small rate of <−7 mm/year.
The WGHM estimate of GWS was compared the result derived from the GRACE, which indicated that the model underestimates the component magnitude. However, it still indicates the long-term trend and the change of the GWS compared with GRACE-GWS. The measured correlation between the GRACE-GWS and WGHM simulated GWS is R = 0.84 for GWS-HI (with human interventions) and R = 0.55 for GWS-NHI (without human interventions). One can infer that groundwater depletion is occurring in the TEB and is exacerbated by the drought conditions and the rapid human extraction that occurred in the last decade (2007–2017).
The displacement rate obtained by applying the SBAS to the SAR images ranges from −40 to 40 mm/year. Higher subsidence was detected near Baghdad with a rate of about > –10 mm/year, as well as the eastern part of the study area (Figure 5). The maximum subsidence is located in superficial urban regions, wetlands, and paddy fields, where the overexploitation of groundwater is occurring. The lithology of the subsided area is represented by quaternary sediments (e.g., sand, silt, and clay), and the groundwater depth ranges from 2 to 50 m [34]. The flow of channels near this region has decreased markedly since the 1960s and dropped to 520 m3/s by 2012 (Supplementary Materials, Figure S1) [35,36]. For this reason, the extraction of GWS and the dependence of irrigation systems have increased.
Such withdrawal of groundwater could be mainly based on groundwater during drought periods when surface water resources decrease. For example, following 2007–2009, the Iraqi government and citizens dug more than 1000 new wells. In 2018–2019, when the drought became worse, it is more likely that such activities on groundwater have increased. In general, the withdrawal of groundwater in recent years has resulted in Iraq ranking as 21th among countries with the highest groundwater depletion in the world in terms of withdrawal ratio to the water supply, which is >80% [37]. The withdrawal of surface water and groundwater constitutes more than 97.2% of the total withdrawal in Iraq [4].
One possible interpretation of the vertical displacements in TEB is the oil and gas production, which can induce such land displacements. In fact, frame 1 covers the giant oil field of East Baghdad. However, no vertical displacement has been reported in the area because of oil production. In light of the absence of information about the production rate of the field, there is a possibility of the contribution of oil extraction to the land subsidence near Baghdad. However, the same anomaly propagates into frame 2, where there is no oil or gas production. Therefore, we can infer that the anomaly is most likely caused by the rapid extraction of groundwater and the compacting of aquifer materials. A pronounced uplift of about 28–30 mm/year was observed in the northern area of frame 1 (non-urban region) and the eastern area of frame 2 (the western sections of Zagros Mountains).
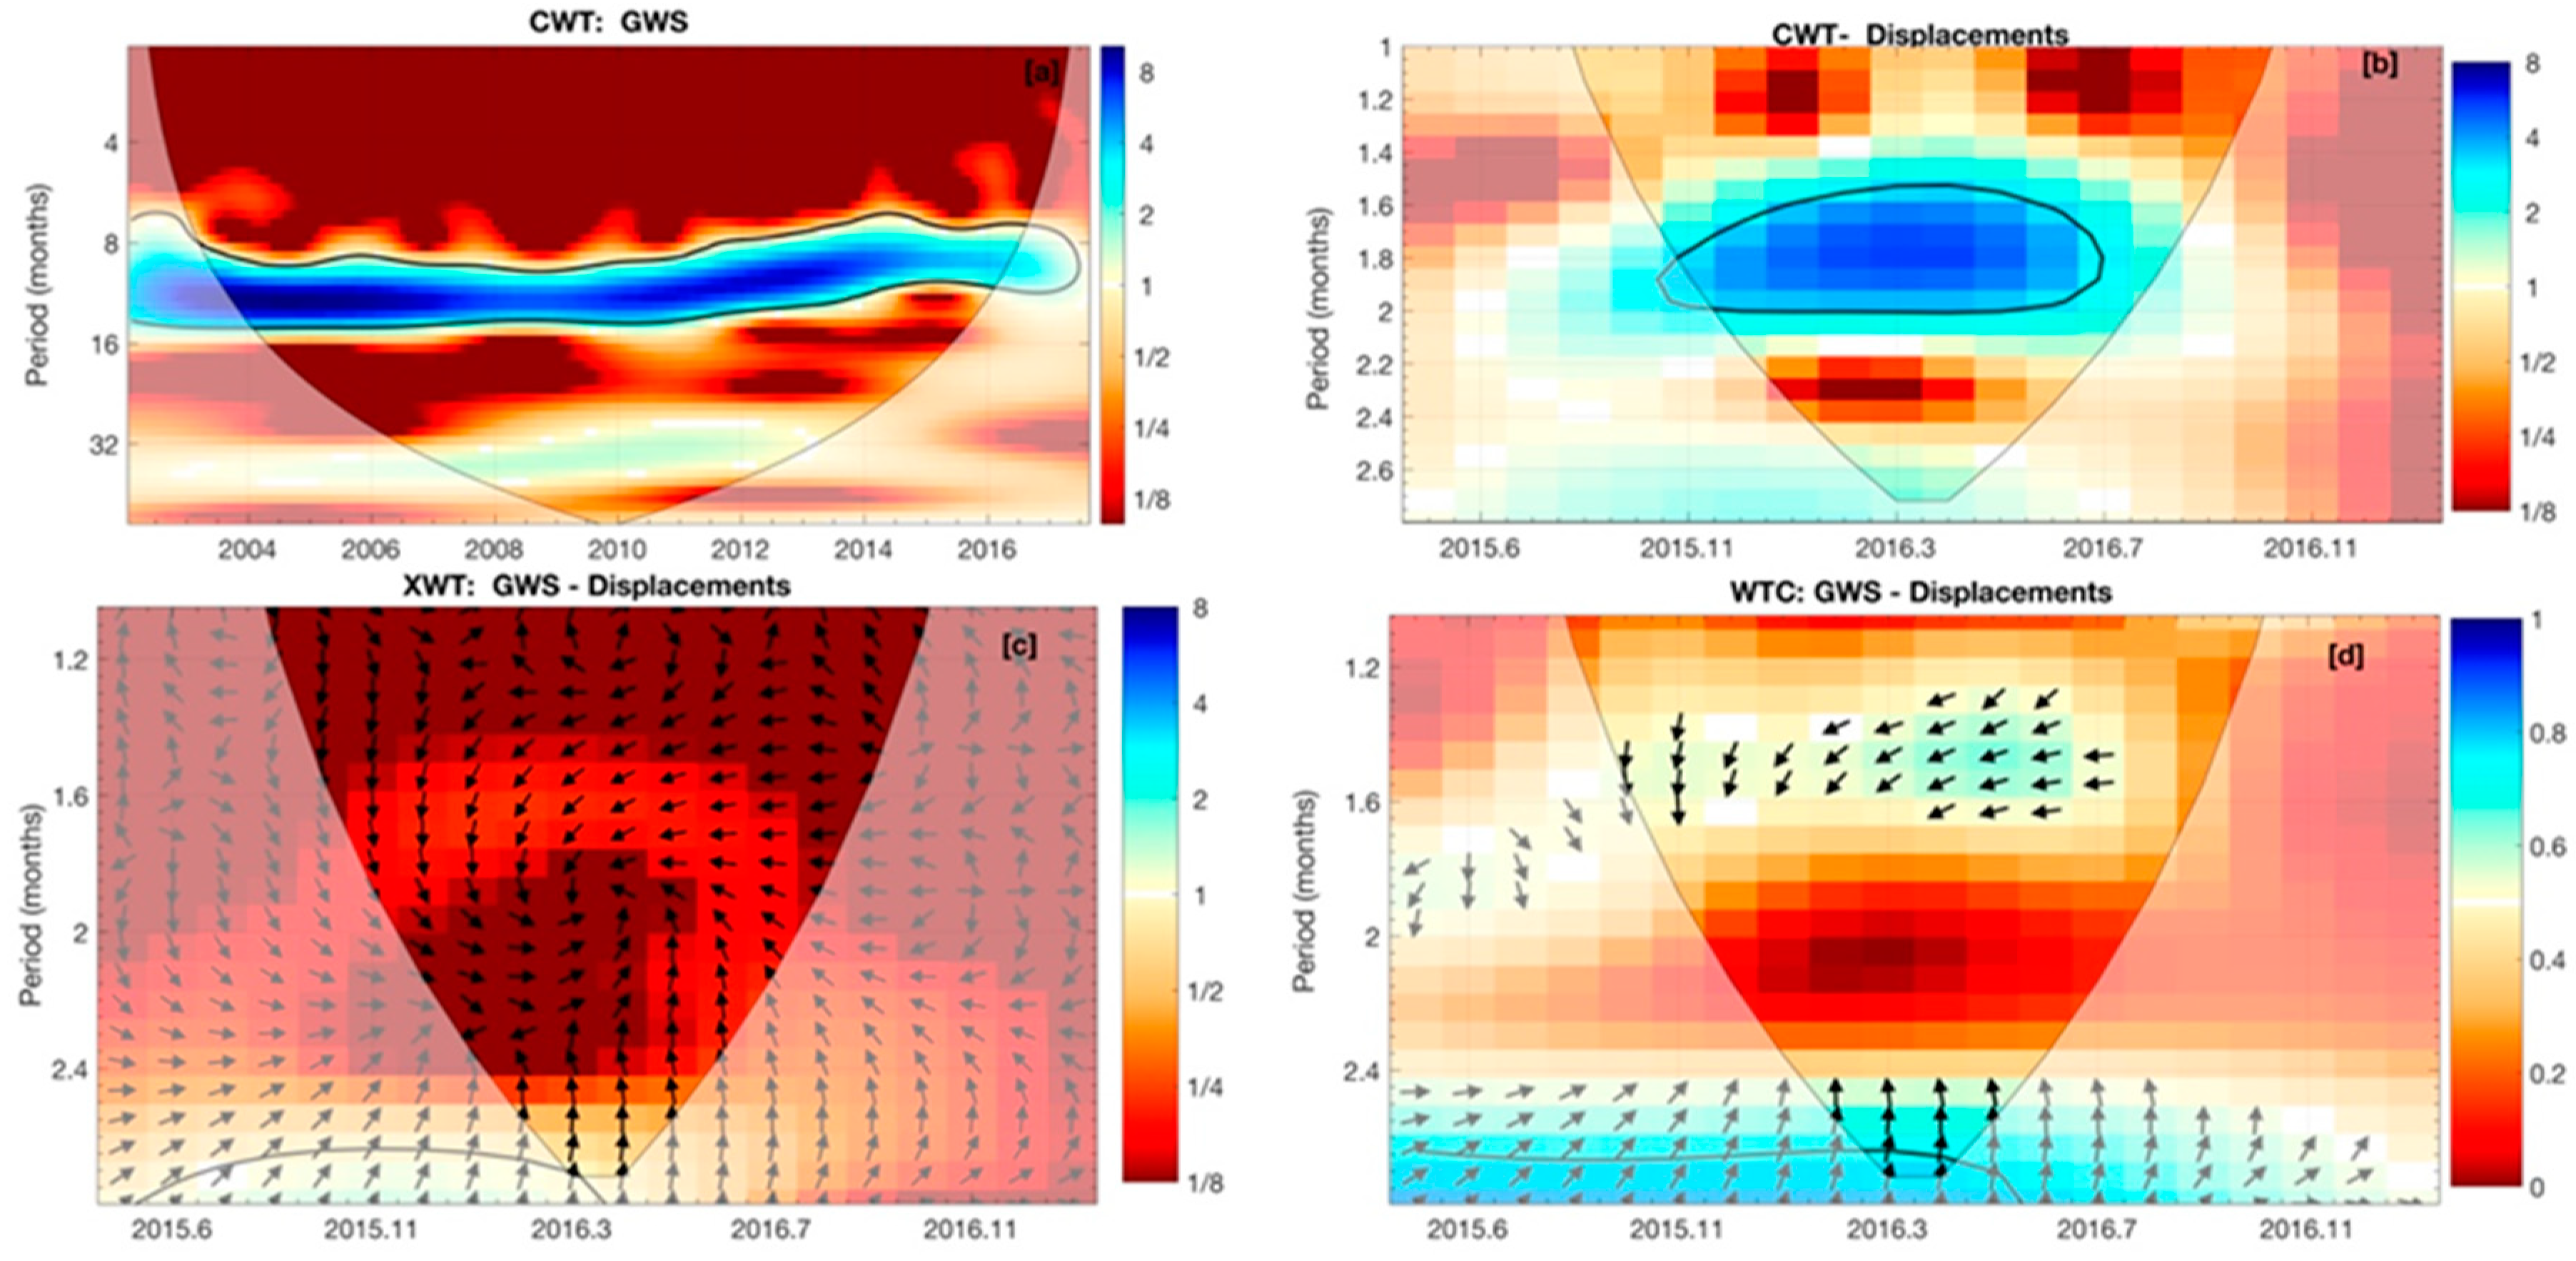
The results of the continuous and cross-wavelet analyses are presented in Figure 6. As expected, the dominant significant period is the seasonal component (12 months) with a power spectrum of 6–8 over the time series of 2003–2017 for the GWS changes. For the land displacement, the significant period is 1.5 to 2 months from November 2015 to July 2016 with the same power spectrum range of 6–8. The common power between the two signals is in a period of 1.5 to 2-months. The coherence of the two signals in frequency space is about 0.67 for the 1.5–2 months, which is above the 5% confidence level.
The direction arrows are in the down-and-left direction, which implies that the two signals are out of phase and that the first signal (GWS changes) leads the second (displacements). The phase angle is about ~1.5 months. The results from GRACE-TWS show that the trend of the TWS from 2013 to 2016 has a decreasing rate of −21.09 mm/year, while the GWS has a negative rate of −2.41 mm/year from January 2011 to December 2016. In the same period, subsidence occurs, and the temporal patterns of the two signals are coherent. However, due to the short time of the comparison (i.e., 2015–2017), such comparisons could be misleading.
Based on the spatiotemporal results of groundwater depletion in TEB, the subsidence in urban regions, and the coherence level of the depletion and land displacements, we conclude that the subsidence in the center of the TEB has a mutual relationship with the activities of groundwater extraction.
However, some limitations are worth mentioning. First, we compared the GWS depletion across the whole basin with local subsidence, which can be seen as a rough assessment due to the coarse resolution of GRACE (>200,000 km2) and the short term of comparison. Future work must include the results of GRACE-FO with finer resolutions and adopt many Sentinel-1 frames to convert the displacements to hydrological information.
Second, obtaining a continuous deformation rate is challenging and is mainly based on the availability of the data. In this analysis, the deformation rate resulted from two different interferogram networks, and the resulting rate is not unique. The quality of the interferogram networks involves a tradeoff between the temporal and spatial baseline information with respect to the temporal changes of phenomena (e.g., groundwater seasonal changes). Lastly, even though the wavelet analysis does not rely heavily on the length of the data since the periodicity is the dominant component, it is safer to use a long time series of data.
4. Conclusions and Implications
We examined the subsidence induced by groundwater depletion in the central TEB using remote sensing observations and GHMs. The TEB experienced a GWS decline rate of −7.56 km3/year with a total loss of 106.81 km3 from 2003 to 2017. The GWS depletion induced by human intervention surpasses the impact of climate on the TEB. The resulting depletion has induced a subsidence rate >−10 mm/year near Baghdad. The depletion and subsidence signals covary with coherence values of approximately 0.67, and the depletion precedes the subsidence by less than two months. The new data from the GRACE-FO as well as updated Sentinel time series and piezometric data from in-situ water levels could help to constrain the rate of depletion and displacements in basins. These remote sensing techniques using GRACE and Sentinel still provide independent tools to practice water management in places where in-situ data are scarce.
Supplementary Materials
The following are available online at https://www.mdpi.com/2073-4441/11/8/1658/s1, Figure S1: Monthly Discharge of Tigris river at Sarai Bagdad station [35,36].
Author Contributions
A.R. proposed the research, did the analysis and wrote the manuscript. C.Y. edited and proofread the manuscript.
Funding
This research received no external funding.
Acknowledgments
We thank the GRACE and model data providers (CSR, JPL, GSFC, ESA), and Hannes Müller Schmied for free access of WGHM model outputs. We are grateful for the editor, and the four reviewers for their insightful comments and suggestions that helped to improve the manuscript.
Conflicts of Interest
The authors declare no conflict of interest.
Abbreviations
| CW | Canopy Water |
| CWT | Continuous wavelet Transform |
| COI | Cone of Influence |
| DEM | Digital elevation model |
| GHM | Global Hydrologic Model |
| GLDAS | Global Land Data Assimilation System |
| GPS | Global Positioning System |
| GRACE | Gravity Recovery and Climate Experiment |
| GSFC | NASA Goddard Space Flight Center Mascon |
| GWL | Groundwater level |
| GWSA | Groundwater Storage Anomaly |
| GWSA-HI | GWSA with Human Impact |
| GWSA-NHI | GWSA with no Human Impact |
| JPL | NASA Jet Propulsion Laboratory Mason downscaled |
| NOAH | National Center for Environmental Prediction, Oregon State University, Air Force; Hydrology Lab |
| SBAS-InSAR | Small Baseline Subset Interferometric Synthetic Aperture Radar |
| SMS | Soil Moisture Storage |
| SNAPHU | Statistical-Cost Network-Flow Algorithm for Phase Unwrapping |
| SWS | Surface Water Storage |
| SnWS | Snow Water Storage |
| TEB | Tigris-Euphrates Basin |
| TWS | Total Water Storage |
| UTCSR | University of Texas at Austin, Center for Space Research Mascon |
| WGHM-HI | WaterGAP Global Hydrologic Model with Human Impact |
| WGHM-NHI | WGHM without Human Impact |
| WTC | Wavelet Coherence |
| XWT | Cross-wavelet Transform |
References
- Al-Ansari, N. Hydro-Politics of the Tigris and Euphrates Basins. Engineering 2016, 8, 140–172. [Google Scholar] [CrossRef] [Green Version]
- Trigo, R.M.; Gouveia, C.M.; Barriopedro, D. The intense 2007–2009 drought in the Fertile Crescent: Impacts and associated atmospheric circulation. Agric. For. Meteorol. 2010, 150, 1245–1257. [Google Scholar] [CrossRef]
- Voss, K.A.; Famiglietti, J.S.; Lo, M.; Linage, C.; Rodell, M.; Swenson, S.C. Groundwater depletion in the Middle East from GRACE with implications for transboundary water management in the Tigris-Euphrates-Western Iran region. Water Resour. Res. 2013, 49, 904–914. [Google Scholar] [CrossRef] [PubMed] [Green Version]
- Chulov, M. Iraq: Water, water nowhere. World Policy J. 2009, 26, 33–40. [Google Scholar] [CrossRef]
- Amelung, F.; Galloway, D.L.; Bell, J.W.; Zebker, H.A.; Laczniak, R.J. Sensing the ups and downs of Las Vegas: InSAR reveals structural control of land subsidence and aquifer-system deformation. Geology 1999, 27, 483–486. [Google Scholar] [CrossRef]
- Farr, T.G. InSAR measurements of subsidence in the Central Valley, California from 2007-present. In Proceedings of the 11th European Conference on Synthetic Aperture Radar (EUSAR 2016), Hamburg, Germany, 6–9 June 2016; pp. 1–3. [Google Scholar]
- Chaussard, E.; Milillo, P.; Bürgmann, R.; Perissin, D.; Fielding, E.J.; Baker, B. Remote sensing of ground deformation for monitoring groundwater management practices: Application to the Santa Clara Valley during the 2012–2015 California drought. J. Geophys. Res. Solid Earth 2017, 122, 8566–8582. [Google Scholar] [CrossRef]
- Minderhoud, P.; Erkens, G.; Pham, V.; Bui, V.T.; Erban, L.; Kooi, H.; Stouthamer, E. Impacts of 25 years of groundwater extraction on subsidence in the Mekong delta, Vietnam. Environ. Res. Lett. 2017, 12, 064006. [Google Scholar] [CrossRef] [PubMed]
- Pacheco-Martínez, J.; Hernandez-Marín, M.; Burbey, T.J.; González-Cervantes, N.; Ortíz-Lozano, J.Á.; Zermeño-De-Leon, M.E.; Solís-Pinto, A. Land subsidence and ground failure associated to groundwater exploitation in the Aguascalientes Valley, Mexico. Eng. Geol. 2013, 164, 172–186. [Google Scholar] [CrossRef]
- Zhu, L.; Gong, H.; Li, X.; Wang, R.; Chen, B.; Dai, Z.; Teatini, P. Land subsidence due to groundwater withdrawal in the northern Beijing plain, China. Eng. Geol. 2015, 193, 243–255. [Google Scholar] [CrossRef]
- Motagh, M.; Shamshiri, R.; Haghighi, M.H.; Wetzel, H.U.; Akbari, B.; Nahavandchi, H.; Roessner, S.; Arabi, S. Quantifying groundwater exploitation induced subsidence in the Rafsanjan plain, southeastern Iran, using InSAR time-series and in situ measurements. Eng. Geol. 2017, 218, 134–151. [Google Scholar] [CrossRef]
- Tapley, B.D.; Bettadpur, S.; Watkins, M.; Reigber, C. The gravity recovery and climate experiment: Mission overview and early results. Geophys. Res. Lett. 2004, 31. [Google Scholar] [CrossRef]
- Berardino, P.; Fornaro, G.; Lanari, R.; Sansosti, E. A new algorithm for surface deformation monitoring based on small baseline differential SAR interferograms. IEEE Trans. Geosci. Remote 2002, 40, 2375–2383. [Google Scholar] [CrossRef] [Green Version]
- Grinsted, A.; Moore, J.C.; Jevrejeva, S. Application of the cross wavelet transform and wavelet coherence to geophysical time series. Nonlinear Process. Geophys. 2004, 11, 561–566. [Google Scholar] [CrossRef]
- Gassert, F.; Luck, M.; Landis, M.; Reig, P.; Shiao, T. “Aqueduct Global Maps 2.0.” Working Paper; World Resources Institute: Washington, DC, USA, 2013. [Google Scholar]
- Rodell, M.; Famiglietti, J.S. The potential for satellite-based monitoring of groundwater storage changes using GRACE: The High Plains aquifer, Central US. J. Hydrol. 2002, 263, 245–256. [Google Scholar] [CrossRef]
- Luthcke, S.B.; Sabaka, T.J.; Loomis, B.D.; Arendt, A.A.; McCarthy, J.J.; Camp, J. Antarctica, Greenland and Gulf of Alaska land-ice evolution from an iterated GRACE global mascon solution. J. Glaciol. 2013, 59, 613–631. [Google Scholar] [CrossRef]
- Watkins, M.M.; Wiese, D.N.; Yuan, D.N.; Boening, C.; Landerer, F.W. Improved methods for observing Earth’s time variable mass distribution with GRACE using spherical cap mascons. J. Geophys. Res.-Sol. Earth 2015, 120, 2648–2671. [Google Scholar] [CrossRef]
- Save, H.; Bettadpur, S.; Tapley, B.D. High-resolution CSR GRACE RL05 mascons. J. Geophys. Res.-Sol. Eath 2016, 121, 7547–7569. [Google Scholar] [CrossRef]
- Rodell, M.; Houser, P.R.; Jambor, U.; Gottschalck, J.; Mitchell, K.; Meng, C.J.; Arsenault, K.; Cosgrove, B.; Radakovich, J.; Bosilovich, M.; et al. The global land data assimilation system. Bull. Am. Meteorol. Soc. 2004, 85, 381–394. [Google Scholar] [CrossRef]
- Doll, P.; Mueller Schmied, H.; Schuh, C.; Portmann, F.T.; Eicker, A. Global-scale assessment of groundwater depletion and related groundwater abstractions: Combining hydrological modeling with information from well observations and GRACE satellites. Water Resour. Res. 2014, 50, 5698–5720. [Google Scholar] [CrossRef]
- Müller Schmied, H.; Adam, L.; Eisner, S.; Fink, G.; Flörke, M.; Kim, H.; Oki, T.; Portmann, F.T.; Reinecke, R.; Riedel, C. Impact of climate forcing uncertainty and human water use on global and continental water balance components. Proc. Int. Assoc. Hydrol. Sci. 2016, 374, 53–62. [Google Scholar] [CrossRef] [Green Version]
- Müller Schmied, H.; Eisner, S.; Franz, D.; Wattenbach, M.; Portmann, F.T.; Flörke, M.; Döll, P. Sensitivity of simulated global-scale freshwater fluxes and storages to input data, hydrological model structure, human water use and calibration. Hydrol. Earth Syst. Sci. 2014, 18, 3511–3538. [Google Scholar] [CrossRef] [Green Version]
- Tong, X.P.; Schmidt, D. Active movement of the Cascade landslide complex in Washington from a coherence-based InSAR time series method. Remote Sens. Environ. 2016, 186, 405–415. [Google Scholar] [CrossRef]
- Xu1, X.; Sandwell, D.T.; Tymofyeyeva, E.; González-Orteg, A.; Tong, X. Tectonic and Anthropogenic Deformation at the Cerro Prieto Geothermal Step-over Revealed by Sentinel-1 InSAR. IEEE Trans. Geosci. Remote Sens. 2017, 55, 5284–5292. [Google Scholar]
- Tymofyeyeva, E.; Fialko, Y. Mitigation of atmospheric phase delays in InSAR data, with application to the eastern California shear zone. J. Geophys. Res.-Sol. Eath 2015, 120, 5952–5963. [Google Scholar] [CrossRef]
- Sentinel, E. User Handbook; European Space Agency: Paris, France, 2013. [Google Scholar]
- Farr, T.G.; Rosen, P.A.; Caro, E.; Crippen, R.; Duren, R.; Hensley, S.; Kobrick, M.; Paller, M.; Rodriguez, E.; Roth, L. The shuttle radar topography mission. Rev. Geophys. 2007, 45. [Google Scholar] [CrossRef]
- Sandwell, D.; Mellors, R.; Tong, X.; Wei, M.; Wessel, P. GMTSAR: An InSAR Processing System Based on Generic Mapping Tools. Available online: http://escholarship.org/uc/item/8zq2c02m (accessed on 6 August 2018).
- Chen, C.W.; Zebker, H.A. Phase unwrapping for large SAR interferograms: Statistical segmentation and generalized network models. IEEE Trans. Geosci. Remote 2002, 40, 1709–1719. [Google Scholar] [CrossRef]
- Liu, P.; Li, Q.; Li, Z.; Hoey, T.; Liu, G.; Wang, C.; Hu, Z.; Zhou, Z.; Singleton, A. Anatomy of subsidence in Tianjin from time series InSAR. Remote Sens.-Basel 2016, 8, 266. [Google Scholar] [CrossRef]
- Xie, Y.; Huang, S.; Liu, S.; Leng, G.; Peng, J.; Huang, Q.; Li, P. GRACE-Based Terrestrial Water Storage in Northwest China: Changes and Causes. Remote Sens.-Basel 2018, 10, 1163. [Google Scholar] [CrossRef]
- Sen, P.K. Estimates of the regression coefficient based on Kendall’s tau. J. Am. Stat. Assoc. 1968, 63, 1379–1389. [Google Scholar] [CrossRef]
- Al-Basrawi, N.H.; Awad, J.H.; Hussain, T.A. Evaluation of the Ground Water in Baghdad Governorate/Iraq. Iraqi J. Sci. 2015, 56, 1708–1718. [Google Scholar]
- Al-Ansari, N. Management of water resources in Iraq: Perspectives and prognoses. Engineering 2013, 5, 667–684. [Google Scholar] [CrossRef]
- Al-Shahrabaly, Q.M. River Discharges for Tigris and Euphrates Gauging Stations; Ministry of Water Resources: Baghdad, Iraq, 2008. (In Arabic) [Google Scholar]
- Luo, T.; Young, R.; Reig, P. Aqueduct Projected Water Stress Country Rankings; World Resources Institute: Washington, DC, USA, 2015. [Google Scholar]
Figure 1.
Water risk in the Tigris–Euphrates basin (TEB) based on different indicators (baseline water stress, drought severity, interannual variability, and groundwater stress) obtained by linear aggregation in the Aqueduct tool [15]. The white lines mark the political boundaries, the black polygon indicates the basin boundaries, and the dark blue lines show the Tigris and Euphrates rivers. The blue rectangle represents the Sentinel-1 (path 72 and frame 106) of an ascending orbit.

Figure 2.
The perpendicular baseline of 96 interferograms (black lines) used in the Small Baseline Subset (SBAS) stacking of 31 of Sentinel-a images (red circle).
Figure 2.
The perpendicular baseline of 96 interferograms (black lines) used in the Small Baseline Subset (SBAS) stacking of 31 of Sentinel-a images (red circle).

Figure 3.
Groundwater storage estimates in the whole Tigris–Euphrates basin (TEB) obtained by applying Equations (1)–(3). In the upper panel, the groundwater storage (GWS) was obtained by removing the soil moisture and snow signals from the NOAH-3.3 model. The GWS is shown in red with its corresponding uncertainty. Similarly, in the lower panel, the GWS was calculated by removing the surface water, snow, and soil moisture signals from the GRACE-TWS. GRACE-GWS is compared with the WGHM-GWS for natural simulations (green line) and natural and human simulations (red lines). The long-term trend (black dashed lines) is the same in the two models—that is, approximately −9.93 mm/year calculated by the Sen slope at the 95% confidence interval and p-value < 0.0001.

Figure 4.
(a) The spatial variations of the TWS and (b) groundwater storage (GWS) trends from 2003 to 2017 in TEB using Equations (1)–(3) for the WGHM model. The black rectangle shows the Sentinel-1 scene. The significant trend is marked by black dots based on p-value < 0.0001.
Figure 4.
(a) The spatial variations of the TWS and (b) groundwater storage (GWS) trends from 2003 to 2017 in TEB using Equations (1)–(3) for the WGHM model. The black rectangle shows the Sentinel-1 scene. The significant trend is marked by black dots based on p-value < 0.0001.

Figure 5.
Cumulative vertical displacements between 2015 to 2018 in the central part of the Tigris–Euphrates basin (TEB).
Figure 5.
Cumulative vertical displacements between 2015 to 2018 in the central part of the Tigris–Euphrates basin (TEB).

Figure 6.
(a) Continuous wavelet transform (CWT) power of the groundwater storage (GWS) change volume time series; (b) CWT of displacements. (c) Cross-wavelet transforms (XWT) of the GWS and displacements (d) wavelet coherence (WTC) of ΔGWS and displacements.
Figure 6.
(a) Continuous wavelet transform (CWT) power of the groundwater storage (GWS) change volume time series; (b) CWT of displacements. (c) Cross-wavelet transforms (XWT) of the GWS and displacements (d) wavelet coherence (WTC) of ΔGWS and displacements.


Table 1.
List of Sentinel-1A images used in this study. PBL is the parallel baseline, and PPBL is the perpendicular baseline of the satellite in meter.
Table 1.
List of Sentinel-1A images used in this study. PBL is the parallel baseline, and PPBL is the perpendicular baseline of the satellite in meter.
| Date | PBL (m) | PPBL (m) |
|---|---|---|
| 2015.05.26 | 0.00 | 0.00 |
| 2015.06.07 | 19.41 | 6.72 |
| 2015.06.19 | 71.91 | 105.48 |
| 2015.07.13 | 72.54 | 124.01 |
| 2015.07.25 | 15.69 | −27.02 |
| 2015.08.18 | 45.56 | 75.30 |
| 2015.11.22 | 71.82 | 109.82 |
| 2015.12.16 | 66.46 | 107.44 |
| 2016.01.09 | 76.53 | 160.95 |
| 2016.02.02 | 51.28 | 102.53 |
| 2016.03.21 | 58.83 | 75.62 |
| 2016.04.14 | 45.73 | 10.76 |
| 2016.05.20 | 125.45 | 145.82 |
| 2016.06.13 | 41.98 | 32.23 |
| 2016.07.07 | 78.92 | 70.49 |
| 2016.09.17 | 120.16 | 131.20 |
| 2016.09.29 | 93.99 | 111.05 |
| 2016.10.23 | 10.86 | 31.45 |
| 2016.11.04 | 30.30 | 71.45 |
| 2017.11.29 | 36.82 | 96.68 |
| 2017.12.11 | 19.12 | 77.74 |
| 2017.12.23 | 15.12 | 69.71 |
| 2018.01.04 | 49.60 | 125.45 |
| 2018.01.16 | 67.80 | 143.60 |
| 2018.01.28 | 74.42 | 151.14 |
| 2018.02.09 | 44.62 | 103.60 |
| 2018.02.21 | 45.66 | 97.30 |
| 2018.03.05 | 31.60 | 76.26 |
| 2018.03.17 | 75.01 | 131.62 |
| 2018.03.29 | 88.12 | 145.53 |
| 2018.04.10 | 38.63 | 52.36 |
© 2019 by the authors. Licensee MDPI, Basel, Switzerland. This article is an open access article distributed under the terms and conditions of the Creative Commons Attribution (CC BY) license (http://creativecommons.org/licenses/by/4.0/).
Share and Cite
MDPI and ACS Style
Rateb, A.; Kuo, C.-Y. Quantifying Vertical Deformation in the Tigris–Euphrates Basin Due to the Groundwater Abstraction: Insights from GRACE and Sentinel-1 Satellites. Water 2019, 11, 1658. https://doi.org/10.3390/w11081658
AMA Style
Rateb A, Kuo C-Y. Quantifying Vertical Deformation in the Tigris–Euphrates Basin Due to the Groundwater Abstraction: Insights from GRACE and Sentinel-1 Satellites. Water. 2019; 11(8):1658. https://doi.org/10.3390/w11081658
Chicago/Turabian StyleRateb, Ashraf, and Chung-Yen Kuo. 2019. "Quantifying Vertical Deformation in the Tigris–Euphrates Basin Due to the Groundwater Abstraction: Insights from GRACE and Sentinel-1 Satellites" Water 11, no. 8: 1658. https://doi.org/10.3390/w11081658
Note that from the first issue of 2016, this journal uses article numbers instead of page numbers. See further details here.