Site Assessment for MAR through GIS and Modeling in West Coast, South Africa


Department of Earth Sciences, University of the Western Cape, Cape Town 7530, South Africa
*
Author to whom correspondence should be addressed.
Water 2019, 11(8), 1646; https://doi.org/10.3390/w11081646
Submission received: 30 June 2019
/
Revised: 5 August 2019
/
Accepted: 6 August 2019
/
Published: 9 August 2019
(This article belongs to the Special Issue Managed Aquifer Recharge—Enhancing the Use of Alternative Water Sources for Subsurface Storage and Soil Aquifer Treatment)
Abstract
:Towns along the West Coast of South Africa are facing water shortages due to climate change and increasing water demand. Managed aquifer recharge (MAR) is considered as a solution to improve water security. This paper presents a two-step method of combining geographic information system (GIS) based analysis with numerical modeling to select suitable sites for implementing MAR in the West Coast area. Many factors were taken into account to generate the initial map for suitable sites through GIS based analysis. Subsequently, groundwater flow modeling was adopted to verify and optimize the suitable sites selected by GIS based analysis. The result showed that the map for suitable sites produced by the GIS based analysis was reasonable from a spatial aspect, but due to the lack of groundwater seepage information, the most suitable sites developed are not necessarily the optimal choices in practice. With the aid of both the spatial analysis in GIS and seepage simulation, this two-step analysis approach provides a reliable solution to identify suitable sites for implementing MAR. This approach provides a much better reference to the study of suitable sites and possible impacts of implementing MAR in an aquifer in similar areas with water stress.
1. Introduction
Due to climate change, rapid urbanization, and population expansion, the water demand and supply is showing increasing fluctuations, especially in the drought-prone areas of arid or semi-arid regions [1]. One of the most important water resource management strategies to improve water security in these drought-prone areas is managed aquifer recharge (MAR) [2,3]. MAR was developed to recharge groundwater purposefully and increase its storage to overcome the temporal imbalance between local water demand and availability, thus improving water security of the water supply.
The towns along the West Coast area of South Africa have been confronted with water shortages due to extreme drought weather conditions since 2014. Under great pressure from increasing water demand and decreasing water availability, the West Coast District Municipality (WCDM), together with the Department of Water Affairs of South Africa (DWA), plans to implement MAR in the West Coast area with water from the Berg River and other sources in the rainy season. In fact, given the increasing water demand at the rapidly growing holiday and residential status of the Langebaan Lagoon area, the plan of implementing MAR in this drought-prone area was first initiated in 2007 [4]. Subsequently, two borehole injection trials were conducted directly in the aquifers between September 2008 and March 2009 [5]. However, in order to eliminate the high cost of pipeline construction, the injection borehole was drilled in the WCDM well field instead of at ideal sites. Two weeks after the injection, several boreholes in the downstream area were over flowing [6], which showed that the injection recharge at the WCDM well field failed to keep water stored underground as initially expected. Therefore, despite the fact that several attempts on MAR have been conducted in the aquifers of the West Coast, the issue of suitable sites, which are of utmost importance for the correct functioning of the MAR system, is still unknown [5,6].
The assessment of suitable sites, which has been defined as the evaluation of a variety of needs for the prospective location and the suggestion of an area on the basis of a proper assessment of the land, is the main issue and the prime prerequisite for a MAR scheme [7]. Many factors need to be considered during the site selection process such as complex regional characteristics, heterogeneities in surface and/or subsurface characteristics, variable groundwater qualities, and other factors including political, social, and economic factors, which make the site assessment for MAR a challenge [8,9]. Computational tools play an important role in evaluating MAR scenarios and screening potential sites, particularly because they can be applied on regional spatial scales, and allow for the testing of operational scenarios, hydrologic conditions, and other management options [10]. GIS based integration of spatial data pertinent to groundwater recharge has widely been applied to case studies, with data coverage being classified and weighted before generating suitable sites map [11,12,13,14]. However, the initial GIS based integration method is weak in dealing with uncertainty and risks, therefore there is a large possibility of losing important information, which in turn may lead to poor decisions [15]. Several efforts have been made to improve the GIS based integration method by incorporating the knowledge of Fuzzy Mathematics or Operational Research into the process of GIS analysis. Malekmohammadi et al. [16] developed a method involving the integration of a multi-criteria decision making tool, GIS, and a fuzzy inference system, which was considered to be an effective method in MAR site selection. Rahman et al. [9] developed a spatial multi-criteria decision analysis software tool, which was based on the combination of non-compensatory screening, criteria standardization and weighting, and the analytical hierarchy process with weighted linear combination and ordered weighted averaging, and obtained a reasonably suitable site map for MAR when applied to the Querença Silves Aquifer of Portugal. Aside from the GIS based methods, numerical modeling can also help to identify suitable sites for MAR, and can be used to estimate the potential benefits of MAR projects on regional hydrologic conditions under a range of future climate, water use, and management scenarios [17]. Groundwater flow and transport models are applied to plan and optimize MAR facilities, quantify the impact on the local groundwater, and determine geochemical processes and the resulting recovery efficiency as well as to evaluate the feasibility of a MAR method at a suggested site [18,19,20].
Based on the above-mentioned literature review, the GIS based method seems to have a strong spatial data analysis ability, but is weak in dealing with uncertainty and risks. Although several efforts have been made with some progress achieved by incorporating fuzzy mathematics and other means, however, this method only provided a preliminary result without verification. Groundwater modeling is able to evaluate the advantages and disadvantages of implementing MAR at a proposed location when combined with specific scenarios. The application of GIS based analysis and modeling separately is well known, however, few studies (to the author’s knowledge) have been performed together to assess the suitable sites for implementing MAR [10,21]. Combining GIS based analysis with numerical modeling can allow a more detailed and quantitative assessment of MAR opportunities and impacts.
This study presents a two-step method of combining GIS based analysis with groundwater modeling to select the suitable sites for implementing MAR in the West Coast area of South Africa where MAR is planned as a solution to the water shortage problem.
2. Materials and Methodology
2.1. Study Area
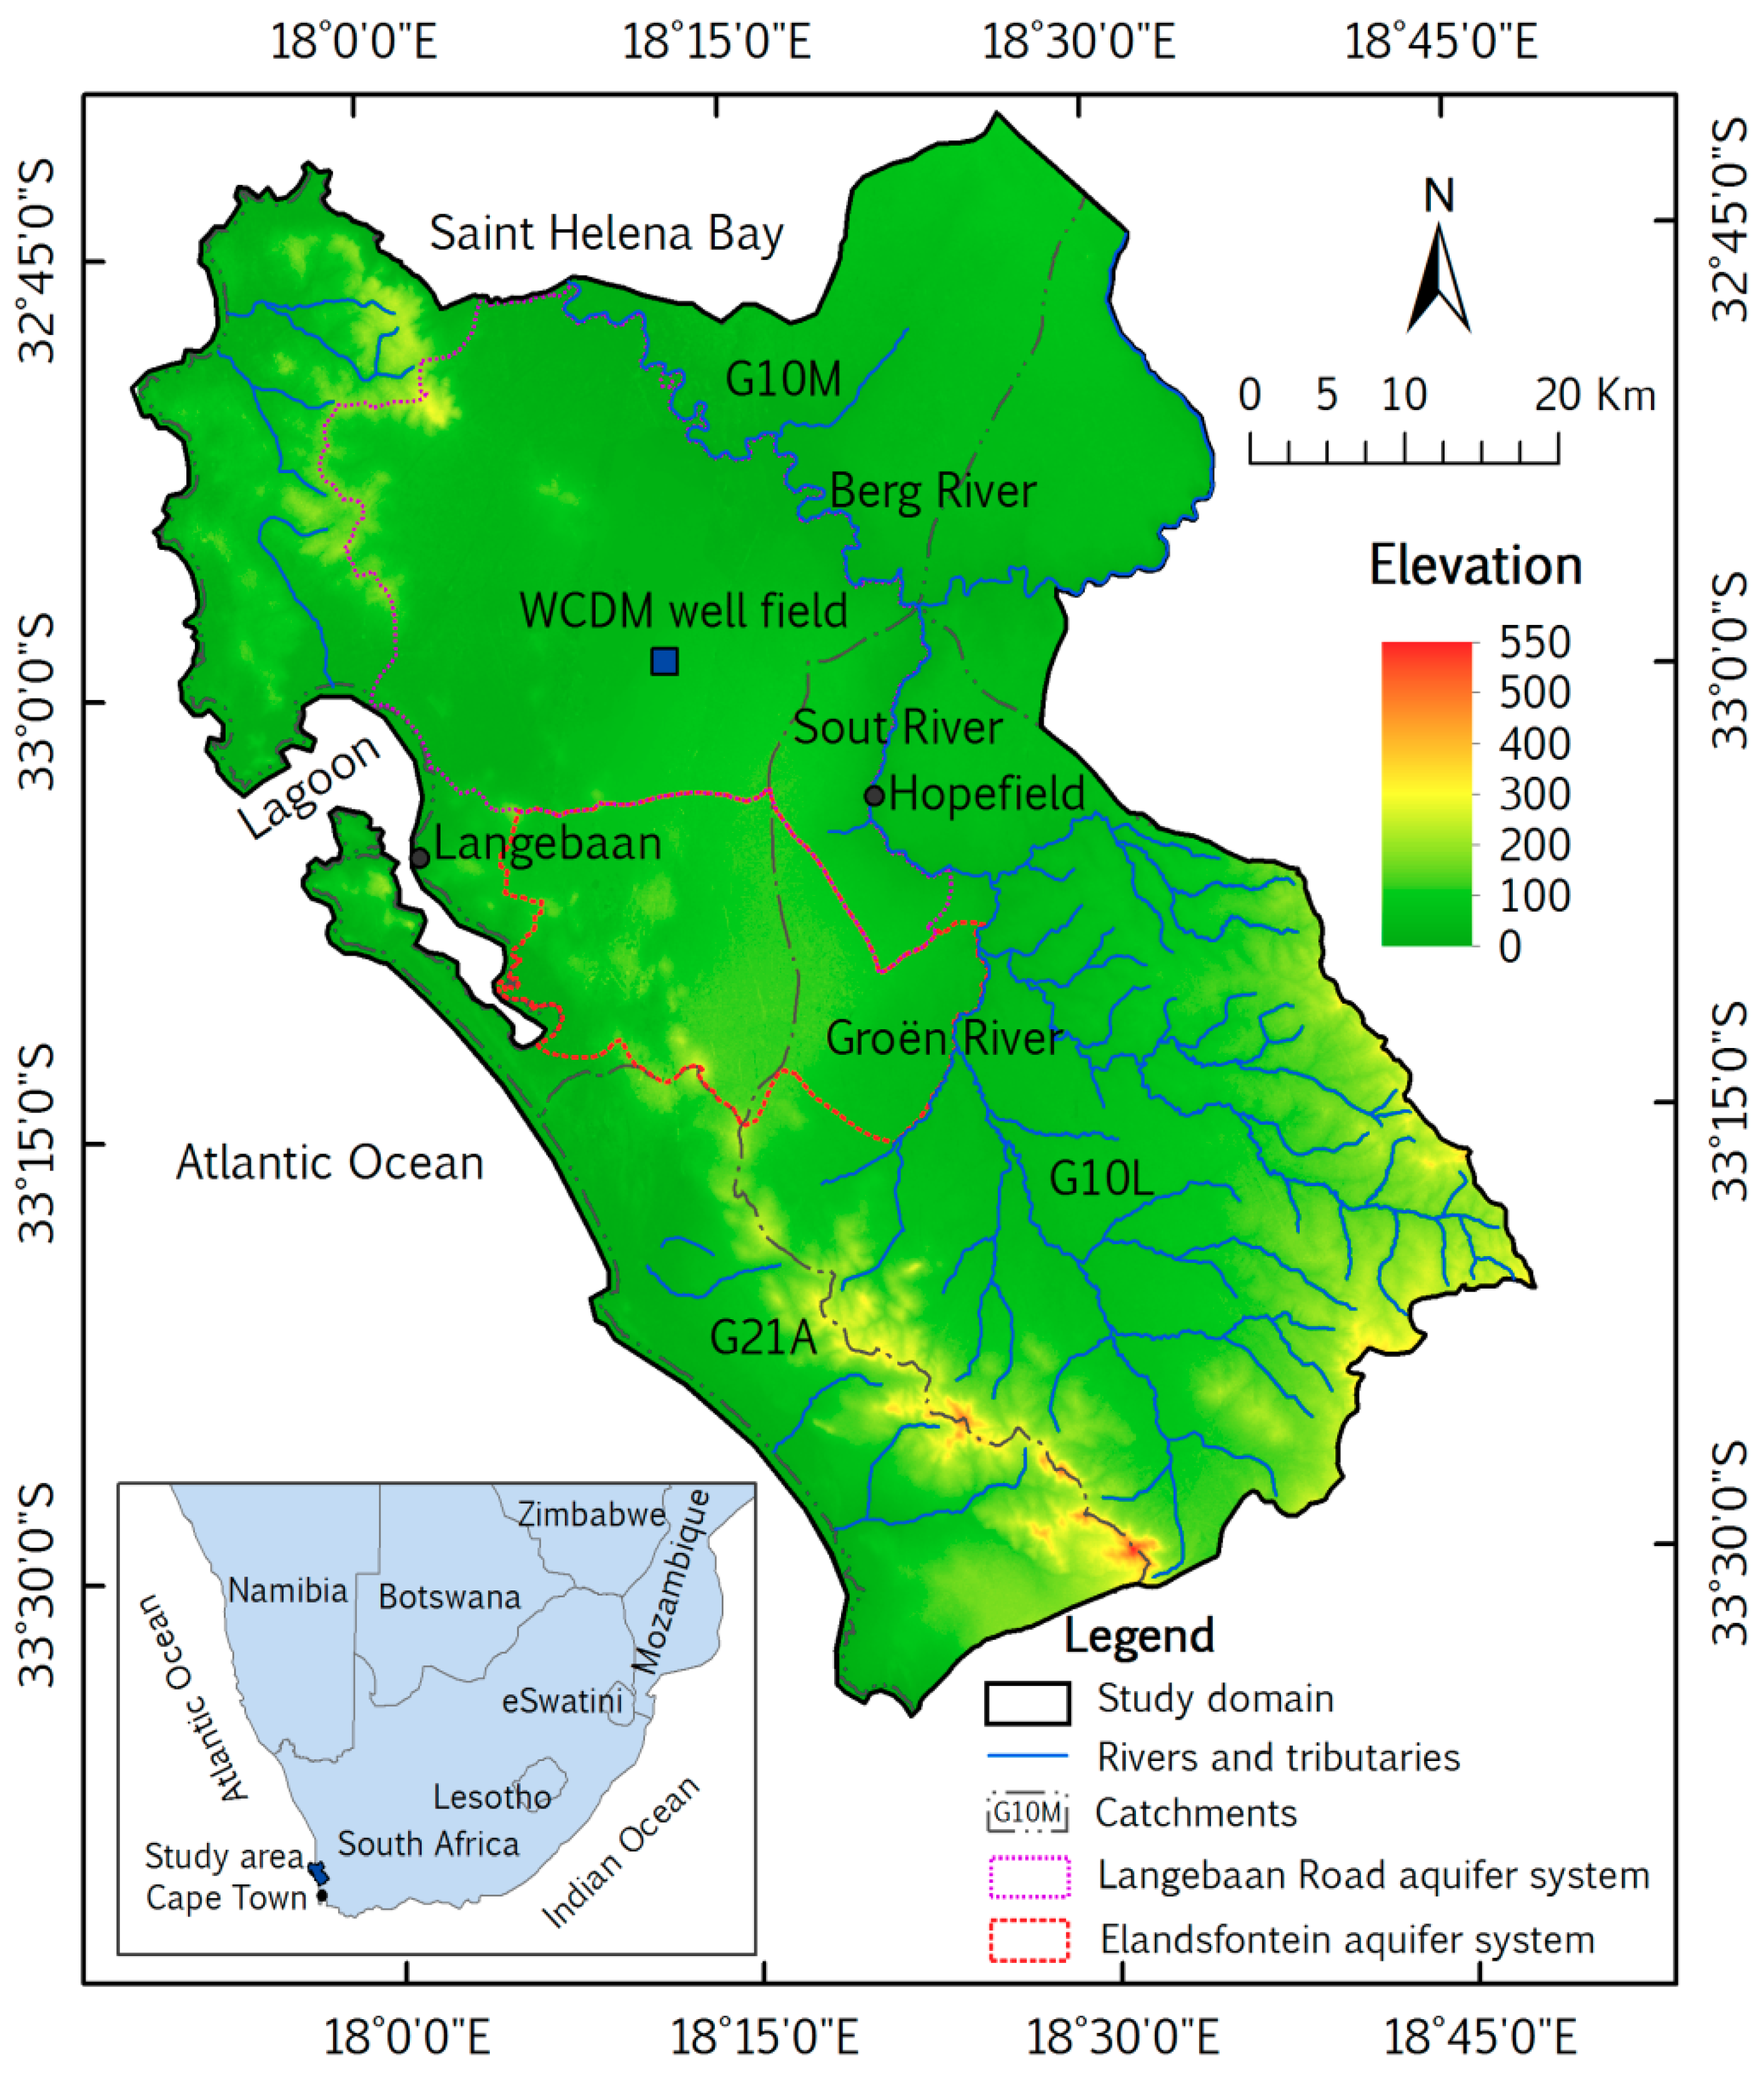
The study area is located between 17.8413°E and 18.7981°E and 33.5871°S and 32.6981°S along the West Coast of South Africa, which is about 100 km northwest of Cape Town city. The study area is composed of three catchments including G10M, G10L, and G21A, with the area of 4670 km2. The area is bounded to the northwest and west by the Atlantic Ocean. The Berg River is the dominant perennial river in the region, which drains north westward into the Atlantic Ocean at Saint Helena Bay.
The overall terrain is low in the north and high in the south, with the ground elevation ranging from 0 to 550 m above mean sea level (a.m.s.l). The dominant topography is the flat-lying plains of the Berg River with an elevation less than 100 m a.m.s.l (Figure 1). Intrusive granite pluton generating koppies reach up to 550 m a.m.s.l in the south of the study area. The land use is dominated by shrubland, low fynbos, and commercial cultivated land, which is followed by small built-up and industrial areas that occur in the small towns of the study area.
The climate in the region is considered Mediterranean, with mean annual potential evaporation exceeding mean annual precipitation [22]. The daily average temperature is about 17 °C. From 1970 to 2017, the average annual rainfall varied from 185 mm in the northwest to 450 mm in the south. The monthly average rainfall data indicates that the rainy season is from June to August.
The predominant geology of the region is the unconsolidated Cenozoic sediments of the Sandveld Group (Figure S1). The underlying bedrocks are the Malmesbury Group Shale in the east and the Vredenburg and Darling Plutons of the Cape Granite Suite in the west with the inferred contact between the granite and shale of study area coinciding with the Colenso Fault [23,24]. The Cenozoic Sandveld Group unconformably overlies the bedrock.
The Elandsfontyn Formation, which occurs only in bedrock depressions of palaeochannels, coincides with thick water-bearing sedimentary sequences that form the most important aquifers, namely the Langebaan Road aquifer system (LRAS) and Elandsfontein aquifer system (EAS) in the West Coast [25]. It is commonly accepted that aquifer systems are composed of four key units [22,26,27,28]:
- The upper unconfined aquifer unit (UAU): The variably consolidated sands and calcretes with the interbedded peat clay of the Sandveld Group (except for Elandsfontyn Formation) can be considered as a single unconfined aquifer at the regional scale.
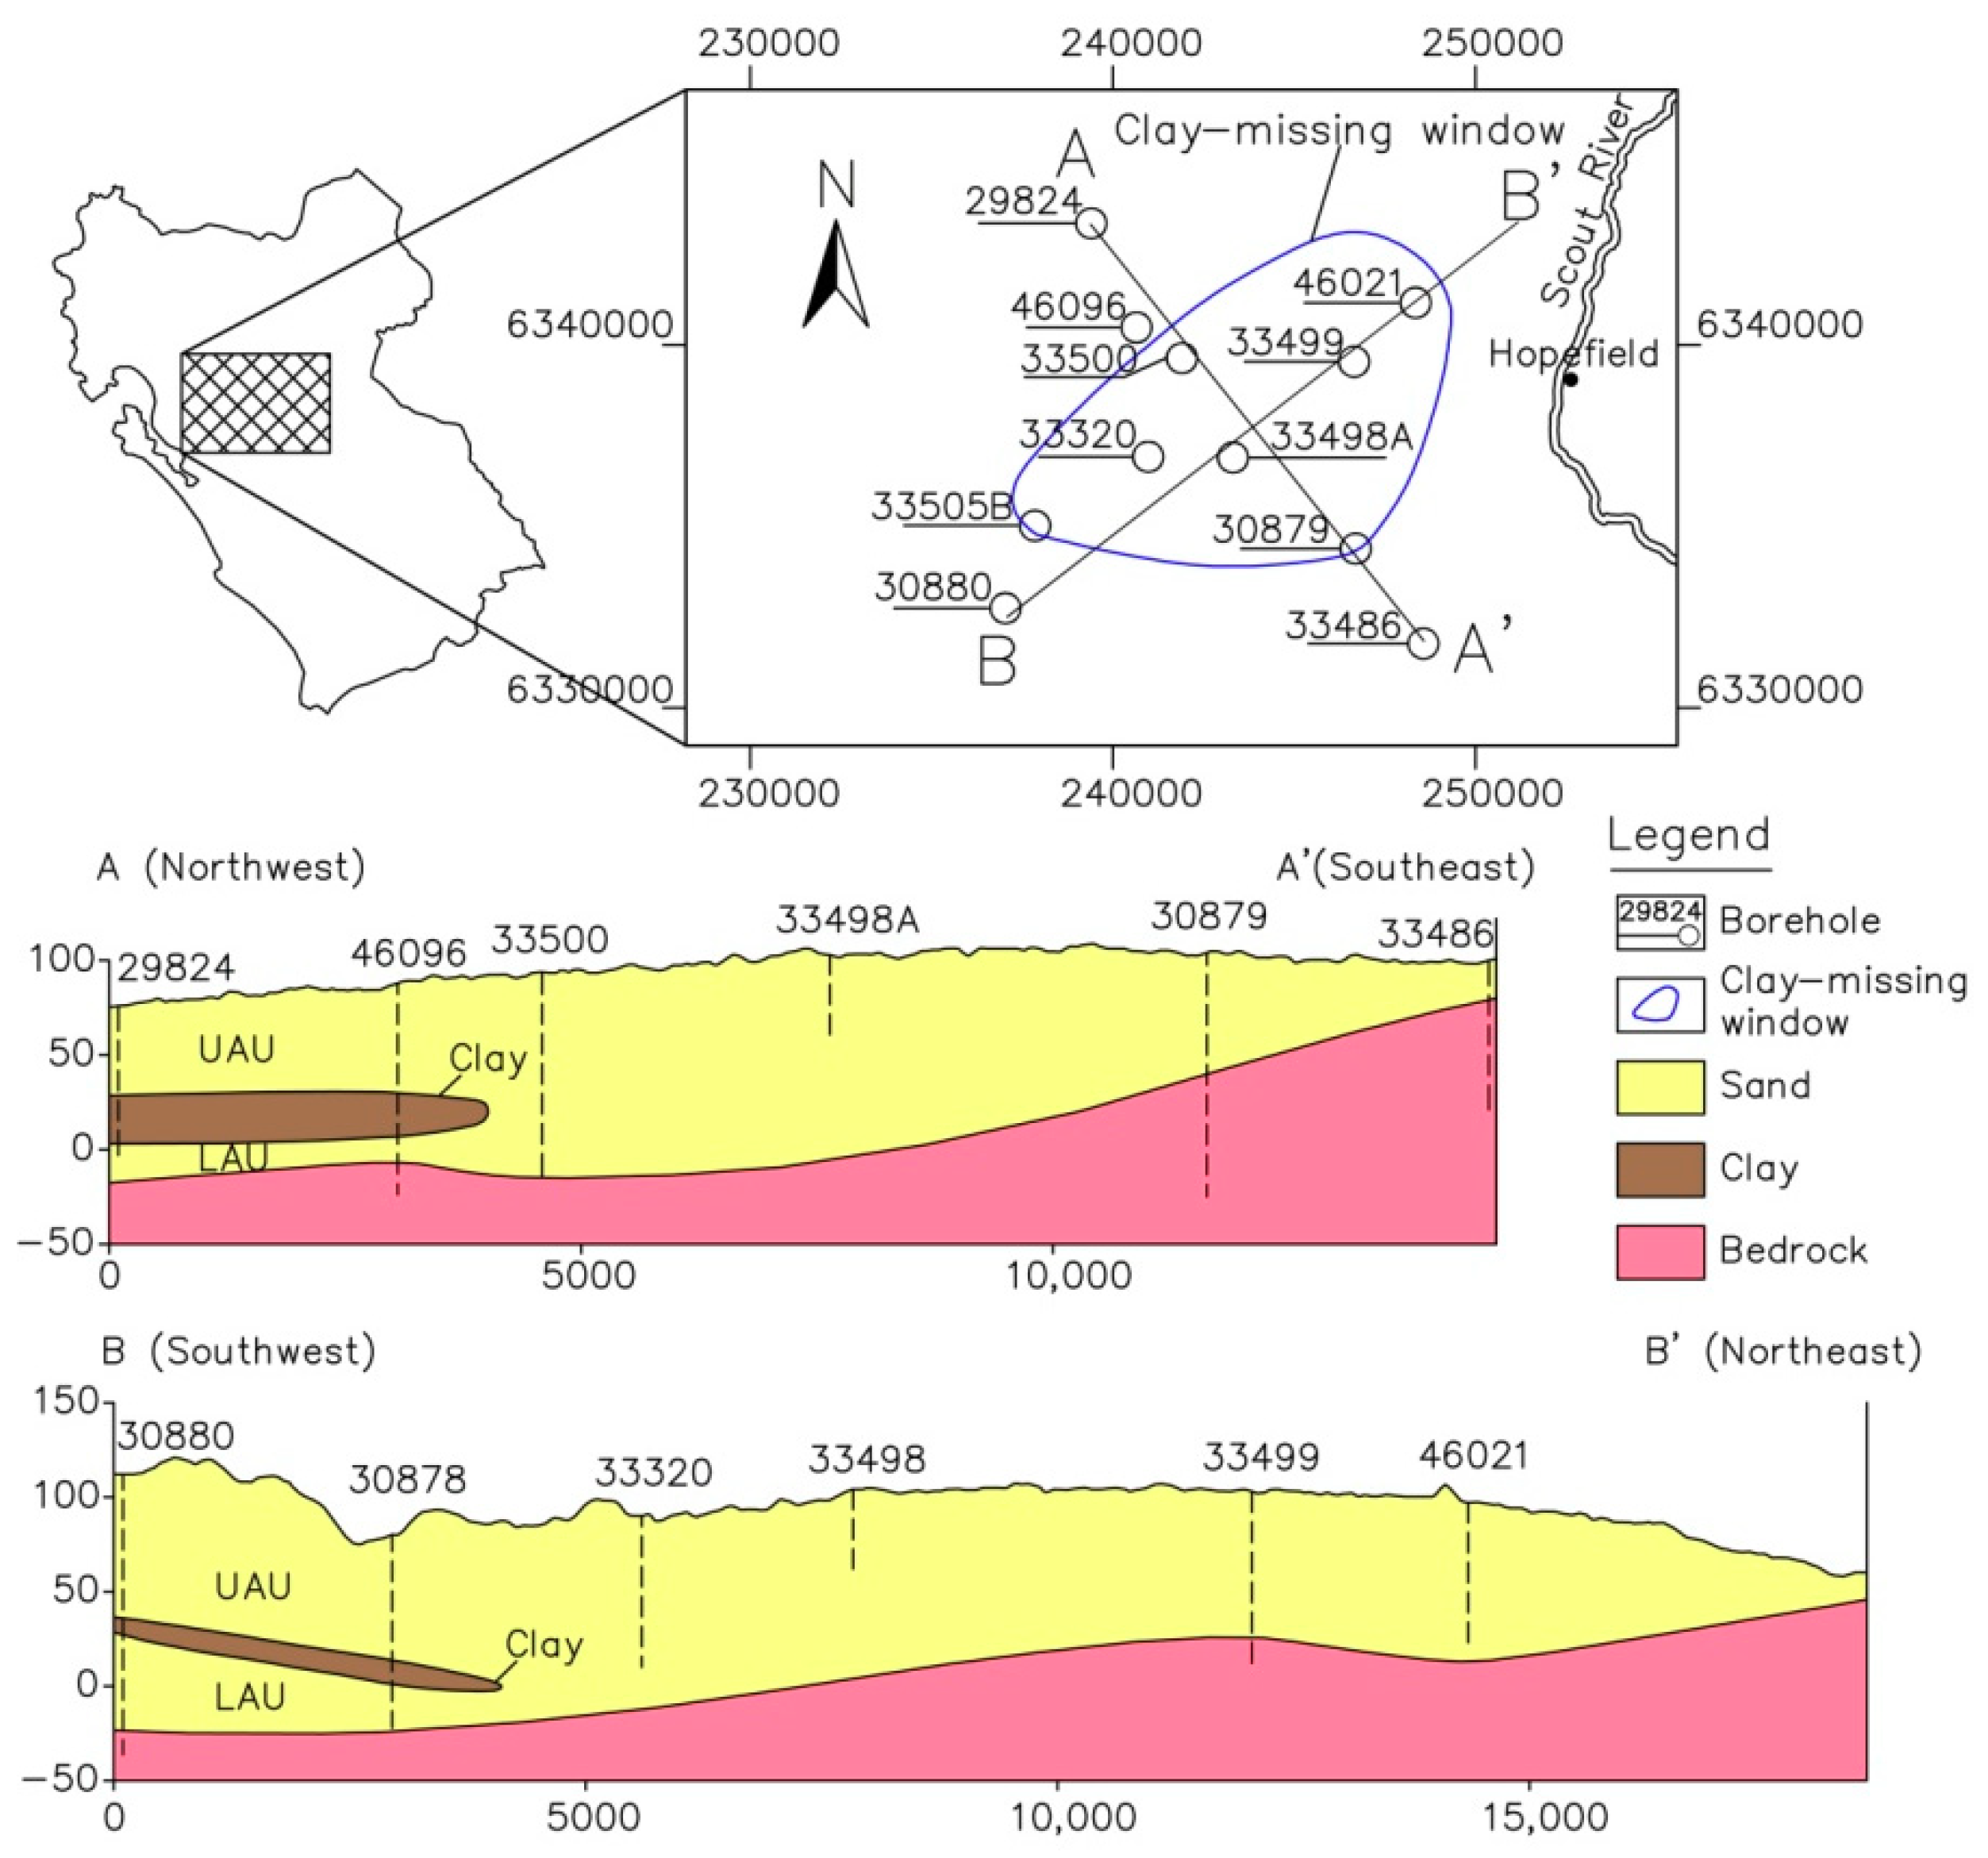
- The aquitard clay: The clay layer of the upper Elandsfontyn Formation acts as an aquitard to (semi) confine the basal gravels of the lower aquifer. Borehole logsheets from the National Groundwater Archive of South Africa (NGA) were used to piece together a map of the clay distribution, which was discontinuous. In particular, in the west of Hopefield, a “clay-missing window” existed (Figure 2).
- The (semi) confined lower aquifer unit (LAU): The LAU is composed of the basal gravels of the Elandsfontyn Formation. Due to the thickness (up to 60 m in some area) and large spatial extent of this aquifer unit, it is considered as the most important aquifer of the West Coast. However, the aquifer is restricted to palaeochannels based on its depositional environment.
- The bedrock: Compared with Cenozoic sediment aquifers, the bedrock is considered as regionally impermeable, although some limited areas are of potential higher permeability.
The UAU is recharged directly from precipitation. A recharged groundwater mound has been postulated within the three catchments of G10M, G10L, and G21A, southwest of Hopefield. Groundwater flow in the UAU is topographically controlled and occurs from the recharge mound to the Berg River or the coastline. The “clay- missing window” in the vicinity of the recharge mound would facilitate the downward percolation of the water into the LAU, then groundwater flows along the palaeochannels, and finally drains toward the Berg River or the coastline (Figure 3). Another significant way of discharge is abstraction through boreholes. Since municipal water supply targeting the LAU was significantly reduced after 2009 due to infrastructure vandalism, the abstraction mainly from the UAU recorded in the database was about 6.9 million m3/a by 78 registered private users.
According to the chemical analysis of the groundwater samples, the dominant water type was Na, Ca–Cl, with an average pH of 8. Electrical conductivity (EC) in the UAU is often over 250 mS/m, while the EC is commonly less than 120 mS/m in LAU.
The groundwater flow mechanisms of the LRAS and EAS are conceptualized in Figure 3.
Compared with the UAU, the LAU has better water quality, hence is a desirable target aquifer for MAR. However, a comparison of the monitoring groundwater table with the elevation of the top part of the clay layer in the vicinity of the clay-missing window (natural recharge area of LAU) showed that the groundwater piezometric surface was much higher than the top clay layer (the confining layer), which makes the idea of implementing a MAR directly to the LAU impractical. Therefore, in this paper, the research into the site assessment on MAR was assumed to target the UAU. Meanwhile, in order to eliminate the high cost of construction on the abstraction wells as well as pipelines, the implementation of MAR was assumed to be able to benefit the WCDM well field (Figure 1).
2.2. Methodology
As described above, the assessment approach aimed at suitable site selection for MAR is a two-step method composed of GIS based analysis and numerical modeling. The first step of the approach was to make use of GIS based techniques to produce an initial map of suitable sites. Subsequently, groundwater modeling was applied to verify and optimize the map of the suitable sites generated by step one. In order to keep the data consistent and ensure the reliability of the analysis, several datasets including topography, geology, groundwater, pumping wells, and other data used in the modeling must be those that were used or generated in the first step. If better results in terms of water level, flow paths, impact of a MAR scenario are obtained by running the simulation model in the recommended sites than those in other locations, then the suitable site map that is developed is deemed to be reliable. Otherwise, the map for suitable sites is considered unreliable. Thus, improvement on the GIS based analysis in step one is repeated until the map of the suitable sites is verified by meeting the set criteria. This assessment procedure is shown in Figure 4.
2.2.1. Step 1: GIS Based Analysis
In the site selection process, due to the fact that the volume of geographical data is huge and the analysis is very complex and time-consuming, the application of GIS will be inevitable [16]. Five sub-steps are included to serve as a reference for the basic method of GIS based analysis for the site suitability assessment of MAR.
1. Problem recognition
In a range of water resource management interventions, MAR has been proven to be an effective option. MAR is helpful for the recovery of groundwater levels, the improvement of groundwater quality, and for the storage of water and as a barrier against the intrusion of salinity. As problems differ from place to place, so do the techniques. Even if they are used for the same problems, the techniques required would vary from one case to another. A successful MAR scheme depends largely on the recognition of specific problems associated with a project.
2. Choice and hierarchy of criteria and subcriteria.
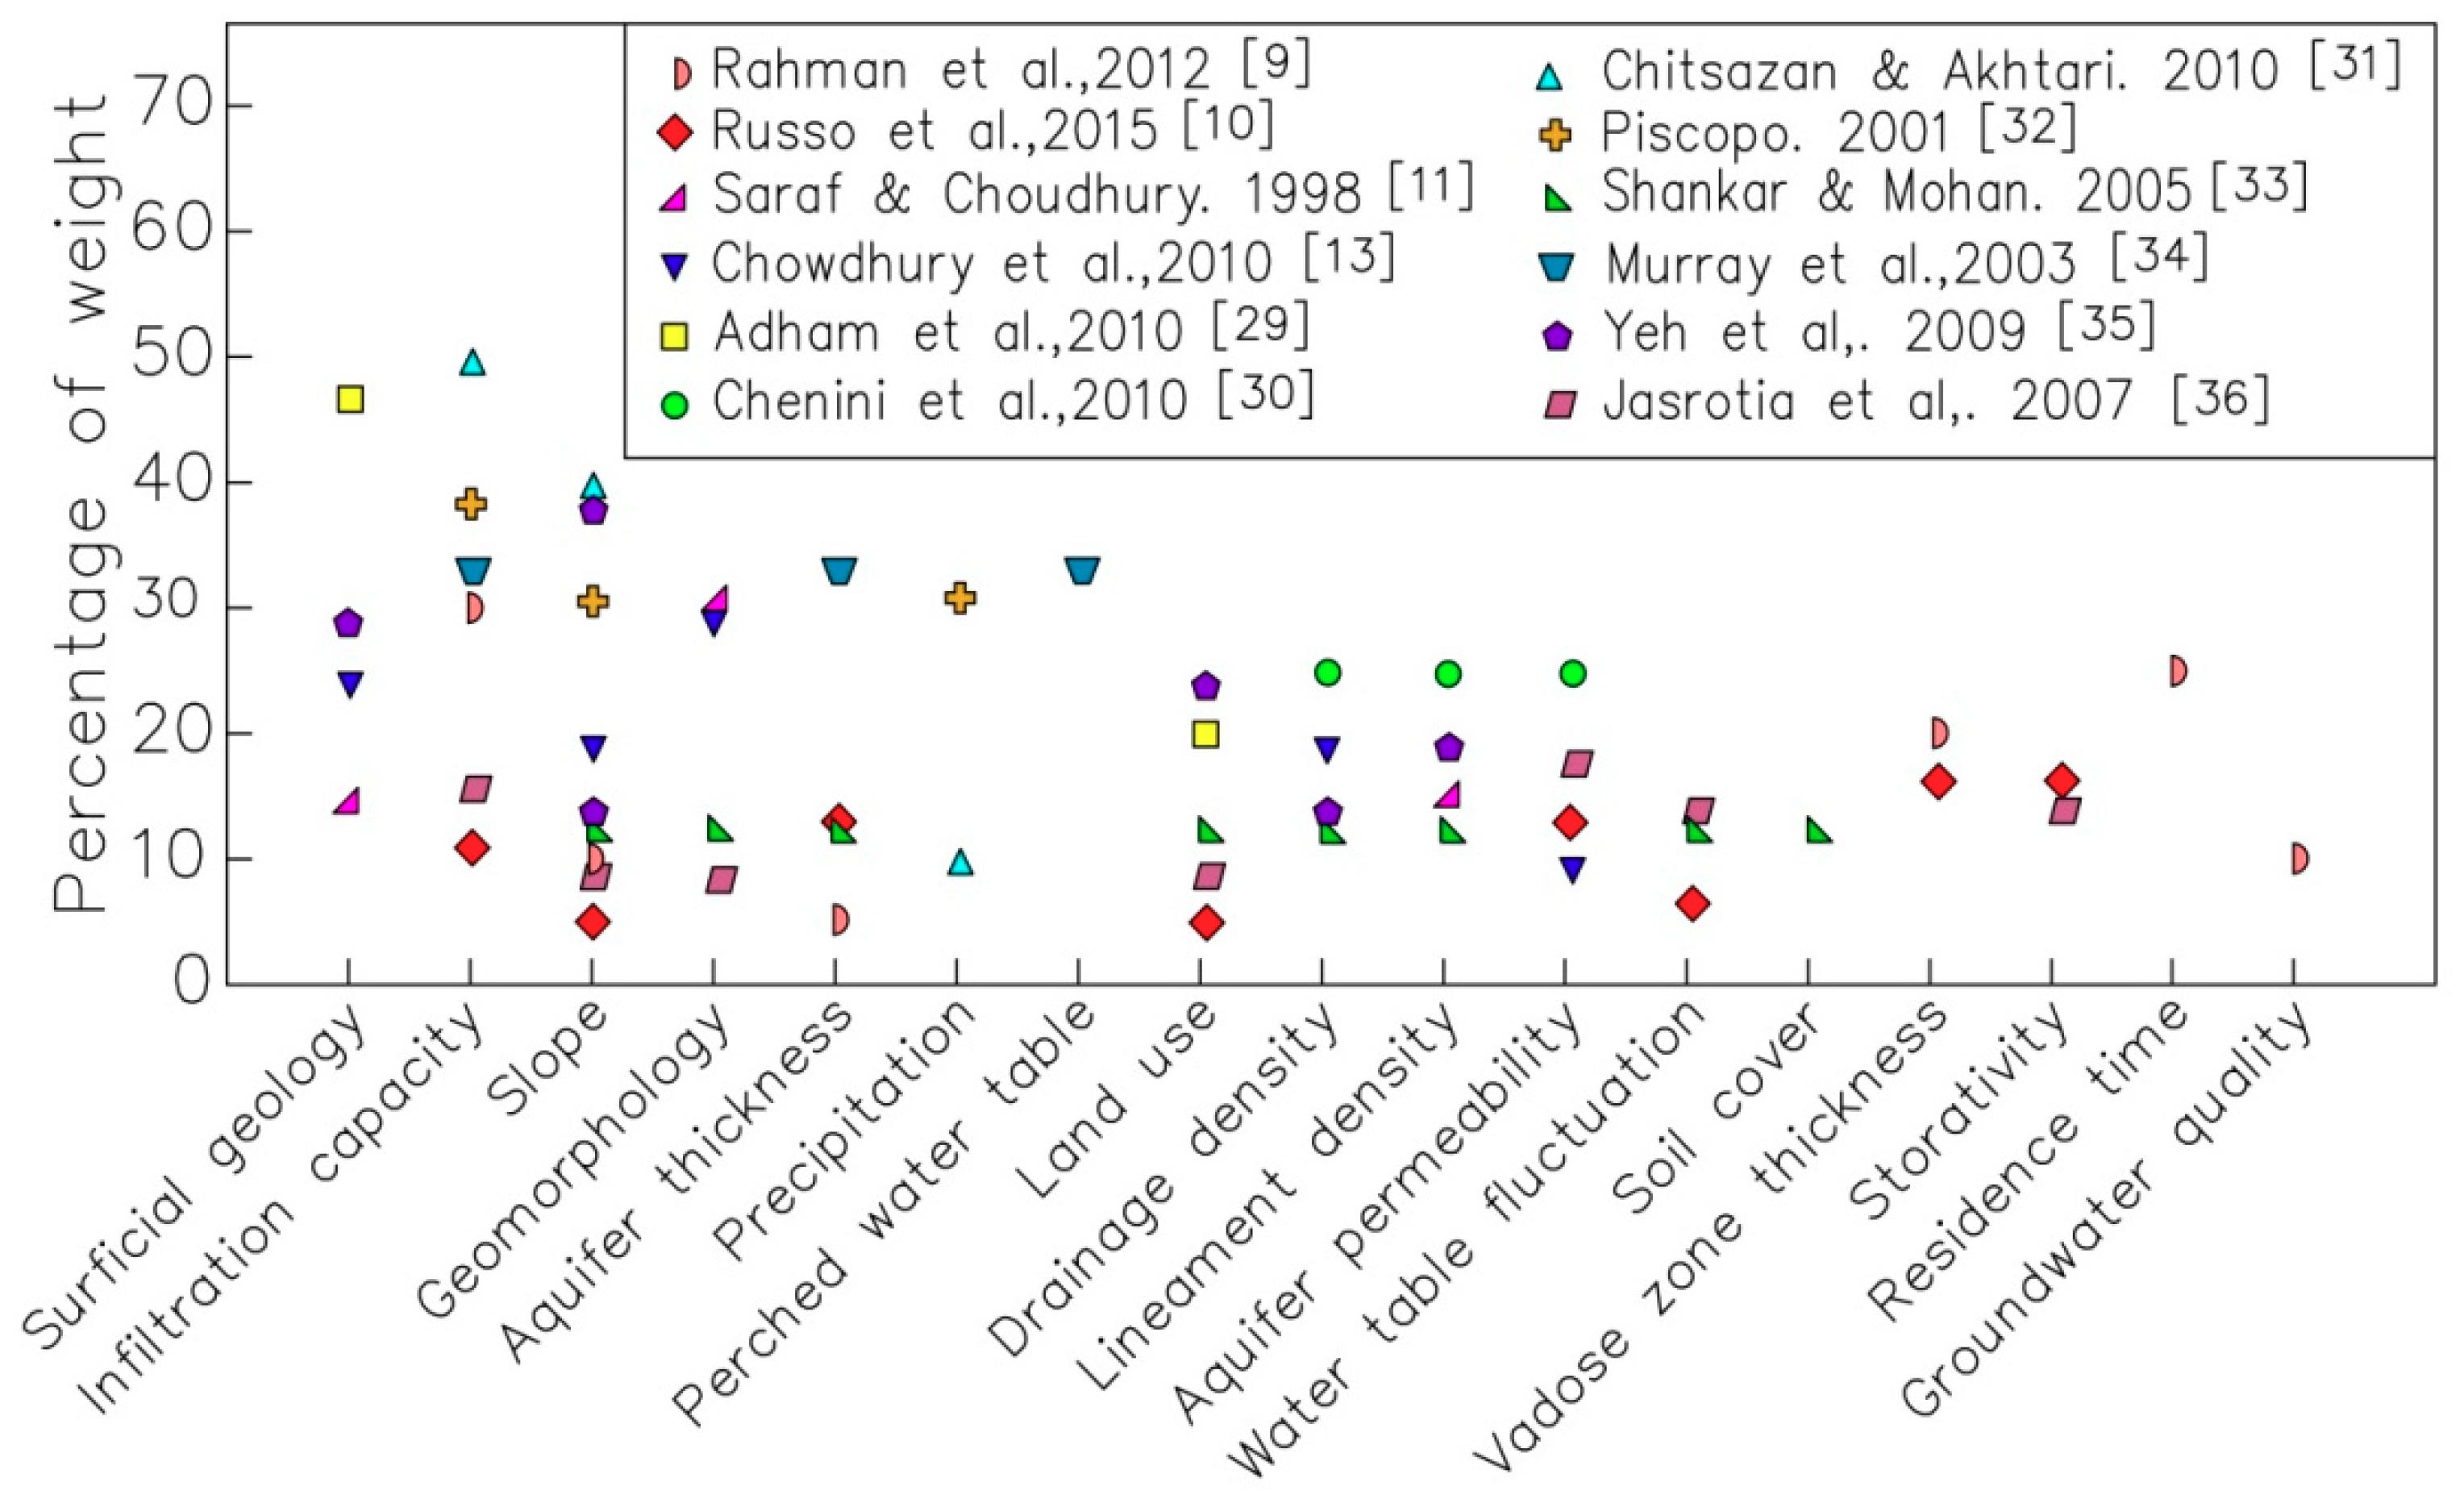
For any MAR site selection, different types of data are required. Considerations must be given to data availability and the objective of the analysis during the selection data of the type. The choice of datasets is divergent from case to case [9,10,11,29,30,31,32,33,34,35,36,37], however, the primary data adopted include surficial geology (Figure S1), soil infiltration capacity, land use (Figure S2), elevation (topographic slope, Figure S3), verified (measured) infiltration and recharge rates from observational studies (Figure S6), aquifer thickness (Figure S4), aquifer hydraulic conductivity, aquifer storativity, residence time, vadose zone thickness (Figure S5), historical changes in water table elevation, and groundwater quality (Figure 5).
These datasets have proven to be functional in previous studies. However, due to the internal relationship between themselves, a good result cannot be expected by simply combining them together. The analytical hierarchy process (AHP), introduced by Saaty [38], has proven to be useful for spatial decision problems with a large number of criteria [39]. It can be used to combine all the representative criteria into a “criteria tree”, with different levels of priorities accordingly [9,13,40,41]. Therefore, AHP was introduced to assist the choice criteria and weight determination to improve the accuracy of GIS based analysis. The application of AHP involves the decomposition of the ultimate goal into a three-level hierarchy consisting of subcriteria of the goal. The top of the hierarchy is the goal of the analysis, relating to the “suitable sites map”. The middle level contains more specific criteria with regard to the objective, and the bottom level refers to the most specific criteria, which are related to the main criteria in the middle level.
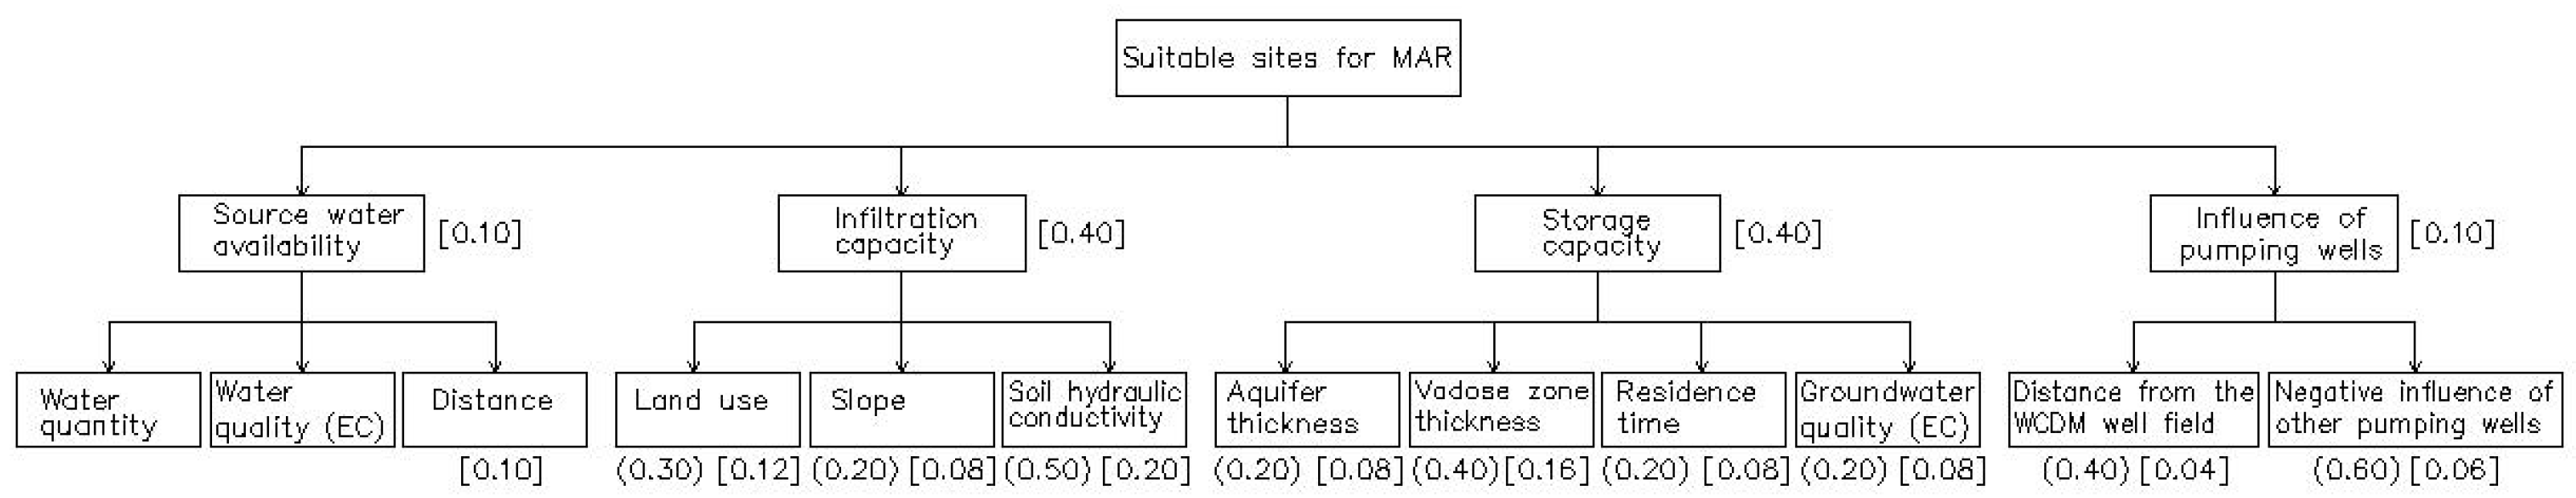
High MAR suitability means that if a water supply of sufficient quantity and quality is available, the surface and subsurface conditions are likely to be favorable for developing a MAR project [10]. Accordingly, criteria including source water availability, infiltration capacity, and storage capacity are taken into account as the middle level. In light of the presence of abstraction wells in the study area, the influence of pumping wells was considered as a criterion of the middle level. For the most specific subcriteria level, source water quantity, water quality, and distance were chosen to support the source water availability analysis; land use, slope, and soil hydraulic conductivity were adopted to support the infiltration capacity analysis; the aquifer thickness, vadose zone thickness, residence time and ground water quality were taken into account to support the storage capacity analysis based on the assumption that the storativity of aquifer is constant; and the distance from the WCDM well field as well as negative influence of other pumping wells were considered to support the influence of pumping wells.
3. Standardization of subcriteria maps
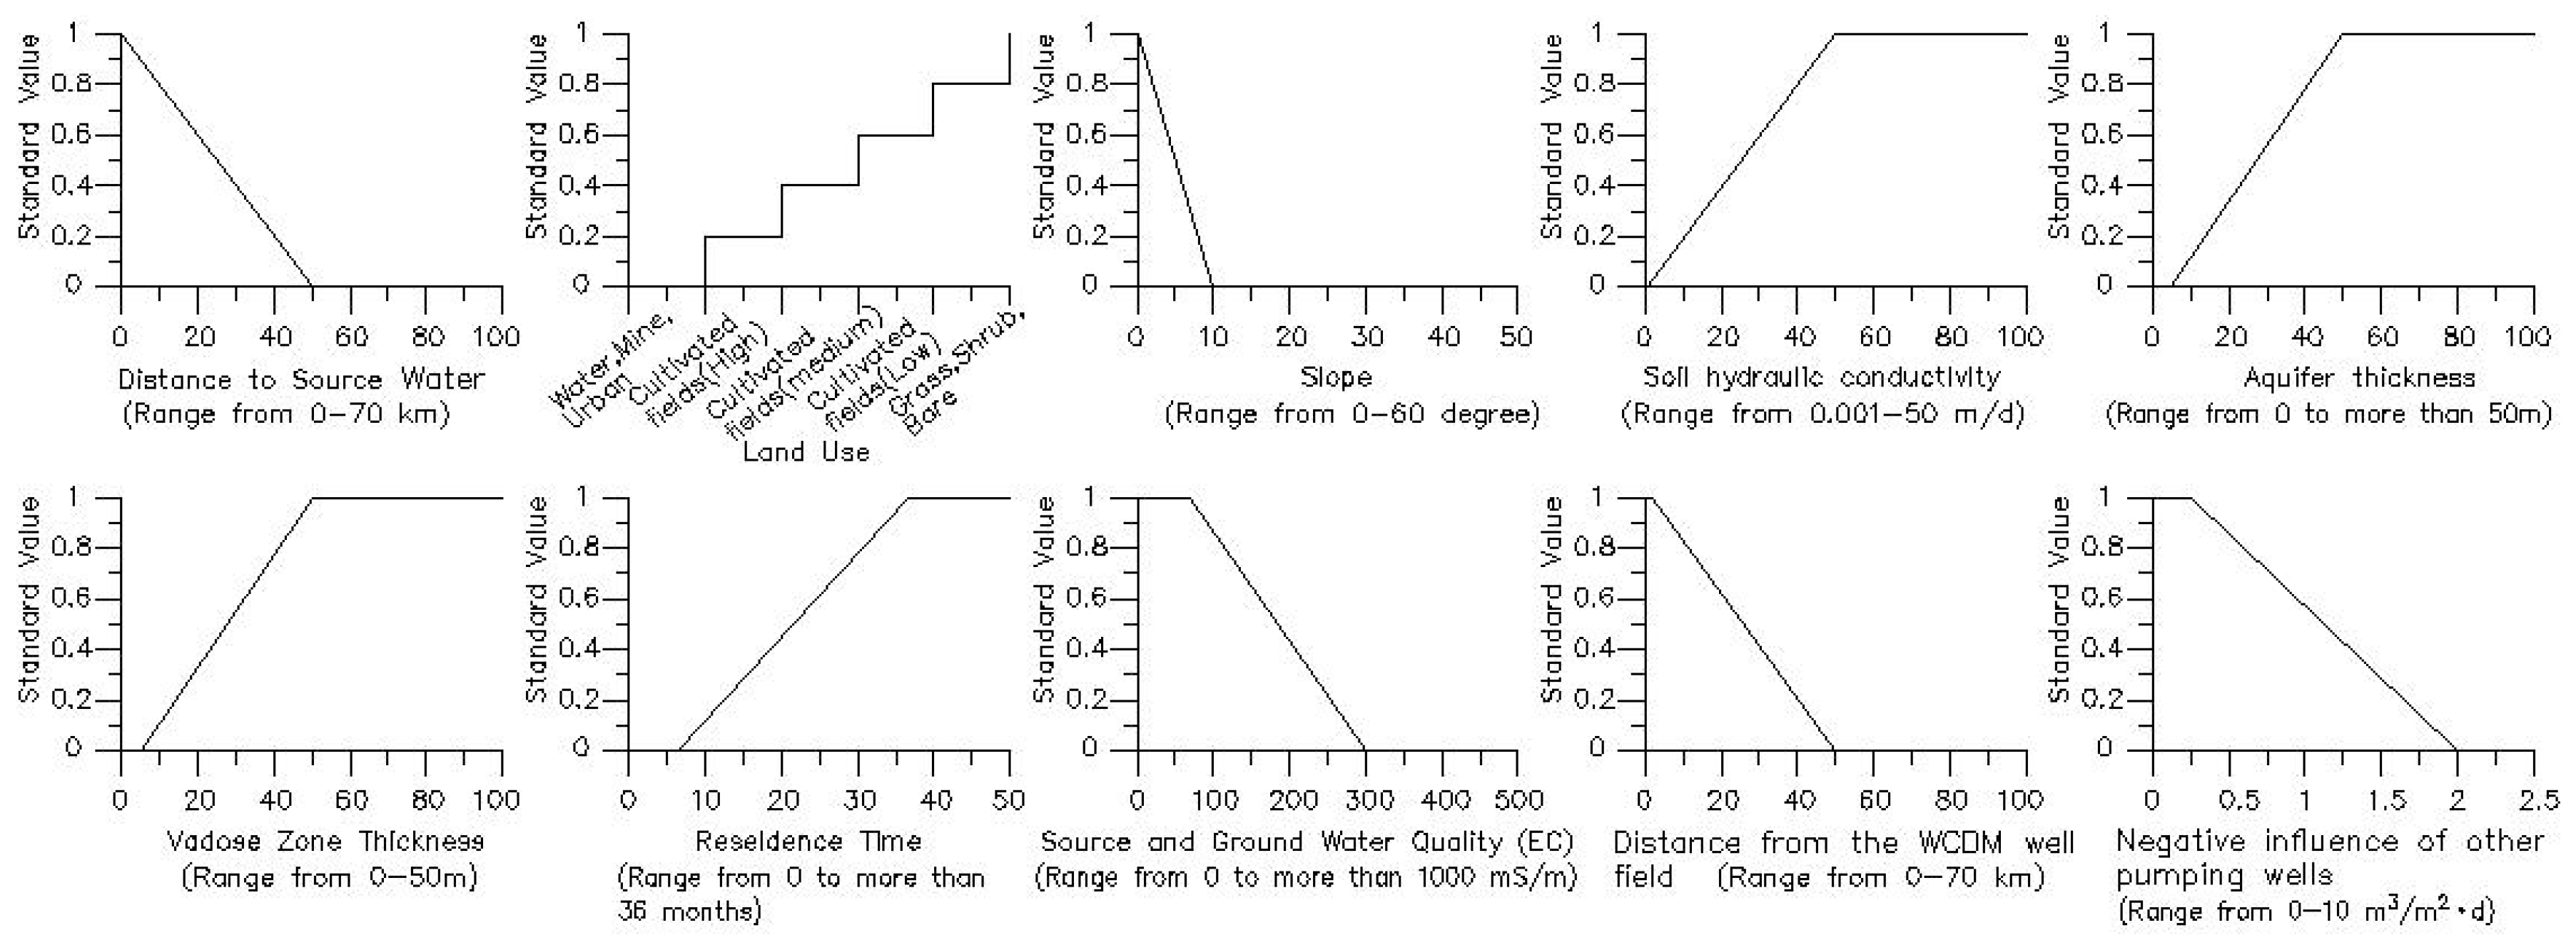
Each subcriterion in the criteria tree is represented by a map of different types such as a classified map (e.g., land use) or a value map (e.g., slope, aquifer thickness). For decision analysis, the values and classes of all of the maps should be converted to the same scale to reduce the dimensionality. Such conversions are known as standardization [42]. Different standardization methods may be applied to different maps, and linear, piece-wise linear, and step functions for standardization are usually adopted. The outcome of the function is always a value between 0 and 1. The function is chosen in such a way that cells in a map that are highly suitable for achieving the goal obtain high standardized values and less suitable grids obtain low values.
4. Relative weights of criteria and subcriteria
The next step in the site selection procedure is to assign values of importance for all criteria and subcriteria, which is planned by assigning a weight to each specific criterion. Different weighting methods are available, however, pair-wise comparison and direct weighting were used here. The subcriteria under each main criterion were compared amongst themselves and an initial weight was assigned to each one. Next, a sensitivity analysis of the weight for the subcriteria was conducted by using the perturbation method to obtain the reasonable value range of weight of each subcriterion. The weight of each subcriterion was finally obtained by the correction of the initial weight based on the sensitivity analysis, as were the main criteria evaluated.
5. Combination of criteria and subcriteria maps
After standardization and weighting, the next step is to obtain the overall suitability index of each alternative. The index value is given to the cells of the map. For each grid cell in the analysis, an index is calculated by summing the products of value and weight for each subcriterion:
where n is the total number of subcriteria; vi is the standardized value for subcriterion i at location (x,y); and wi is the weight assigned to subcriterion i.
This process is called the weighted linear combination (WLC), which is available by using overlay method in GIS. Then, the map of suitable sites for implementing the MAR is produced.
2.2.2. Step 2: Groundwater Flow Modeling
The purpose of this step is to verify and optimize the suitable sites developed by step one, as well as to assess the appropriate MAR scheme based on the designed scenarios if needed. ModelMuse, together with the MODFLOW and MODPATH packages, were used in this work [43]. During the entire process, the consistency of data used in the GIS and modeling must be maintained. Once the process of development, calibration, and validation of the groundwater flow model is performed, several scenarios can be applied to verify the suitable sites map produced by step one. If the selected sites map pass verification, specific scenarios are applied to optimize the suitable sites or assess the MAR scheme. Otherwise, the process of step one is adjusted to generate a new suitable sites map that is able to go through the verification again.
3. Results
3.1. Distribution of Suitable Sites for MAR in West Coast
The hydrogeological characteristics and all of the available data of the study area were analyzed and the main hierarchical structure with the criteria and subcriteria is shown in Figure 6. In terms of the criterion of source water availability, the source water is supposed to be the runoff of the Berg River in the rainy season, thus both the water quantity and quality are satisfied for the purpose of artificial recharge; subsequently, the source water availability mainly depends on the distance between the source and the recharge sites.
The subcriteria, or thematic layers, were standardized and are shown in Figure 7.
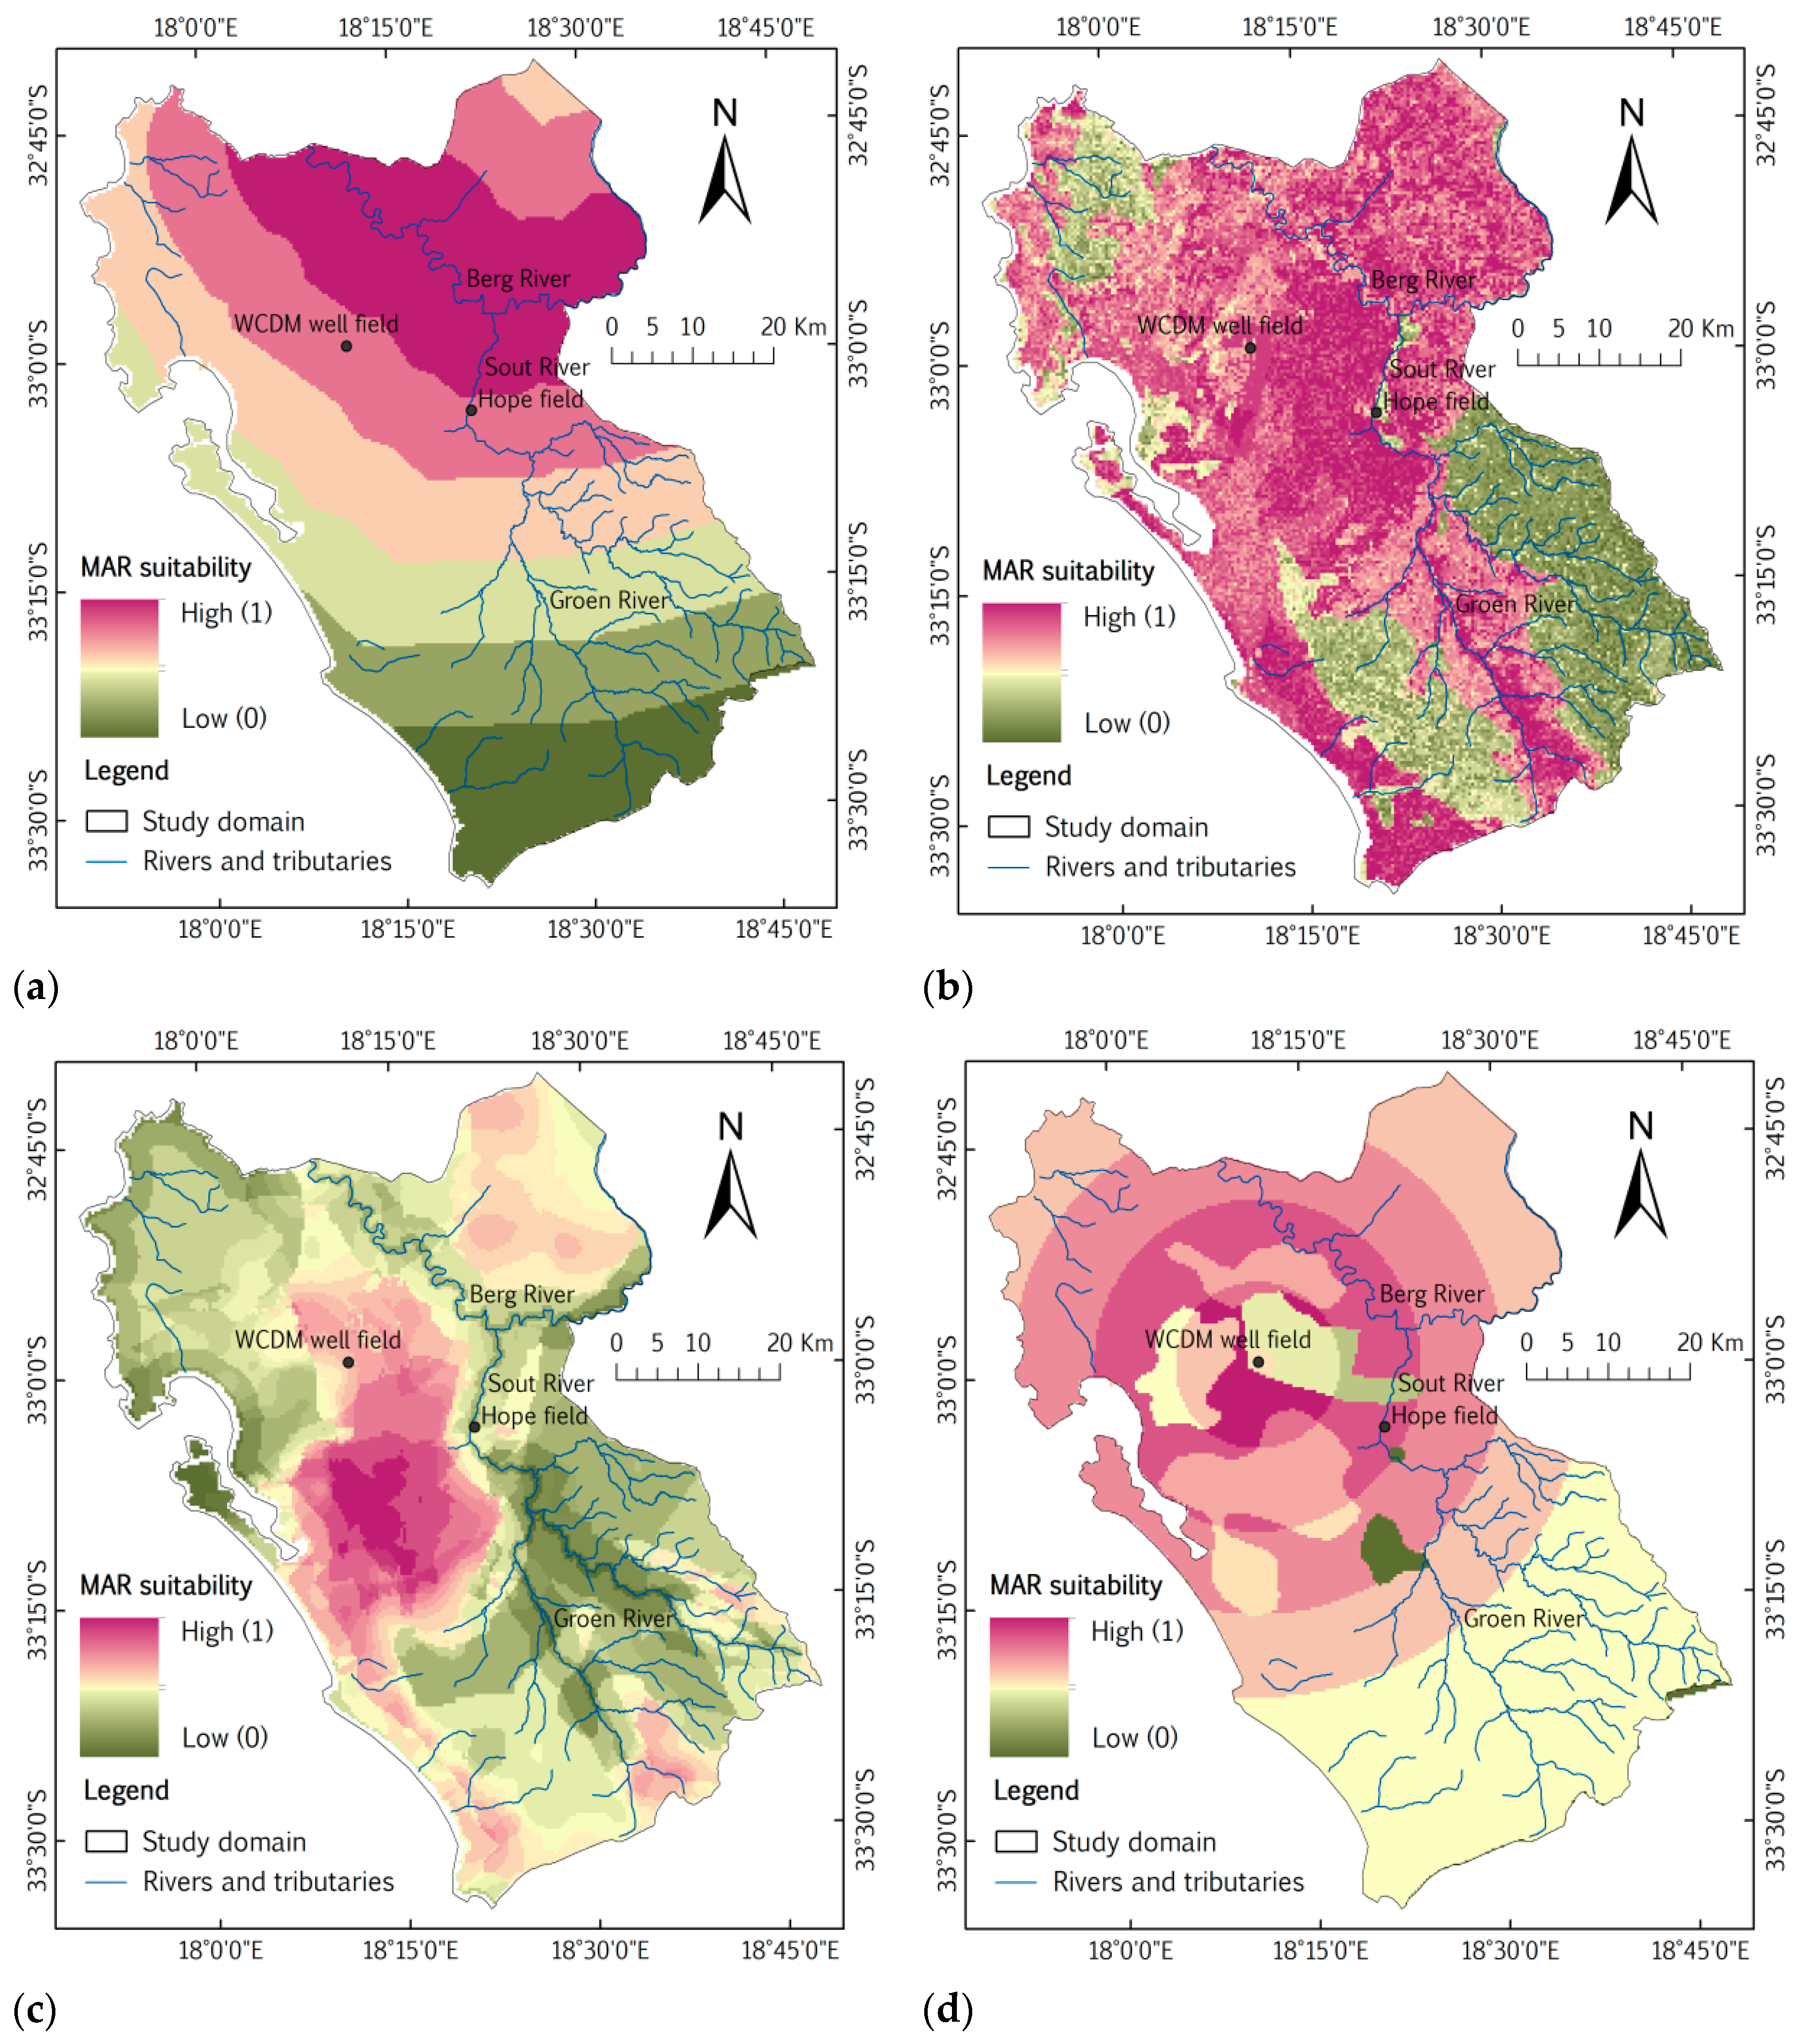
Maps of source water availability, infiltration capacity, storage capacity, and influence of pumping wells were classified and are shown accordingly in Figure 8. Since the water availability is mainly dependent on the distance to the Berg River, the greater the proximity, the more suitable the site (Figure 8a). For the criterion of infiltration capability, the area distributed with Cenozoic sediments was more suitable than the area with an outcrop of bedrocks, which indicates the significant influence of lithology (Figure 8b). The suitability map of the storage capacity criterion showed that the high suitability sites were located west of Hopefield, where the aquifer thickness and the depth to groundwater table were greater than at any other place, while the low suitability sites were located in areas close to the discharge area including the Berg River and coastline (Figure 8c). For the criterion of the influence of pumping wells, it can be seen from Figure 8d that the high suitability sites were located in the vicinity of the WCDM well field but to the south, where the pumping rate of other wells was relatively low (see Figure S7).
The datasets of the criteria for the classified maps were combined to generate an integrated site map across the West Coast area, with a nominal resolution of 30 × 30 m (Figure 9). The calculated MAR suitability indices ranged from 0.18 to 0.91 in the order of increasing suitability, with a mean value of 0.58 and a standard deviation of 0.16. The area of suitable sites (Index > 0.60) was 2337.2 km2, accounting for 50% of the total assessed area. The area of sites with a high suitability (Index > 0.80) was 237 km2, which was located southwest of Hopefield, which is commonly regarded as the natural recharge area of the LRAS and EAS, followed by of the area north of the Berg River in G10M. The area of low suitability sites (Index < 0.60) was mainly located in the southeast parts of G10L in the study area and had an area of 2337.5 km2, accounting for 50% of the total assessed area.
3.2. Modeling the Influence of Various Options for MAR Project
A groundwater flow model covering the same area as the GIS based analysis was developed using ModelMuse to study the groundwater flow system and verify the suitable sites that were shown by the map that was integrated by the GIS based approach. The model was divided into four layers with varying thicknesses. The layer arrangement of the model is shown in Table 1.
The model started to run after all the required data representing the boundary condition and initial condition were input (Table S1). The groundwater level data of 59 boreholes across the study area were adopted to calibrate the model, which was calibrated for steady-state conditions representing the flow regime before 2014 when there was no significant decrease in rainfall (Table S2). The calibration process proceeded until the best fit between the simulated and observed piezometric heads was achieved, during which the hydraulic conductivities were required to be maintained in the range provided in Table 2. By comparing the observed and simulated piezometric heads (hobs and hsim, respectively), the goodness of fit of the model was calculated using the root mean square error (RMSE) and the normalized root mean square error (NRMSE) with the help of Equations (2) and (3), with hmax and hmin as the maximum and minimum observed piezometric head, respectively.
Finally, a RMSE of 5.4 m and a NRMSE of 5.3%, together with the correlation coefficient value of 0.95 between the simulated and observed piezometric heads, were achieved after continuous improvement, which represents an acceptable calibration for the intended modeling purpose [26].
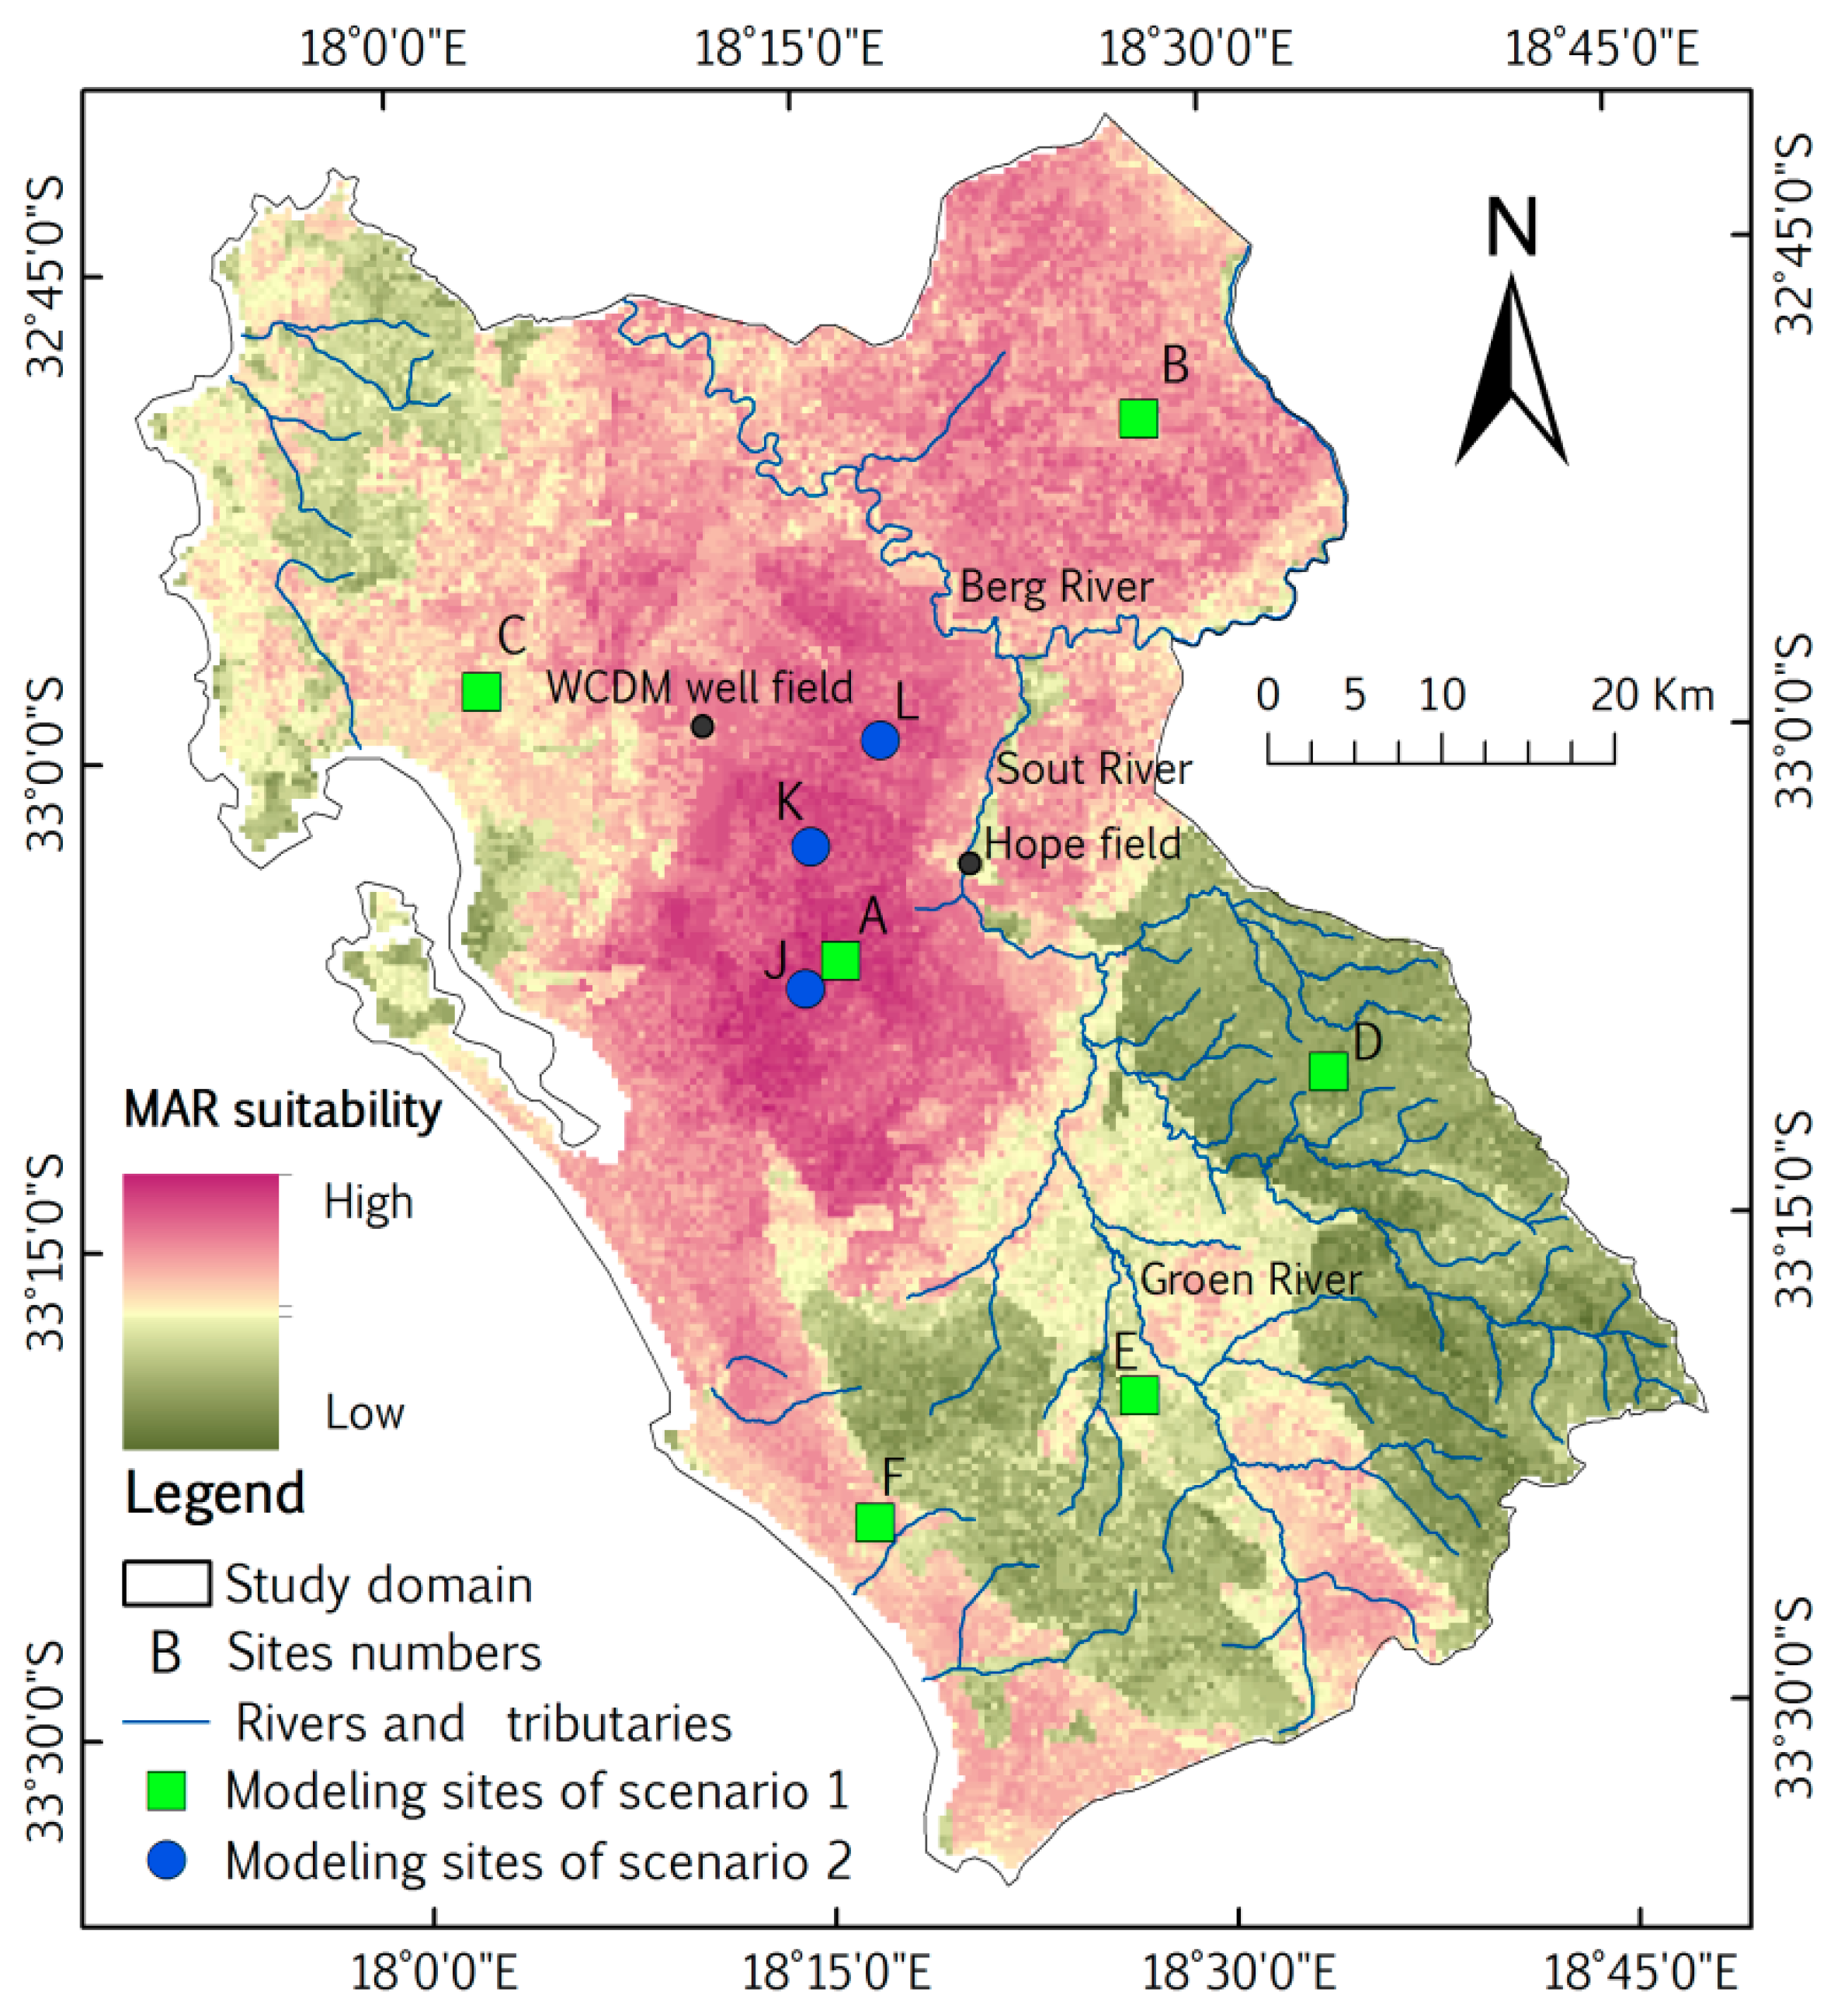
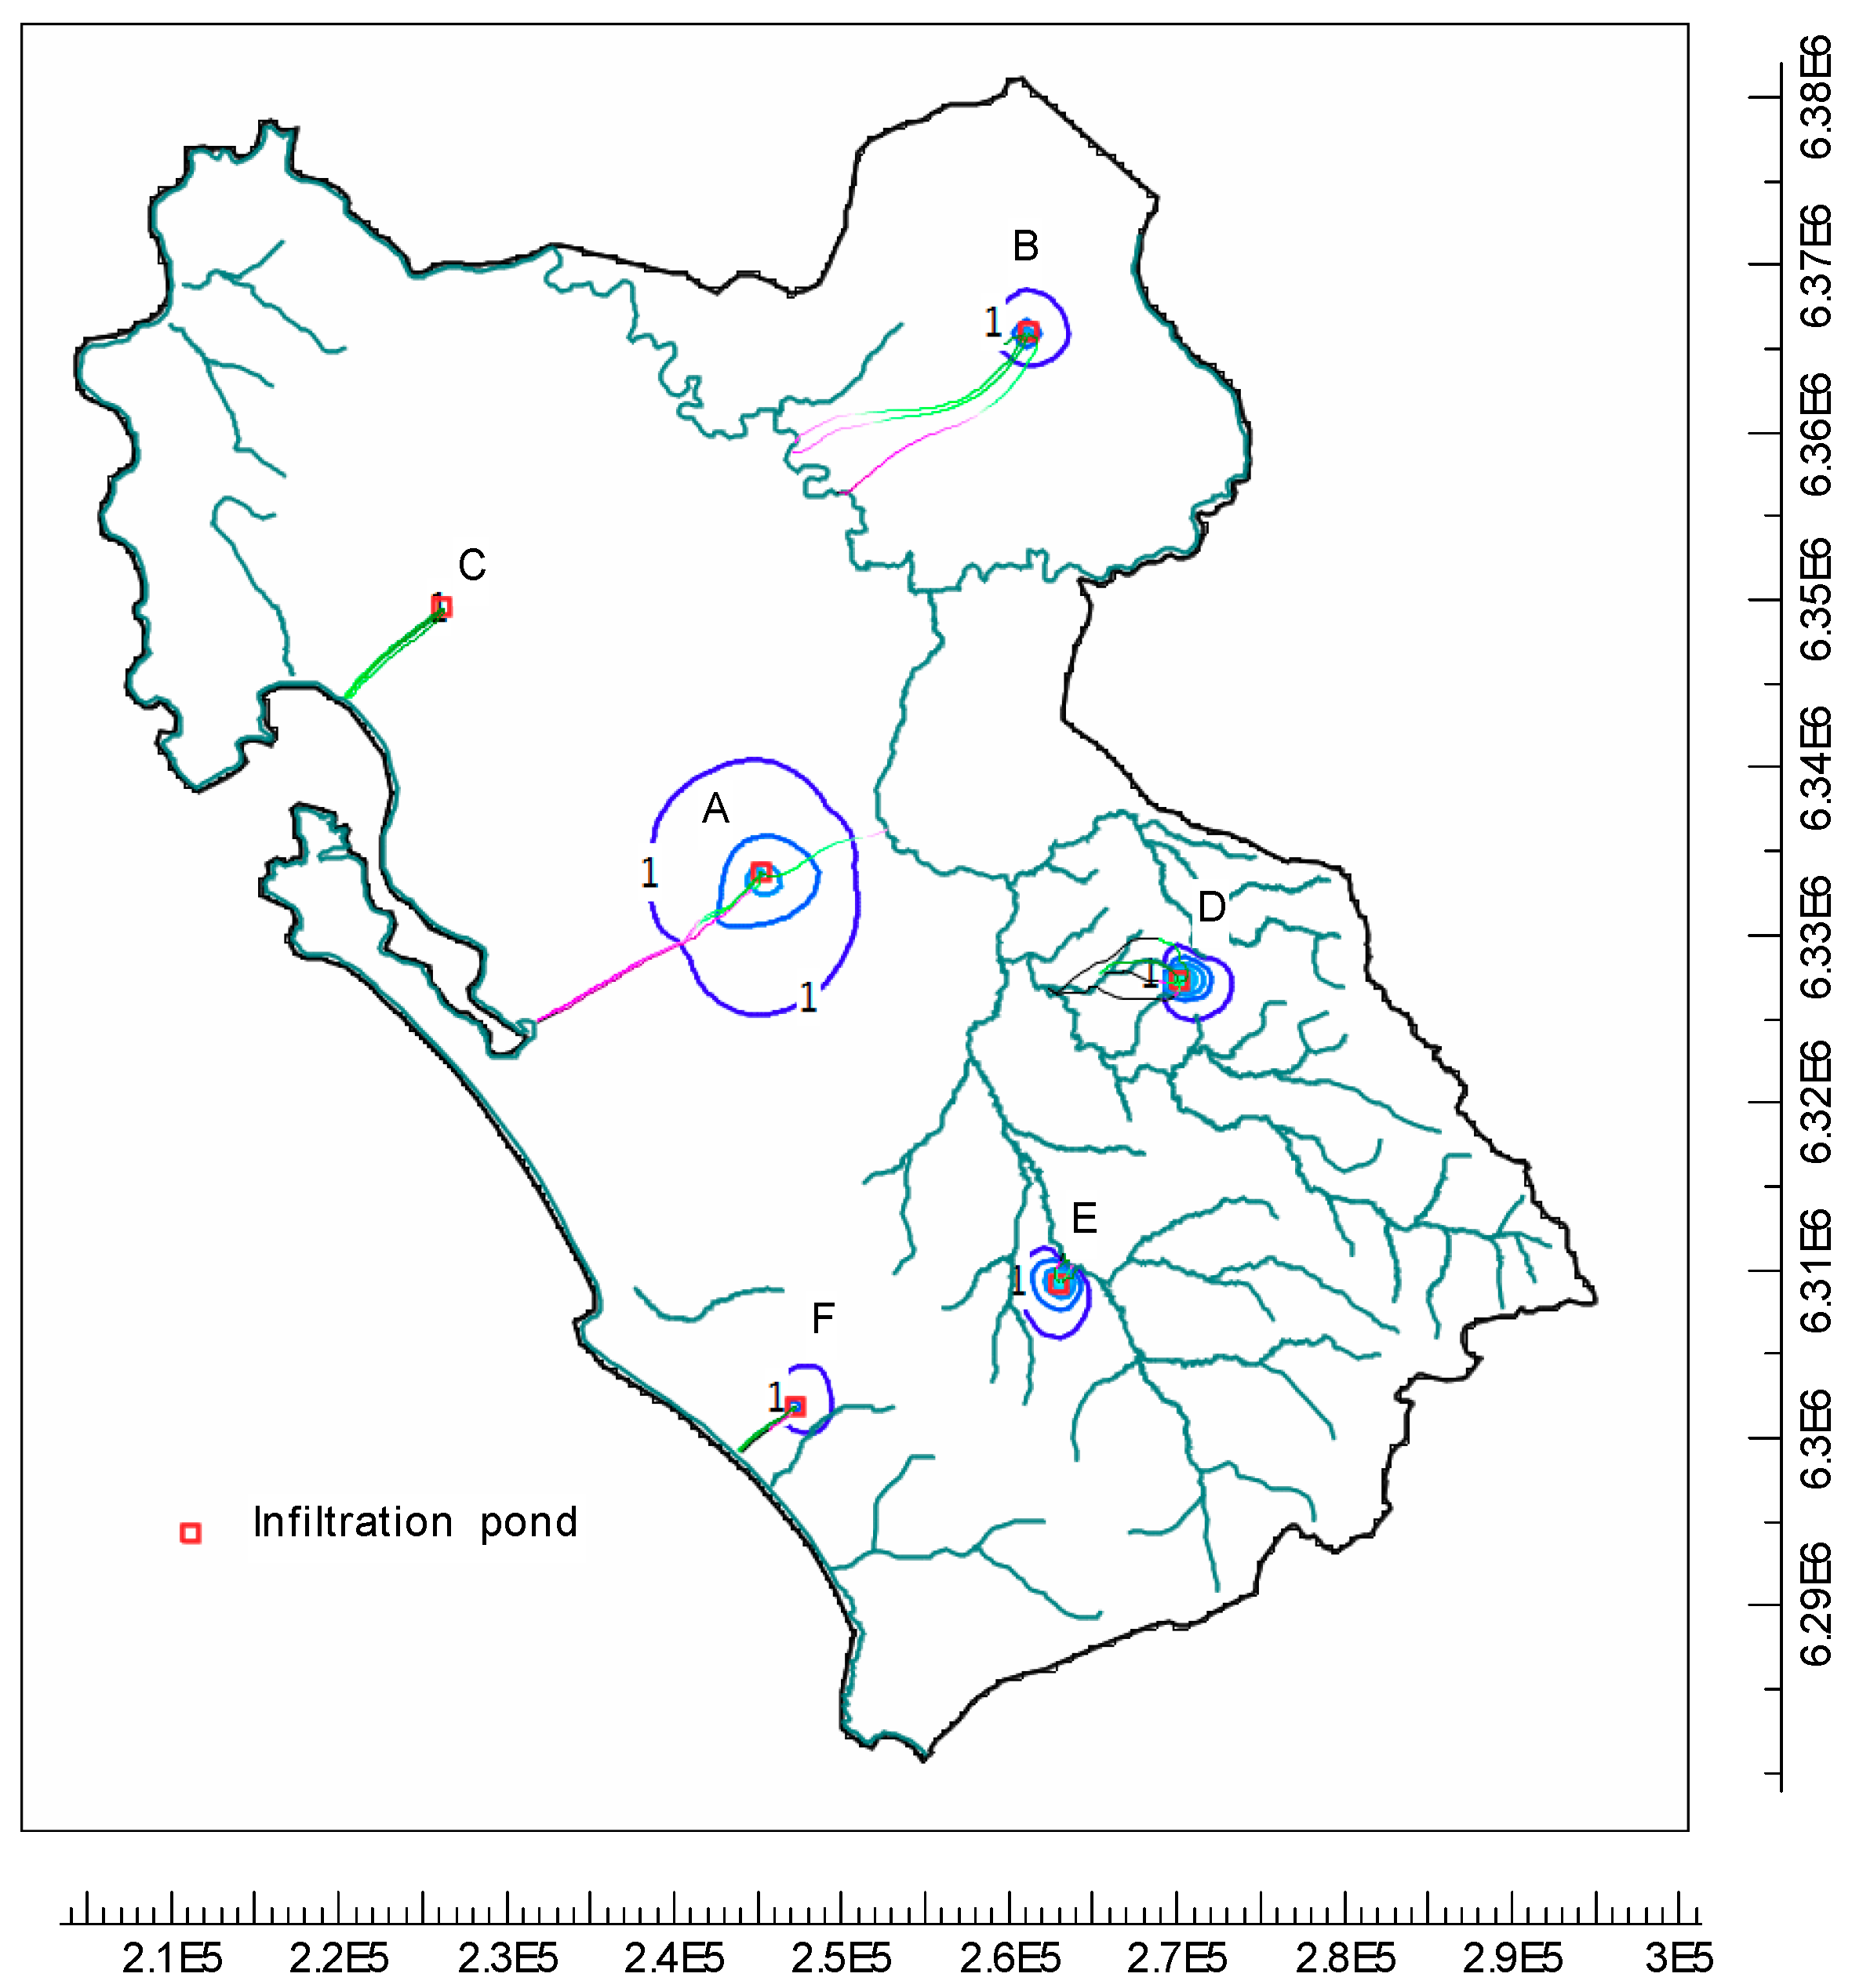
Once the model was calibrated, two scenarios were adopted to understand the influence of recharging through infiltration ponds at different sites (Figure 10). Details of the scenarios are shown in Table 3.
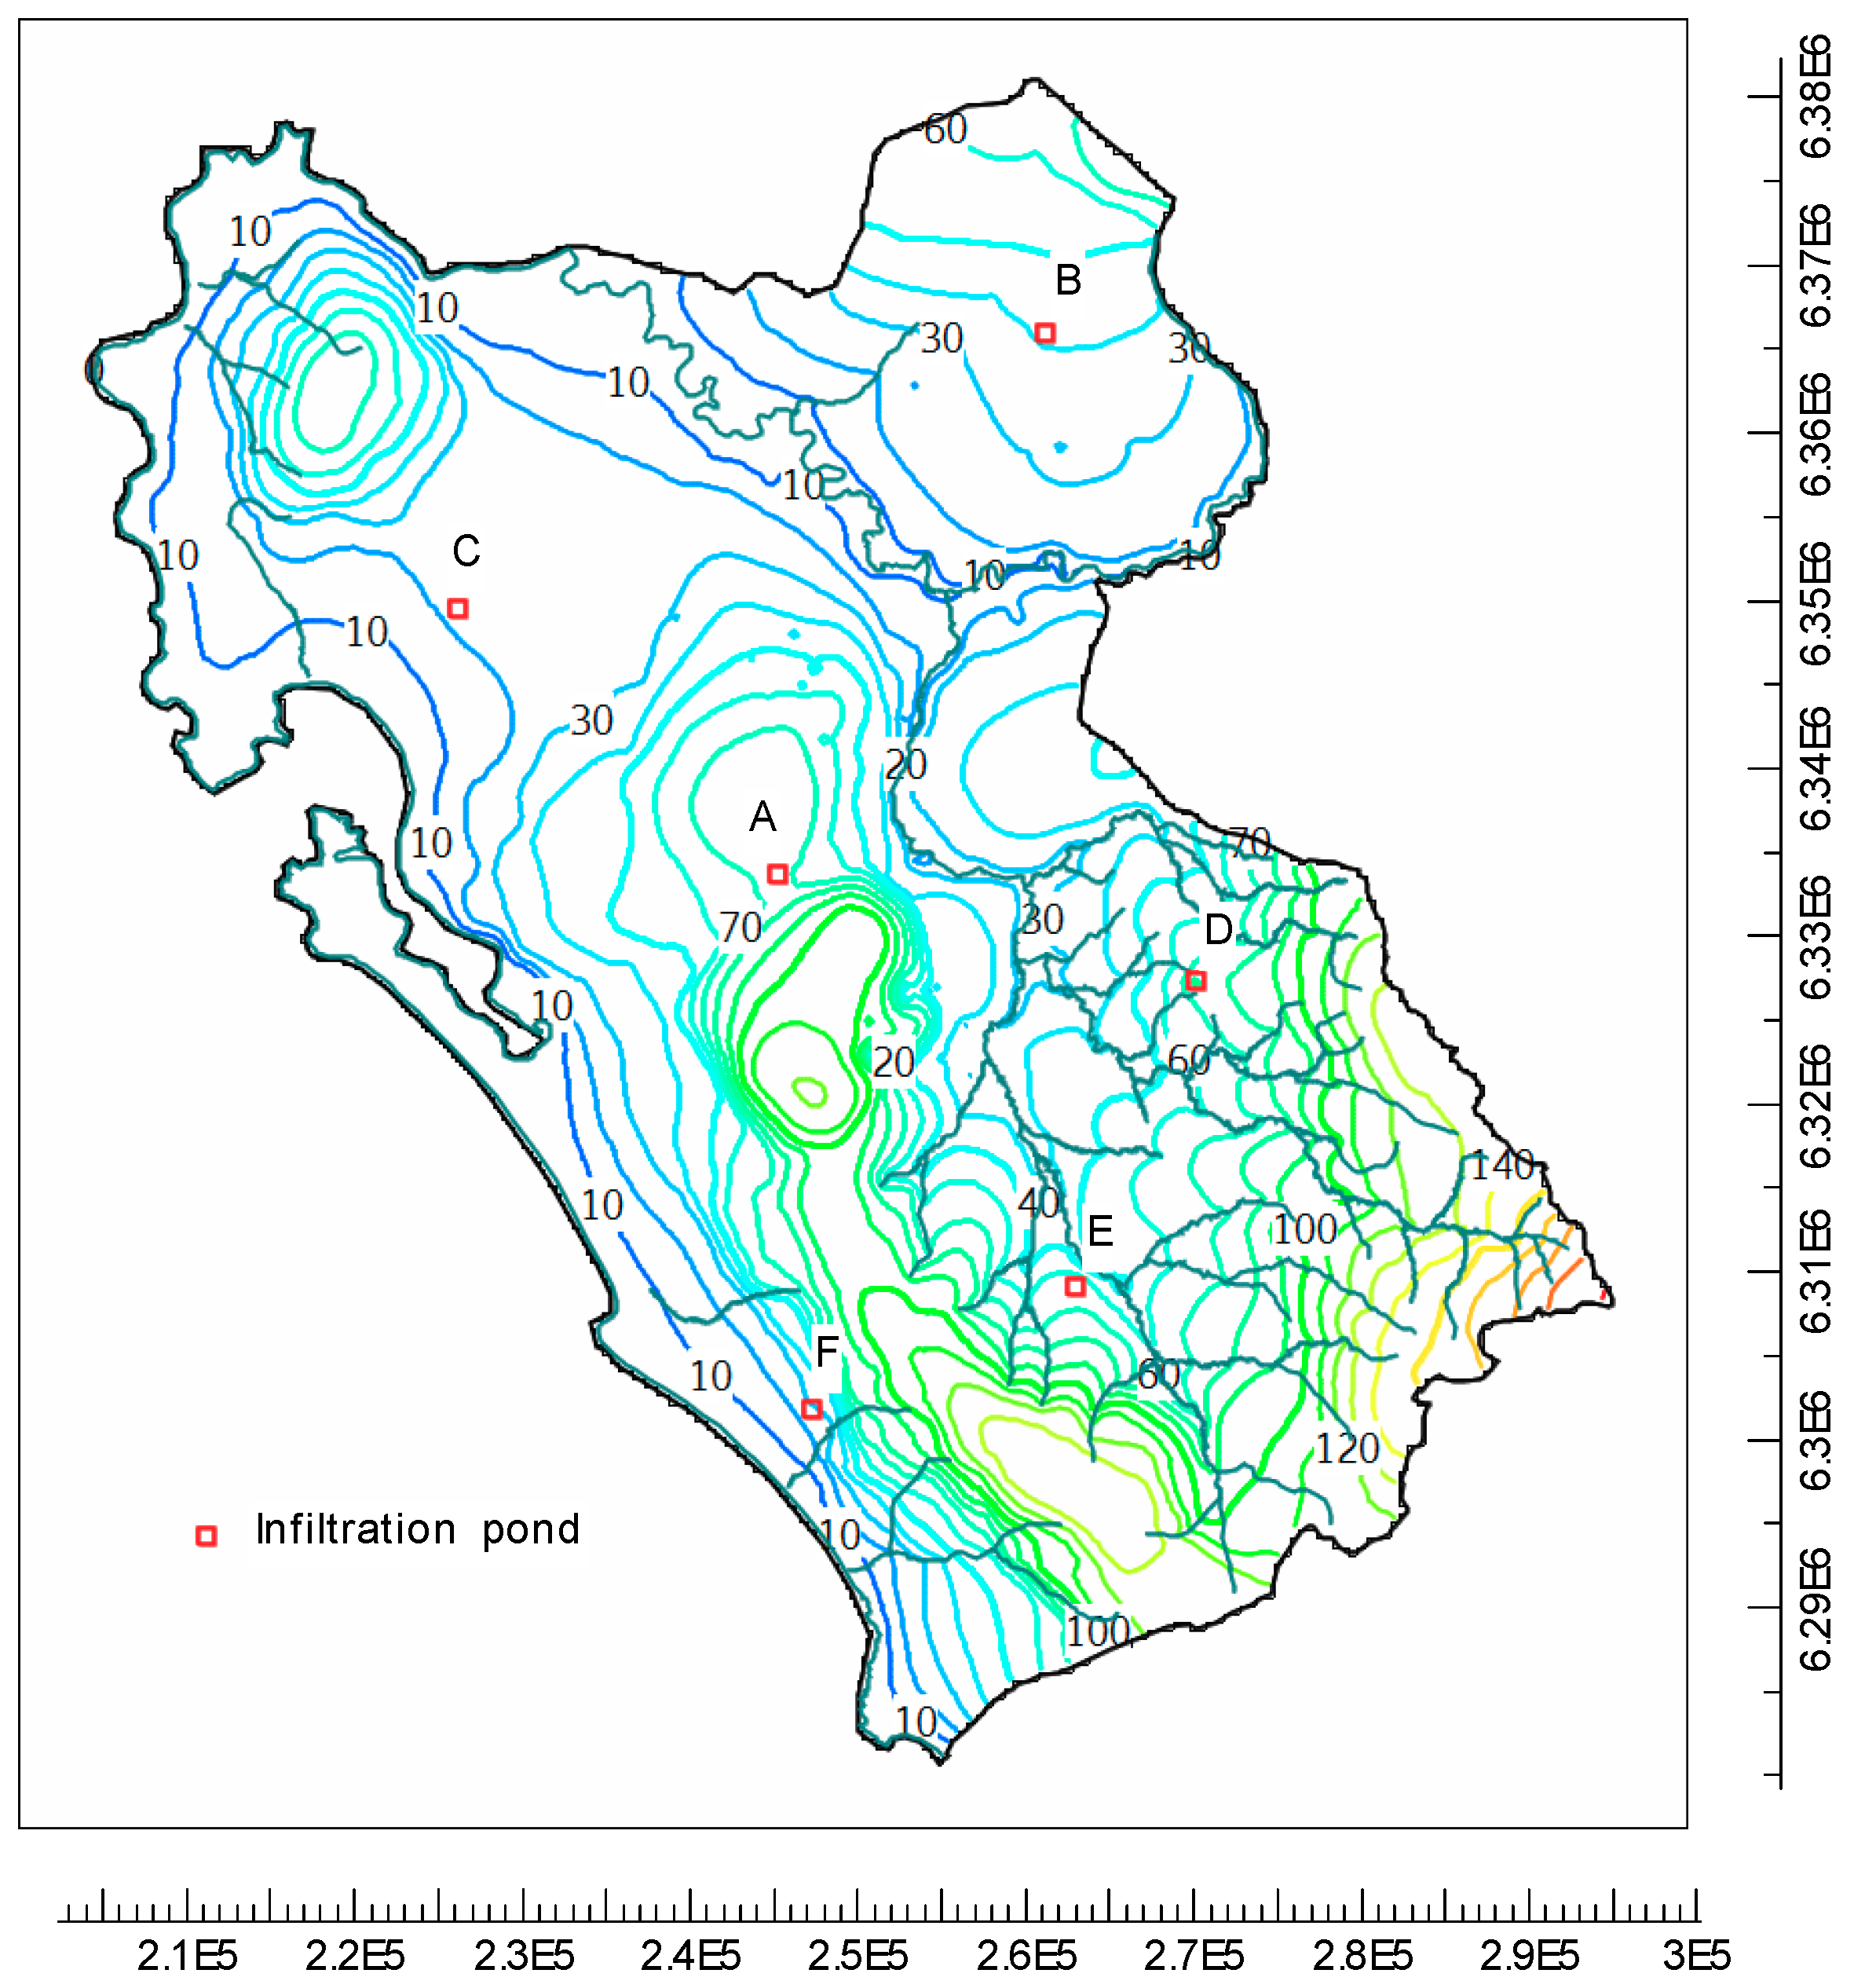
The results of Scenario one are shown in Figure 11 and Figure 12 and Table 4. A comparison among these three groups of locations with different suitability indices, unsurprisingly the locations with higher suitability, could be characterized with a higher rise in the groundwater level at recharge sites, larger storage area, and longer flow path. The largest rise in groundwater level occurred at locations D and E with low suitability indices on the map instead of at locations of A and B, that is, because the low permeability of lithology at D and E made it difficult for the recharged water to enter into the aquifer, leading to a comparatively higher rise in water level at the injection locations. In terms of the region of high rise in water level of locations D and E, it will take a long time for the recharged water to achieve the equilibrium state showed in the modeling, which is impractical when implementing a MAR scheme. From the results of this scenario, the suitable sites map developed by step one using the GIS analysis method was verified to be reasonable.
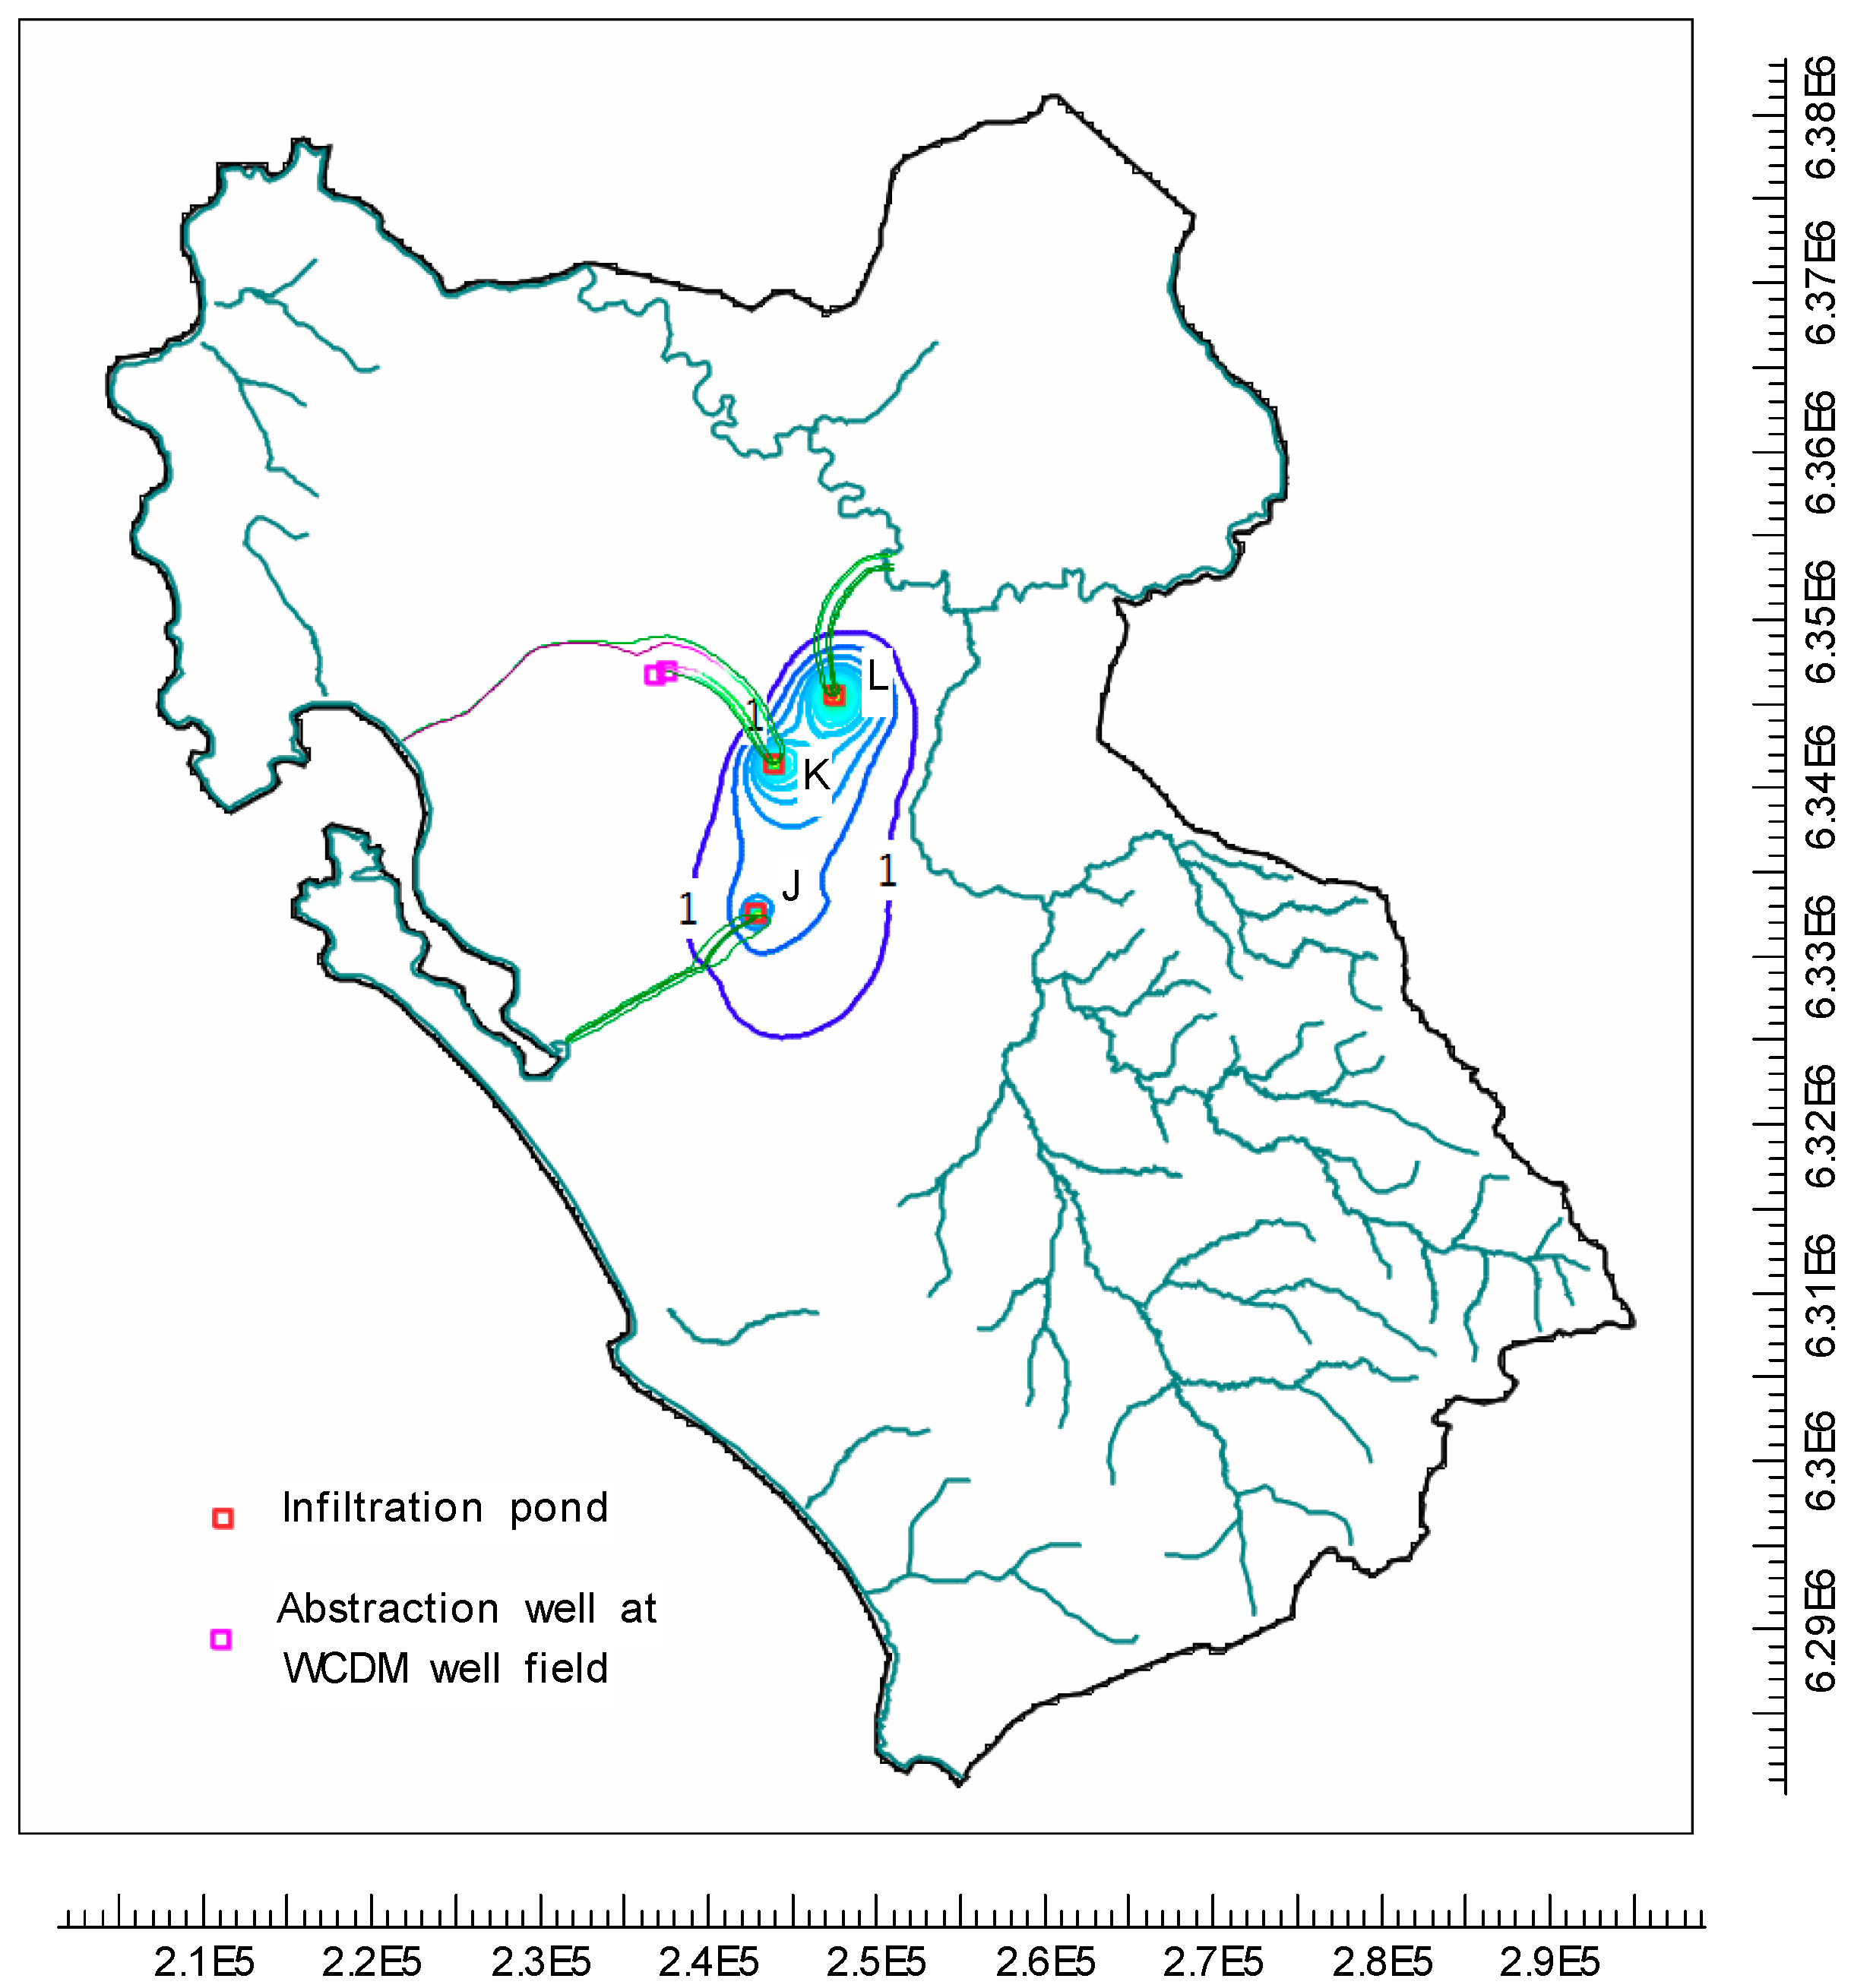
Figure 12 shows the flow paths of the recharged water, and reflects the divergent flow directions and discharges when recharging at different locations. It seems that none of the sites simulated in Scenario one were concerned with the purpose of benefiting the WCDM well field when implementing MAR. Thus, scenario two, which included three infiltration ponds located at the high suitability sites and two abstraction wells located at WCDM well field, was designed to uncover the relationship between MAR and the abstraction for the WCDM well field.
From the result of Scenario two (Figure 13), there was an obvious rise in the groundwater level around the three infiltration ponds, and the rise was higher at the proximity location of recharging than at any of the other farther sites. The largest rise in groundwater level was 25 m at location L, while about 20 m in rise occur at locations J and K. Although the three infiltration ponds are located at high suitability sites in the west of Hopefield, where it is usually considered as the natural recharge area of the LRAS and EAS, the flow paths showed divergent directions. Water recharged at location J flowed southwest toward Langebaan Lagoon, while water recharged at location L flowed northeast and discharged to the Berg River. For the water recharged at location K, it partly flowed toward Langebaan Lagoon, and partly flowed northwest toward the WCDM well field and discharged by abstraction through boreholes, which indicates that the recharge around location K can benefit the WCDM well field of the West Coast.
4. Discussion
Due to the powerful spatial analysis ability of GIS, the GIS based method has been widely applied to suitability analysis. Among these studies, most GIS based studies on assessing the recharge properties and processes have focused on natural or incidental recharge, rather than MAR. The most popular method from the literature has been to integrate the criteria with different weights, despite the adopted criteria and weighting methods being divergent from different cases. Due to the limitation resulting from data availability and classification, some extent of error was incurred [16]. However, a few earlier studies have attempted to verify the results of the GIS based analysis for accuracy or applicability. The attempts addressed the above issue by developing a two-step approach of combining the GIS based analysis with modeling to select suitable sites for MAR.
For the GIS based analysis, efforts to improve the analysis of sites have never stopped. Criteria selection and weight determination have been the issues focused on in these studies. In fact, not only were suitable criteria the focus, but several studies have also concentrated on using the constraint criteria to screen out the areas where MAR are actually non-feasible [9,45,46]. In this paper, we attempted to incorporate the AHP into the criteria choice during the process of mapping suitable sites. The AHP method was adopted to develop a three-level criteria tree based on the fact that the MAR project is largely dependent on the factors of source water availability, infiltration capacity, storage capacity, and influence of pumping wells. Then, subcriteria including source water quantity, water quality, distance, land use, slope, soil permeability, aquifer thickness, vadose zone thickness, residence time, ground water quality, distance from the WCDM well field, and negative influence of other pumping wells were chosen to support these four criteria. The combination of AHP with WLC can provide a more effective way for spatial decision problems. When this method was applied to the case study of the West Coast of South Africa, a reasonable result was achieved. The area of suitable sites (Index > 0.60) was 2337.2 km2, accounting for 50% of the total assessed area.
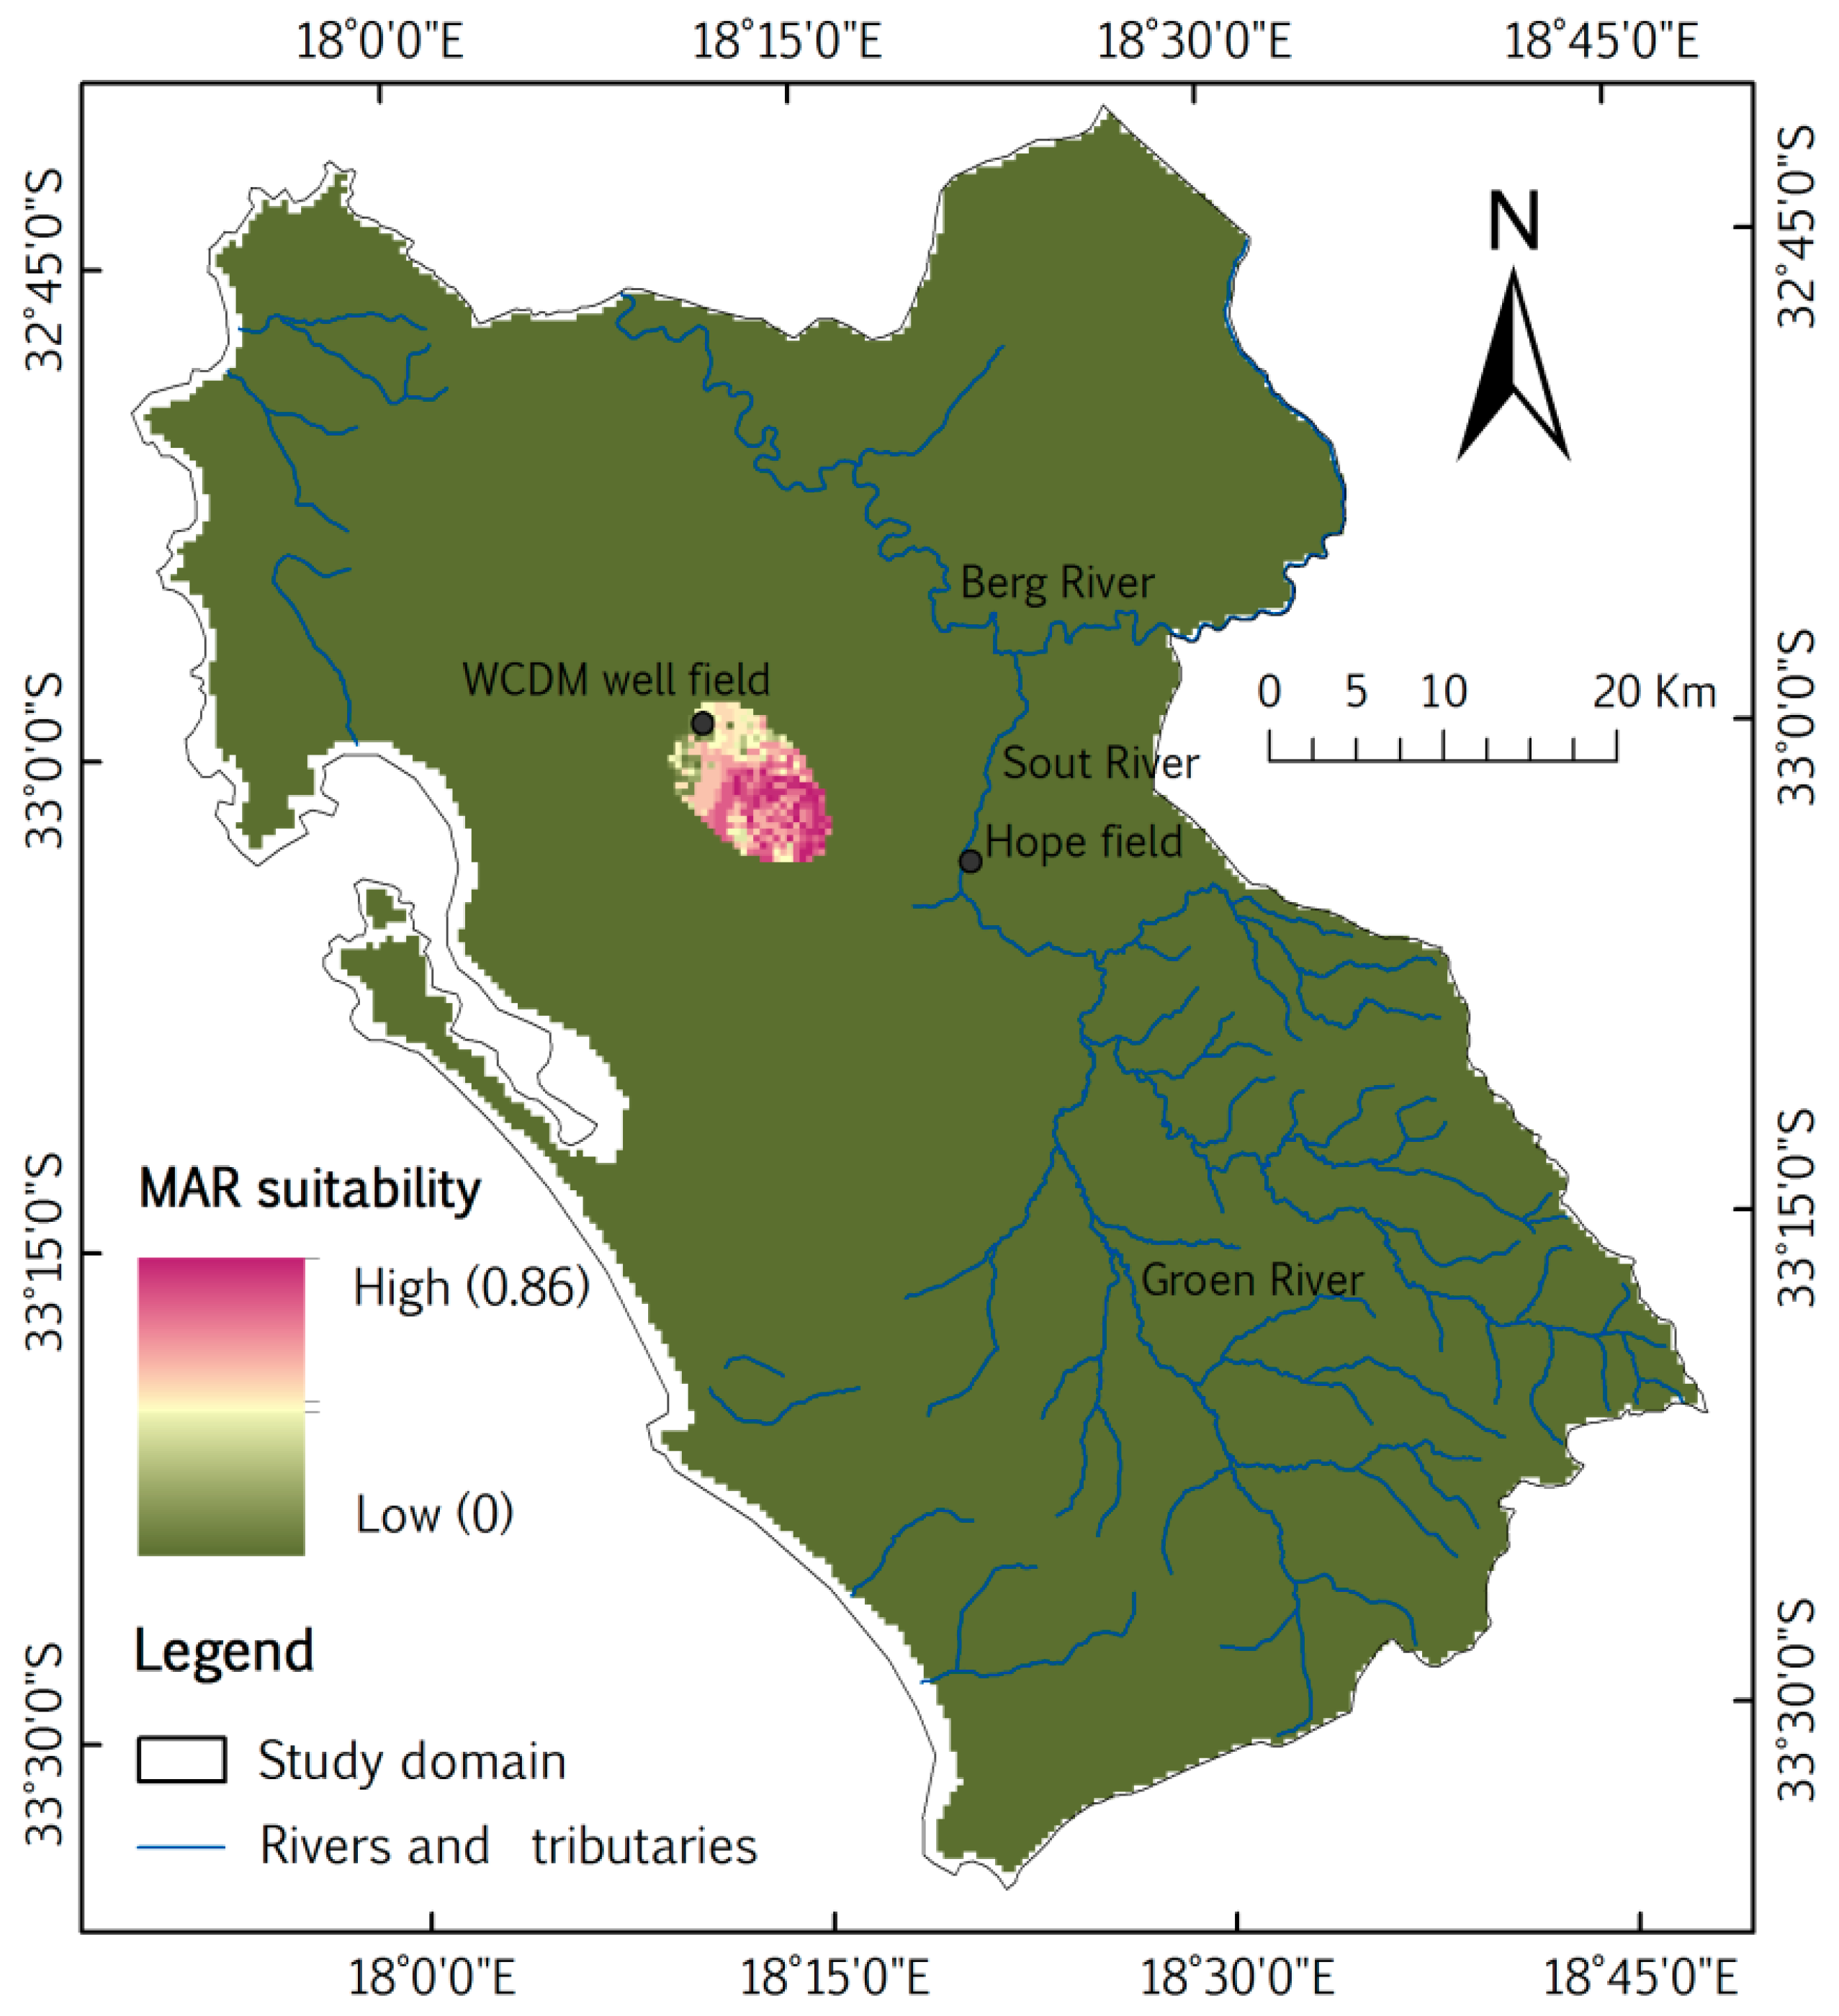
Modeling is widely applied to the analysis of groundwater flow. In this paper, groundwater modeling was adopted in the second step to verify the suitable sites map integrated by the GIS based analysis, and further optimize the sites map. Results of the modeling showed that higher suitability areas in the West Coast were characterized by a higher rise in groundwater level, larger storage space, and longer flow path. However, the Scenario two modeling results also showed that the water flow in the aquifer of the West Coast was not concerned with the suitability index. Recharging at location J, which had the highest suitability index, could not recharge the WCDM well field, but flows away toward Langebaan Lagoon, while recharging only around location K could benefit WCDM well field. The area of suitable sites (Index > 0.6) able to benefit the WCDM well field was about 57.1 km2, which accounted for only 2.4% of the suitable sites mapped by the GIS based analysis (Figure 14). This difference was caused by the groundwater flow, which was not considered in the GIS based analysis. It can be seen from Figure 14 that the area that benefited the WCDM well field through MAR with a high suitability index was located northwest of Hopefield, instead of in the vicinity of the WCDM well field, which is due to the relatively larger values in soil hydraulic conductivity, aquifer thickness as well as vadose zone thickness northwest of Hopefield. Meanwhile, there are sparse pumping wells present between the recharge area and the WCDM well field, which allows water more than 5 km upstream to be able to flow and recharge in the WCDM well field downstream. However, the idea of not constructing any more new well fields would sharply limit the options to select new suitable sites for implementing MAR, which constrains the implementation of MAR in the West Coast to increase the water supply. Therefore, to alleviate the pressure on the water supply of the West Coast, not only should MAR be implemented at suitable sites, but it is suggested that new well fields should be constructed properly.
Based on the above-mentioned, the suitable sites map developed by the GIS based analysis was reasonable from the spatial aspect. However, due to the lack of groundwater flow information, the most suitable sites selected by the GIS based analysis are not necessarily the optimal sites in practice. Therefore, the role of GIS based analysis is suggested to screen out the initial suitable sites for the implementation of MAR, and the results of GIS based analysis need to be verified by modeling. GIS based analysis is powerful in spatial analysis, while modeling is famous for its ability to analyze groundwater flow. Combining these two methods into a two-step analysis approach has proven to be a reliable way to identify suitable sites for implementing MAR.
5. Conclusions
A two-step approach of combining GIS based analysis with groundwater modeling presented a series of methods for integrating spatial surface and subsurface data using GIS to identify sites that may be suitable for the implementation of MAR in the West Coast of South Africa, together with a method of verification and optimization by using a numerical model. The suitable sites mapped by the GIS based analysis showed that an area of 2337.2 km2 was suitable to implement MAR in the West Coast. However, the modeling indicates that recharging only in the vicinity of location K with an area of 57.1 km2 could benefit the WCDM well field. Therefore, the idea of using the WCDM well field without the construction of new well fields would constrain the implementation of MAR in the West Coast. In order to alleviate the pressure on the water supply of the West Coast, not only should MAR be implemented at suitable sites, but that new well fields should be constructed properly.
The suitable sites mapped by the GIS based analysis were reasonable from a spatial perspective. However, due to the lack of groundwater seepage information, the most suitable sites developed by the GIS based analysis method are not necessarily the optimal sites in practice. With the advantages of both spatial analysis in GIS and the seepage simulation in modeling, this two-step analysis approach provides a reliable solution to screen out the suitable sites for implementing MAR.
Future improvements including more factors (e.g., political, economic, ecological factors, etc.) together with their weights and more specific modeling scenarios may need to be considered in the analysis process of suitable site selection. With respect to the West Coast of South Africa, the next step in determining a MAR project site is to conduct field injection tests at selected field locations and obtain the parameters needed for the implementation of MAR. Data from future additional studies will be helpful in calibrating both the GIS based analyses and the regional hydrogeologic model, and finally improving the MAR scheme. The approach presented in this paper is not limited to the West Coast, and can be replicated to study the suitable sites and possible impacts of implementing MAR in an aquifer with similar characteristics to improve the water security of drought-prone areas.
Supplementary Materials
The following are available online at https://www.mdpi.com/2073-4441/11/8/1646/s1, Figure S1: Geological map of the study area. Figure S2: Land use of the study area. Figure S3: Slope of the study area. Figure S4: Aquifer thickness of the study area. Figure S5: Vadose zone thickness of the study area. Figure S6: Recharge distribution used in the modeling (from DWAF 2006 [47]). Figure S7: Pumping wells in the groundwater modeling (from DWAF, 2008 [22]; Seyler, 2016 [26]). Table S1: Description of the model boundaries. Table S2: Modeled versus observed groundwater table values of the steady-state calibration.
Author Contributions
Conceptualization, Methodology, Software, Formal Analysis, Investigation, Resources, Data Curation, Writing—Original Draft Preparation, H.Z.; Writing—Review & Editing, Supervision, Y.X.; Writing—Review & Editing, Project Administration, Funding Acquisition, T.K.
Funding
This research was funded by the Water Research Commission (WRC) project “Towards the sustainable exploitation of groundwater resources along the West Coast of South Africa”, No. K5/2744. Author Heng Zhang was further financed by the New Partnership for Africa’s Development (NEPAD).
Acknowledgments
The authors would like to thank the Water Research Commission of South Africa for providing the financial support to carry out this study (No. K5/2744). The funding provided by the New Partnership for Africa’s Development (NEPAD) to Heng Zhang is gratefully acknowledged. The authors are also grateful to the anonymous reviewers for their useful comments to improve the manuscript. The opinions expressed in the report are the authors’ personal opinions and not of their affiliated departments/ institutes.
Conflicts of Interest
The authors declare no conflicts of interest.
References
- Pachauri, R.; Reisinger, A. Climate Change 2014: Synthesis Report. Contribution of Working Groups I, II and III to the Fifth Assessment Report of the Intergovernmental Panel on Climate Change. J. Roman. Stud. 2014, 4, 85–88. [Google Scholar]
- Dillon, P. Water recycling via managed aquifer recharge in Australia. Boletín Geológico Y Min. 2009, 120, 121–130. [Google Scholar]
- Page, D.; Bekele, E.; Vanderzalm, J.; Sidhu, J. Managed Aquifer Recharge (MAR) in Sustainable Urban Water Management. Water 2018, 10, 239. [Google Scholar] [CrossRef]
- Department of Water Affairs and Forestry, South Africa (DWAF). Artificial recharge strategy: Version 1.3. In Strategy Development: A National Approach to Implement Artifical Recharge as Part of Water Resource Planning; DWAF: Pretoria, South Africa, 2007. [Google Scholar]
- Tredoux, G.; Engelbrecht, J.F.P. Langebaan Road Aquifer Artificial Recharge Study: Pilot Phase Recharge: Final Report; Prepared for the Department of Water and Environmental Affairs, Natural Resources and the Environment, Document No CSIR/NRE/WR/ER/2009/0099/B; CSIR: Pretoria, South Africa, 2009. [Google Scholar]
- Department of Water Affairs, South Africa (DWAF). Strategy and Guideline Development for National Groundwater Planning Requirements. In Potential Artificial Recharge Schemes: Planning for Implementation; DWAF: Pretoria, South Africa, 2010. [Google Scholar]
- Yi, C.S.; Lee, J.H.; Shim, M.P. Site location analysis for small hydropower using geo-spatial information system. Renew. Energy 2010, 35, 852–861. [Google Scholar] [CrossRef]
- Anbazhagan, S.; Ramsamy, S.M.; Gupta, S.D. Remote sensing and GIS for artificial recharge study, runoff estimation and planning in Ayyar Basin, Tamil Nadu, India. Environ. Geol. 2005, 48, 158–170. [Google Scholar] [CrossRef]
- Rahman, M.A.; Rusteberg, B.; Gogu, R.C.; Ferreira, J.P.L.; Sauter, M. A new spatial multi-criteria decision support tool for site selection for implementation of managed aquifer recharge. J. Environ. Manag. 2012, 99, 61–75. [Google Scholar] [CrossRef] [PubMed]
- Russo, T.A.; Fisher, A.T.; Lockwood, B.S. Assessment of Managed Aquifer Recharge Site Suitability Using a GIS and Modeling. Groundwater 2015, 53, 389–400. [Google Scholar] [CrossRef]
- Saraf, A.K.; Choudhury, P.R. Integrated remote sensing and GIS for the groundwater exploration and identification of artificial recharge sites. Int. J. Remote Sens. 1998, 19, 1825–1841. [Google Scholar] [CrossRef]
- Ghayoumian, J.; Ghermezcheshme, B.; Feizinia, S.; Noroozi, A.A. Integrating GIS and DSS for identification of suitable for artificial recharge, case study Meimeh Basin; Isfahan, Iran. Environ. Geol. 2005, 47, 493–500. [Google Scholar] [CrossRef]
- Chowdhury, A.; Jha, M.K.; Chowdary, V.M. Delineation of groundwater recharge zones and identification of artificial recharge sites in West Medinipur District, West Bengal, using RS, GIS and MCDM techniques. Environ. Earth Sci. 2010, 59, 1209–1222. [Google Scholar] [CrossRef]
- Sabokbar, H.A.; Hamze, M.; Talebi, S.; Rafiei, Y. Identification of suitable areas for artificial groundwater recharge using integrated ANP and pair wise comparison methods in GIS environment, (case study: Garbaygan Plain of Fasa). Geogr. Environ. Plan. J. 2012, 22, 41–46. [Google Scholar]
- Bailey, D.; Goonetilleke, A.; Campbell, D. A new fuzzy multi-criteria evaluation method for group site selection in GIS. J. Multi-Criteria Decis. Anal. 2003, 12, 1–11. [Google Scholar]
- Malekmohammadi, B.; Ramezani, M.M.; Jafari, H.R. Site selection for managed aquifer recharge using fuzzy rules: Integrating geographical information system (GIS) tools and multi-criteria decision making. Hydrogeol. J. 2012, 20, 1393–1405. [Google Scholar] [CrossRef]
- Munevar, A.; Marino, M.A. Modeling analysis of ground water recharge potential on alluvial fans using limited data. Ground Water 1999, 37, 649–659. [Google Scholar] [CrossRef] [PubMed]
- Valley, S.; Landini, F.; Pranzini, G.; Puppini, U.; Scardazzi, M.E.; Streetly, M. Transient flow modelling of an overexploited aquifer and simulation of artificial recharge measures. In Recharge Systems for Protecting and Enhancing Groundwater Resources, Proceedings of the 5th International Symposium on Management of Aquifer Recharge, ISMAR5, Berlin, Germany, 11–16 June 2005; UNESCO: Paris, France, 2006; pp. 435–442. [Google Scholar]
- Ringleb, J.; Sallwey, J.; Stefan, C. Assessment of Managed Aquifer Recharge through Modeling-A Review. Water 2016, 8, 579. [Google Scholar] [CrossRef]
- Ganot, Y.; Holtzman, R.; Weisbrod, N.; Bernstein, A.; Siebner, H.; Katz, Y.; Kurtzman, D. Managed aquifer recharge with reverse-osmosis desalinated seawater: Modeling the spreading in groundwater using stable water isotopes. Hydrol. Earth Syst. Sci. 2018, 22, 6323–6333. [Google Scholar] [CrossRef]
- Glass, J.; Via Rico, D.A.; Stefan, C.; Viet Nga, T.T. Simulation of impact of managed aquifer recharge on the groundwater system in Hanoi, Vietnam. Hydrogeol. J. 2018, 26, 2427–2442. [Google Scholar] [CrossRef]
- Department of Water Affairs and Forestry, South Africa (DWAF). The assessment of water availability in the Berg catchment (WMA 19) by means of water resource related models. In Groundwater Model Report Volume 6–Langebaan Road and Elandsfontein Aquifer System Model; Prepared by Umvoto Africa (Pty) Ltd. in association with Ninham Shand (Pty) Ltd. on Behalf of the Directorate: National Water Resource Planning, DWAF Report No. P WMA 19/000/00/0408; DWAF: Pretoria, South Africa, 2008. [Google Scholar]
- Timmerman, K.M.G. Preliminary Report on the Geohydrology of the Cenozoic Sediments of Part of the Coastal Plain Between the Berg River and Elands Bay (Southern Section); Techn Rep. Gh3370; Department of Environment Affairs, Directorate of Water Affairs: Pretoria, South Africa, 1985. [Google Scholar]
- Timmerman, L.R.A. Preliminary Report on the Geohydrology of the Langebaan Road and Enaldsfontein Aquifer Units in the Lower Berg River Region; Techn Rep. Gh3373; Department of Environment Affairs, Directorate of Water Affairs: Pretoria, South Africa, 1985. [Google Scholar]
- Woodford, A.C.; Fortuin, M. Engineers and Scientists Completed for: Assessment of the development potential of groundwater resources for the West Coast District Municipality, specialist geohydrological report for Kwezi-V3 Consulting Engineers. In Pre-Feasibility Study of Potential Water Sources for the Area Served by the West Coast District Municipality; SRK Consulting: Cape Town, South Africa, 2003. [Google Scholar]
- Seyler, H.; Witthüser, K.; Holland, M. The Capture Principle Approach to Sustainable Groundwater Use Incorporating Sustainability Indicators and Decision Framework for Sustainable Groundwater Use; Water Research Commission: Pretoria, South Africa, 2016. [Google Scholar]
- Timmerman, L.R.A. Regional Hydrogeological Study of the Lower Berg River Area, Cape Province South Africa. Ph.D. Thesis, State University Ghent, Ghent, Belgium, 1988. [Google Scholar]
- West Coast District Municipality, South Africa (WCDM). Investigation into Alternative Water Sources for the West Coast District Municipality, Water Study Report; Final; Optimisation of Existing Sources, Compiled by Element Consulting Engineers; WCDM: Western Cape, South Africa, 2009; Volume 2. [Google Scholar]
- Adham, M.I.; Jahan, C.S.; Mazumder, Q.H.; Hossain, M.M.A.; Haque, A.M. Study on groundwater recharge potentiality of Barind tract, Rajshahi District, Bangladesh using GIS and remote sensing technique. J. Geol. Soc. India 2010, 75, 432–438. [Google Scholar] [CrossRef]
- Chenini, I.; Mammou, A.B.; May, M.E. Groundwater recharge zone mapping using GIS-based multi-criteria analysis: A case study in Central Tunisia (Maknassy Basin). Water Resour. Manag. 2010, 24, 921–939. [Google Scholar] [CrossRef]
- Chitsazan, M.; Akhtari, Y. A GIS-based DRASTIC model for assessing aquifer vulnerability in Kherran Plain, Khuzestan, Iran. Water Resour. Manag. 2009, 23, 1137–1155. [Google Scholar] [CrossRef]
- Piscopo, G. Groundwater Vulnerability Map Explanatory Notes: Castlereagh Catchment; NSW Department of Land and Water Conservation: Parramatta, Australia, 2001. [Google Scholar]
- Shankar, M.N.R.; Mohan, G. A GIS based hydro-geomorphic approach for identification of site-specific artificial-recharge techniques in the Deccan Volcanic Province. J. Earth Syst. Sci. 2005, 114, 505–514. [Google Scholar] [CrossRef]
- Murray, J.; Mcdaniel, P.A. Development of a GIS database for ground-water recharge assessment of the Palouse Basin. Soil Sci. 2003, 168, 759–768. [Google Scholar] [CrossRef]
- Yeh, H.F.; Lee, C.H.; Hsu, K.C.; Chang, P.H. GIS for the assessment of the groundwater recharge potential zone. Environ. Geol. 2009, 58, 185–195. [Google Scholar] [CrossRef]
- Jasrotia, A.S.; Kumar, R.; Saraf, A.K. Delineation of groundwater recharge sites using integrated remote sensing and GIS in Jammu District, India. Int. J. Remote Sens. 2007, 28, 5019–5036. [Google Scholar] [CrossRef]
- O’Geen, A.; Saal, M.; Dahlke, H.; Doll, D.; Elkins, R.; Fulton, A.; Fogg, G.; Harter, T.; Hopmans, J.; Ingels, C.; et al. Soil suitability index identifies potential areas for groundwater banking on agricultural lands. Calif. Agric. 2015, 69, 75–84. [Google Scholar] [CrossRef] [Green Version]
- Saaty, T.L. The Analytical Hierarchy Process; Mcgraw-Hill: New York, NY, USA, 1980. [Google Scholar]
- Eastman, J.R.; Kyem, P.A.K.; Toledano, J.; Jin, W. GIS and decision making. United Nations Institute for Training and Research (UNITAR). Explor. Geogr. Inf. Syst. Technol. 1993, 4, 112. [Google Scholar]
- Sharifi, M.A.; Boerboom, L.; Shamsudin, K.B.; Veeramuthu, L. Spatial multiple criteria decision analysis in integrated planning for public transport and land use development study in Klang Valley, Malaysia. In Proceedings of the ISPRS Technical Commission II Symposium, Vienna, Austria, 12–16 July 2006; pp. 85–91. [Google Scholar]
- Kazakis, N. Delineation of Suitable Zones for the Application of Managed Aquifer Recharge (MAR) in Coastal Aquifers Using Quantitative Parameters and the Analytical Hierarchy Process. Water 2018, 10, 804. [Google Scholar] [CrossRef]
- Sharifi, M.A.; Retsios, V. Site selection for waste disposal through spatial multiple criteria decision analysis. J. Telecommun. Inf. Technol. 2004, 3, 1–11. [Google Scholar]
- Winston, R.B. ModelMuse-A graphical user interface for MODFLOW-2005 and PHAST. US Geological Survey Techniques and Methods 6-A29. Available online: http://pubs. usgs. gov/tm/tm6A29 (accessed on 1 June 2009).
- Roberts, D.L.; Siegfried, H.P. The Geology of the Saldanha, Vredenburg and Velddrif Environs; Geological Explanation to Sheets 3317BB, 3318, 3217DB&DD, 3218CA&CC, Scale 1:50 000; Council for Geoscience, South Africa: Pretoria, South Africa, 2014. [Google Scholar]
- Anane, M.; Kallali, H.; Jellali, S.; Ouessar, M. Ranking suitable sites for SAT in Jerba island (Tunisia) using GIS, Remote Sensing and AHP-multicriteria decision analysis. Int. J. Water 2008, 4, 121–135. [Google Scholar] [CrossRef]
- Ghayoumian, J.; Saravi, M.M.; Feizinia, S.; Nouri, B.; Malekian, A. Application of GIS techniques to determine areas most suitable for agricultural recharge in a Coastal Aquifer in Southern Iran. J. Asian Earth Sci. 2007, 30, 364–374. [Google Scholar] [CrossRef]
- Department of Water Affairs and Forestry (DWAF). Groundwater Resource Assessment Phase II. Includes a Suite of Reports Published 2004–2006. Available online: https://www.dwa.gov.za/Groundwater/GRAII.aspx (accessed on 1 May 2006).
Figure 1.
Topographic elevation and geographical location of the study area.

Figure 2.
Geological cross section made by NGA data showing a clay-missing window at the west of Hopefield.
Figure 2.
Geological cross section made by NGA data showing a clay-missing window at the west of Hopefield.

Figure 3.
Conceptual cross-section of the groundwater flow mechanisms (not to scale, after Department of Water Affairs, 2010 [6]).
Figure 3.
Conceptual cross-section of the groundwater flow mechanisms (not to scale, after Department of Water Affairs, 2010 [6]).

Figure 4.
The two-step analysis procedure of suitable sites for MAR.

Figure 5.
Comparison of the criteria and weights used in other similar studies (after Russo et al. 2015 [10]).
Figure 5.
Comparison of the criteria and weights used in other similar studies (after Russo et al. 2015 [10]).

Figure 6.
Criteria for the suitability mapping and hierarchical structure with local weights given in “( )”and global weights given in “[ ]”.
Figure 6.
Criteria for the suitability mapping and hierarchical structure with local weights given in “( )”and global weights given in “[ ]”.

Figure 7.
Procedure for the subcriteria standardization used in this study (range indicates the limit of the criteria value present in the study area).
Figure 7.
Procedure for the subcriteria standardization used in this study (range indicates the limit of the criteria value present in the study area).

Figure 8.
Criteria map used to determine the relative MAR suitability: (a) Source water availability; (b) Infiltration capability; (c) Storage capability; and (d) Influence of pumping wells.
Figure 8.
Criteria map used to determine the relative MAR suitability: (a) Source water availability; (b) Infiltration capability; (c) Storage capability; and (d) Influence of pumping wells.

Figure 9.
Suitable sites map integrated by the GIS based analysis.

Figure 10.
Recharge sites of the MAR in the modeling shown on the suitable sites map.

Figure 11.
Simulated groundwater level map of the study area. The unit of the horizontal and vertical scale is in meters (m).
Figure 11.
Simulated groundwater level map of the study area. The unit of the horizontal and vertical scale is in meters (m).

Figure 12.
Rise in groundwater level and the flow paths of the recharged water. The unit of rise in groundwater contours is meters (m), and the interval of contours is 1 m. The color of the flow paths indicate the flow time: The greener the flow path, the shorter the flow time; and the more purple the flow path, the longer the flow time.

Figure 13.
Simulated rise in groundwater level and the flow paths of recharged water in Scenario 2. The unit of rise in groundwater contours is in meters (m), and the interval of contours is 1 m. The color of flow paths indicates the flow time: the greener the flow path, the shorter the flow time; and the more purple the flow path, the longer the flow time.

Figure 14.
Optimized suitable sites of MAR that benefit the UAU of the WCDM well field.


Table 1.
Layer arrangement for the numerical model.
| Layer in Model | Representing | Thickness (m) | Data Source |
|---|---|---|---|
| 1 | UAU | 0.1–121.0 | Layer top: DEM Layer bottom: UAU bottom as defined through NGA lithology data |
| 2 | Clay layer | 0–84.0 | Layer top: UAU bottom as defined through NGA lithology data. Layer bottom: clay bottom as defined through NGA lithology data. |
| 3 | LAU | 0.1–64.5 | Layer top: clay bottom as defined through NGA lithology data. Layer bottom: bedrock elevation defined through NGA lithology data. |
| 4 | Bedrock | 20.0 | Layer top: bedrock elevation defined through NGA lithology data. Layer bottom: bedrock elevation—20 m |
Table 2.
Stratigraphy and hydrogeological characteristics of the West Coast (after Seyler et al. 2016 [26]; Roberts and Siegfried 2014 [44]).
| Group | Formation | Origin | Lithology | Function in Aquifer System | Thickness (m) | Hydraulic Conductivity Kx (m/d) |
|---|---|---|---|---|---|---|
| Sandveld | Witzand | Aeolian | Semi consolidated calcareous dune sand. | Upper unconfined aquifer (UAU) | 0~121 | 0.09~60 |
| Springfontyn | Aeolian | Clean quartzitic sands, a decalcified dune sand. Dominates in the coastal zone. | ||||
| Langebaan | Aeolian | Consolidated calcareous dune sand. The Aeolian deposit accumulated during the last glacial lowering of sea level when vast tracks of un-vegetated sand lay exposed on the emerging sea floor. | ||||
| Velddrif | Marine | Beach sand. Associated with the last interglacial sea level rise with 6–7 m above present level. | ||||
| Vaarswater | shallow-marine, estuarine, marsh and fluvial. | Deposits include a coarse basal beach gravel member, peat layers, clay beds, rounded fine to medium quartzes sand member and palatal phosphate rich deposits. | ||||
| Elandsfontyn | Fluvia | Clays and peat in the upper sections. | Aquitard | 0~84 | 4.3 × 10⁻⁵~2 | |
| Coarse fluvial sands and gravels, deposited in a number of palaeochannels filling depressions. | Confined lower aquifer unit (LAU) | 0~64.5 | 0.5~70 | |||
| Cape Granite Suite | Granites | Aquitard | / | 4.3 × 10⁻³~0.26 | ||
| Malmesbury Group | Metamorphosed shales | |||||
Table 3.
Details of the modeling scenarios.
| Scenario No. | Aim | Scenario Description |
|---|---|---|
| Scenario one | Modeling the influence of recharging at different sites | Six infiltration ponds (Length × Width × Depth: 250 m × 250 m × 3 m) with the recharge rate of 200 m3/d respectively are placed at the different sites. A and B representing locations with high suitability; C and F representing locations with medium suitability; D and E representing locations with low suitability. MODPATH is used to trace the recharged water. |
| Scenario two | Modeling the impact to WCDM well field when implementing MAR. | Three infiltration ponds (250 m × 250 m × 3 m) with the recharge rate of 200 m3/d each are placed at the locations with high suitability. The order of suitability index is J > K, L. Two abstraction wells located at WCDM well field pump water at the rate of 1000 m3/d each. MODPATH is used to trace the recharged water. |
Table 4.
Simulated results of implementing MAR in the UAU.
| Location | Suitability Map Site | Discharge Location | Length of Flow Path | Maximum Rise in Groundwater Level (m) | Region of Ground Water Level Rise above 1 m |
|---|---|---|---|---|---|
| Infiltration pond A | Highest Suitability | Partly to tributary of Berg River, partly to Langebaan Lagoon | 8300–16,300 | +4.0 | A nearly circular region with 13,000 m in diameter. |
| Infiltration pond B | High Suitability | Berg river | 15,600–16,700 | +5.0 | A nearly circular region with 4600 m in diameter. |
| Infiltration pond C | Medium Suitability | Langebaan Lagoon | 7900 | +1.0 | A nearly circular region with 250 m in diameter. |
| Infiltration pond D | Low Suitability | Tributary of Berg River | 440–12,700 | +12.0 | A nearly circular region with 3700 m in diameter. |
| Infiltration pond E | Low Suitability | Tributary of Berg River | 1200–1950 | +8.0 | A nearly circular region with 4100 m in diameter. |
| Infiltration pond F | Medium Suitability | Coastline | 4300 | +3.0 | A nearly circular region with 3400 m in diameter. |
© 2019 by the authors. Licensee MDPI, Basel, Switzerland. This article is an open access article distributed under the terms and conditions of the Creative Commons Attribution (CC BY) license (http://creativecommons.org/licenses/by/4.0/).
Share and Cite
MDPI and ACS Style
Zhang, H.; Xu, Y.; Kanyerere, T. Site Assessment for MAR through GIS and Modeling in West Coast, South Africa. Water 2019, 11, 1646. https://doi.org/10.3390/w11081646
AMA Style
Zhang H, Xu Y, Kanyerere T. Site Assessment for MAR through GIS and Modeling in West Coast, South Africa. Water. 2019; 11(8):1646. https://doi.org/10.3390/w11081646
Chicago/Turabian StyleZhang, Heng, Yongxin Xu, and Thokozani Kanyerere. 2019. "Site Assessment for MAR through GIS and Modeling in West Coast, South Africa" Water 11, no. 8: 1646. https://doi.org/10.3390/w11081646
Note that from the first issue of 2016, this journal uses article numbers instead of page numbers. See further details here.