Use of Visible Light Modulation Techniques in Urea Photocatalytic Degradation


1
Department of Industrial Engineering, University of Salerno, via Giovanni Paolo II, 132, 84084 Fisciano, SA, Italy
2
Department of Chemistry and Biology “A. Zambelli”, University of Salerno, via Giovanni Paolo II, 132, 84084 Fisciano, SA, Italy
3
Department of Information and Electrical Engineering and Applied Mathematics, University of Salerno, via Giovanni Paolo II 132, 84084 Fisciano, SA, Italy
*
Author to whom correspondence should be addressed.
Water 2019, 11(8), 1642; https://doi.org/10.3390/w11081642
Submission received: 26 July 2019
/
Revised: 6 August 2019
/
Accepted: 7 August 2019
/
Published: 8 August 2019
(This article belongs to the Special Issue Advances in Water and Wastewater Monitoring and Treatment Technology)
Abstract
:The aim of this work was to analyze the effect of visible LED dimming duty-cycle modulation techniques in a photocatalytic system for urea degradation using a visible light photocatalyst immobilized on macroscopic supports. For this reason, the effect of different LED dimming techniques was investigated and compared in terms of urea degradation together with ammonia and nitrate production during the irradiation time. The experimental results evidenced that using a visible LED dimming modulation with variable-peak variable-duty pulse-width modulation (PWM) allows to improve the photocatalytic degradation process, with respect to classical LED dimming with fixed-peak fixed-duty PWM, and influences the product’s distribution of ammonia and nitrate in water. Therefore, the proof of concept herein proposed could be considered as preliminary potential results to be used in water recycling applications with a particular emphasis in recovery of urea photodegradation byproducts, such as ammonia, from wastewater that could be used as potential resources and an energy resource.
1. Introduction
The environmental issue related to contamination of wastewater by urea has been growing due to its high-volume use in various industries such as fertilizers [1], explosives, pharmaceuticals, cosmetics, and plastic industries [2]. Moreover, urea is a main component of human and animal urine. Even if urea is biodegradable, it could be considered as a source of nitrogen that allows for eutrophication and algal blooms in coastal waters [3]. Recently, in preparation for future space explorations, [4,5] in order to reduce the amount of water that must be supplied from the Earth, space stations need to resolve the problem of water supply and sewage water treatment [6]. Approximately 80% of human wastewater in space is constituted by urine, and the National Aeronautics and Space Administration (NASA) estimates that, during manned space missions, 60 g/person/d of urine is produced, with urea and various salts as its main components [7]. Different solutions in this field have been reported. Up to now, the reported methods of purifying urine mainly involve distillation [8], freezing crystallization [9], biological treatments [10], and membrane-based treatments [11]. In particular, two different membrane-based treatments were recently studied for urine treatment: reverse osmosis (RO) and vacuum membrane distillation (VMD) treatment [11]. The RO membrane has a high retention for organic pollutants and inorganic salts, but it usually suffers of membrane fouling or scaling, which can be overcome by a suitable pretreatment or adding chemical agents [12]. VMD is a low-cost and highly efficient process, which has nearly 99% rejection for chemical oxygen demand (COD), but for ammonia-nitrogen, the removal rate is not very high [11]. As a result, the search for new, more efficient, more environmentally friendly, and more compact technologies for urine treatment has always been a necessity.
In this context, a technology based on semiconductor photocatalysis could be a more promising solution. The photocatalytic systems, in fact, offer a wide range of advantages:
- flexibility (able to remove from water a wide range of hazardous contaminants such as pesticides, herbicides, detergents, viruses, coliforms, and spores);
- cheapness (it does not require regeneration processes, and it is able to operate at ambient temperature and atmospheric pressure); and
- absence of waste (the pollutant is mineralized to CO2 and H2O and not transferred into another phase) [13].
TiO2 and Pt/TiO2 are the most studied catalytic systems for the photodegradation of urea under UV irradiation [6,14]. However, no paper has been devoted to the photocatalytic degradation of urea under visible light.
Recently, in our previous works [15,16], it was observed that light irradiation with the modulation of a visible LED dimming duty-cycle strongly improved the photocatalytic performances of an active visible light photocatalyst towards methylene blue degradation. To our best knowledge, the use of LED dimming duty-cycle modulation techniques in a photocatalytic system for urea degradation using a visible light photocatalyst immobilized on macroscopic supports has never been reported. For this reason, the aim of this work is to investigate the influence of controlled modulation of LED light dimming on the performances of a photocatalytic reactor for urea treatment using visible active photocatalyst (N-doped TiO2) immobilized on polystyrene pellets. In particular, the influence of visible light modulation techniques on pathways of urea photocatalytic degradation has been analyzed, with the aim to achieve a reaction product such as ammonia, which could be used as a potential energy resource in a spacecraft.
2. Materials and Methods
2.1. Preparation of the Structured Photocatalyst (N-TiO2/PS)
The visible, active, nitrogen-doped TiO2 (N-TiO2) photocatalyst was synthetized by direct nitration during the hydrolysis of titanium tetraisopropoxide with ammonia aqueous solutions followed by calcination in air at 450 °C for 30 min [17]. The optimal N/Ti molar ratio (equal to 18.6), found in our previous studies [18,19], was applied in the preparation to get a more active N-doped TiO2. The physical and optical characterization of the N-doped titania in powder form evidenced that the main crystallographic phase was anatase, and the band-gap energy was equal to 2.5 eV [19]. The supports used for the immobilization of N-TiO2 particles were polystyrene pellets [20]. The structured photocatalyst, named N-TiO2/PS, was prepared by a solvent-assisted procedure according to the methods reported in our previous work [20,21]. Firstly, 1.5 g of N-TiO2 photocatalyst was dispersed in 62.5 mL of acetone and vigorously stirred until a dispersion of particles was obtained. Then, 25 g of polystyrene (PS) pellets were added to the suspension, and the system was mixed for two minutes at room temperature. During this time, thanks to chemical actions induced by acetone that act as a solvent for the polystyrene, N-TiO2 particles were bound to the external surface of PS pellets [20]. After two minutes, N-TiO2/PS pellets were removed from the suspension and dried at room temperature for 24 h. The amount of photocatalyst coated on PS pellets was measured by an analytical balance (Ohaus Mettler Toledo, 0.1 mg resolution), and the final loading of N-TiO2 was found to be about 0.1 wt %.
2.2. Experimental Setup for Photocatalytic Tests
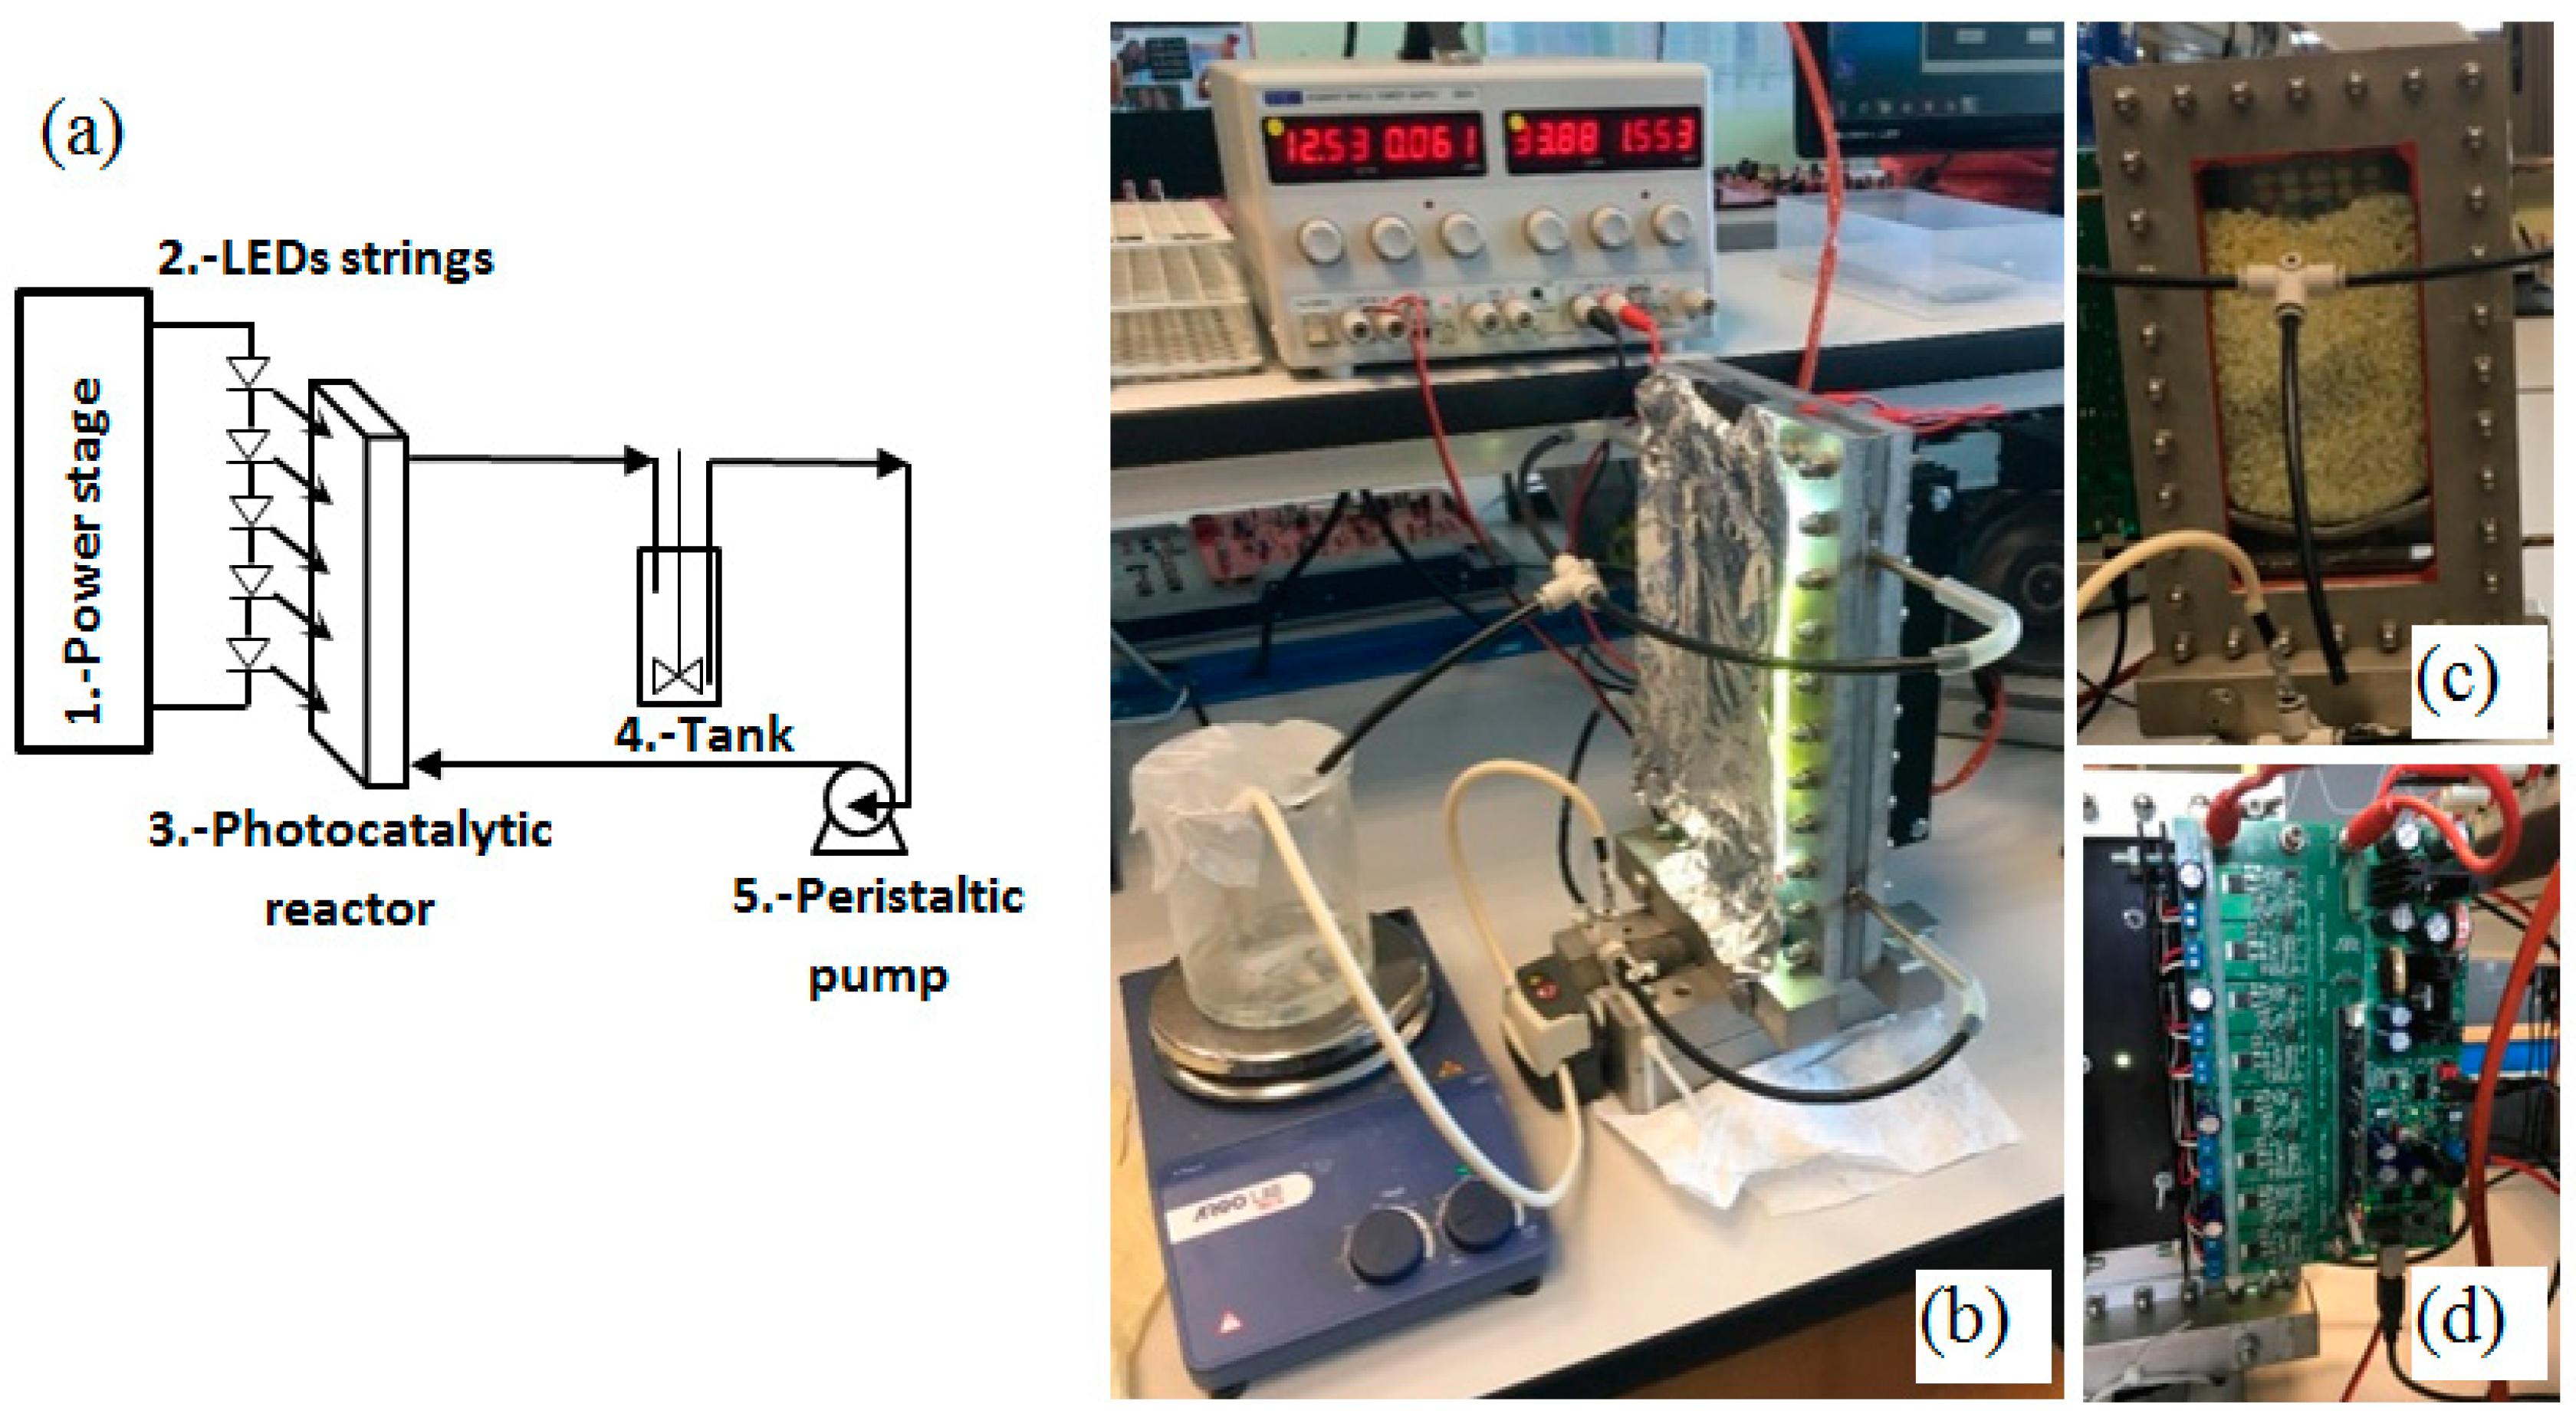
The photocatalytic system shown in Figure 1 is comprised of a fixed bed photocatalytic reactor with flat-plate geometry, a panel of 8 visible LED strings, a peristaltic pump for liquid recirculation, and a tank containing the solution to be treated.
A flat-plate photocatalytic reactor (height = 145 mm; length = 90 mm; thickness = 10 mm) was adopted for the development of LED dimming techniques. The chosen reactor geometry guarantees (Figure 1c) efficient excitation of the active visible light photocatalyst by minimizing photon loss inside the core of the rector [22]. The reactor was illuminated by the LED panel, positioned in front of one of the two Pyrex transparent windows of the photoreactor. The other window was covered with an aluminum plate in order to reflect the light coming through the catalytic bed and minimize photonic loss through the reactor. The Osram Opto Golden Dragon series LUW W5SM-JZKY-5F8G white LEDs were used as light sources. They irradiate a typical nominal luminous flux between 61 and 71 lm with a typical forward voltage drop between 2.8 and 3.6 V at 350 mA DC current and luminous irradiation peak spectral emission at 550 nm wavelength.
A total solution volume of 250 mL was introduced in an external tank. A recirculation flow of 250 mL min−1 was obtained by means of a peristaltic pump (Watson Marlow). The amount of N-TiO2/PS catalyst used during the photocatalytic test was equal to 120 g, realizing a compact, packed bed. The liquid stream, fed by the bottom, passed through the photocatalytic bed and emerged from the top of the reactor to be collected in the tank. Before irradiation, the system was left in dark conditions for 120 min to achieve an adsorption/desorption equilibrium of the pollutant on the photocatalyst surface. After the dark phase, the photocatalytic test was conducted under visible light irradiation for 360 min.
2.3. Analytical Procedures
The initial urea concentrations used for the tests were 250 mg/L and 25 g/L. Photocatalytic tests were carried out by dissolving urea firstly in distilled water (at 250 mg/L initial concentration) and then in a synthetic urine water (at 25 g/L) without other organic compounds. The characteristics of synthetic urine are reported in Table 1.
Finally, in order to check the influence of the substances different from urea present in the synthetic urine (whose composition is reported in Table 1), a photocatalytic test was performed using a water sample obtained by dissolving urea in distilled water until an initial urea concentration equal to that of the synthetic urine (25 g/L) was achieved.
At different times, about 3 mL of the solution was withdrawn from the external tank and analyzed for the measurement of urea, NO3−, and NH4+ concentrations. Urea concentration was determined by spectrophotometric methods according to the procedure reported by Bojic et al. [23]. The UV/Vis spectra were acquired between 300 and 600 nm using a Thermo UV/Vis spectrophotometer (Evolution 201) equipped with 10 mm quartz cuvette. Finally, the ammonia and NO3− produced after 4 h of reaction was evaluated by means of the photometric method with a Nanocolor compact photometer PF-12Plus.
3. Results and Discussion
3.1. Control Experiments: Photolysis under Visible Light Irradiation
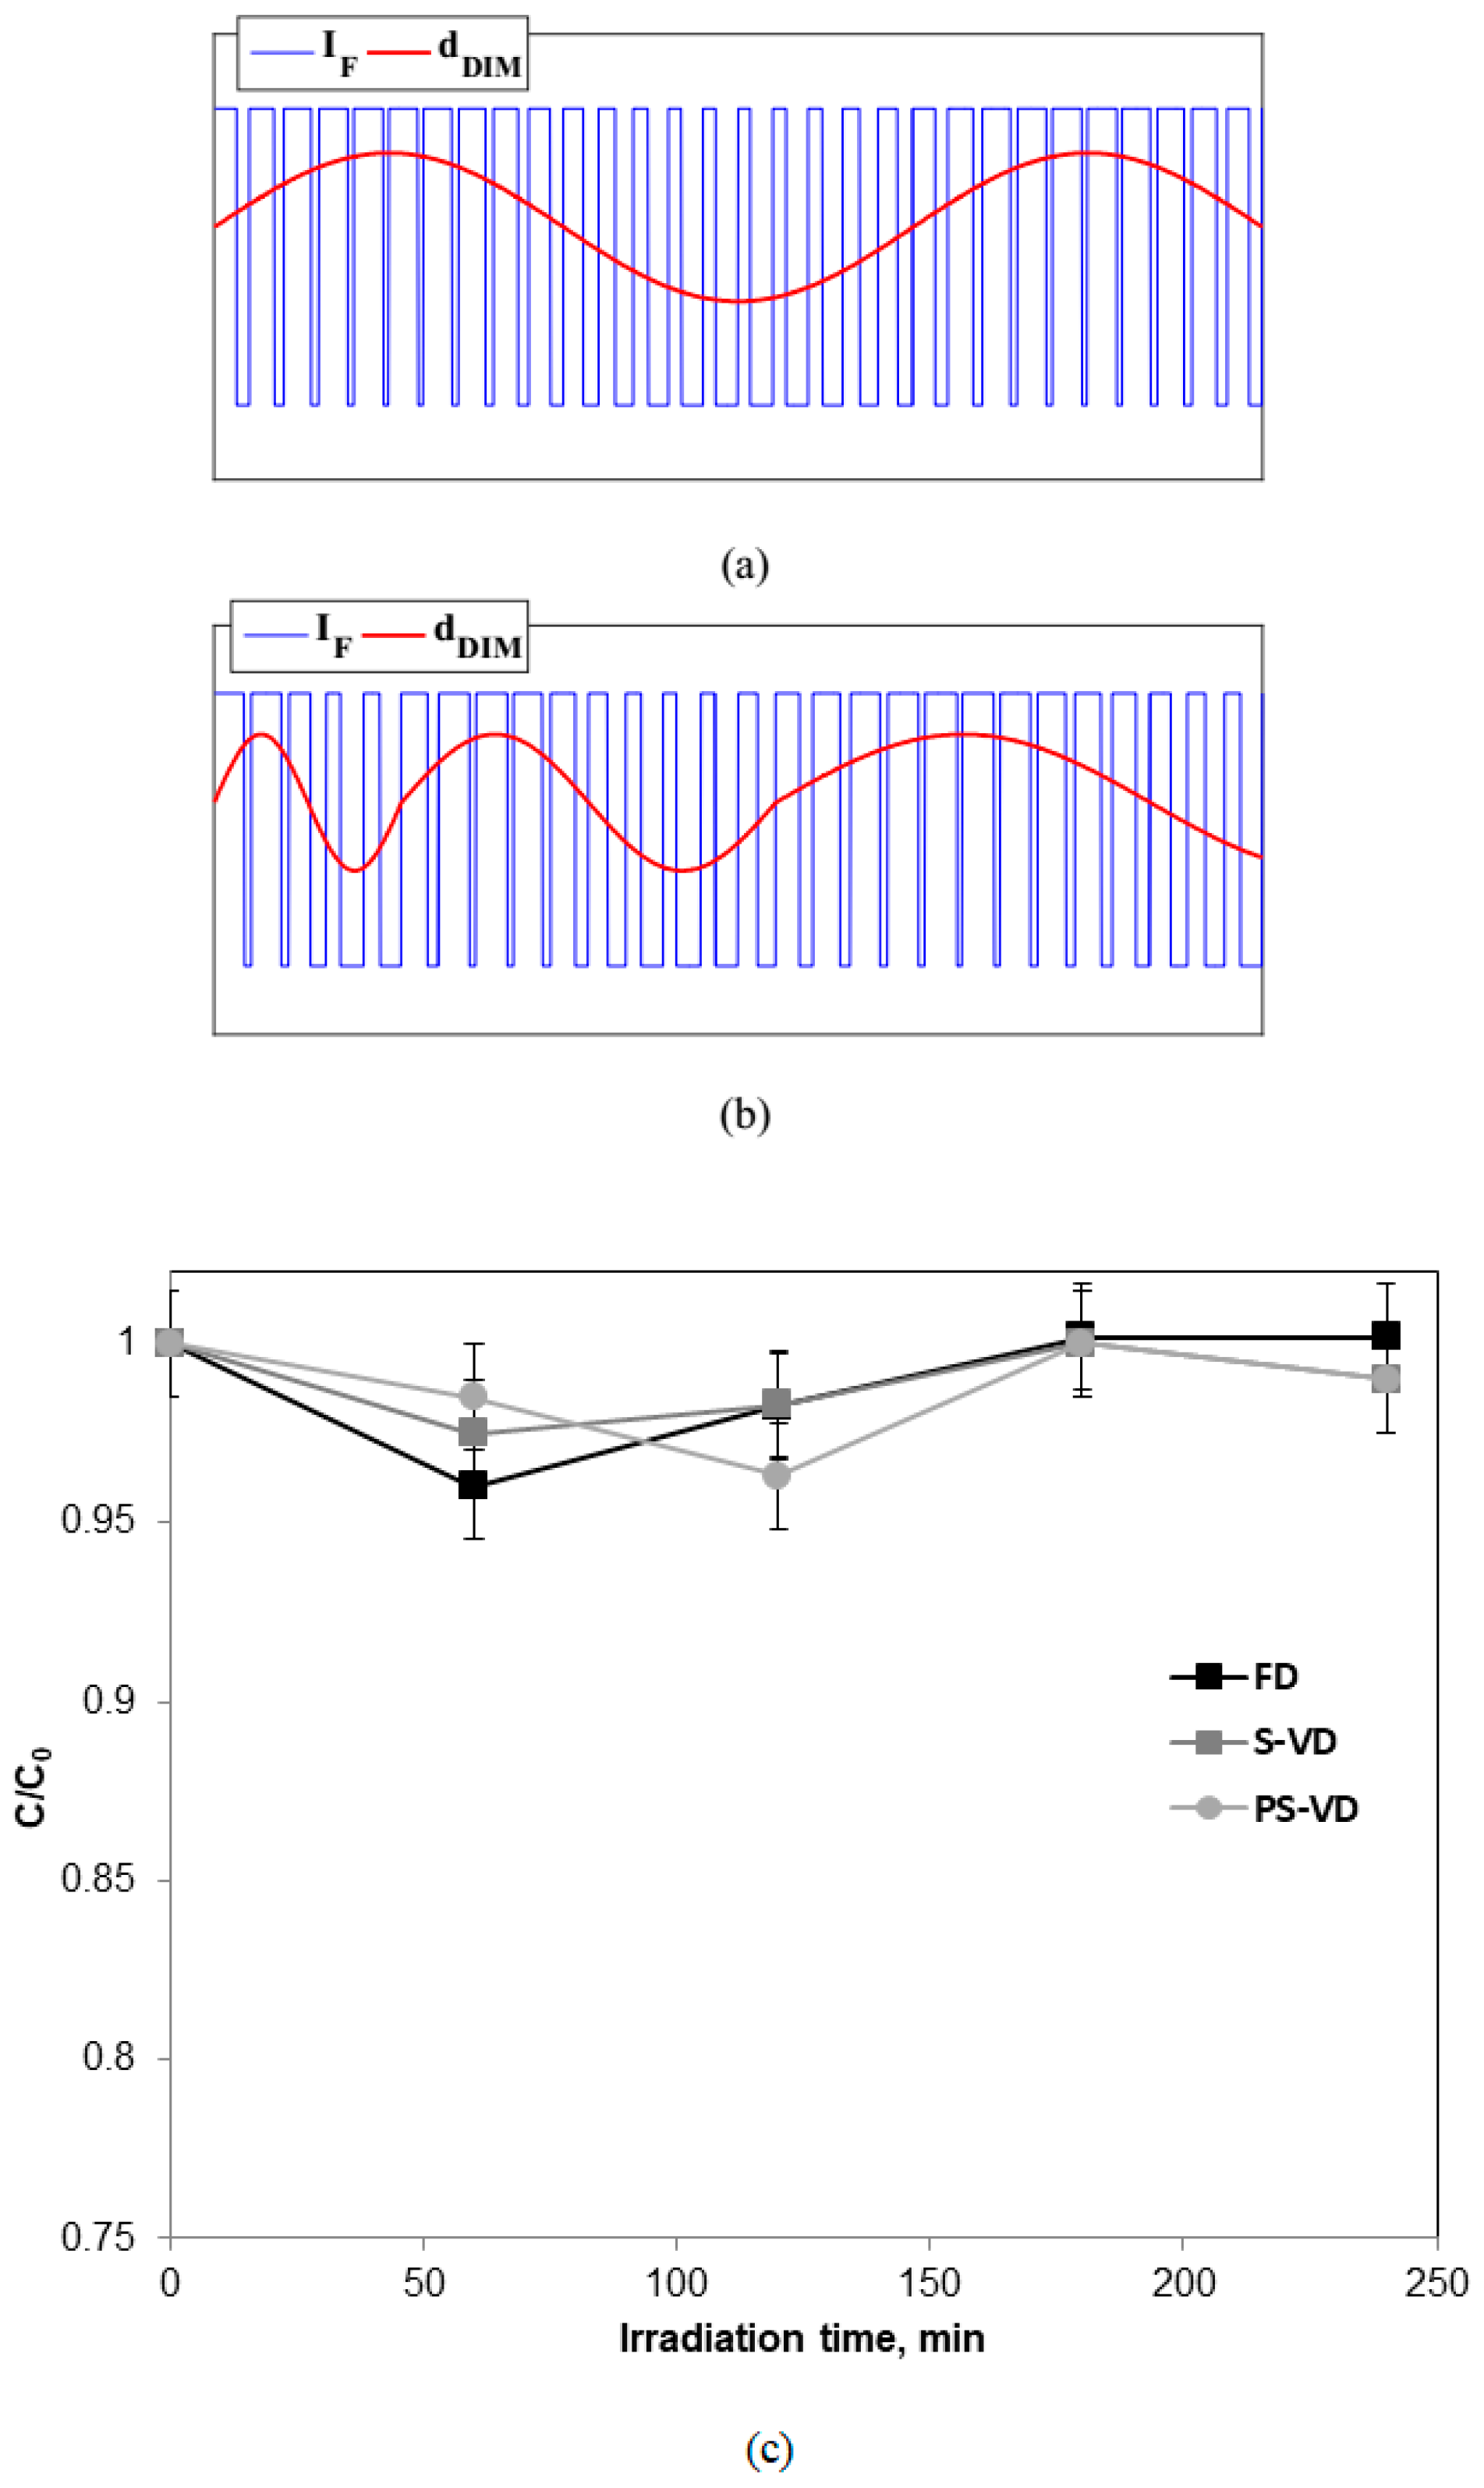
Preliminary tests were carried out in order to verify that the observed degradation of the target pollutant was attributed to the photocatalytic activity of the N-TiO2/PS catalyst. Specifically, analysis was conducted, in the absence of the photocatalyst, on the stability of urea (initial concentration equal to 250 mg/L) in distilled water under visible light irradiation at fixed duty (FD) LED dimming and by using sinusoidal-variable duty (S-VD) and pseudosinusoidal-variable duty (PS-VD) LED dimming modulations (Figure 2). In the FD LED dimming mode, the ON state LED current was regulated at 200 mA. In this case, the LEDs irradiated about 62.5% of their nominal luminous flux (in the range 61–71 lm per LED). In the S-VD LED dimming modulation and PS-VD LED dimming modulation, the ON state LED current was modulated between 100 and 300 mA. In this case, the LEDs irradiated between 37.5% and 87.5%, respectively, of their nominal luminous flux. IF is the LED forward current in the ON state. Ts is the dimming period, corresponding to the periodic interval of time wherein the LED is alternately turned ON and OFF, so that its forward current IF switches alternately between a given ON state value and zero in a way depending on the dimming modulation implemented (see the blue curves in Figure 2a,b). tON is the LED ON time interval, corresponding to the fraction of the dimming period Ts, wherein the LED is in the ON state and generates light irradiation. dDIM = tON/TS is the LED dimming duty cycle, corresponding to the relative fraction of the dimming period Ts, wherein the LED is in the ON state and generates light irradiation.
The experimental results reported in Figure 2 indicated that, in all analyzed cases, direct photolysis had a negligible effect on the degradation of urea.
3.2. Effect of the Treated Solution Volume
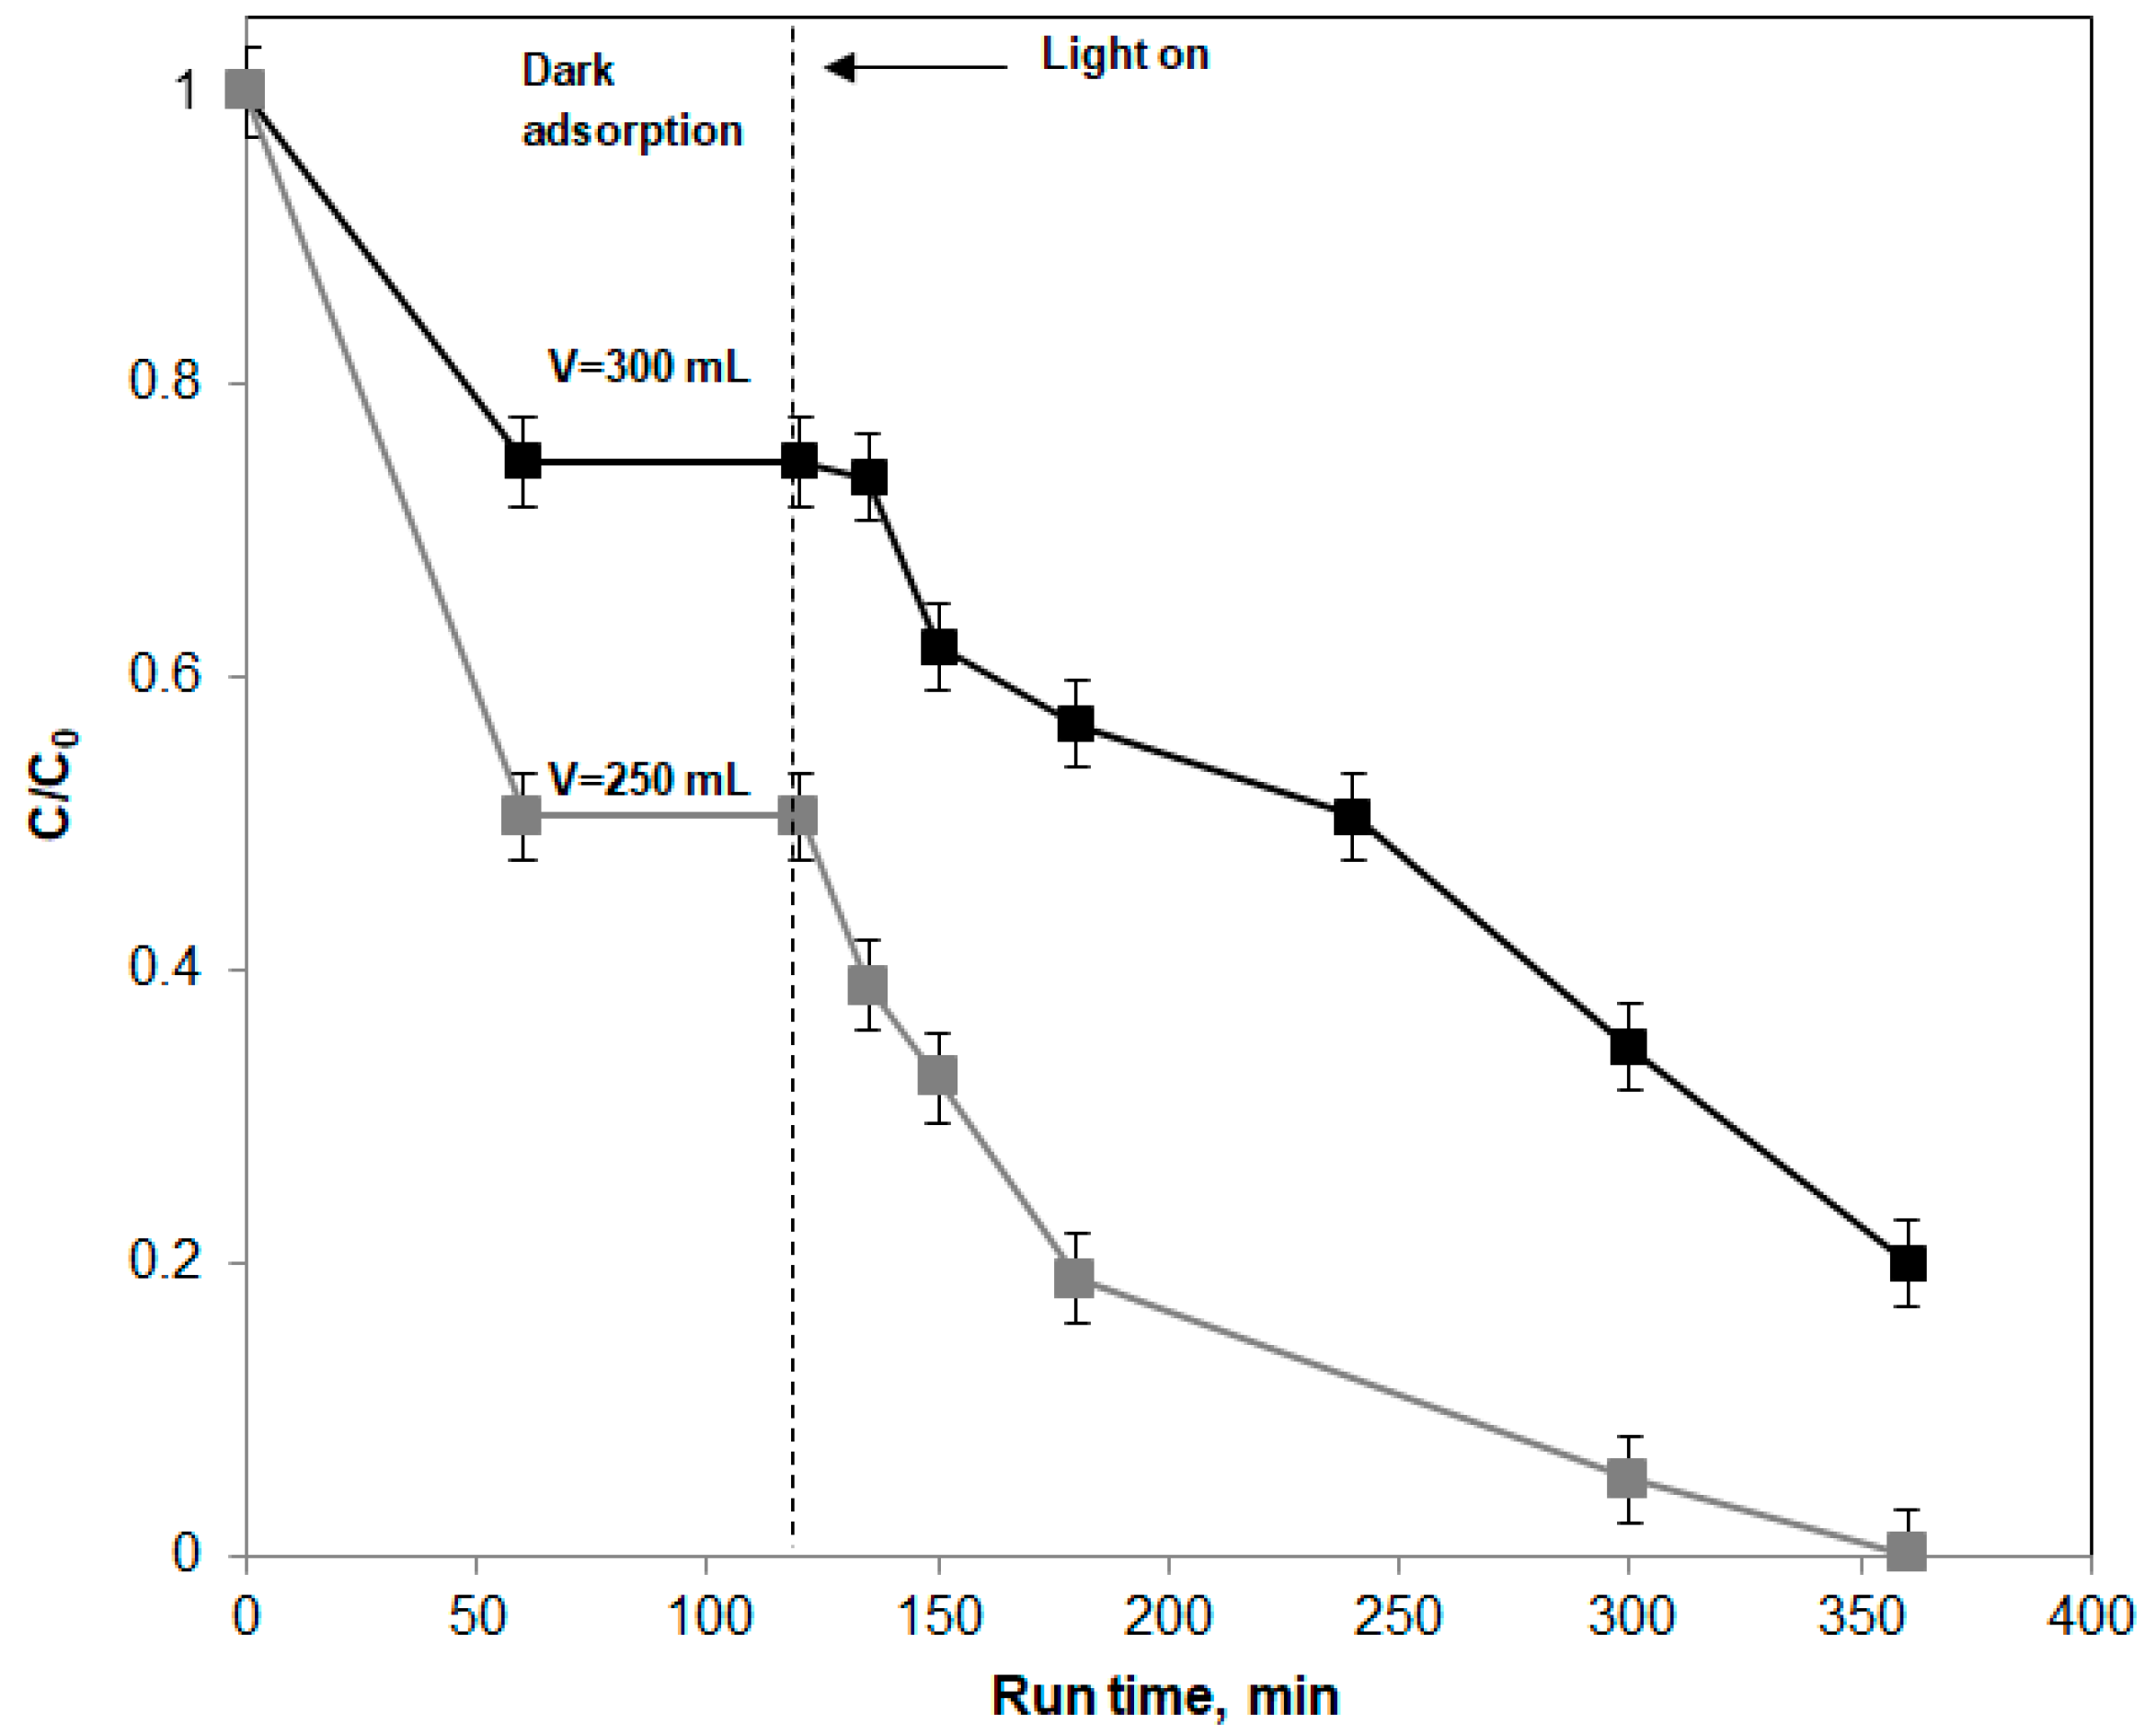
Figure 3 shows the behavior of urea degradation in distilled water during the dark phase and under irradiation time using FD LED dimming (48 W, 200 mA) and by varying the volume of polluted water to be treated. Differently from the photolysis tests (Figure 2), degradation of urea occurred in the presence of the N-TiO2/PS photocatalyst and under visible light irradiation. Before the photoreaction (dark phase), at 250 and 300 mL solution volumes, about 50% and 29% of initial urea was adsorbed, respectively, on the surface of N-TiO2/PS.
This result is consistent with literature data [17].
After the dark period, the solution was irradiated by visible light, and the reaction started to occur. Comparing the result obtained at fixed treatment time (180 min), the urea degradation obtained with a volume of 300 mL was equal to 43%, compared to 81% achieved by using 250 mL of aqueous solution volume. This last result is explained considering that the photocatalyst amount was the same for both tests. Therefore, as expected, an increase of the solution volume determined lower degradation performances. However, it is worthwhile to note that the urea degradation rate after 30 min of irradiation time was equal to 0.78 and 0.79 mg/(L min) for a volume of 250 and 300 mL, respectively, meaning that the activity of the photocatalyst was the same for both the treated solution volumes.
3.3. Influence of Visible LED Modulation
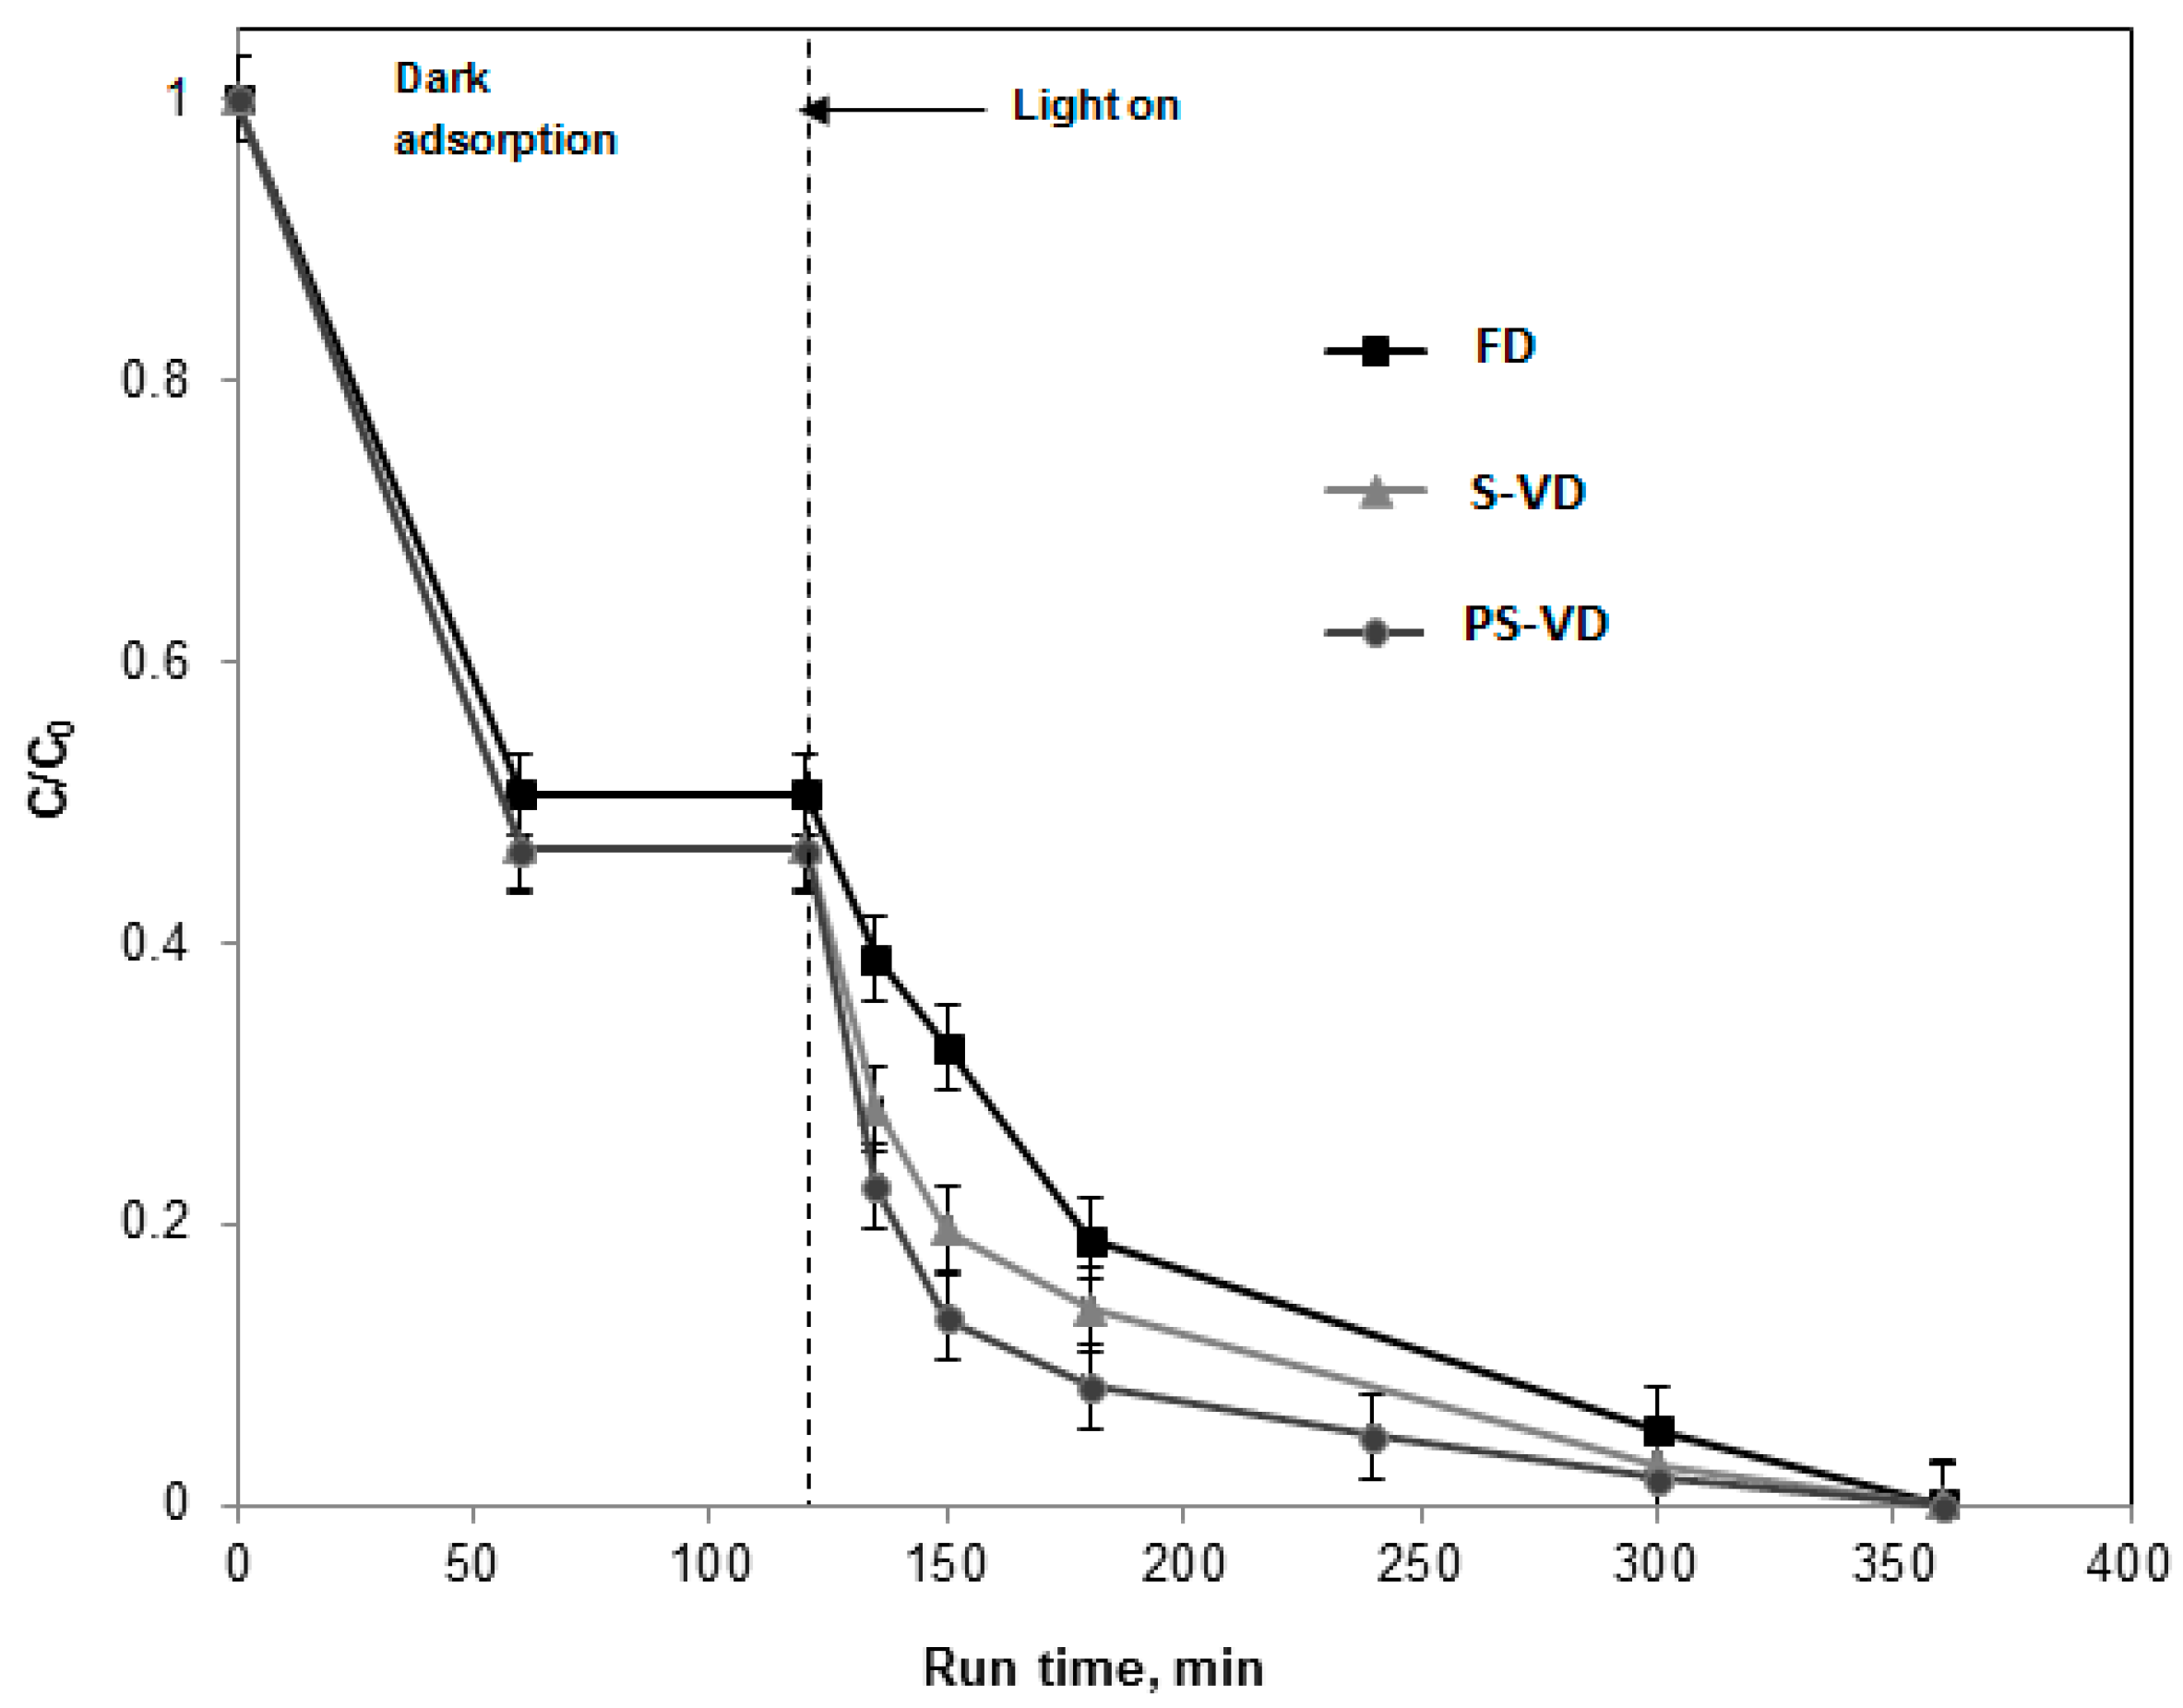
The influence of visible LED dimming modulation has been investigated using 120 g of the N-TiO2/PS photocatalyst at 250 mg/L of urea initial concentration in distilled water (solution volume equal to 250 mL). In detail, Figure 4 reports the comparison between the photocatalytic activity of N-TiO2/PS at fixed duty-cycle and at variable duty-cycle LED dimming modulations.
The effect of the LED light modulation technique on the photocatalytic activity is clearly evident. At variable LED dimming duty-cycle modulations, either S-VD or PS-VD promoted the photocatalytic performances with respect to the irradiation realized at fixed dimming duty cycles, as already observed for methylene blue discoloration [15]. In particular, the best results in terms of urea degradation (about 92% in less than 1 h of irradiation) have been achieved with a pseudosinusoidal modulation. In order to understand the influence of LED light modulation techniques on photocatalytic activity, the kinetic constant of urea degradation was evaluated. For this purpose, it was considered that the urea photodegradation can be described by pseudo-first-order kinetics [24]. The photodegradation rate (r) depends on the initial pollutant concentration (C) in accordance with Equation (1):
In this case, C indicates the concentration of urea in mg·L−1, and k is the kinetic constant in min−1. Considering the mass balance (Equation (2)):
and integrating Equation (2) between initial time (t = 0) and a generic irradiation time t, the following equation is obtained (Equation (3)):
The value of the kinetic constant k can be calculated by the slope of the straight line obtained from plotting versus irradiation time (t). The highest value of k (0.0275 min−1) was obtained using the PS-VD LED dimming modulation, evidencing the existence of light modulation influences. In fact, the kinetic constant increased from 0.0207 min−1 for FD LEDs modulations to 0.0249 and 0.0275 min−1 for S-VD and PS-VD LEDs dimming modulations, respectively. Possibly, the FD LED dimming technique induces electron–hole recombination because of the high electron concentration, stopping the hole oxidation reactions and, thus, limiting the photocatalytic process [25]. On the contrary, using the S-VD LED and PS-VD LED dimming modulations, the improvement in photocatalytic performances may be ascribed to the depletion of oxygen being re-adsorbed onto the surface, with some re-adsorption of urea molecules onto the photocatalyst surface as well [26]. As a consequence, oxygen may subsequently react with the excess electrons, thus, inhibiting the recombination rate of photogenerated electrons and holes. However, further investigations are necessary to explain the improved results obtained with S-VD LED and PS-VD LED dimming modulations.
3.4. Influence of Water Matrix
In order to evaluate the effect of the water matrix on the process’ efficiency, the influence of possible radical scavenger substances, commonly present in a synthetic urine matrix, was examined. This aspect that commonly leads to a decrease of photocatalytic activity is well discussed in literature [27]. In particular, the authors attributed this phenomenon to [28]: (i) a competitive adsorption of inorganic ions on the photocatalyst surface, which consequently blocks adsorption sites for the target molecules; and to (ii) a possible scavenging effect of the adsorbed inorganic ions, which consume photogenerated holes with a consequent decrease in photocatalytic efficiency.
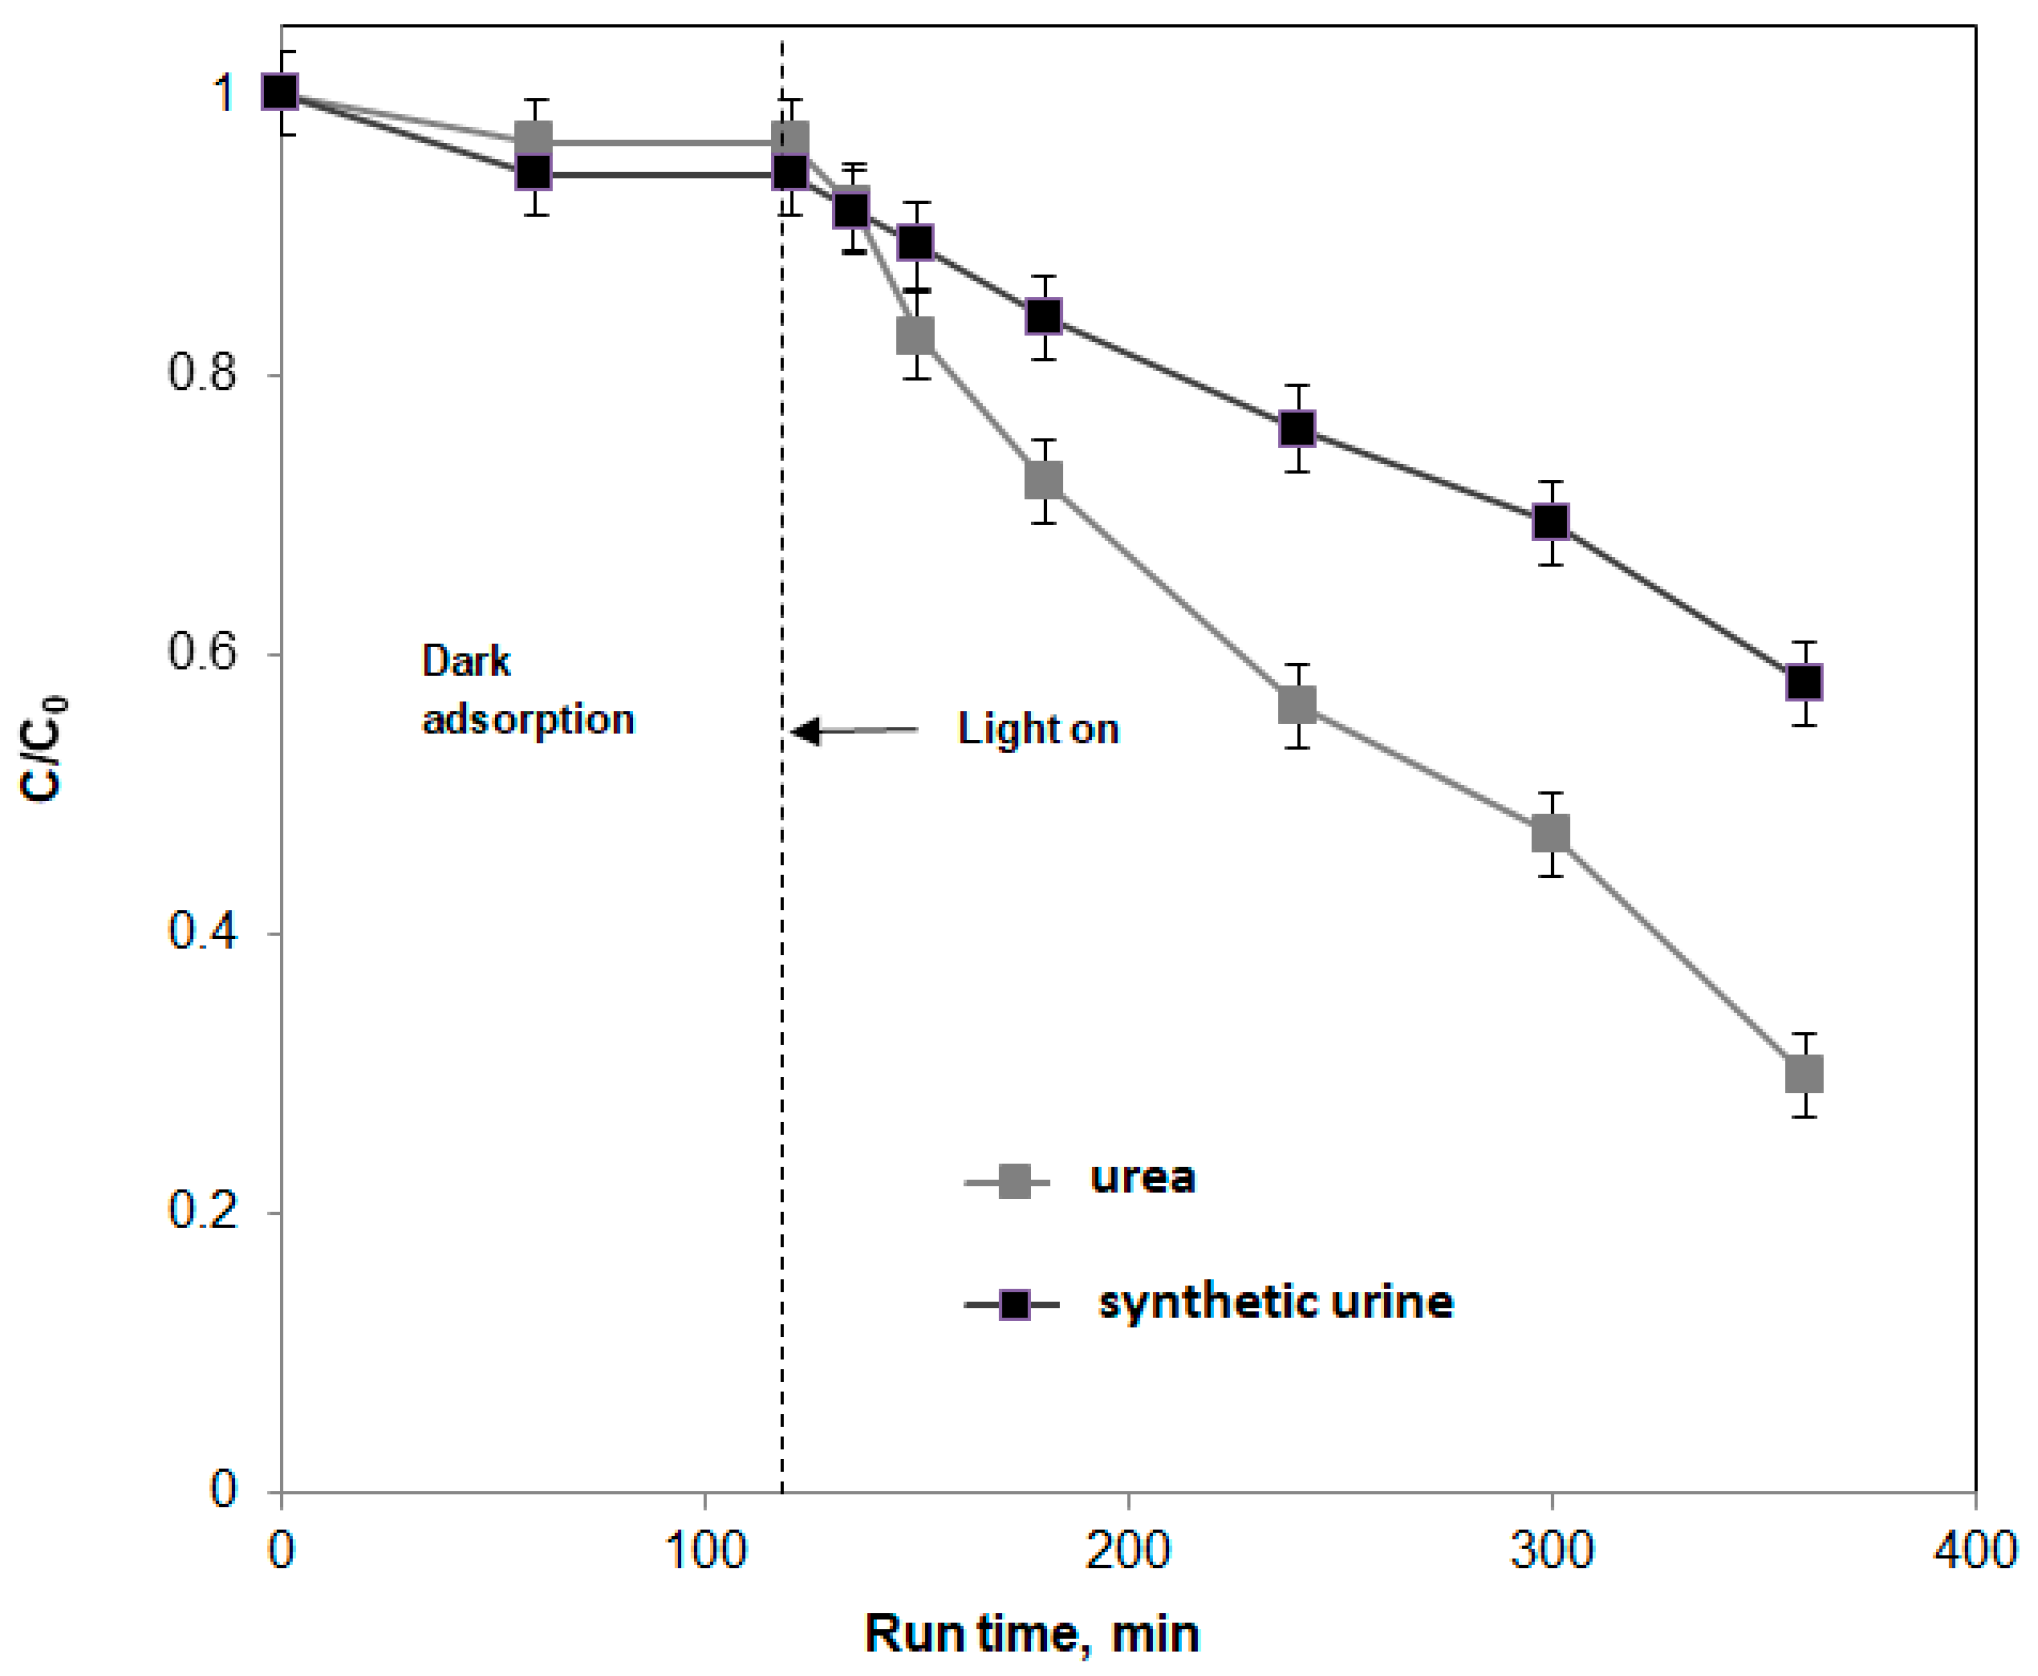
Therefore, photocatalytic tests using N-TiO2/PS were performed on a synthetic urine water sample (Table 1) with a urea initial concentration of 25 g/L, and the results were compared to those achieved in photocatalytic tests in distilled water with the same urea concentration. For both tests, the photoreactor was irradiated using a PS-VD LED dimming modulation. As reported in Figure 5, the photocatalytic activity decreased in the case of the synthetic urine matrix. In detail, at a fixed run time (360 min), the degraded urea obtained in distilled water was equal to 70%, higher than that achieved using the synthetic urine matrix (43%). As expected, the experimental results evidenced that the presence of inorganic ions (Table 1) affects the activity of the photocatalyst active sites, leading to a decrease in photocatalytic performance. One possible reason could be attributed to the competitive adsorption of inorganic ions on the photocatalyst surface, as reported in literature [28]. In fact, since the photocatalytic mechanism is generally based on the reaction of OH• radicals and organic compounds previously adsorbed on the photocatalyst surface, the decrease of organic compound’s adsorption could be one of the main causes of the decrease in photocatalytic activity [29]. However, the obtained experimental data (Figure 5) evidenced that this phenomenon was not the main cause of the decrease of photocatalytic activity.
In fact, it is evident that the adsorption degree of urea on the photocatalyst surface (dark conditions) was not influenced by the presence of inorganic compounds present in the synthetic urine (Table 1). For this reason, the main causes that can affect the photocatalytic activity could be explained considering that the Cl−/Cl2•- redox potential is equal to 2.3 eV versus NHE [27]. The N-TiO2 valence band (EVB) calculated with the Mulliken [30] equation (EVB = 2.56 V vs. NHE) is suitable for the oxidation of chloride ions adsorbed on the N-TiO2 surface. Therefore, as also reported by Krivec et al. [27], the adsorbed chloride ion (Cl−) acts as a hole scavenger, reducing the available OH• radicals. As a consequence, urea photodegradation performances worsened.
3.5. Stability Experiments on the N-TiO2/PS Photocatalyst
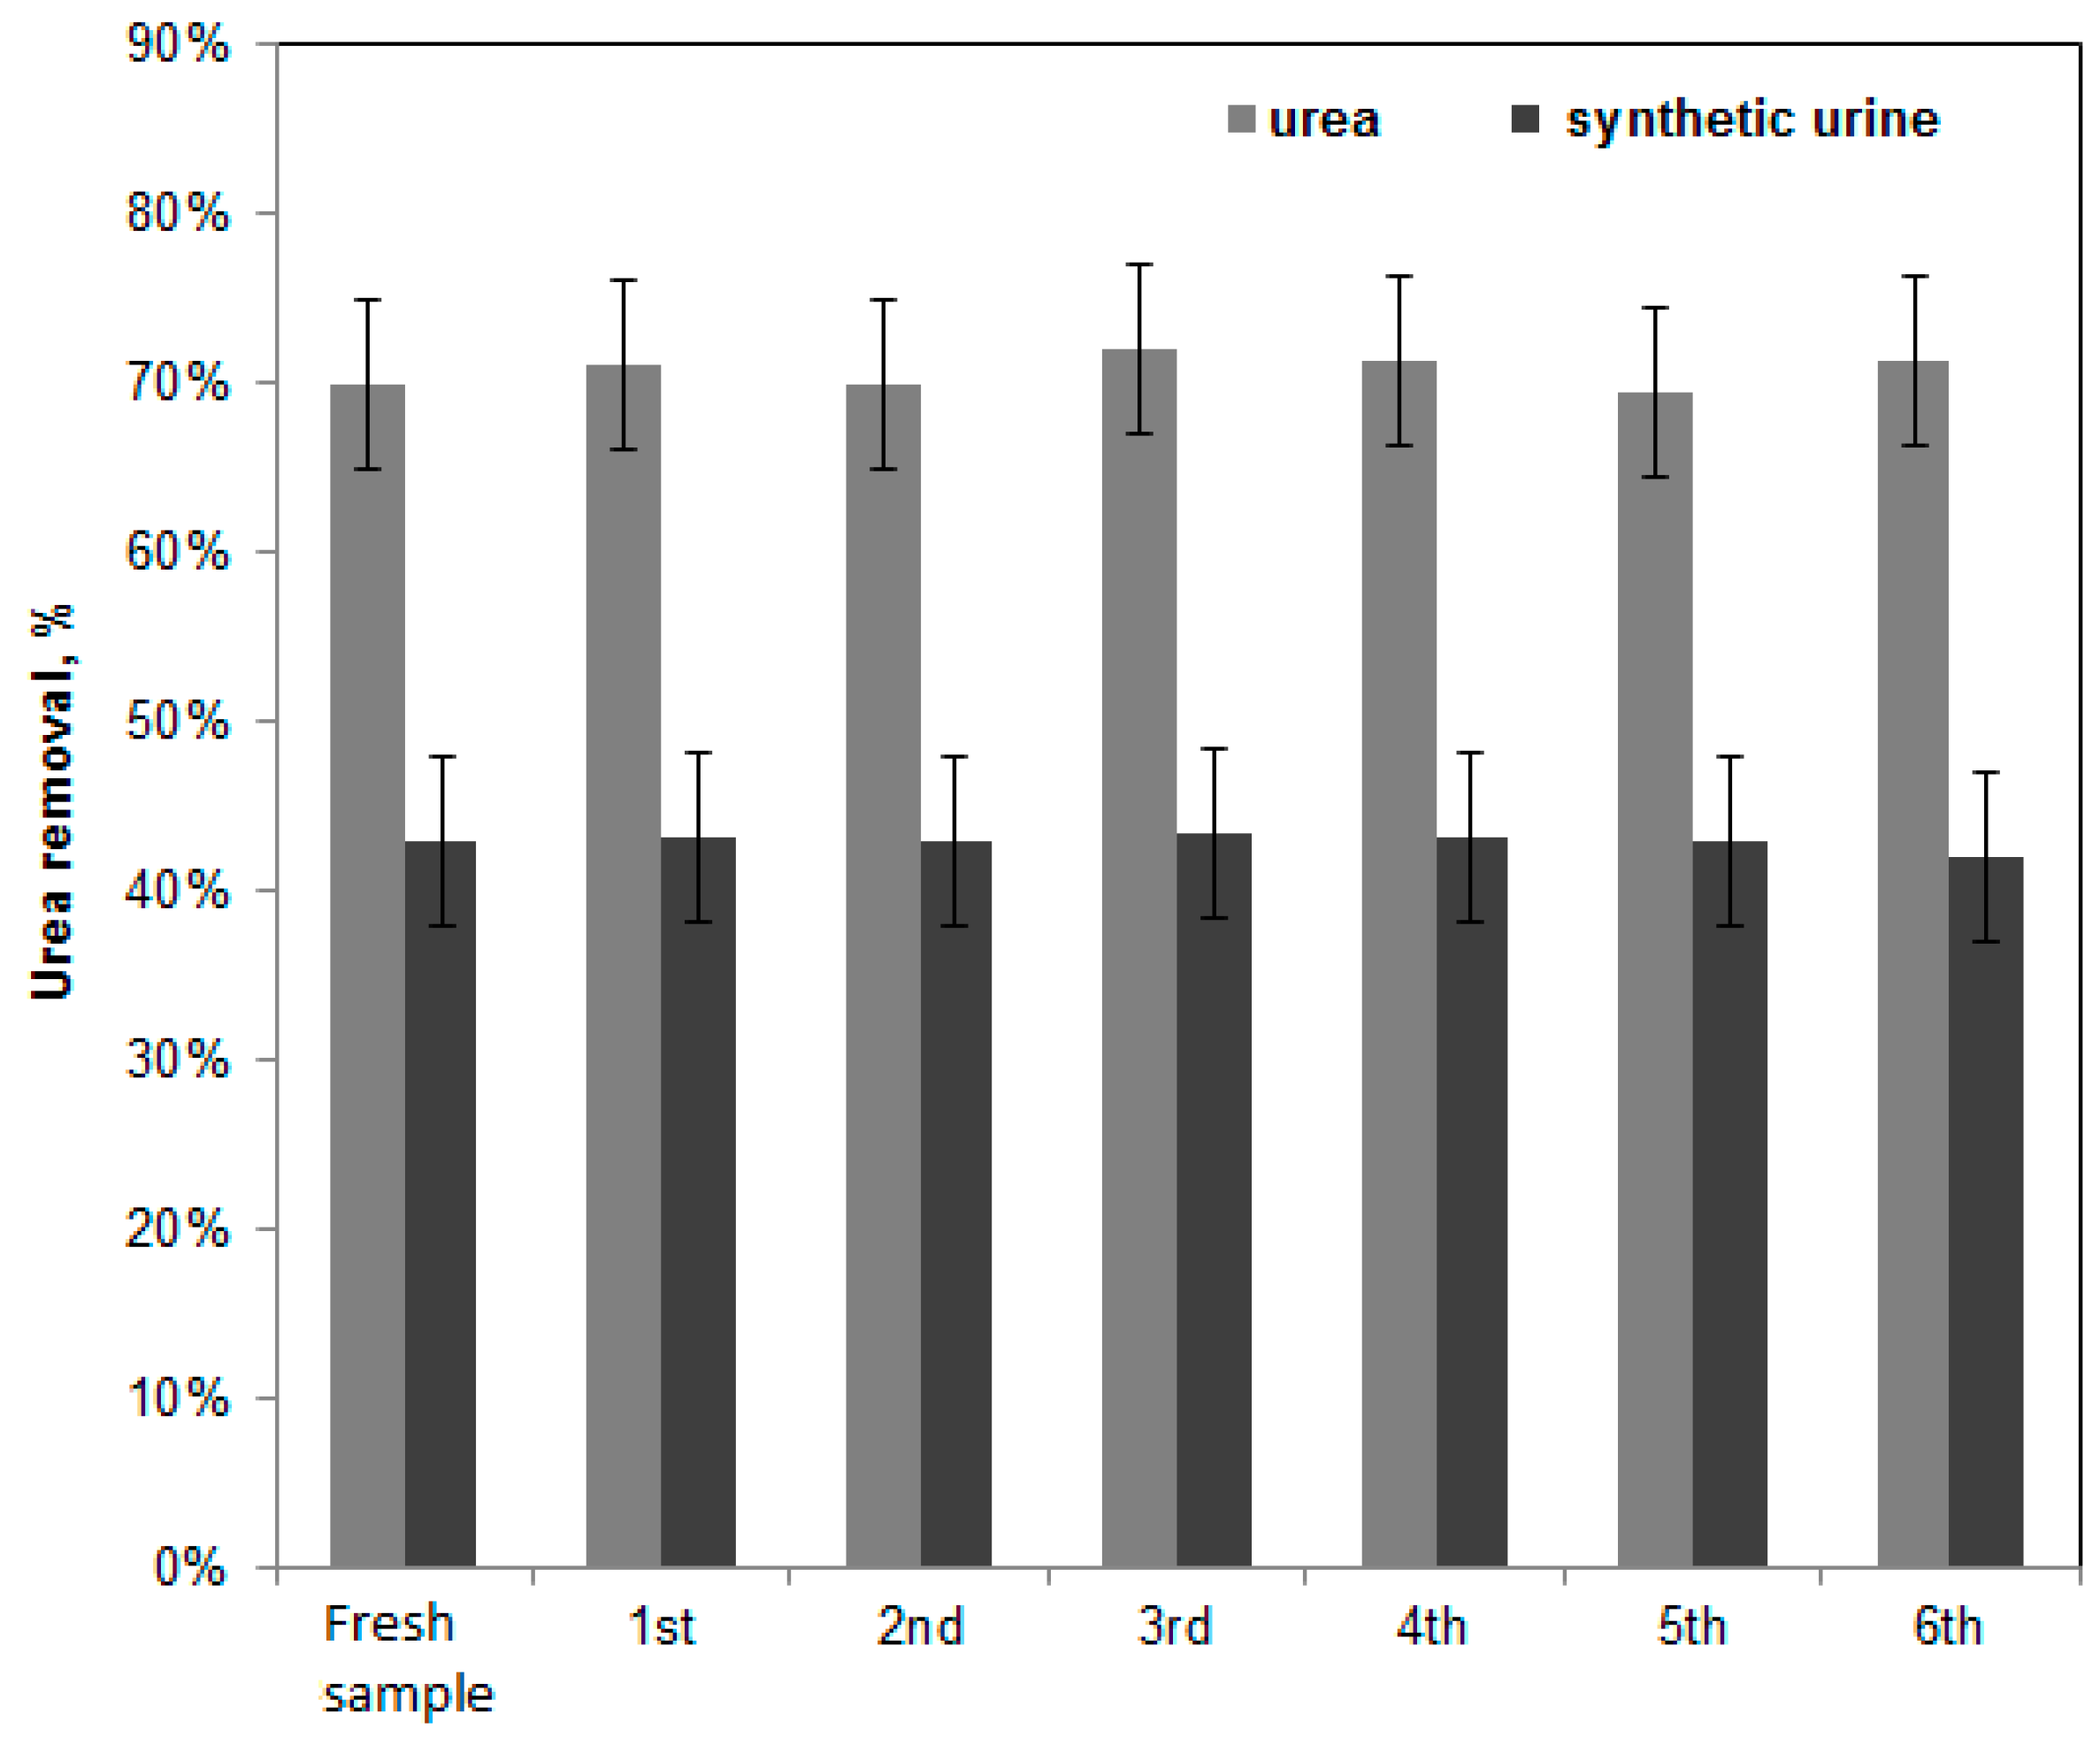
In order to verify the possible application of the proposed photocatalytic process in urea or urine treatment at full scale, it is important to evaluate the stability of the adopted system. Therefore, photocatalytic tests were performed for up to six reuse cycles in order to analyze the urea removal both in distilled water and in the synthetic urine water (Figure 6). Before each reuse cycle, no cleaning or regenerating steps were carried out on the used photocatalyst. The treated solution was only removed from the photoreactor, and a fresh solution with the same initial urea concentration was fed to the photoreactor for the new test.
In both analyzed systems, decreases in photocatalytic performance were not observed, in agreement with our previously published results related to different photocatalysts supported on PS using the same preparation method [20]. In particular, it is important to underline that the reusability results of N-TiO2/PS with synthetic urine water confirmed that the presence of several inorganic compounds (Table 1) did not induce any photocatalyst deactivation phenomena. Moreover, different from the results reported in literature [30], the presence of NO3−, which is commonly formed during urea degradation [2,14,31,32], did not irreversibly block the active sites of the photocatalyst because the degradation degree of urea did not change after different reuse cycles.
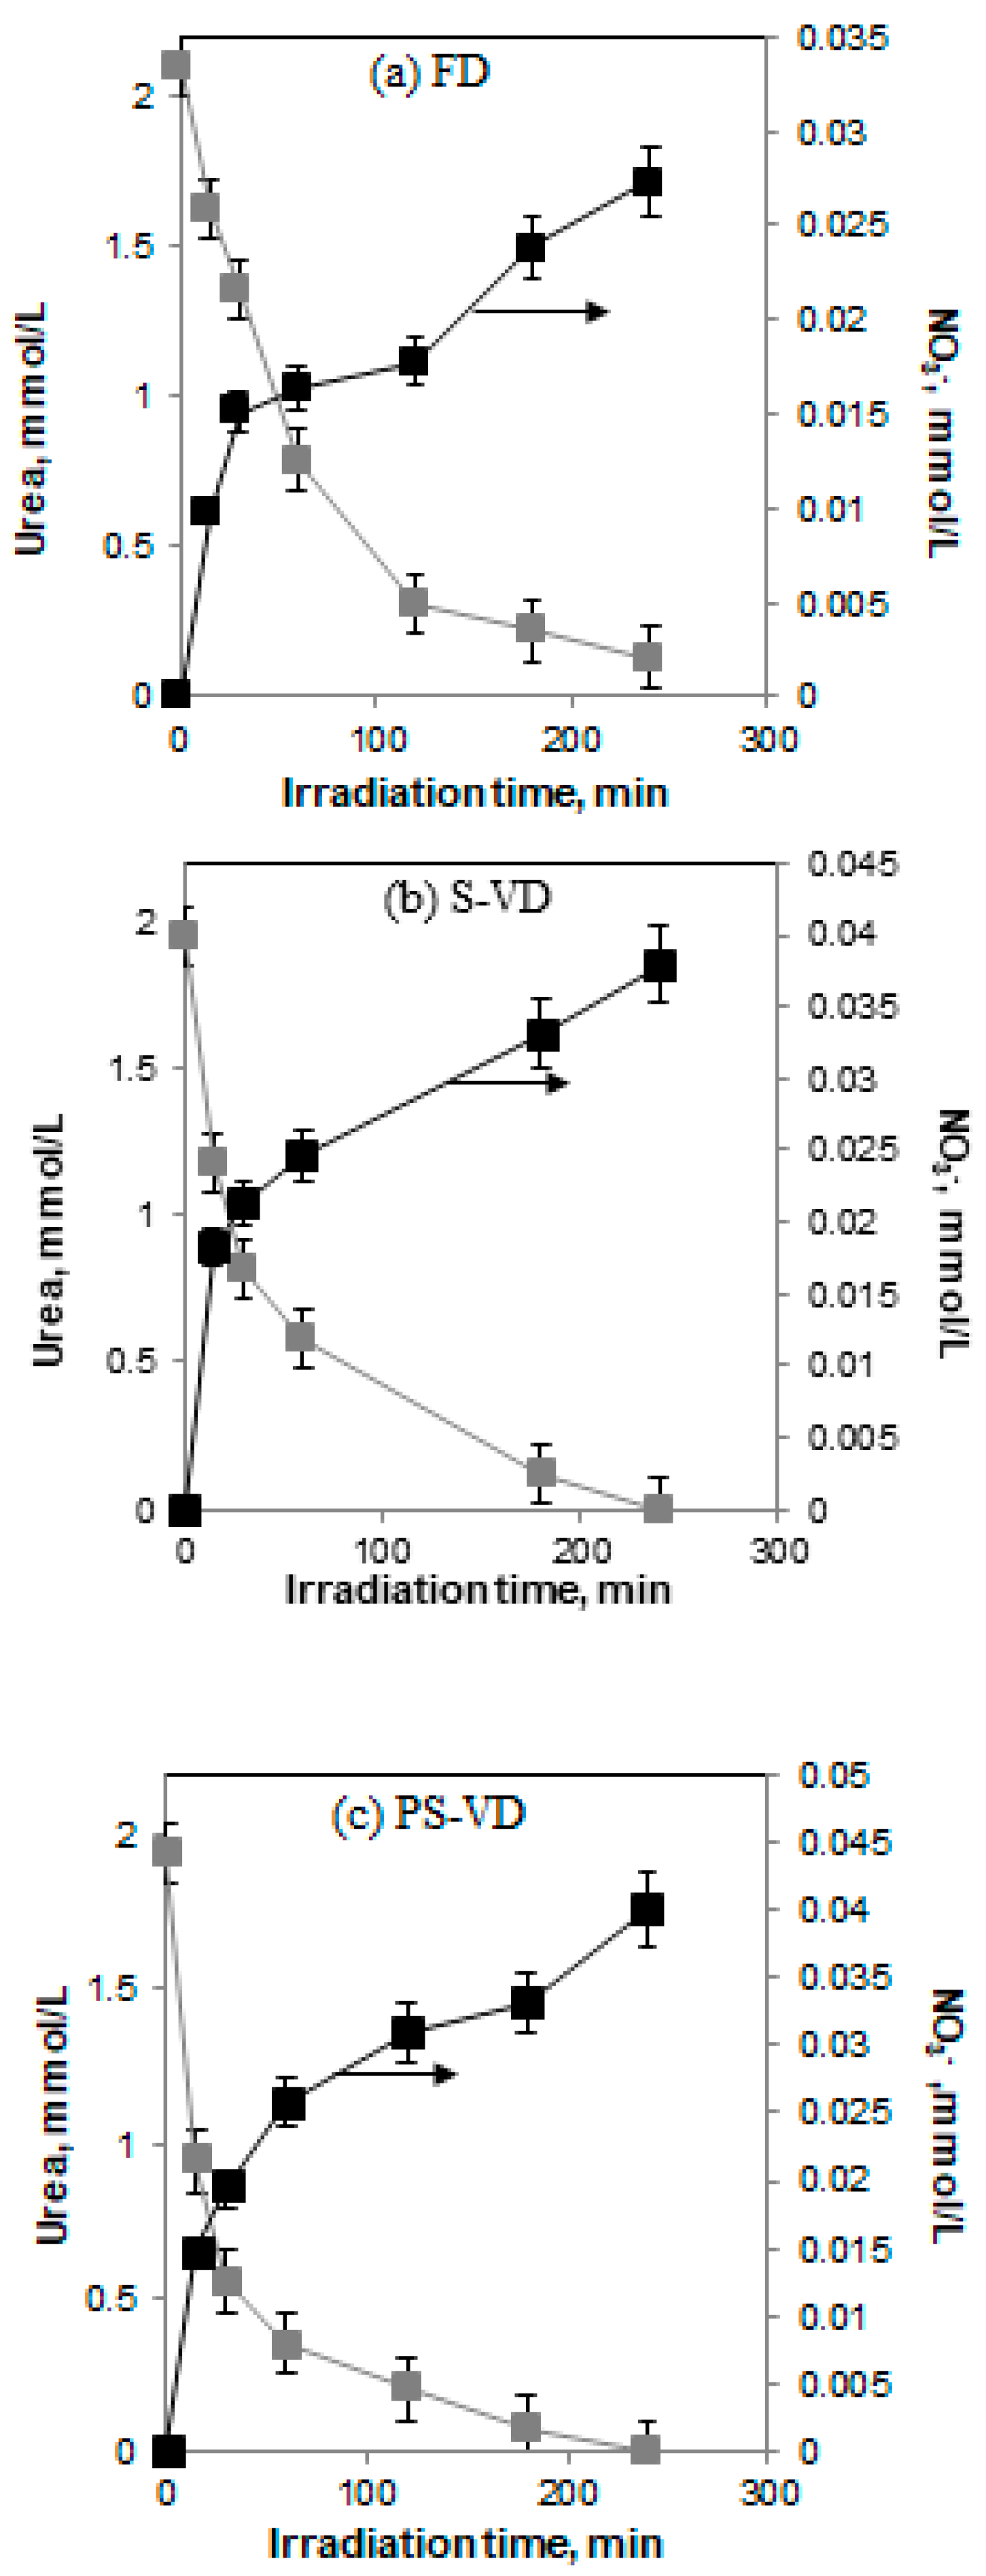
3.6. Influence of Visible Light Modulation Techniques on Urea Photocatalytic Degradation Pathways
The influence of visible LED modulation has been investigated also in the degradation of urea (at 250 mg/L initial concentration in distilled water) and concurrent generation of NO3− (Figure 7) and NH4+ (Table 2) as a function of the only irradiation time (without reporting the dark phase). An increased efficiency for urea removal was obtained using the PS-VD LED dimming modulation, as also observed from the data in Figure 4. The formation of NO3− and NH4+ could be explained considering the possible pathways for urea photocatalytic degradation [2,14,32]. Under visible light irradiation, the N-TiO2/PS photocatalyst can generate electrons (e−) and holes (h+). The generated electron can reduce the adsorbed O2 to superoxide, and the hole can generate the •OH (most potent oxidizing agents), which will then subsequently oxidize the organic pollutant present in the water sample [33]. As reported in literature [2,32] in the case of urea, the radicals generated during light irradiation could react with urea molecules according to the following chemical reaction:
NH2CONH2 + 6•OH + •OH2 → NO2− + 4H2O+ H2NCOOH + H+.
The intermediates generated during the reaction (NO2− and H2NCOOH) could further react with •OH, generating NO3− and NH4+ according to the following reactions:
NO2− + 2•OH → NO3− + H2O;
H2NCOOH ↔ H3N+COO− (zwitterion of carbamic acid);
H3N+COO− + 2•OH→CO2 + NH2OH + H2O;
NH2OH + 4•OH→ NO2− + 3H2O + H+.
NO2− generated from Reaction (R3.3) further reacts with •OH, producing NO3−
NO2− + 2•OH→ NO3− + H2O.
From the data reported in Figure 7, it is possible to observe that the different types of LED light modulations influenced the concentration of NO3− present in the treated solution.
Furthermore, from Table 2, it is clear that at the end of the photocatalytic process on urea in distilled water, the higher removal of urea implies a higher NO3− concentration. It is interesting to observe how the LED modulations can affect the final product concentration. In particular, using PS-VD, it is possible to obtain, together with the total removal of urea, a higher NH4+ concentration (0.5647 mmol/L), probably generated from Reaction (R3.1).
Similar influences of LED modulation techniques on NH4+ and NO3− final concentrations were also found in the synthetic urine solution. The results after 240 min of irradiation are reported in Table 3. The mass balance on nitrogen moles was closed in the range 90–96%, evidencing that the main nitrogen-containing aqueous product of urea photodegradation in the synthetic urine was ammonia.
It is possible to observe that, in this case, the ammonia concentration was significantly higher, underlining the possibility to have water samples very rich in a potential energy source (as ammonia). Therefore, the possibility of using different LED modulations could open an interesting perspective for space applications. Urine wastewater, which normally contributes 44% to the total waste per person on a daily basis [34], could be transformed from waste to a resource. More precisely, the ammonia produced during urea photodegradation could be used inside space stations as direct fuel for combustion and fuel cells [34,35]. In fact, the ease of storage of ammonia in comparison to hydrogen [36] makes it suitable to be used as an alternative fuel because of its high energy density (12.6 MJ L−1), especially for space stations. The idea to achieve resource recovery from water recycling systems was already developed as a proof of concept by Nicolau et al. [37] who based their recycling system on the use of a bioreactor that was able to produce a high amount of ammonia, which was used to feed an electrochemical cell in order to generate electrical energy. However, it is well known that processes based on biological treatment in some special fields, such as space stations, are not safe [6,38,39]. So, the possible use of a photocatalytic system based on a visible light source could be a safe solution in the further development of space stations, overcoming the disadvantages of both biological systems and advanced oxidation processes [40].
4. Conclusions
In this work, photocatalytic processes obtained by using controlled periodic illumination were studied for the degradation of urea in aqueous solutions under visible light irradiation using a structured, visible, active photocatalyst (N-TiO2/PS). The analysis has been realized in terms of both urea degradation and the concurrent generation of NO3− and NH4+. An increase in urea degradation efficiency was obtained using pseudosinusoidal-variable duty (PS-VD), achieving total degradation after 240 min of visible light irradiation. In addition, the N-TiO2/PS photocatalyst was found effective also in the degradation of urea in synthetic urine after several reuse cycles, confirming that the presence of inorganic compounds did not induce any photocatalyst deactivation phenomena. Moreover, it was observed that the LED light dimming modulation techniques influenced the pathways of urea photocatalytic degradation, changing the selectivity towards NO3− or NH4+ and opening an interesting perspective for the direct utilization of ammonia contained in the treated water, which could be used as potential energy resource.
Author Contributions
O.S. and G.D.C. performed the experiments and wrote the manuscript. V.V., D.S., and N.F. provided the concept, experimental design of the study, and reviewed the paper prior to submission. All authors discussed the results, analyzed the data, and commented on and revised the manuscript.
Funding
This research received no external funding.
Acknowledgments
The authors wish to thank Eng. Luca De Guglielmo and Cosimo Di Renna for the support given in the photocatalytic tests.
Conflicts of Interest
The authors declare no conflict of interest.
References
- Bremner, J.M. Recent research on problems in the use of urea as a nitrogen fertilizer. Fert. Res. 1995, 42, 321–329. [Google Scholar] [CrossRef]
- Park, S.; Lee, J.T.; Kim, J. Photocatalytic oxidation of urea on TiO2 in water and urine: Mechanism, product distribution, and effect of surface platinization. Environ. Sci. Pollut. Res. 2019, 26, 1044–1053. [Google Scholar] [CrossRef] [PubMed]
- Glibert, P.M.; Harrison, J.; Heil, C.; Seitzinger, S. Escalating worldwide use of urea—A global change contributing to coastal eutrophication. Biogeochemistry 2006, 77, 441–463. [Google Scholar] [CrossRef]
- Shu, X.; Morse, A.; Jackson, A.; Wiesner, T.F. Simulation of a Closed Loop Wastewater Treatment System for Extended Space Flight. In Proceedings of the 2008 3rd IEEE Conference on Industrial Electronics and Applications, Singapore, 3–5 June 2008; pp. 1252–1257. [Google Scholar]
- Antoniou, M.G.; Dionysiou, D.D. Application of immobilized titanium dioxide photocatalysts for the degradation of creatinine and phenol, model organic contaminants found in nasa’s spacecrafts wastewater streams. Catal. Today 2007, 124, 215–223. [Google Scholar] [CrossRef]
- Liu, X.; Chen, M.; Bian, Z.; Liu, C.-C. Studies on urine treatment by biological purification using azolla and uv photocatalytic oxidation. Adv. Space Res. 2008, 41, 783–786. [Google Scholar] [CrossRef]
- Nicolau, E.; González-González, I.; Flynn, M.; Griebenow, K.; Cabrera, C. Bioelectrochemical degradation of urea at platinized boron doped diamond electrodes for bioregenerative systems. Adv. Space Res. 2009, 44, 965–970. [Google Scholar] [CrossRef]
- Cartinella, J.L.; Cath, T.Y.; Flynn, M.T.; Miller, G.C.; Hunter, K.W.; Childress, A.E. Removal of natural steroid hormones from wastewater using membrane contactor processes. Environ. Sci. Technol. 2006, 40, 7381–7386. [Google Scholar] [CrossRef]
- Luo, C.-S.; Chen, W.-W.; Han, W.-F. Experimental study on factors affecting the quality of ice crystal during the freezing concentration for the brackish water. Desalination 2010, 260, 231–238. [Google Scholar] [CrossRef]
- Höglund, C.; Stenström, T.A.; Jönsson, H.; Sundin, A. Evaluation of faecal contamination and microbial die-off in urine separating sewage systems. Water Sci. Technol. 1998, 38, 17–25. [Google Scholar] [CrossRef]
- Zhao, Z.-P.; Xu, L.; Shang, X.; Chen, K. Water regeneration from human urine by vacuum membrane distillation and analysis of membrane fouling characteristics. Sep. Purif. Technol. 2013, 118, 369–376. [Google Scholar] [CrossRef]
- Maurer, M.; Pronk, W.; Larsen, T.A. Treatment processes for source-separated urine. Water Res. 2006, 40, 3151–3166. [Google Scholar] [CrossRef]
- Hennig, H.; Billing, R. Advantages and disadvantages of photocatalysis induced by light-sensitive coordination compounds. Coord. Chem. Rev. 1993, 125, 89–100. [Google Scholar] [CrossRef]
- Pelizzetti, E.; Calza, P.; Mariella, G.; Maurino, V.; Minero, C.; Hidaka, H. Different photocatalytic fate of amido nitrogen in formamide and urea. Chem. Commun. 2004, 13, 1504–1505. [Google Scholar] [CrossRef]
- Di Capua, G.; Femia, N.; Migliaro, M.; Sacco, O.; Sannino, D.; Stoyka, K.; Vaiano, V. Intensification of a flat-plate photocatalytic reactor performances by innovative visible light modulation techniques: A proof of concept. Chem. Eng. Process. Process Intensif. 2017, 118, 117–123. [Google Scholar] [CrossRef]
- Vaiano, V.; Sacco, O.; Sannino, D.; Di Capua, G.; Femia, N. Enhanced performances of a photocatalytic reactor for wastewater treatment using controlled modulation of leds light. Chem. Eng. Trans. 2017, 57, 553–558. [Google Scholar]
- Sacco, O.; Stoller, M.; Vaiano, V.; Ciambelli, P.; Chianese, A.; Sannino, D. Photocatalytic degradation of organic dyes under visible light on N-doped TiO2 photocatalysts. Int. J. Photoenergy 2012. [Google Scholar] [CrossRef]
- Vaiano, V.; Sacco, O.; Sannino, D.; Ciambelli, P. Photocatalytic removal of spiramycin from wastewater under visible light with N-doped TiO2 photocatalysts. Chem. Eng. J. 2015, 261, 3–8. [Google Scholar] [CrossRef]
- Sacco, O.; Vaiano, V.; Han, C.; Sannino, D.; Dionysiou, D.D. Photocatalytic removal of atrazine using N-doped TiO2 supported on phosphors. Appl. Catal. B Environ. 2015, 164, 462–474. [Google Scholar] [CrossRef]
- Sacco, O.; Vaiano, V.; Rizzo, L.; Sannino, D. Photocatalytic activity of a visible light active structured photocatalyst developed for municipal wastewater treatment. J. Clean. Prod. 2018, 175, 38–49. [Google Scholar] [CrossRef]
- Vaiano, V.; Matarangolo, M.; Sacco, O. UV-leds floating-bed photoreactor for the removal of caffeine and paracetamol using ZnO supported on polystyrene pellets. Chem. Eng. J. 2018, 350, 703–713. [Google Scholar] [CrossRef]
- Vaiano, V.; Sacco, O.; Pisano, D.; Sannino, D.; Ciambelli, P. From the design to the development of a continuous fixed bed photoreactor for photocatalytic degradation of organic pollutants in wastewater. Chem. Eng. Sci. 2015, 137, 152–160. [Google Scholar] [CrossRef]
- Bojic, J.; Radovanović, B.; Dimitrijevic, J. Spectrophotometric determination of urea in dermatologic formulations and cosmetics. Anal. Sci. 2008, 24, 769–774. [Google Scholar] [CrossRef]
- Sleiman, M.; Vildozo, D.; Ferronato, C.; Chovelon, J.-M. Photocatalytic degradation of azo dye metanil yellow: Optimization and kinetic modeling using a chemometric approach. Appl. Catal. B Environ. 2007, 77, 1–11. [Google Scholar] [CrossRef]
- Herrmann, J.M. Heterogeneous photocatalysis: State of the art and present applications. Top. Catal. 2005, 34, 49–65. [Google Scholar] [CrossRef]
- Gerischer, H.; Heller, A. Photocatalytic oxidation of organic molecules at titanium dioxide particles by sunlight in aerated water. J. Electrochem. Soc. 1992, 139, 113–118. [Google Scholar] [CrossRef]
- Krivec, M.; Dillert, R.; Bahnemann, D.W.; Mehle, A.; Štrancar, J.; Dražić, G. The nature of chlorine-inhibition of photocatalytic degradation of dichloroacetic acid in a TiO2-based microreactor. Phys. Chem. Chem. Phys. 2014, 16, 14867–14873. [Google Scholar] [CrossRef]
- Kudlek, E.; Dudziak, M.; Bohdziewicz, J. Influence of inorganic ions and organic substances on the degradation of pharmaceutical compound in water matrix. Water 2016, 8, 532. [Google Scholar] [CrossRef]
- Augugliaro, V.; Bellardita, M.; Loddo, V.; Palmisano, G.; Palmisano, L.; Yurdakal, S. Overview on oxidation mechanisms of organic compounds by TiO2 in heterogeneous photocatalysis. J. Photochem. Photobiol. C Photochem. Rev. 2012, 13, 224–245. [Google Scholar] [CrossRef]
- Surolia, P.K.; Tayade, R.J.; Jasra, R.V. Effect of anions on the photocatalytic activity of fe(iii) salts impregnated TiO2. Ind. Eng. Chem. Res. 2007, 46, 6196–6203. [Google Scholar] [CrossRef]
- Minero, C.; Mariella, G.; Maurino, V.; Vione, D.; Pelizzetti, E. Photocatalytic transformation of organic compounds in the presence of inorganic ions. 2. Competitive reactions of phenol and alcohols on a titanium dioxide−fluoride system. Langmuir 2000, 16, 8964–8972. [Google Scholar] [CrossRef]
- Calza, P.; Pelizzetti, E.; Minero, C. The fate of organic nitrogen in photocatalysis: An overview. J. Appl. Electrochem. 2005, 35, 665–673. [Google Scholar] [CrossRef]
- Kumar, K.; Chowdhury, A. Use of novel nanostructured photocatalysts for the environmental sustainability of wastewater treatments. In Reference Module in Materials Science and Materials Engineering; ResecarchGate: Berlin, Germany, 2018. [Google Scholar] [CrossRef]
- Valera-Medina, A.; Morris, S.; Runyon, J.; Pugh, D.G.; Marsh, R.; Beasley, P.; Hughes, T. Ammonia, methane and hydrogen for gas turbines. Energy Procedia 2015, 75, 118–123. [Google Scholar] [CrossRef]
- Comotti, M.; Frigo, S. Hydrogen generation system for ammonia–hydrogen fuelled internal combustion engines. Int. J. Hydrogen Energy 2015, 40, 10673–10686. [Google Scholar] [CrossRef]
- Makepeace, J.W.; He, T.; Weidenthaler, C.; Jensen, T.R.; Chang, F.; Vegge, T.; Ngene, P.; Kojima, Y.; de Jongh, P.E.; Chen, P.; et al. Reversible ammonia-based and liquid organic hydrogen carriers for high-density hydrogen storage: Recent progress. Int. J. Hydrogen Energy 2019, 44, 7746–7767. [Google Scholar] [CrossRef]
- Nicolau, E.; Fonseca, J.J.; Rodriguez-Martinez, J.; Richardson, J.; Flynn, M.; Griebenow, K.; Cabrera, C. Evaluation of a urea bioelectrochemical system for wastewater treatment processes. ACS Sustain. Chem. Eng. 2014, 2, 749–754. [Google Scholar] [CrossRef]
- Hellström, D.; Johansson, E.; Grennberg, K. Storage of human urine: Acidification as a method to inhibit decomposition of urea. Ecol. Eng. 1999, 12, 253–269. [Google Scholar] [CrossRef]
- Udert, K.; Larsen, T.; Gujer, W. Biologically induced precipitation in urine-collecting systems. Water Supply 2003, 3, 71–78. [Google Scholar] [CrossRef]
- Oller, I.; Malato, S.; Sánchez-Pérez, J.A. Combination of advanced oxidation processes and biological treatments for wastewater decontamination—A review. Sci. Total Environ. 2011, 409, 4141–4166. [Google Scholar] [CrossRef]
Figure 1.
(a) Scheme of experimental system; (b) Experimental setup; (c) details of flat-plate reactor filled with N-TiO2/PS catalyst (front view); (d) DC/DC single ended primary inductor converter (SEPIC) regulator feeding 8 parallel strings, each one made by 10 visible light LEDs in series.
Figure 1.
(a) Scheme of experimental system; (b) Experimental setup; (c) details of flat-plate reactor filled with N-TiO2/PS catalyst (front view); (d) DC/DC single ended primary inductor converter (SEPIC) regulator feeding 8 parallel strings, each one made by 10 visible light LEDs in series.

Figure 2.
(a) Sinusoidal-variable duty (S-VD) LED dimming modulation; (b) pseudosinusoidal-variable duty (PS-VD) LEDs dimming modulation; (c) Photolysis of urea under visible light irradiation radiation using fixed duty (FD) LED dimming (48 W, 200 mA), S-VD LED dimming modulation, and PS-VD LED dimming modulation (25–78 W, 100–300 mA). Urea initial concentration: 250 mg/L; solution volume: 250 mL.

Figure 3.
Behavior of urea’s relative concentration as a function of visible light irradiation time obtained with FD LED dimming and with different solution volumes. Urea initial concentration: 250 mg/L; N-TiO2/PS amount: 120 g.
Figure 3.
Behavior of urea’s relative concentration as a function of visible light irradiation time obtained with FD LED dimming and with different solution volumes. Urea initial concentration: 250 mg/L; N-TiO2/PS amount: 120 g.

Figure 4.
Behavior of urea’s relative concentration as a function of run time in the dark phase and under visible light irradiation obtained by using FD LED dimming (48 W, 200 mA), S-VD LED dimming modulation, and PS-VD LED dimming modulation (25–78 W, 100–300 mA). Urea initial concentration: 250 mg/L; solution volume: 250 mL; N-TiO2/PS amount: 120 g.

Figure 5.
Behavior of urea’s relative concentration as a function of run time in the dark phase and under visible light irradiation obtained using PS-VD LED dimming modulation in the presence of distilled and synthetic urine water. Urea initial concentration: 25 g/L; solution volume: 250 mL; N-TiO2/PS amount: 120 g.

Figure 6.
Urea degradation after 360 min of irradiation at different repetitions, using PS-VD LED dimming modulation, in the presence of distilled and synthetic urine water. Urea initial concentration: 25 g/L; solution volume: 250 mL; N-TiO2/PS amount: 120 g.
Figure 6.
Urea degradation after 360 min of irradiation at different repetitions, using PS-VD LED dimming modulation, in the presence of distilled and synthetic urine water. Urea initial concentration: 25 g/L; solution volume: 250 mL; N-TiO2/PS amount: 120 g.

Figure 7.
Behavior of urea and NO3− concentrations as a function of visible light irradiation time (after the dark period) obtained with FD LED dimming, S-VD LED dimming modulation, and PS-VD LED dimming modulation. Urea initial concentration: 250 mg/L in distilled water; solution volume: 250 mL; N-TiO2/PS amount: 120 g.


Table 1.
Chemical composition of synthetic urine without other organic compounds.
| Chemical Name | Chemical Formula | DOSE (g/L) |
|---|---|---|
| Urea | NH2CONH2 | 25 |
| Potassium phosphate monobasic | KH2PO4 | 4.2 |
| Sodium sulfate | Na2SO4 | 2.3 |
| Potassium chloride | KCl | 1.6 |
| Ammonium chloride | NH4Cl | 1 |
| Magnesium chloride hexahydrate | MgCl2•6H2O | 0.650 |
| Sodium chloride | NaCl | 4.6 |
| Calcium chloride dihydrate | CaCl2•2H2O | 0.650 |
Table 2.
Urea (mmol/L), NH4+ (mmol/L), and NO3− (mmol/L) concentrations after 240 min of irradiation, using light modulations on urea in distilled water with (a) FD LED dimming, (b) S-VD, and (c) PS-VD LEDs dimming modulations; initial urea concentration: 250 mg/L.
Table 2.
Urea (mmol/L), NH4+ (mmol/L), and NO3− (mmol/L) concentrations after 240 min of irradiation, using light modulations on urea in distilled water with (a) FD LED dimming, (b) S-VD, and (c) PS-VD LEDs dimming modulations; initial urea concentration: 250 mg/L.
| TEST | Urea (mmol/L) | NH4+ (mmol/L) | NO3− (mmol/L) |
|---|---|---|---|
| (a) FD | 0.132 | 0.5 | 0.0273 |
| (b) S-VD | 0 | 0.2588 | 0.0379 |
| (c) PS-VD | 0 | 0.5647 | 0.0401 |
Table 3.
Urea (mmol/L), NH4+ (mmol/L), and NO3− (mmol/L) concentrations after 240 min of irradiation, using light modulations on synthetic urine with (a) FD LED dimming, (b) S-VD, and (c) PS-VD LED dimming modulations; initial urea concentration: 25 g/L.
Table 3.
Urea (mmol/L), NH4+ (mmol/L), and NO3− (mmol/L) concentrations after 240 min of irradiation, using light modulations on synthetic urine with (a) FD LED dimming, (b) S-VD, and (c) PS-VD LED dimming modulations; initial urea concentration: 25 g/L.
| TEST | Urea (mmol/L) | NH4+ (mmol/L) | NO3− (mmol/L) |
|---|---|---|---|
| (a) FD | 350 | 80.121 | 0.722 |
| (b) S-VD | 280 | 178.232 | 1.012 |
| (c) PS-VD | 241 | 280.321 | 1.212 |
© 2019 by the authors. Licensee MDPI, Basel, Switzerland. This article is an open access article distributed under the terms and conditions of the Creative Commons Attribution (CC BY) license (http://creativecommons.org/licenses/by/4.0/).
Share and Cite
MDPI and ACS Style
Vaiano, V.; Sacco, O.; Di Capua, G.; Femia, N.; Sannino, D. Use of Visible Light Modulation Techniques in Urea Photocatalytic Degradation. Water 2019, 11, 1642. https://doi.org/10.3390/w11081642
AMA Style
Vaiano V, Sacco O, Di Capua G, Femia N, Sannino D. Use of Visible Light Modulation Techniques in Urea Photocatalytic Degradation. Water. 2019; 11(8):1642. https://doi.org/10.3390/w11081642
Chicago/Turabian StyleVaiano, Vincenzo, Olga Sacco, Giulia Di Capua, Nicola Femia, and Diana Sannino. 2019. "Use of Visible Light Modulation Techniques in Urea Photocatalytic Degradation" Water 11, no. 8: 1642. https://doi.org/10.3390/w11081642
Note that from the first issue of 2016, this journal uses article numbers instead of page numbers. See further details here.