Generation of Benchmark Problems for Optimal Design of Water Distribution Systems


1
Research Institute for Mega Construction, Korea University, Seoul 02841, Korea
2
Department of Civil Engineering, Keimyung University, Daegu 42601, Korea
3
Department of Mechanical Engineering, University of Science and Culture, Tehran, Iran
4
Department of Civil Engineering, The University of Suwon, Gyeonggi 18323, Korea
5
School of Civil, Environmental and Architectural Engineering, Korea University, Seoul 02841, Korea
*
Author to whom correspondence should be addressed.
Water 2019, 11(8), 1637; https://doi.org/10.3390/w11081637
Submission received: 5 July 2019
/
Revised: 6 August 2019
/
Accepted: 8 August 2019
/
Published: 8 August 2019
(This article belongs to the Section Urban Water Management)
Abstract
:Engineering benchmark problems with specific characteristics have been used to compare the performance and reliability of metaheuristic algorithms, and water distribution system design benchmarks are also widely used. However, only a few benchmark design problems have been considered in the research community. Due to the limited set of previous benchmarks, it is challenging to identify the algorithm with the best performance and the highest reliability among a group of algorithms. Therefore, in this study, a new water distribution system design benchmark problem generation method is proposed considering problem size and complexity modifications of a reference benchmark. The water distribution system design benchmark problems are used for performance and reliability comparison among several reported metaheuristic optimization algorithms. The optimal design results are able to quantify the performance and reliability of the compared algorithms which shows each metaheuristic algorithm has its own strengths and weaknesses. Finally, using the proposed method in this study, guidelines are derived for selecting an appropriate metaheuristic algorithm for water distribution system design.
1. Introduction
Optimization can be defined as the process of finding the best fitting solution to a given problem. Various metaheuristic algorithms have been developed and applied to find optimal solutions for real-world engineering problems, such as truss structure design [1,2,3], dam operation [4,5], parameter estimation [6,7,8], and traffic engineering [9,10]. Mathematical benchmark problems have been used to compare the performance and reliability of metaheuristic algorithms [11,12,13,14,15]. However, engineering optimization problems have their own unique characteristics. Therefore, a metaheuristic algorithm with good performance and reliability in mathematical benchmark problems does not guarantee suitable results in real-world engineering problems. Consequently, the performance and reliability of metaheuristic algorithms for real-life problems should be verified by applying them to engineering design problems with specific characteristics [16].
The water distribution system design problem is a widely used benchmark problem in the field of engineering. Several metaheuristic algorithms have been applied to the optimal design of water distribution systems with various characteristics. For instance, Simpson et al. [17] applied genetic algorithms (GAs), Cunha and Sousa [18] applied simulated annealing, Maier et al. [19] applied ant colony optimization (ACO), Montalvo et al. [20] applied particle swarm optimization (PSO), and Geem [21] applied the harmony search algorithm (HSA). More recently, Sadollah et al. [22,23] employed the water cycle algorithm (WCA) and the mine blast algorithm (MBA) for the optimal design of water distribution systems.
However, previous water distribution system design problems in the literature have a disadvantage in that their characteristics cannot be freely assigned. In the previous benchmark problems, the layout and constraints of the problem were fixed, therefore the size and complexity could not be freely changed. Thus, it is difficult to quantitatively evaluate which metaheuristic algorithm is effective, because the results are dependent on the characteristics of a given design problem. Therefore, in this study, engineering design benchmark problems are generated by modifying existing water distribution system design benchmarks and applying them to measure the performance and reliability of metaheuristic algorithms.
2. Methodology
Water distribution systems are one of the basic infrastructure facilities that are essential for human activity. They are needed to ensure a safe and reliable water supply. The main purpose of water distribution systems is to supply the end-user with their desired amount of water, while ensuring appropriate water quality and pressure from the water source [24]. The objective of an optimal water distribution system design is to find the most cost-effective design among various potential designs, while satisfying hydraulic requirements.
The objective function for determining the lowest cost design of a water distribution system with nodal pressure constraints is calculated from the diameter and length of the pipes as given follows [24]:
where Cc (Di) is the construction cost according to pipe diameter per unit length, Li is the pipe length, Di is the pipe diameter, Pj is the penalty function for ensuring that the pressure constraints are satisfied, N is the number of pipes, and M is the number of nodes. If a design solution does not meet the nodal pressure requirements, a penalty function is added to the objective function as given follows [24]:
where hj is the nodal pressure at node j, hmin is the minimum pressure requirement at node j, and α and β are penalty function constants. Note that other hydraulic or water quality requirements, such as allowable flow velocity, water age, and residual chlorine concentration, can also be considered in water distribution system design [25].
Difficulties in designing an optimal water distribution system include the relation between the pipe diameter (decision variables of the problem) and the cost (problem’s objective function) being nonlinear, the energy equation (hydraulic constraint) for the head loss calculation includes nonlinear terms, and the pipe flow direction is not fixed for looped-type water distribution systems [24]. Therefore, the optimal design problems of water distribution systems are a complex nonlinear constrained problem, and the mathematical approaches cannot be applied efficiently.
Optimally designing a water distribution system is a widely used benchmark problem for measuring the performance of optimization methods. Several benchmark water distribution systems have been introduced in previous studies. The two-loop network problem is one of the simplest problems and was suggested by Alperovits and Shamir [26]. The Anytown network was introduced by Walski et al. [27]. The Hanoi network and the GoYang network problems, which are medium-scale problems, were introduced by Fujiwara and Khang [28] and Kim et al. [29], respectively. Reca and Martinez [30] introduced the Balerma network, which is a large irrigation network. More recently, Bragalli et al. [31] conducted a study using three benchmark networks: Fossolo, Pescara, and Modena.
However, in a previous water distribution system design benchmark in the literature, the network layout, objective function, candidate pipe diameter option, and hydraulic constraints are all fixed. Therefore, previous water distribution system design benchmarks in the literature have limited ability to measure the performance and reliability of optimization methods, because each problem has its own unique characteristics. Thus, in this study, water distribution system design problems are generated using characteristic modifications, such as the number of pipes, the number of candidate pipe diameter options, the pressure constraint, roughness coefficient, and nodal demand multiplier, of previous water distribution system design benchmarks, and the generated problems are applied to measuring the performance of metaheuristic algorithms. Such benchmark problems have several advantages. Firstly, the number of alternative designs, which is represented by problem size, can be easily altered by a user. In addition, the complexity and difficulty of the optimization problems can be changed.
The benchmark water distribution system problems in this study were generated by modifying five individual characteristics of a reference water distribution system design benchmark. The factors that were modified are shown in Table 1. The number of pipes (n) and the number of candidate pipe diameter options (m) are used as problem size modification factors. The pressure constraint (p), roughness coefficient (c), and nodal demand multiplier (d) are potential problem complexity modification factors.
If k values are considered for each factor, then 5 × k cases of the benchmark water distribution system design problems will be generated—each one changing a single factor for each problem—with a reference design benchmark as the default problem. Note that, there are interactions among problem modification factors. For instance, if the pressure constraint is stringent, then the effect of changes in roughness coefficient would be more significant. However, the purpose of this study is to generate a variety of design benchmarks based on a change in the size and complexity of the reference benchmark problem. Therefore, in this study, when one problem characteristic factor changes, the other factors are fixed to the default value.
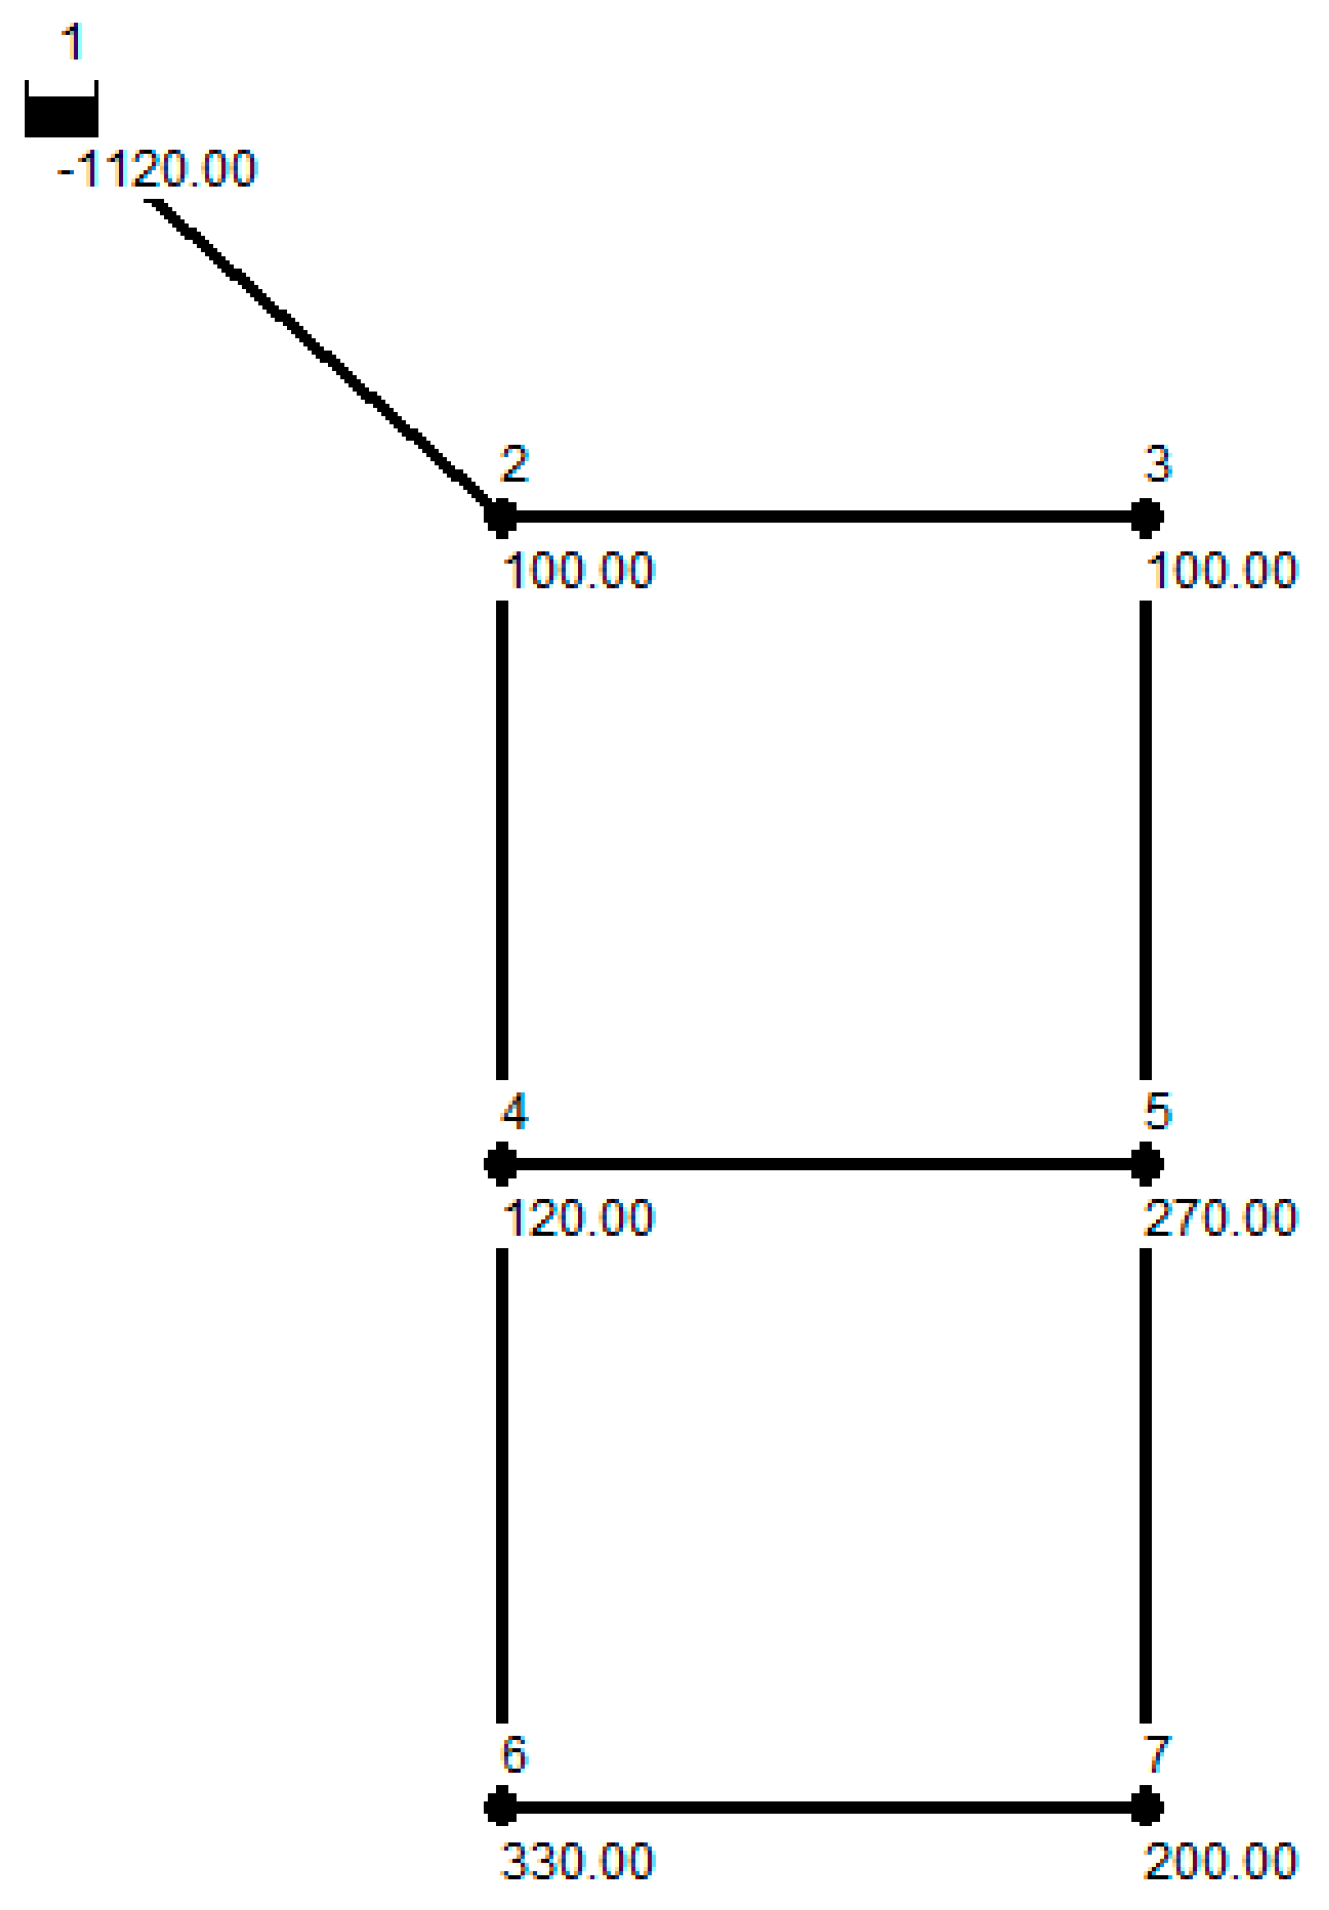
In this study, a simple water distribution system, which is a modified form of the two-loop network design problem introduced by Alperovits and Shamir [26] is used as an example to estimate the relative influence of each factor. This system consists of a single water source (i.e., junction 1), six demand nodes (i.e., junctions 2–7), eight pipes, and two loops. In our example, each factor takes three values (k = 3). The layout of the example network and the values assigned to each factor are shown in Figure 1 and Table 2, respectively; the default factors are in a bold font. In this research, fifteen (5 × 3) benchmark design problems were generated.
A complete enumeration for each generated design problem was performed and the results are shown in Table 3. The size of the two-loop example network was very small, so all the candidate designs for the modified two-loop networks which were generated in this study with various characteristics can be checked. The global optimum cost increases linearly, and the number of candidate designs and feasible designs increase exponentially as the number of pipes increases. The ratio of feasible designs decreases as the number of pipes increases. The global optimum cost decreases, and the number of candidate designs and the number of feasible solutions increase as the number of candidate pipe diameter options increases. The feasible design ratio varies as the number of candidate pipe diameter options increases. Therefore, the parameters n and m control the size of the benchmark problems.
Meanwhile, the global optimum costs increase, and the numbers of feasible solutions and feasible design ratios decrease as the pressure constraint and nodal demand multiplier increase and also as the roughness coefficient decreases. It is worth mentioning that the total number of candidate designs was not changed by variations of the factors p, c, and d. Therefore, these factors are considered to be problem complexity modification factors.
3. Applications and Results
In this study, the Hanoi network design problem [28] was used as a reference benchmark problem. The Hanoi network in Vietnam is a well-known benchmark water distribution design system. It consists of one source (junction 1), 31 demand nodes (junctions 2–32), 34 pipes, and three loops, as shown in Figure 2. Six commercial pipes with internal diameters ranging from 304.8 to 1016.0 mm were selected for the Hanoi network in the original design benchmark. Therefore, the number of candidate designs for the complete network is 634. The Hazen–Williams roughness coefficient for calculating friction head loss is assumed to be 130 for all pipes. In addition, the minimum required pressure head at each demand node is 30 m for the Hanoi network. Default problem characteristic factors are printed in bold given in Table 4. Four values were considered for each factor and 20 benchmark problems were generated in this study.
The known globally optimal solution was used as a reference value for the measurement of performance among the metaheuristic algorithms. However, global optimal solutions of engineering optimization problems, including water distribution system designs, are generally unknown. In addition, the global optimal solution changes with different factors, such as n and m. Therefore, the global lowest cost cannot be used as a reference value for measuring the performance of the applied optimization algorithms. Thus, the known worst solution in the feasible solution area is used as a reference. In the case of the water distribution system cost optimization problem, the global optimal design among candidate designs cannot be obtained without the solution search is performed, however, we intuitively know that in the worst design all pipes are set to the maximum diameter. This is because as the diameter increases, the cost increases (see Equation (1)), but the head loss in the pipe decreases and the constraint can be satisfied (see Equation (2)).
Here, the ratio of an algorithm’s optimal solution cost to the known worst solution cost is defined as the improvement ratio. Note that the known worst solution is the design with the largest diameter for all pipes that still meets the hydraulic requirements. Water distribution system design problems are constrained problems, and the success rates are considered as a basic performance indicator. In this study, four improvement ratio statistics were used to compare five existing algorithms: The mean and standard deviation of the average improvement ratios, and the mean and standard deviation of the best improvement ratios. Note that, if the standard deviation of the decision variables is large, it can be estimated that various solutions can be derived at each independent run. Indeed, if the standard deviation of the objective function of the final solution is large, it means that the probability of converging to a good solution is low. Therefore, in this study, reliability is considered to be superior when the standard deviation of improvement ratios is small along with obtaining better cost function. Meanwhile, the best solution included in the final population was selected (in 20 individual runs) for each case and applied to the evaluation index. Therefore, a run is considered to be a success if one or more feasible solutions are included in the final iteration. On the other hand, if there is no feasible solution in the final iteration, the run was considered as failed.
In this study, five algorithms were compared: Random search (RS), genetic algorithms (GAs) [32], simulated annealing (SA) [33], harmony search algorithm (HSA) [34]), and water cycle algorithm (WCA) [35], which were applied to water distribution system design in the previous studies [17,18,21,22]. The RS was used as the subject to be compared. It includes the process of searching for solutions by creating uniform random numbers within a range of searching solutions. The GAs is one of the early developed metaheuristic algorithms, and it mimics the evolutionary phenomena that are the most widely utilized. The SA mimics the quenching process. While the GAs evolves several solutions in the population, the SA improves one solution repeatedly. The HSA mimics behaviors of music players, and performs well for the combinatorial optimization problems. The WCA is the most recently developed metaheuristic algorithm among the considered applied algorithms, and it mimics the hydrological cycle process.
Each metaheuristic algorithm was tested in 20 individual runs for each of the 20 cases shown in Table 4. The parameters of applied metaheuristic algorithms were determined using sensitivity analysis. The characteristic factors of the water distribution system design benchmark were set to the default value (see Table 4), and the optimization parameters of each metaheuristic algorithm were tested. The combination of parameters that derive the best optimization results was determined, and the parameters were applied to 20 cases of benchmark problems. The maximum number of function evaluations was used as the stopping criterion and was set to 50,000, and the results were compared at 10,000th, 30,000th, and final function evaluation.
Table 5 shows the success rate for each metaheuristic algorithm with varying factor values. The RS failed to find a single feasible solution in all runs. The SA found 19.375% of the feasible solutions on average at the final function evaluation; it had the second-worst results after the RS. The SA was weak—especially with variations in demand and number of pipes. The GAs, HSA, and WCA all found feasible solutions in all individual runs for each case in the final function evaluation. However, the GAs had slow convergence results compared to the HSA and WCA at 10,000th, 30,000th, and final function evaluation—especially with variations in demand and number of pipes.
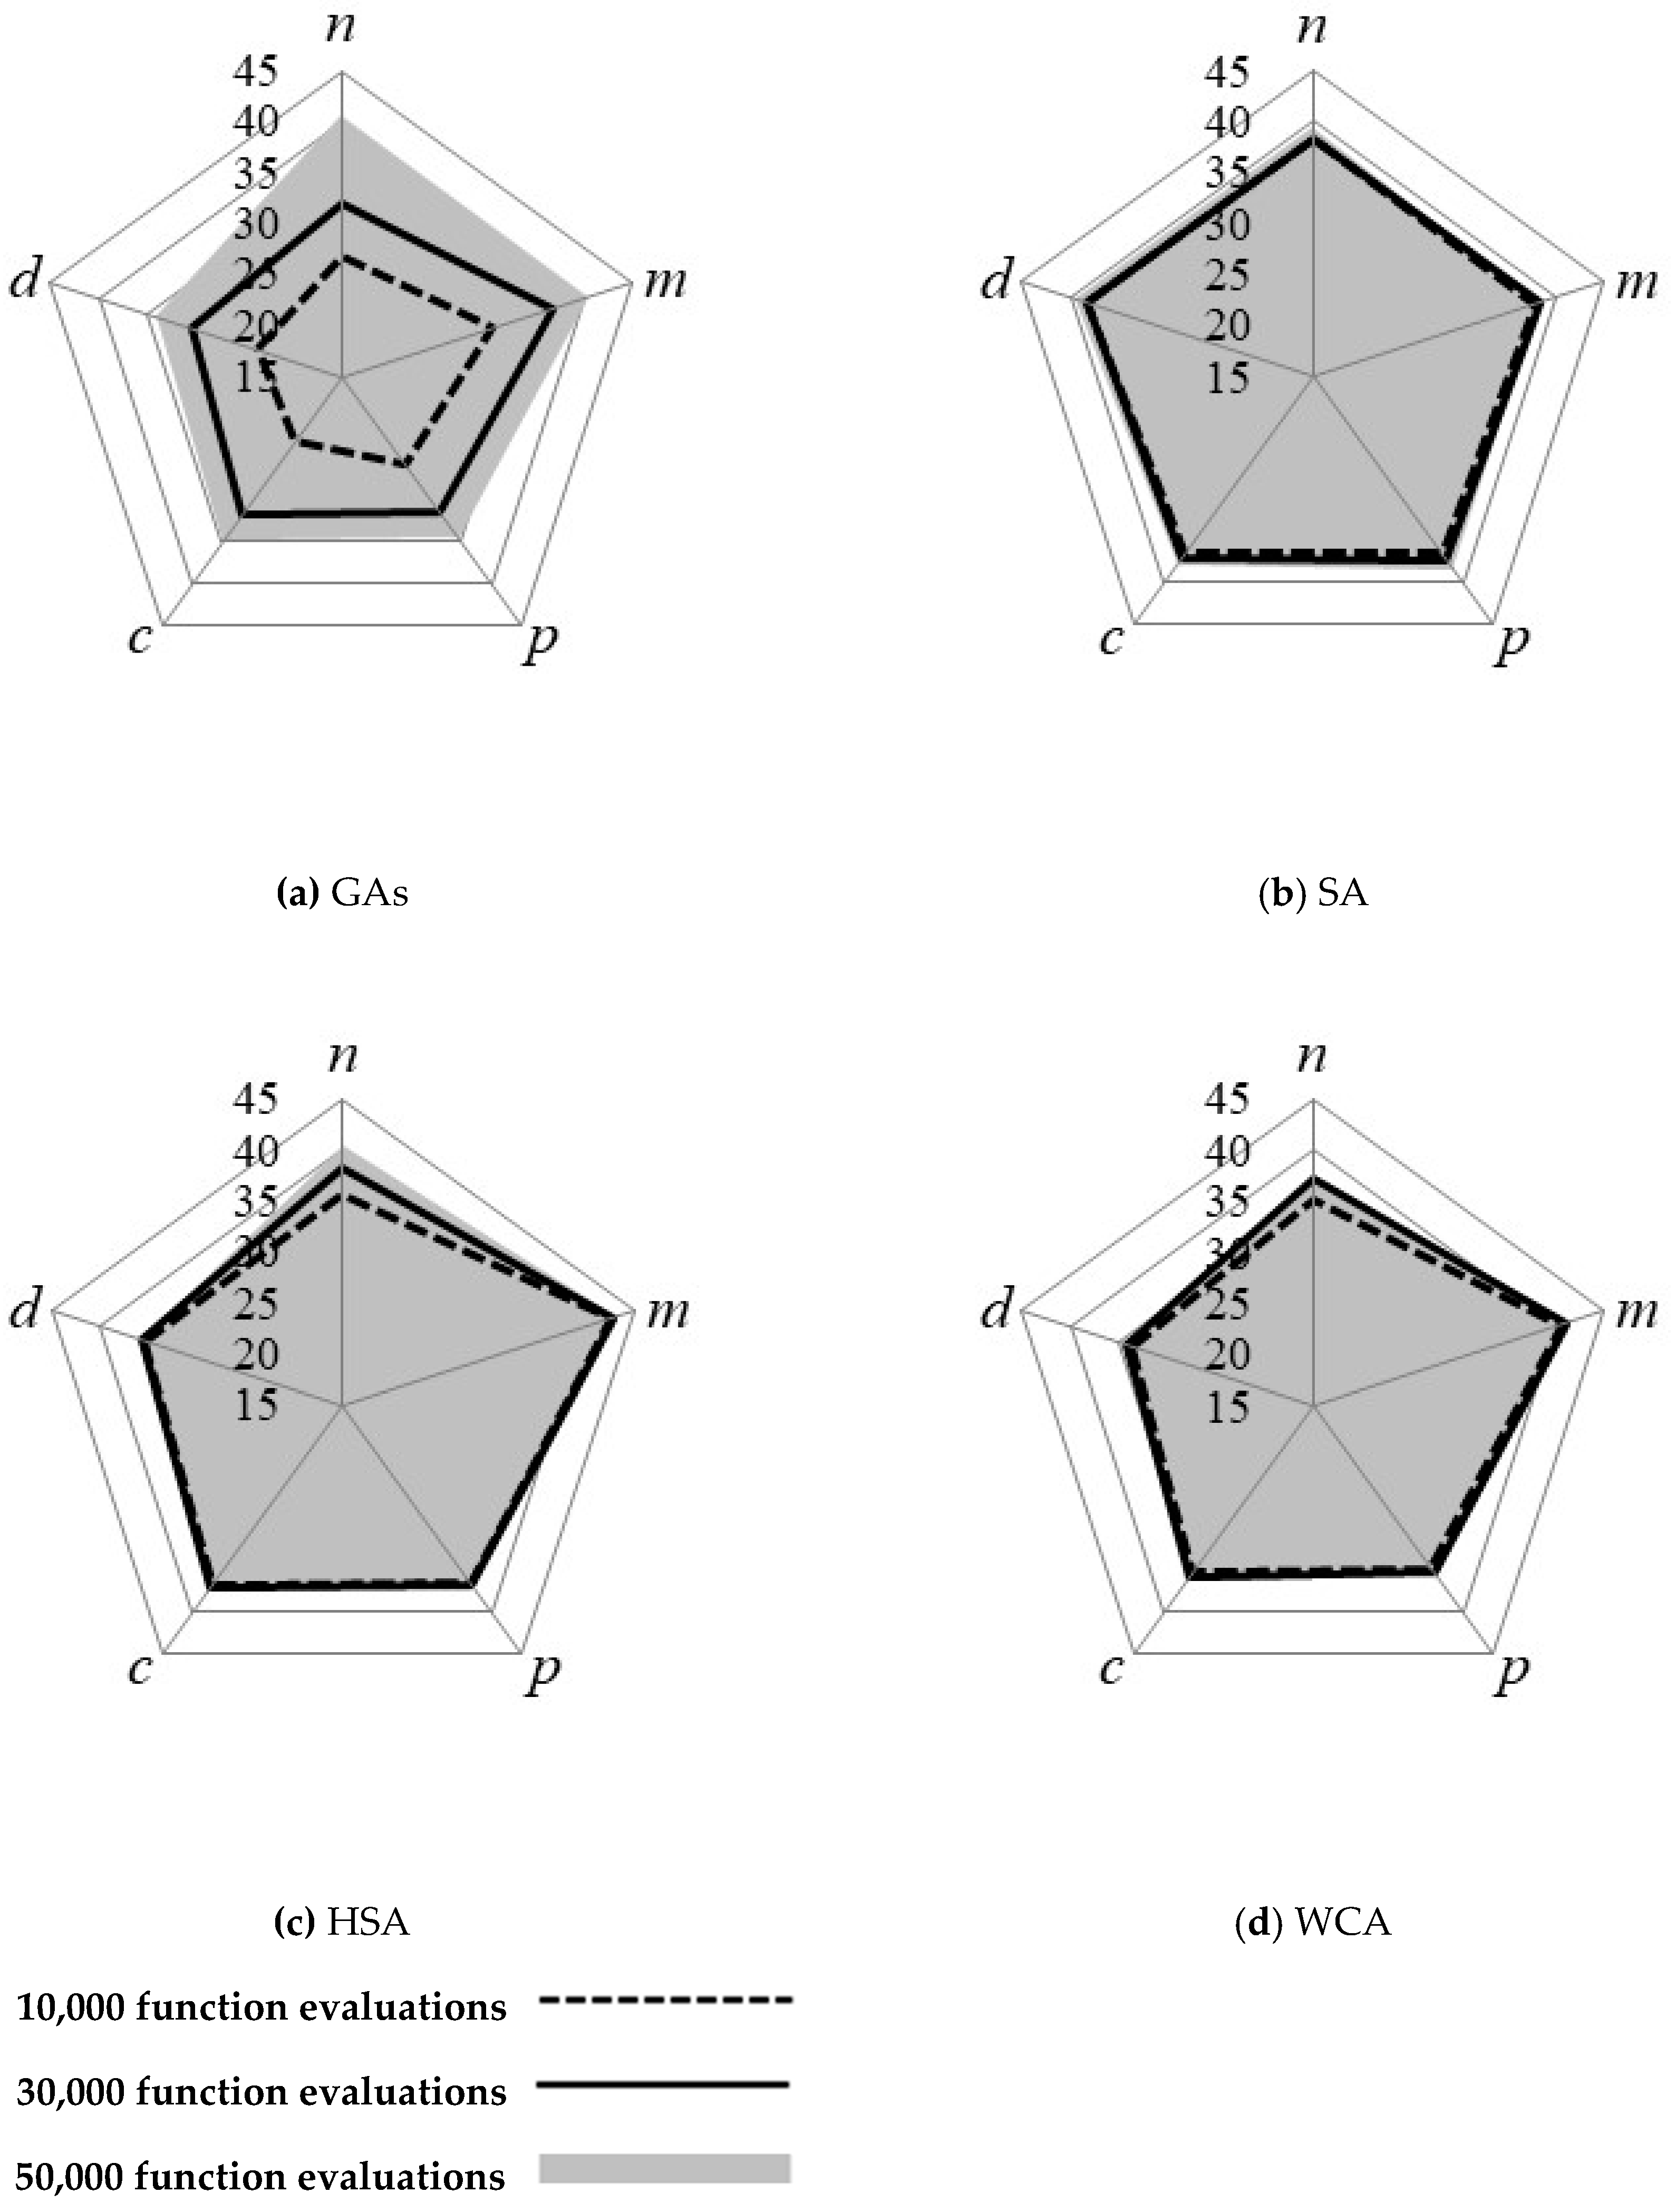
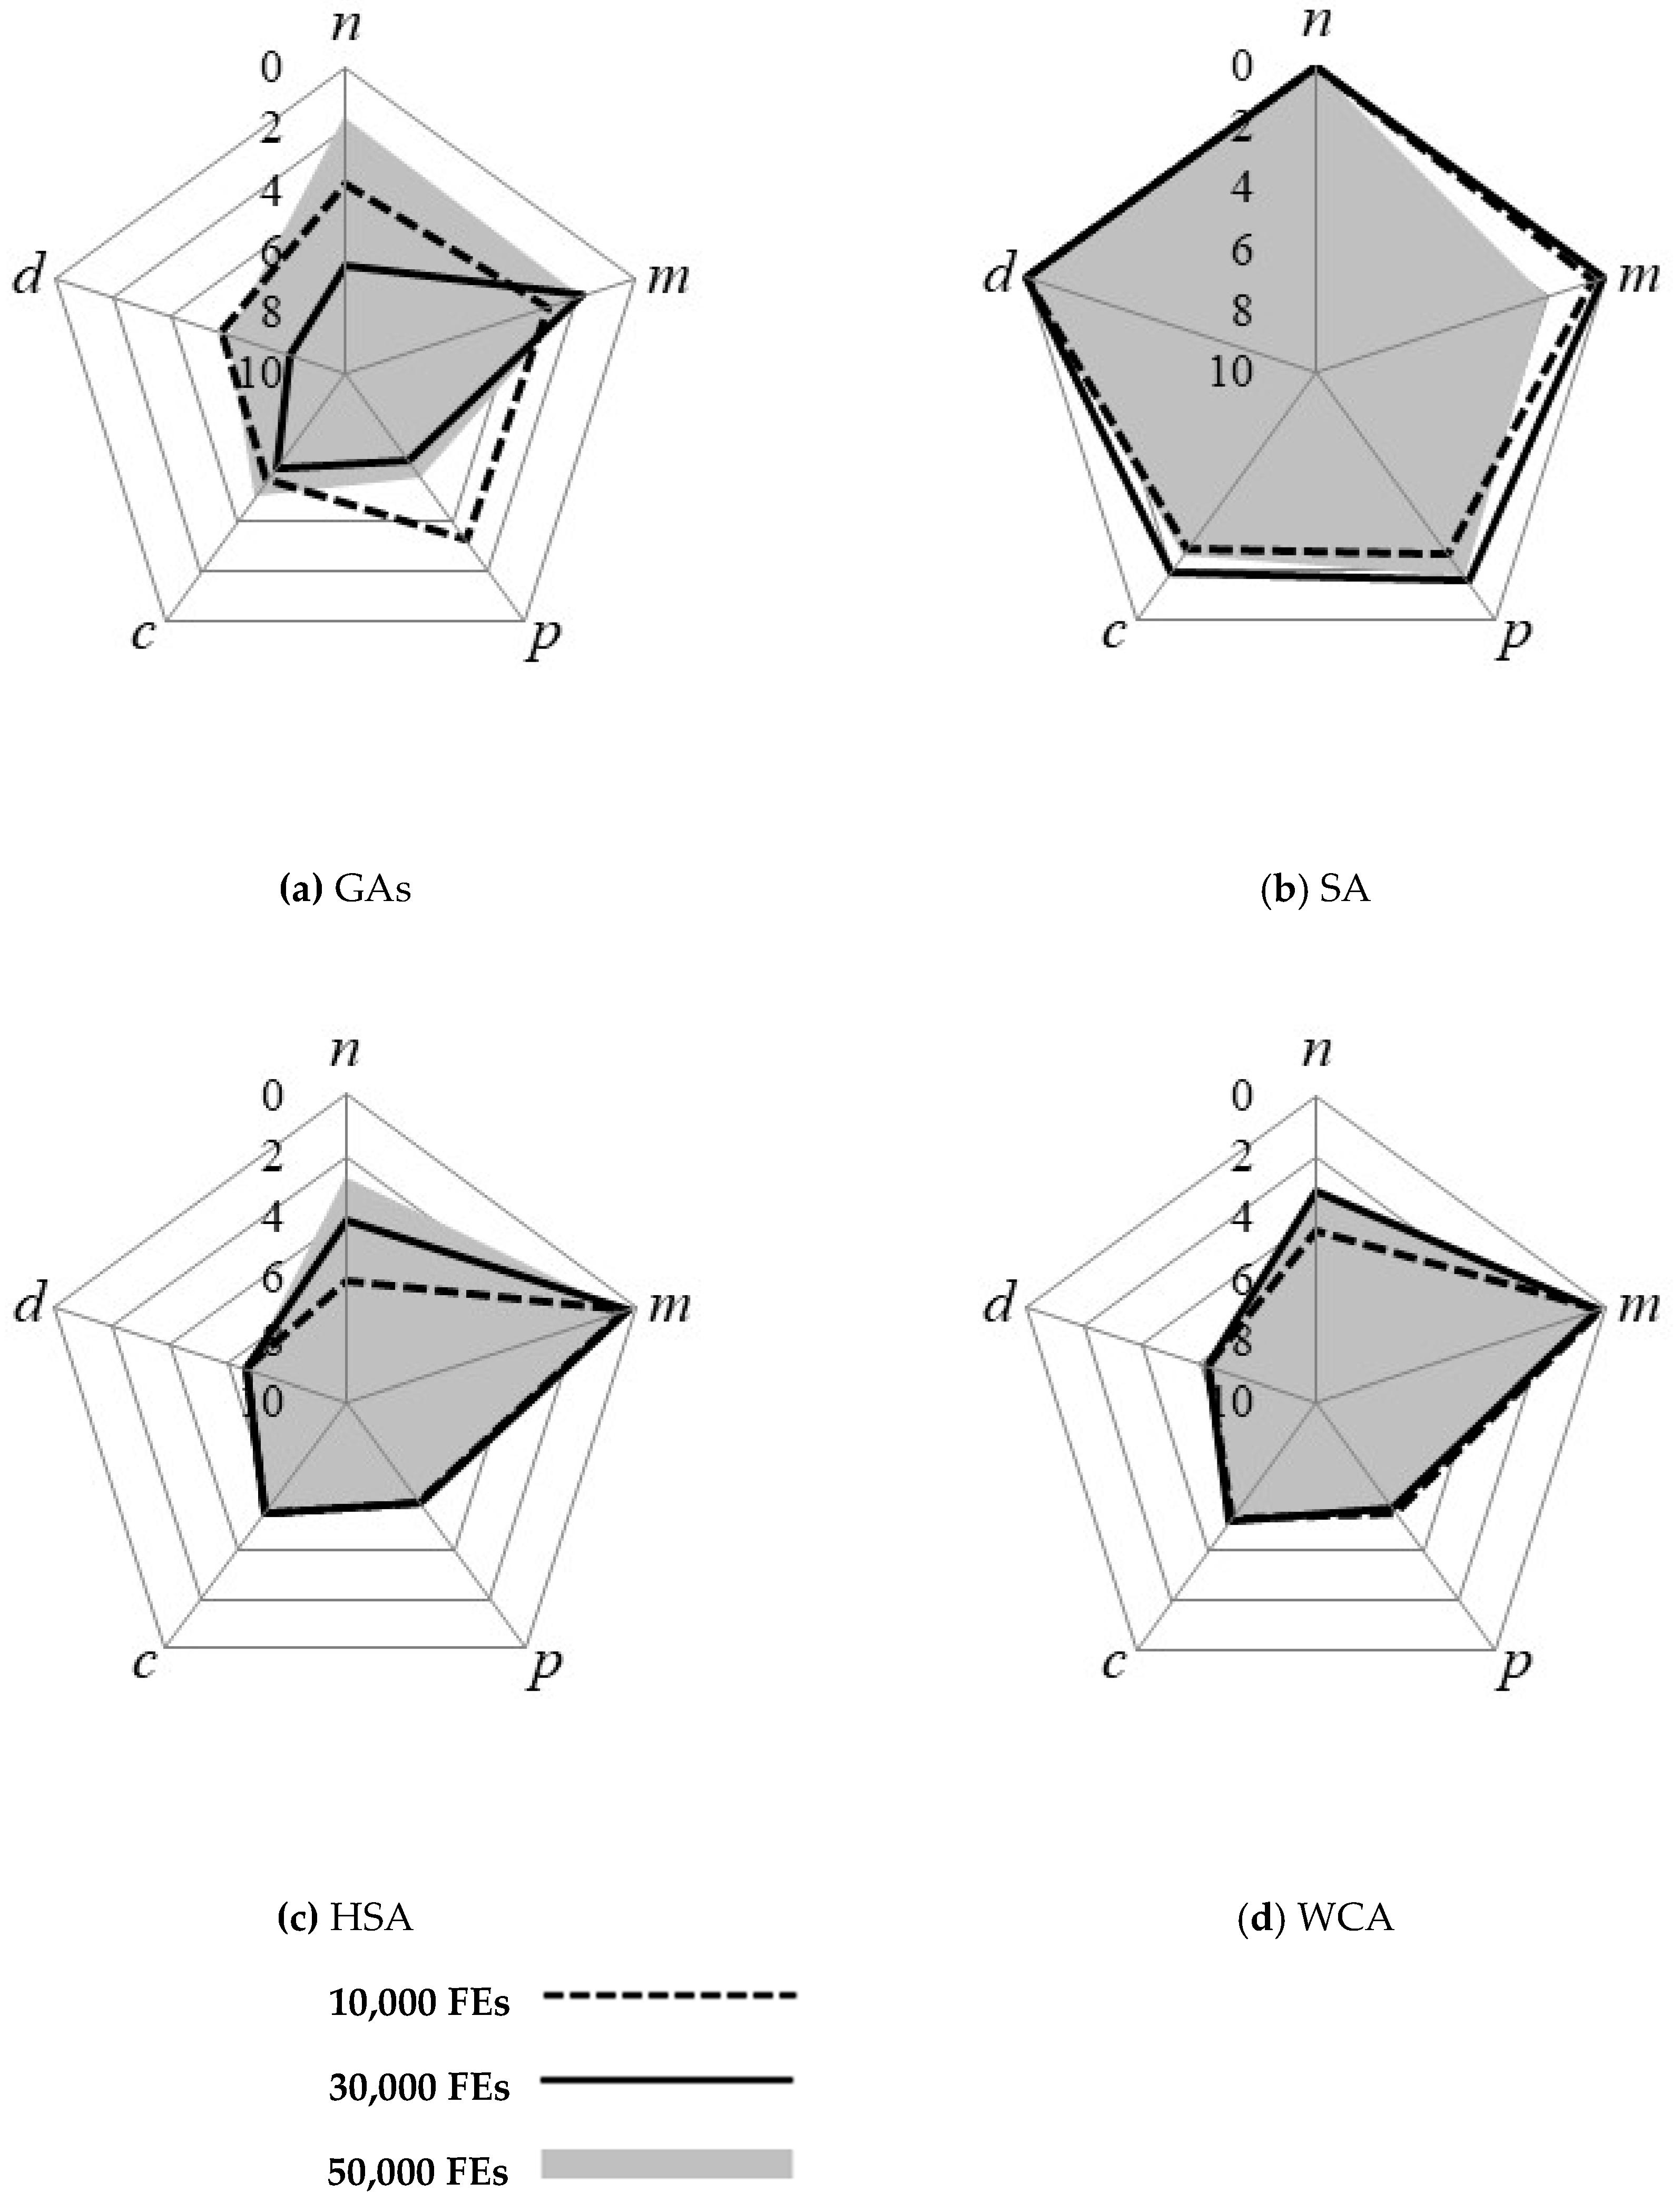
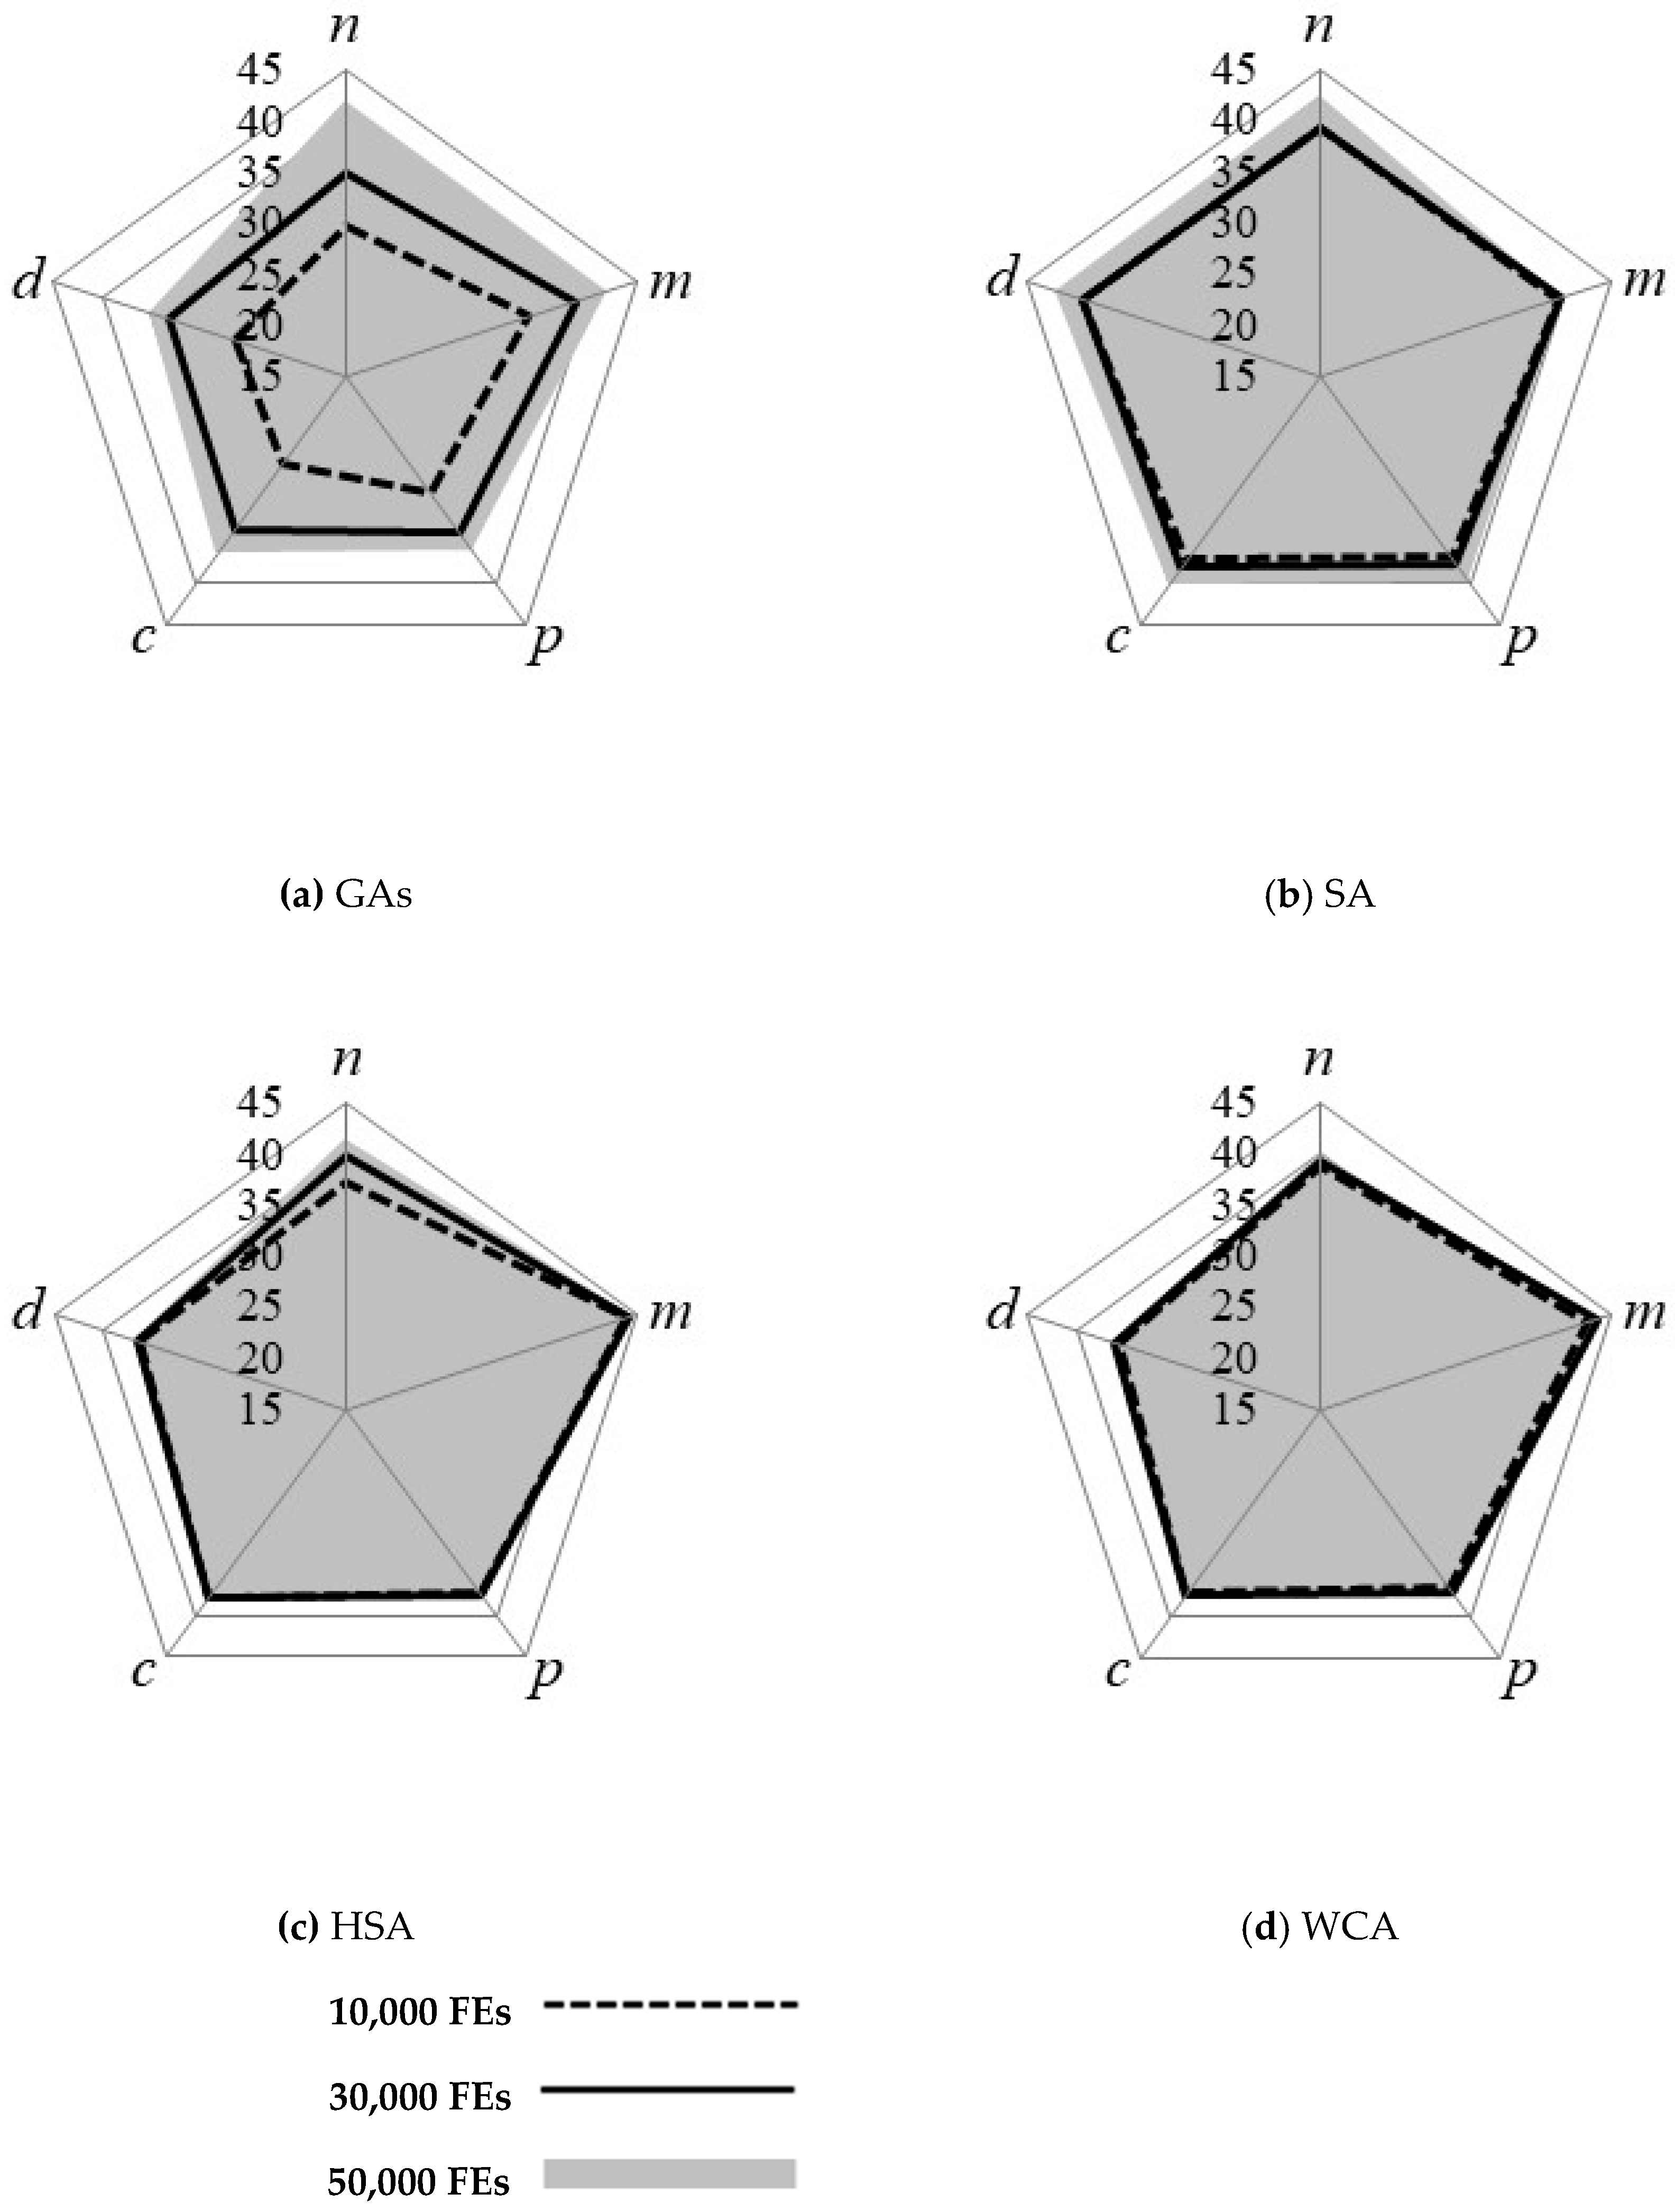
Figure 3 and Figure 4 show pentagon diagrams of the means and standard deviations of the average improvement ratios, respectively. Figure 5 and Figure 6 display pentagon diagrams of the means and standard deviations of the best improvement ratios, respectively. Note that the means and standard deviations are calculated from the feasible solutions. A value close to a corner of a pentagon indicates a larger improvement ratio and a smaller standard deviation.
The SA showed stable results in terms of means and standard deviations; however, the values were calculated from feasible solutions, where the weights of the problem size and complexity have not been considered in the calculations. In addition, the success rates for each factor variation should be considered together. Therefore, in this study, the SA gave the second-worst performance after the RA, which was excluded from the comparison.
The GAs provided better optimization results compared with the other methods with respect to the varying number of pipes in terms of the mean and standard deviation at the final function evaluation. On the other hand, in terms of the varying number of candidate pipe diameters, the performance of the GAs was insufficient. In addition, in terms of the convergence rate, the GAs showed low efficiency in early function evaluations when compared with the HSA and the WCA. The GAs found infeasible solutions at the 10,000th and 30,000th, function evaluations. Moreover, feasible solutions found by the GAs had low improvement ratio values.
The HSA showed the best results when varying the number of candidate pipe diameter options, while it had the worst results when the number of pipes was varied. The HSA also showed the best results in terms of the means of the average improvement ratio and best improvement ratio for three-factor variations: Pressure constraint, roughness coefficient, and nodal demand multiplier. On the other hand, the HSA showed large standard deviations for these three characteristics.
The WCA produced an average performance in relation to the other metaheuristic algorithms. Additionally, the WCA found relatively good solutions in the early function evaluations compared to the other algorithms. Therefore, the WCA is less sensitive to the variation of problem characteristics than the other applied algorithms and has good adaptability. However, in the second half of the optimization process, the solutions found by the WCA did not improve further.
The metaheuristic optimization algorithms have their own strengths and weaknesses, and no method performs better than the other with respect to all aspects. Furthermore, as the size and complexity of the problems increase, performance and reliability of all reported algorithms weaken consistently. Therefore, the choice of method should be dependent on the characteristics of the optimization problem. For instance, the SA can be applied to simple optimization problems with several individual runs, while the GAs can be used to find optimal solutions for large-scale optimization problems offering a reliable solution at every single run. The HSA is suitable for the problems that include high complexities, however, the results should be verified to find a reliable solution. The WCA can be efficiently applied to optimization problems which need long computational time, such as real-time estimation problems, feature selection, and classification of big data.
These performance and reliability characteristics of algorithms can be used as a guide to select the proper optimization algorithm for given problems. In addition, the existing optimization algorithms require improvement by enhancing the optimization process and introducing additional engineering approaches considering the characteristics of a given problem.
4. Conclusions and Future Research
Various optimization techniques, including metaheuristic optimization algorithms, have been developed and applied to find optimal solutions for real-world engineering problems. Engineering benchmark problems can be used for performance and reliability comparisons among metaheuristic algorithms; the water distribution system design problem is a widely used benchmark in the engineering field. However, previous water distribution system design problems have limited problem characteristic sets.
Therefore, in this study, engineering design problems were generated by modifying an existing water distribution system design benchmark. Then, they were applied to measure the performance of five reported metaheuristic algorithms. The benchmark design problems were generated using five problem characteristic factors: Two problem size modification factors and three problem complexity modification factors.
Each applied metaheuristic algorithm had its own strengths and weaknesses, and the performance and reliability of all studied algorithms weakened as the size and complexity of the problems increased. In addition, each algorithm showed its own convergence characteristic for given design problems. This implies that finding optimal solutions for engineering problems using a metaheuristic algorithm requires an efficient approach that considers the characteristics of the given design problem. In this study, performance and reliability metaheuristic algorithms were evaluated through the water distribution system design benchmarks, and guidance to select the proper optimal algorithm for given problem characteristics was suggested from the results of this study.
Meanwhile, cost minimization was selected as an objective function in this study, and the node pressure requirement was used as a hydraulic constraint. However, real water distribution system designs have several objectives (such as system reliability and greenhouse gas emissions) and constraints (such as water flow velocity limitations and water quality requirements). Therefore, in future studies, various combinations of objectives and constraints with other problem characteristic modification factors will be considered including multi-objective optimization problems; then they will be applied to benchmark problem generation for performance and reliability comparisons among optimization techniques. In addition, five metaheuristic optimizers were compared using the proposed water distribution system design benchmarks in this study, however, other optimization algorithms and other variants will be tested in future studies.
Author Contributions
H.M.L., D.J., and D.G.Y. carried out the survey of previous studies. H.M.L. wrote the manuscript. H.M.L. and A.S. conducted all simulations. H.M.L. and J.H.K. conceived the original idea of the proposed method.
Funding
This study was supported by the Korea Ministry of Environment as “Global Top project (2016002120004)” and supported by the Basic Science Research Program through the National Research Foundation of Korea (NRF) funded by the Ministry of Education (NRF-2018R1A6A3A01012504).
Conflicts of Interest
The authors declare no conflict of interest.
References
- Deb, K.; Gulati, S. Design of truss-structures for minimum weight using genetic algorithms. Finite Elem. Anal. Des. 2001, 37, 447–465. [Google Scholar] [CrossRef]
- Lee, K.S.; Geem, Z.W. A new structural optimization method based on the harmony search algorithm. Comput. Struct. 2004, 82, 781–798. [Google Scholar] [CrossRef]
- Kaveh, A.; Talatahari, S. Particle swarm optimizer, ant colony strategy and harmony search scheme hybridized for optimization of truss structures. Comput. Struct. 2009, 87, 267–283. [Google Scholar] [CrossRef]
- Geem, Z.W. Optimal scheduling of multiple dam system using harmony search algorithm. In Proceedings of the International Work-Conference on Artificial Neural Networks; Springer: Berlin/Heidelberg, Germany, 2007; pp. 316–323. [Google Scholar]
- Valeriano, O.C.S.; Koike, T.; Yang, K.; Yang, D. Optimal dam operation during flood season using a distributed hydrological model and a heuristic algorithm. J. Hydrol. Eng. 2009, 15, 580–586. [Google Scholar] [CrossRef]
- Kim, J.H.; Geem, Z.W.; Kim, E.S. Parameter estimation of the nonlinear Muskingum model using harmony search. JAWRA J. Am. Water Resour. Assoc. 2001, 37, 1131–1138. [Google Scholar] [CrossRef]
- Moles, C.G.; Mendes, P.; Banga, J.R. Parameter estimation in biochemical pathways: A comparison of global optimization methods. Genome Res. 2003, 13, 2467–2474. [Google Scholar] [CrossRef] [PubMed]
- He, Q.; Wang, L.; Liu, B. Parameter estimation for chaotic systems by particle swarm optimization. Chaos. Fractals 2007, 34, 654–661. [Google Scholar] [CrossRef]
- He, J.; Chiang, M.; Rexford, J. Towards robust multi-layer traffic engineering: Optimization of congestion control and routing. IEEE J. Sel. Areas Commun. 2007, 25, 868–880. [Google Scholar] [CrossRef]
- Wang, N.; Ho, K.; Pavlou, G.; Howarth, M. An overview of routing optimization for internet traffic engineering. IEEE Commun. Surv. Tutor. 2008, 10, 36–56. [Google Scholar] [CrossRef] [Green Version]
- De Jong, K.A. Analysis of the Behavior of a Class of Genetic Adaptive Systems. Ph.D. Thesis, Department of Computer and Communication Sciences, University of Michigan, Ann Arbor, MI, USA, 1975. [Google Scholar]
- Ackley, D. A Connectionist Machine for Genetic Hillclimbing; Kluwer Academic Publishers: Boston, MA, USA, 1987. [Google Scholar]
- Schaffer, J.D.A.R. A Study of Control Parameters Affecting Online Performance of Genetic Algorithms for Function Optimization; Morgan Kaufmann Publishers: San Meteo, CA, USA, 1989. [Google Scholar]
- Mühlenbein, H.; Schomisch, M.; Born, J. The parallel genetic algorithm as function optimizer. Parallel Comput. 1991, 17, 619–632. [Google Scholar] [CrossRef]
- Yao, X.; Liu, Y.; Lin, G. Evolutionary programming made faster. IEEE Trans. Evol. Comput. 1999, 3, 82–102. [Google Scholar]
- Lee, E.H.; Lee, H.M.; Yoo, D.G.; Kim, J.H. Application of a meta-heuristic optimization algorithm motivated by a vision correction procedure for civil engineering problems. KSCE J. Civ. Eng. 2018, 22, 2623–2636. [Google Scholar] [CrossRef]
- Simpson, A.R.; Dandy, G.C.; Murphy, L.J. Genetic algorithms compared to other techniques for pipe optimization. J. Water Resour. Plan. Manag. 1994, 120, 423–443. [Google Scholar] [CrossRef]
- Cunha, M.D.C.; Sousa, J. Water distribution network design optimization: Simulated annealing approach. J. Water Resour. Plan. Manag. 1999, 125, 215–221. [Google Scholar] [CrossRef]
- Maier, H.R.; Simpson, A.R.; Zecchin, A.C.; Foong, W.K.; Phang, K.Y.; Seah, H.Y.; Tan, C.L. Ant-colony optimization for design of water distribution systems. J. Water Resour. Plan. Manag. 2003, 129, 200–209. [Google Scholar] [CrossRef]
- Montalvo, I.; Izquierdo, J.; Pérez, R.; Tung, M.M. Particle swarm optimization applied to the design of water supply systems. Comput. Math. Appl. 2008, 56, 769–776. [Google Scholar] [CrossRef]
- Geem, Z.W. Optimal cost design of water distribution networks using harmony search. Eng. Optim. 2006, 38, 259–277. [Google Scholar] [CrossRef]
- Sadollah, A.; Yoo, D.G.; Yazdi, J.; Kim, J.H.; Choi, Y. Application of Water Cycle Algorithm for Optimal Cost Design of Water Distribution Systems; CUNY Academic Works: New York, NY, USA, 2014. [Google Scholar]
- Sadollah, A.; Yoo, D.G.; Kim, J.H. Improved mine blast algorithm for optimal cost design of water distribution systems. Eng. Optim. 2015, 47, 1602–1618. [Google Scholar] [CrossRef]
- Lee, H.M.; Yoo, D.G.; Sadollah, A.; Kim, J.H. Optimal cost design of water distribution networks using a decomposition approach. Eng. Optim. 2016, 48, 2141–2156. [Google Scholar] [CrossRef]
- Fu, G.; Kapelan, Z.; Kasprzyk, J.R.; Reed, P. Optimal design of water distribution systems using many-objective visual analytics. J. Water Resour. Plan. Manag. 2012, 139, 624–633. [Google Scholar] [CrossRef]
- Alperovits, E.; Shamir, U. Design of optimal water distribution systems. Water Resour. Res. 1977, 13, 885–900. [Google Scholar] [CrossRef]
- Walski, T.M.; Brill, E.D., Jr.; Gessler, J.; Goulter, I.C.; Jeppsen, R.M.; Lansey, K.; Lee, H.; Liebman, J.C.; Mays, L.; Morgan, D.R.; et al. Battle of the Network Models: Epilogue. J. Water Resour. Plan. Manag. 1987, 113, 191–203. [Google Scholar] [CrossRef]
- Fujiwara, O.; Khang, D.B. A two-phase decomposition method for optimal design of looped water distribution networks. Water Resour. Res. 1990, 26, 539–549. [Google Scholar] [CrossRef]
- Kim, J.H.; Kim, T.G.; Kim, J.H.; Yoon, Y.N. A study on the pipe network system design using non-linear programming. J. Korean Water Resour. Assoc. 1994, 27, 59–67. [Google Scholar]
- Reca, J.; Martínez, J. Genetic algorithms for the design of looped irrigation water distribution networks. Water Resour. Res. 2006, 42. [Google Scholar] [CrossRef]
- Bragalli, C.; D’Ambrosio, C.; Lee, J.; Lodi, A.; Toth, P. On the optimal design of water distribution networks: A practical MINLP approach. Optim. Eng. 2012, 13, 219–246. [Google Scholar] [CrossRef]
- Goldberg, D.E.; Holland, J.H. Genetic algorithms and machine learning. Mach. Learn. 1988, 3, 95–99. [Google Scholar] [CrossRef]
- Kirkpatrick, S.; Gelatt, C.D.; Vecchi, M.P. Optimization by simulated annealing. Science 1983, 220, 671–680. [Google Scholar] [CrossRef]
- Geem, Z.W.; Kim, J.H.; Loganathan, G.V. A new heuristic optimization algorithm: Harmony search. Simulation 2001, 76, 60–68. [Google Scholar] [CrossRef]
- Eskandar, H.; Sadollah, A.; Bahreininejad, A.; Hamdi, M. Water cycle algorithm: A novel metaheuristic optimization method for solving constrained engineering optimization problems. Comput. Struct. 2012, 110, 151–166. [Google Scholar] [CrossRef]
Figure 1.
The layout of the two-loop example network (junction ID and water demand in m3/hour).

Figure 2.
The layout of the Hanoi network (junction ID and water demand in m3/hour).

Figure 3.
Performance comparison results (mean of average improvement ratio in percentage). (a) Genetic algorithms (GAs); (b) simulated annealing (SA); (c) harmony search algorithm (HSA); and (d) water cycle algorithm (WCA).
Figure 3.
Performance comparison results (mean of average improvement ratio in percentage). (a) Genetic algorithms (GAs); (b) simulated annealing (SA); (c) harmony search algorithm (HSA); and (d) water cycle algorithm (WCA).

Figure 4.
Performance comparison results (standard deviation of average improvement ratio). (a) GAs; (b) SA; (c) HSA; and (d) WCA.
Figure 4.
Performance comparison results (standard deviation of average improvement ratio). (a) GAs; (b) SA; (c) HSA; and (d) WCA.

Figure 5.
Performance comparison results (mean of best improvement ratio in percentage). (a) GAs; (b) SA; (c) HSA; and (d) WCA.
Figure 5.
Performance comparison results (mean of best improvement ratio in percentage). (a) GAs; (b) SA; (c) HSA; and (d) WCA.

Figure 6.
Performance comparison results (standard deviation of best improvement ratio). (a) GAs; (b) SA; (c) HSA; and (d) WCA.
Figure 6.
Performance comparison results (standard deviation of best improvement ratio). (a) GAs; (b) SA; (c) HSA; and (d) WCA.


Table 1.
Factors that were altered in the generation of engineering benchmark problems.
| Factor | Definition |
|---|---|
| n | Number of pipes |
| m | Number of candidate pipe diameter options |
| p | Pressure constraint |
| c | Roughness coefficient |
| d | Nodal demand multiplier |
Table 2.
Factors applied in engineering benchmarks modified from the two-loop network design problem.
Table 2.
Factors applied in engineering benchmarks modified from the two-loop network design problem.
| Figure | Values Used |
|---|---|
| n | [8, 16, 24] |
| m | [5, 6, 7] |
| p | [30, 35, 40] |
| C | [130, 100, 70] |
| D | [1.0, 1.5, 2.0] |
Table 3.
Complete enumeration for the modified two-loop network design problems.
| Modified factor | n | ||
| Used value | 8 | 16 | 24 |
| Global optimum ($) | 882,000 | 1,764,000 | 2,646,000 |
| No. of candidate designs | 390,625 | 1.53E + 11 | 5.96E + 16 |
| No. of feasible designs | 9956 | 9.91E + 07 | 9.87E + 11 |
| Ratio of feasible designs (%) | 2.5487 | 0.0650 | 0.0017 |
| Modified factor | m | ||
| Used value | 5 | 6 | 7 |
| Global optimum ($) | 882,000 | 841,000 | 474,000 |
| No. of candidate designs | 390,625 | 1,679,616 | 5,764,801 |
| No. of feasible designs | 9956 | 38,721 | 389,145 |
| Ratio of feasible designs (%) | 2.5487 | 2.3053 | 6.7504 |
| Modified factor | p | ||
| Used value | 30 | 35 | 40 |
| Global optimum ($) | 882,000 | 949,000 | 1,354,000 |
| No. of candidate designs | 390,625 | 390,625 | 390,625 |
| No. of feasible designs | 9956 | 4725 | 2294 |
| Ratio of feasible designs (%) | 2.5487 | 1.2096 | 0.5873 |
| Modified factor | c | ||
| Used value | 130 | 100 | 70 |
| Global optimum ($) | 882,000 | 961,000 | 1,403,000 |
| No. of candidate designs | 390,625 | 390,625 | 390,625 |
| No. of feasible designs | 9956 | 4101 | 1895 |
| Ratio of feasible designs (%) | 2.5487 | 1.0499 | 0.4851 |
| Modified factor | d | ||
| Used value | 1.0 | 1.5 | 2.0 |
| Global optimum ($) | 882,000 | 1,010,000 | 1,476,000 |
| No. of candidate designs | 390,625 | 390,625 | 390,625 |
| No. of feasible designs | 9956 | 3346 | 1326 |
| Ratio of feasible designs (%) | 2.5487 | 0.8566 | 0.3395 |
Table 4.
Factors applied in engineering benchmarks modified from the Hanoi network design problem.
| Factor | Values Used |
|---|---|
| n | [34, 68, 102, 136] |
| m | [6, 8, 10, 12] |
| p | [30, 35, 40, 45] |
| c | [130, 125, 120, 115] |
| d | [1.0, 1.05, 1.1, 1.15] |
Table 5.
Performance comparison of modified Hanoi network design problems (success rate).
| Factors | Success Rate (%) | ||||||||||||||
|---|---|---|---|---|---|---|---|---|---|---|---|---|---|---|---|
| RS | GAs | SA | HSA | WCA | |||||||||||
| 10,000 FEs* | 30,000 FEs | 50,000 FEs | 10,000 FEs | 30,000 FEs | 50,000 FEs | 10,000 FEs | 30,000 FEs | 50,000 FEs | 10,000 FEs | 30,000 FEs | 50,000 FEs | 10,000 FEs | 30,000 FEs | 50,000 FEs | |
| n | 0 | 0 | 0 | 23.75 | 68.75 | 100 | 6.25 | 8.75 | 15 | 100 | 100 | 100 | 100 | 100 | 100 |
| m | 0 | 0 | 0 | 55 | 100 | 100 | 15 | 17.5 | 27.5 | 100 | 100 | 100 | 100 | 100 | 100 |
| p | 0 | 0 | 0 | 63.75 | 100 | 100 | 7.5 | 10 | 16.25 | 100 | 100 | 100 | 100 | 100 | 100 |
| c | 0 | 0 | 0 | 46.25 | 100 | 100 | 10 | 12.5 | 18.75 | 100 | 100 | 100 | 100 | 100 | 100 |
| d | 0 | 0 | 0 | 51.25 | 98.75 | 100 | 6.25 | 8.75 | 15 | 100 | 100 | 100 | 100 | 100 | 100 |
* FEs: Function evaluations.
© 2019 by the authors. Licensee MDPI, Basel, Switzerland. This article is an open access article distributed under the terms and conditions of the Creative Commons Attribution (CC BY) license (http://creativecommons.org/licenses/by/4.0/).
Share and Cite
MDPI and ACS Style
Lee, H.M.; Jung, D.; Sadollah, A.; Yoo, D.G.; Kim, J.H. Generation of Benchmark Problems for Optimal Design of Water Distribution Systems. Water 2019, 11, 1637. https://doi.org/10.3390/w11081637
AMA Style
Lee HM, Jung D, Sadollah A, Yoo DG, Kim JH. Generation of Benchmark Problems for Optimal Design of Water Distribution Systems. Water. 2019; 11(8):1637. https://doi.org/10.3390/w11081637
Chicago/Turabian StyleLee, Ho Min, Donghwi Jung, Ali Sadollah, Do Guen Yoo, and Joong Hoon Kim. 2019. "Generation of Benchmark Problems for Optimal Design of Water Distribution Systems" Water 11, no. 8: 1637. https://doi.org/10.3390/w11081637
Note that from the first issue of 2016, this journal uses article numbers instead of page numbers. See further details here.