Simulating the Overtopping Failure of Homogeneous Embankment by a Double-Point Two-Phase MPM


College of Water Resources & Civil Engineering, China Agricultural University, Beijing 100083, China
*
Author to whom correspondence should be addressed.
Water 2019, 11(8), 1636; https://doi.org/10.3390/w11081636
Submission received: 25 May 2019
/
Revised: 3 August 2019
/
Accepted: 5 August 2019
/
Published: 8 August 2019
(This article belongs to the Special Issue Advances in Modelling and Prediction on the Impact of Human Activities and Extreme Events on Environments)
Abstract
:Embankments are usually constructed along rivers as a defense structure against flooding. Overtopping failure can cause devastating and fatal consequences to life and property of surrounding areas. This motivates researchers to study the formation, propagation, and destructive consequences of such hazards in risk analysis of hydraulic engineering. This paper reports a numerical simulation of failure processes in homogeneous embankments due to flow overtopping. The employed numerical approach is based on a double-point two-phase material point method (MPM) considering water–soil interaction and seepage effects. The simulated results are compared to available laboratory experiments in the literature. It was shown that the proposed method can predict the overtopping failure process of embankments with good accuracy. Furthermore, the effects of the cohesion, internal fiction angle, initial porosity, and maximum porosity of soil on the embankment failure are investigated.
1. Introduction
Embankments are frequently used along rivers against flooding events, the probability of which has increased due to increasing intensity extreme weather events in recent years [1]. Their overtopping failure may cause serious loss of life and property downstream. For example, the Banqiao dam-breaking flood due to Typhoon Nina in 1975 lead to about 62,000 deaths [2]. Therefore, a deep investigation of overtopping failure mechanisms and processes in embankments is important for the risk management and assessment. Among the available study methods, numerical modeling has distinctive advantages such as the relatively low cost and the flexible application to almost arbitrary site configurations. In the past decades, many numerical investigations of the overtopping failure in embankments have been performed. For example, Powledge et al. [3] studied the embankment erosion due to overflow, Tingsanchali and Chinnarasri [4] used a one dimensional model to study the overtopping failure in embankment. Chinnarasri et al. [5] investigated the overtopping-induced progressive damage in embankment. Leopardi et al. [6] reviewed the modeling of embankment overtopping, Pontillo et al. [7] employed a two-phase model to evaluate the dike erosion induced by overtopping, Volz et al. [8] modeled the overtopping failure of a non-cohesive embankment by the dual-mesh approach, Mizutani et al. [9] simulated the overtopping failure of embankment considering infiltration effects, Guan et al. [10] and Kakinuma and Shimizu [11] developed a 2D shallow-water model for embankment breach, Evangelista [12] simulated dike erosion induced by dam-breaking flows using a depth-integrated two-phase model, Larese et al. [2] modeled the overtopping and failure of rockfill dams using the particle finite element method (PFEM). Although many efforts have been made to numerically reproduce the main features of the process, the overtopping failure of embankments is still poorly understood. Moreover, most of the aforementioned numerical methods are mesh-based approaches and have difficulties in accurately modeling the time evolution of the embankment breach, since the real overtopping failure phenomenon is, in fact, an unsteady process involving large deformations, free-surface flows, moving boundary, and water–soil interactions. To deal with these challenges, several meshless methods, such as smoothed particle hydrodynamics (SPH) [13,14], moving particle semi-implicit method (MPS) [15], element-free Galerkin method (EFGM) [16], and material point method (MPM) [17,18], have been developed to model large deformation problems. For examples, Gotoh et al. [19,20] modeled embankment erosion due to overflow using MPS, Li et al. [21] simulated erosion of HPTRM levee based on SPH, Zhang et al. [22] modeled failures of dike due to water level-up and rainfall using SPH, Liu et al. [23] simulated piping erosion process of dike foundation by EFGM. Nikolic et al. [24] presented a discrete beam lattice model capable of simulating localized failure in a heterogeneous fluid-saturated poro-plastic solid. Zhao and Liang [25] applied MPM to model seepage flow through embankments, Martinelli et al. [26] modeled the failure of a sand dike due to seepage flow using two-phase MPM. In this work, the MPM was employed for modeling the overtopping failure of embankments because it has several advantages over other meshless methods such as EFGM, MPS, and SPH: The boundary condition realization is as easy as in the finite element method (FEM) for the use of background mesh in MPM [27]. Time-consuming neighbor particle searching is required in SPH, MPS and EFGM, but the MPM requires only the identification of particles relative to the background mesh. The MPM also avoids the tensile instability that is evident in the SPH [27].
The MPM was first proposed by Sulsky et al. [17] in 1994, which uses the Lagrangian particle and the Euler background mesh to describe large deformation problems. The particles move freely across the background mesh and carry all physical parameters such as stress, density, mass, velocity, and other historical variables. The MPM combines the advantages of the Euler method and the Lagrangian method to avoid the interference of convection terms and mesh distortion. It also can treat contact problems between different objects without any additional interface elements. In addition, the traditional soil constitutive laws such as Mohr–Coulomb, Drucker–Prager, and Cam Clay models can be easily implemented in MPM at the particle level [17,18]. Recent developments in the multiphase MPM formulations considering the soil–water interaction can be categorized into two main groups: Single-point approach and double-point approach. In the first approach, each material point (MP) possesses both the soil and water information. The water is described in the Eulerian framework while the soil skeleton is described in the Lagrangian framework. The single-point approach does not guarantee the mass conservation of water. In the second approach, two sets of MPs are used to represent water and solid maters. The double-point approach can guarantee both the solid and water mass conservation. Mackenzie-Helnwein et al. [28] used the double-point approach to model soil–water mixtures through a drag model for capturing the interphase interaction. Abe et al. [29] employed the double-point approach to model saturated soil without considering the relative acceleration between water and the soil skeleton. Bandara and Soga [30] developed a double-point two-phase MPM formulation based on the mixture theory considering the relative acceleration between water and the soil skeleton. This approach not only can be used for modeling rapid deformation problems but also guarantees both the soil skeleton and water mass conservation. It is therefore very suitable for modeling soil–water interaction problems such as currently considered embankment failure due to erosion.
The present work aims to numerically investigate the failure mechanism and failure process of homogeneous embankment due to overtopping flows based on a double-point two-phase MPM method.
2. Mathematical Formulation
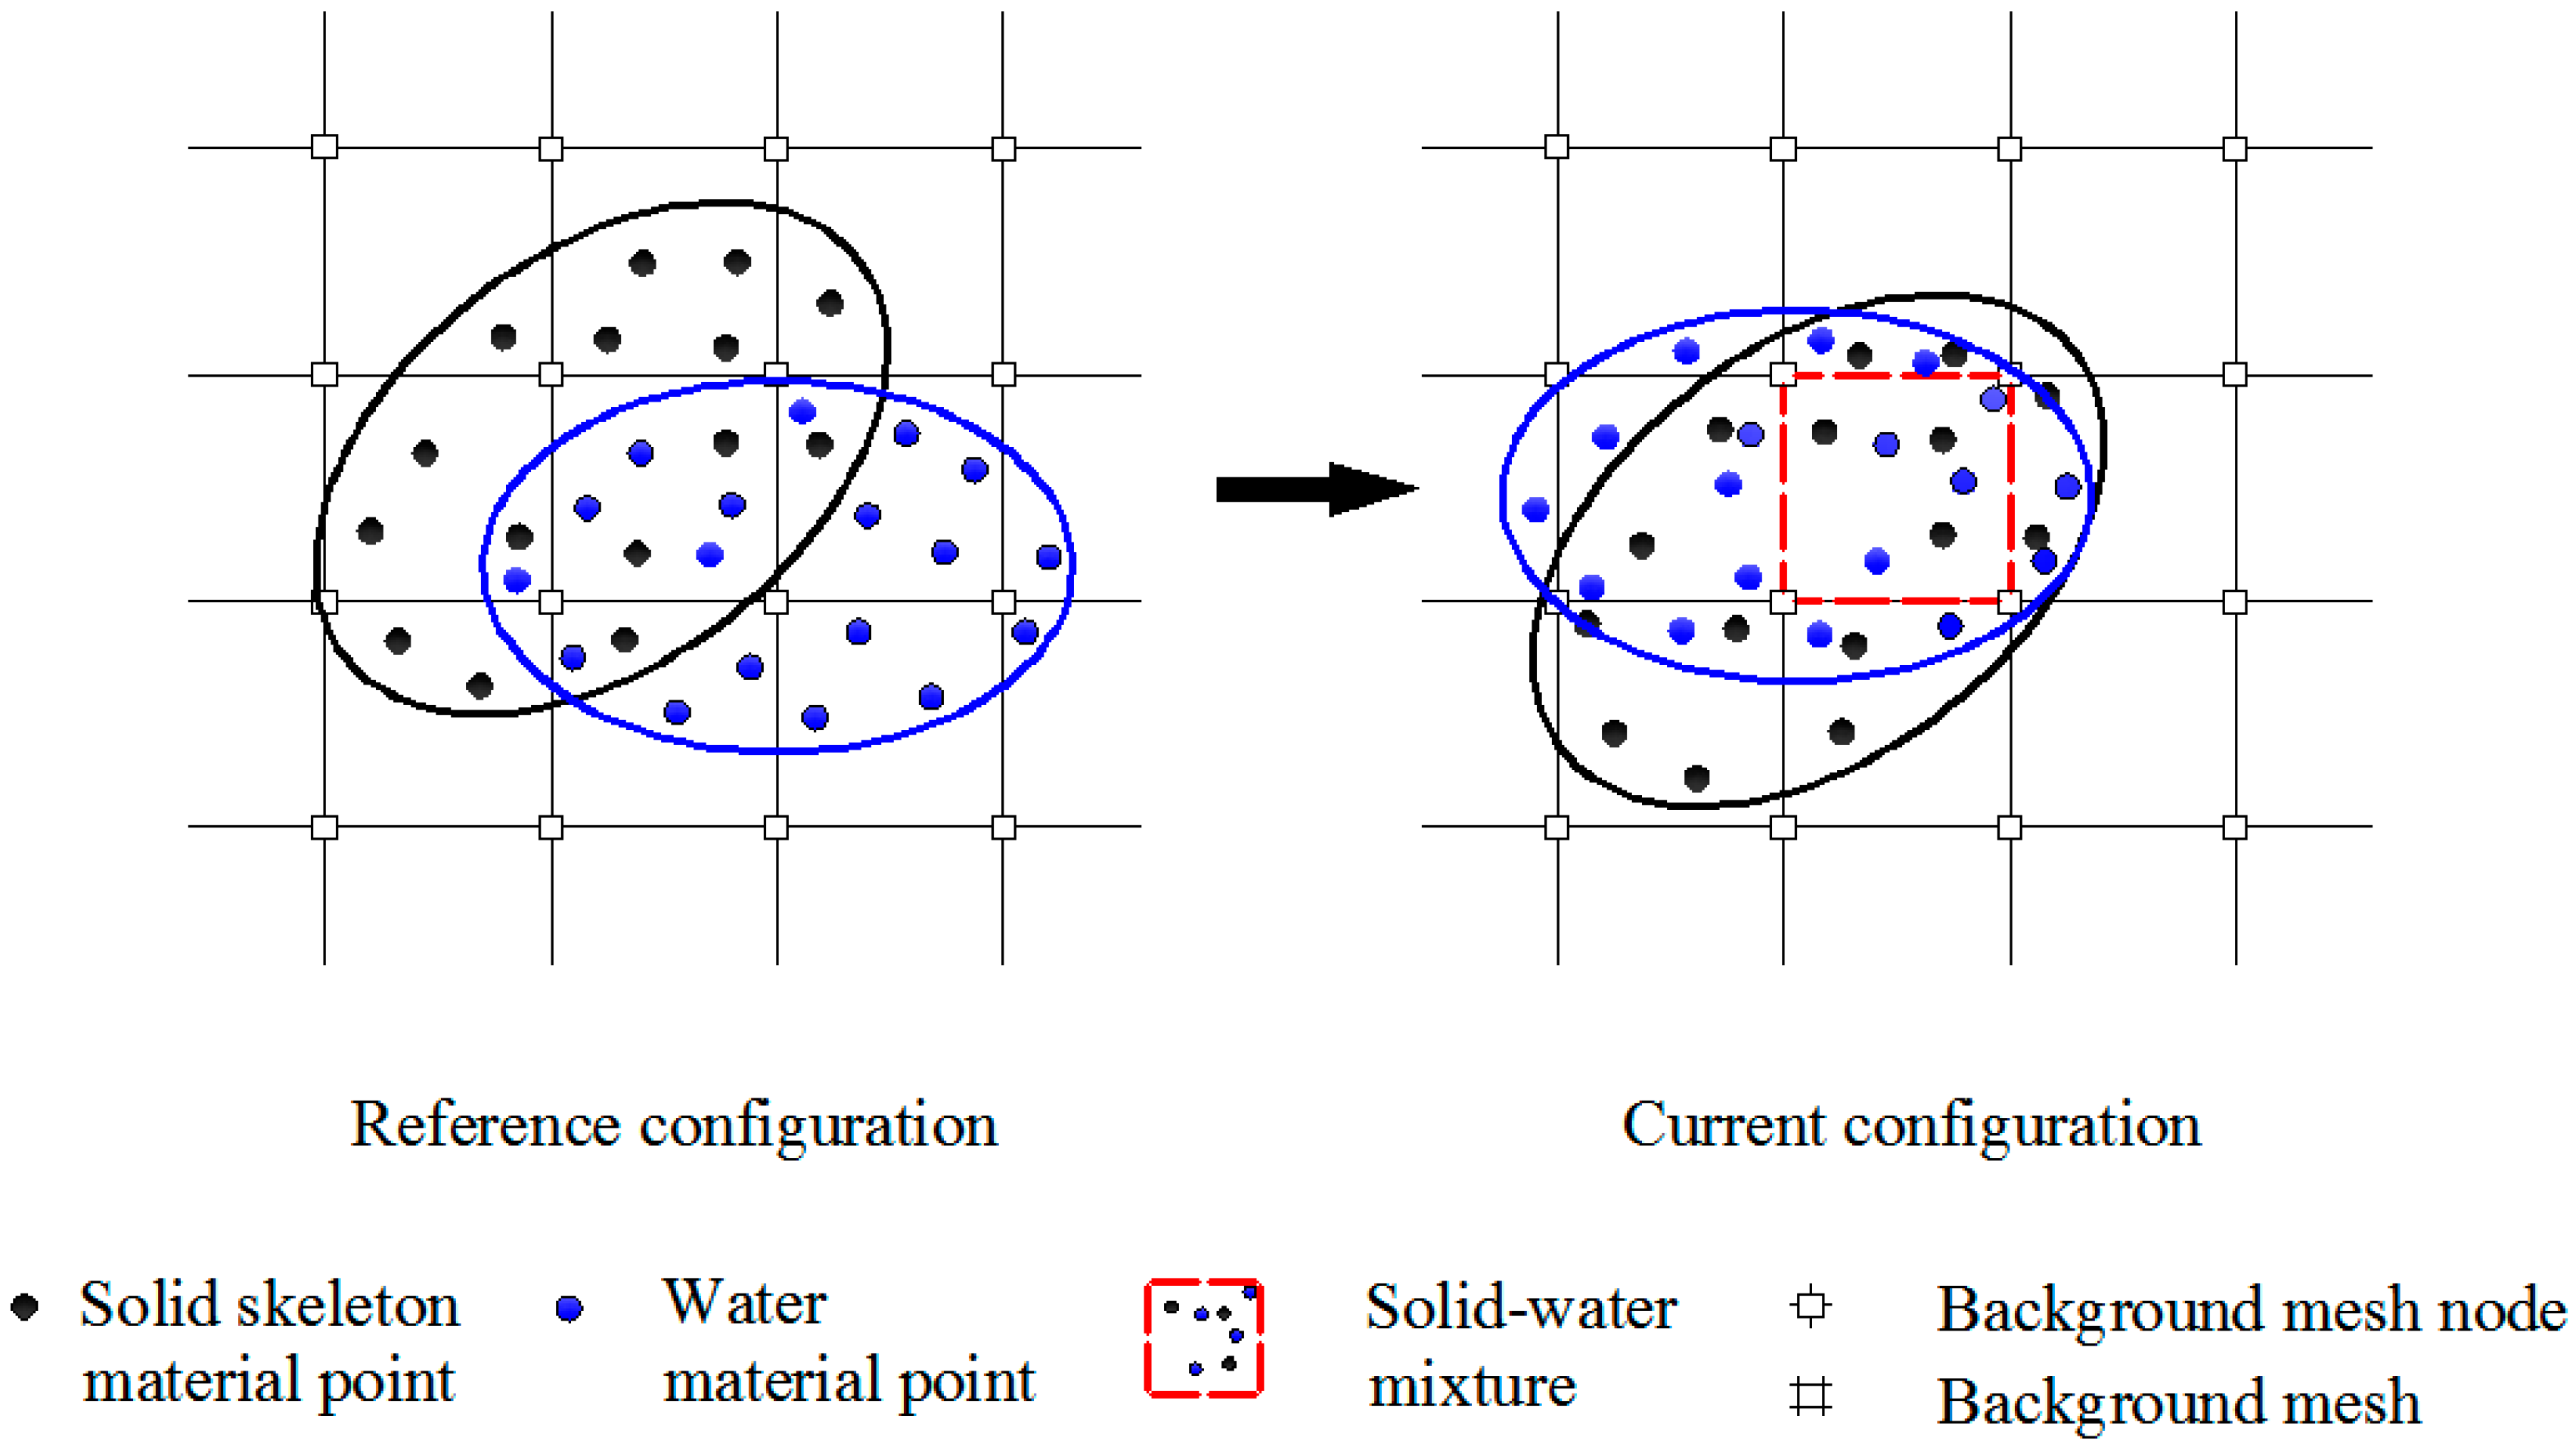
The double-point two-phase MPM formulation [26,31] based on the mixture theory is used to model the water–soil interactions. In this approach, the soil skeleton and the pore liquid in the saturated soil are represented separately by two sets of material points: Solid material points and water material points (Figure 1). This paper focuses on the application of two-phase MPM to simulate embankment overtopping, only some of the basic equations solved are quoted for the convenience of readers in understanding the two-phase MPM formulation, and for detailed description of the algorithms readers are referred to the literature [26,31].
The governing equations of the double-point two-phase MPM include the mass and momentum conservations of both solid and liquid phases with their respective constitutive equations. The mass conservation equations for the solid and liquid phase are respectively given by [31].
where is the volumetric concentration ratio of solid, is the volumetric concentration ratio of liquid. For saturated soils, is equivalent to porosity of the soil skeleton and . is a discontinuous function at the transition between free surface water and porous medium and it is characterized by two constant values: One in the free surface water and the value of the porosity n in the porous medium. Martinelli [33] proposed the concept of a transition zone in which an interpolated liquid concentration ratio is introduced which gives a smooth transition of between the free surface water and the porous medium. is the velocity vector of the solid phase, is the velocity vector of the liquid phase. is the volumetric strain of the liquid. denotes the material time derivative. Equation (1) represents the variation of volumetric concentration ratio of the liquid phase (i.e., porosity), and Equation (2) is also known as the storage equation and represents the volumetric strain rate of the pore liquid.
The momentum conservation of the solid and liquid phase can be respectively expressed as [31]:
where and are respectively the partial densities of the solid and liquid, computed as the ratio of the mass of each constituent with respect to the reference volume. g is the gravity vector, is the liquid phase acceleration, is the solid phase acceleration. and are the partial stresses of solid and liquid phases respectively, is the effective stress tensor, and is the liquid phase stress tensor. is the drag force, which represents the water–soil interaction due to the velocity difference between the two phases, it can be calculated by [34]
where is the liquid dynamic viscosity, is the soil intrinsic permeability with the average diameter of grains, is the non-Darcy flow coefficient, the empirical constants and are respectively set to 150 and 1.75 [34].
In order to fully describe the behavior of saturated soils, the constitutive equations for both phases are required. Assuming the validity of Terzaghi’s effective stress concept, the general form of stress–strain relationship for soil skeleton is given by
where D is the tangent stiffness matrix, is the effective stress vector, and is the total strain. For the liquid phase, the volumetric stresses is updated by
where is the liquid bulk modulus, is the volumetric strain of the liquid. In addition, for pure liquid or fluidized mixture, the deviatoric part of the stress tensor is calculated by
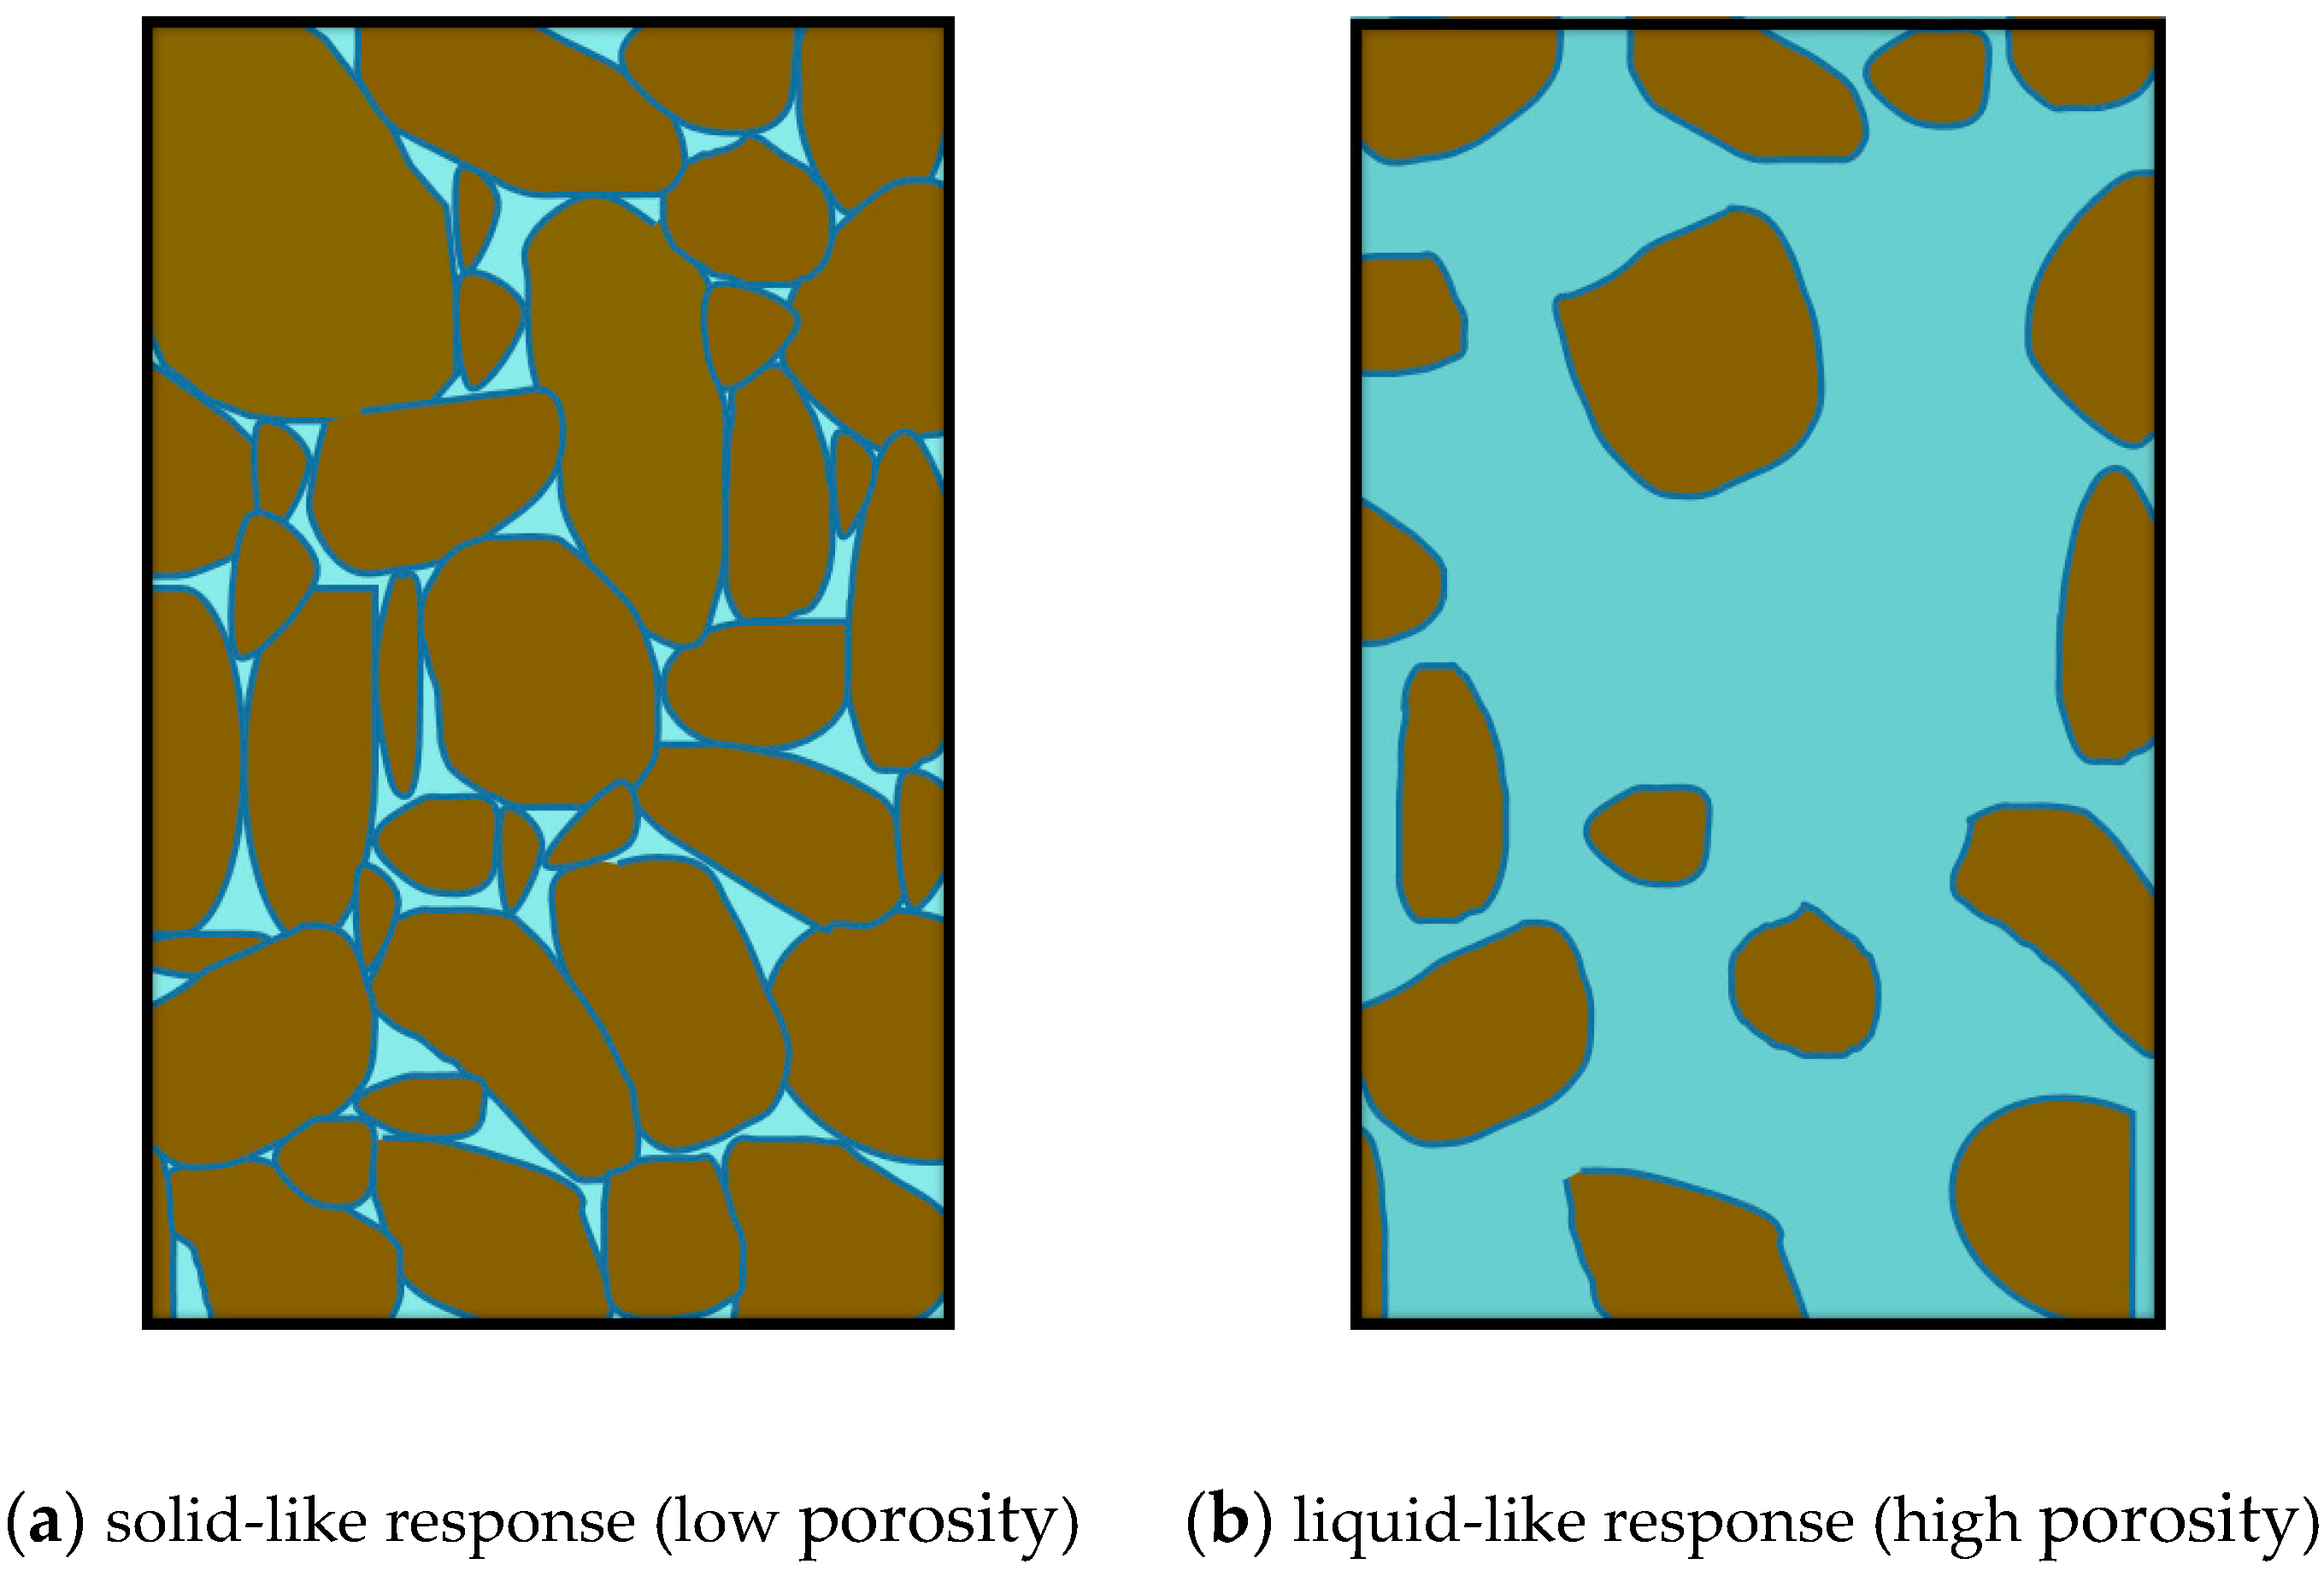
In the proposed double-point two-phase MPM, the saturated soils can be considered as a solid-like or liquid-like state according to the porosity. As shown in Figure 2a, in the case of low porosity, the solid skeleton grains are in contact and the soil behaves like a solid, its response thus can be modeled by a soil constitutive model. For a high-porosity soil, as shown in Figure 2b, the grains are not in contact and float together with the liquid phase and the soil response is modeled by the Navier–Stokes equation. In the present work, a pre-given maximum porosity nmax is used to distinguish the two aforementioned states. When the soil porosity is less than the maximum porosity (), the mean effective stress decreases as the porosity increases and the mean effective stress vanishes once the grains are not in contact. When the porosity is larger than nmax, fluidization occurs.
3. Numerical Examples
In this section, the proposed double-point two-phase MPM is first validated by an example of flow through a porous block. Then a numerical investigation of failure process in a homogeneous embankment due to flow overtopping was performed and the effects of the cohesion, internal fiction angle, initial porosity, and maximum porosity of soils on the embankment failure are investigated. All calculations are conducted with the software Anura3D_v2016 (www.anura3d.com), which implements the double-point two-phase MPM formulation.
3.1. Flow through a Porous Block
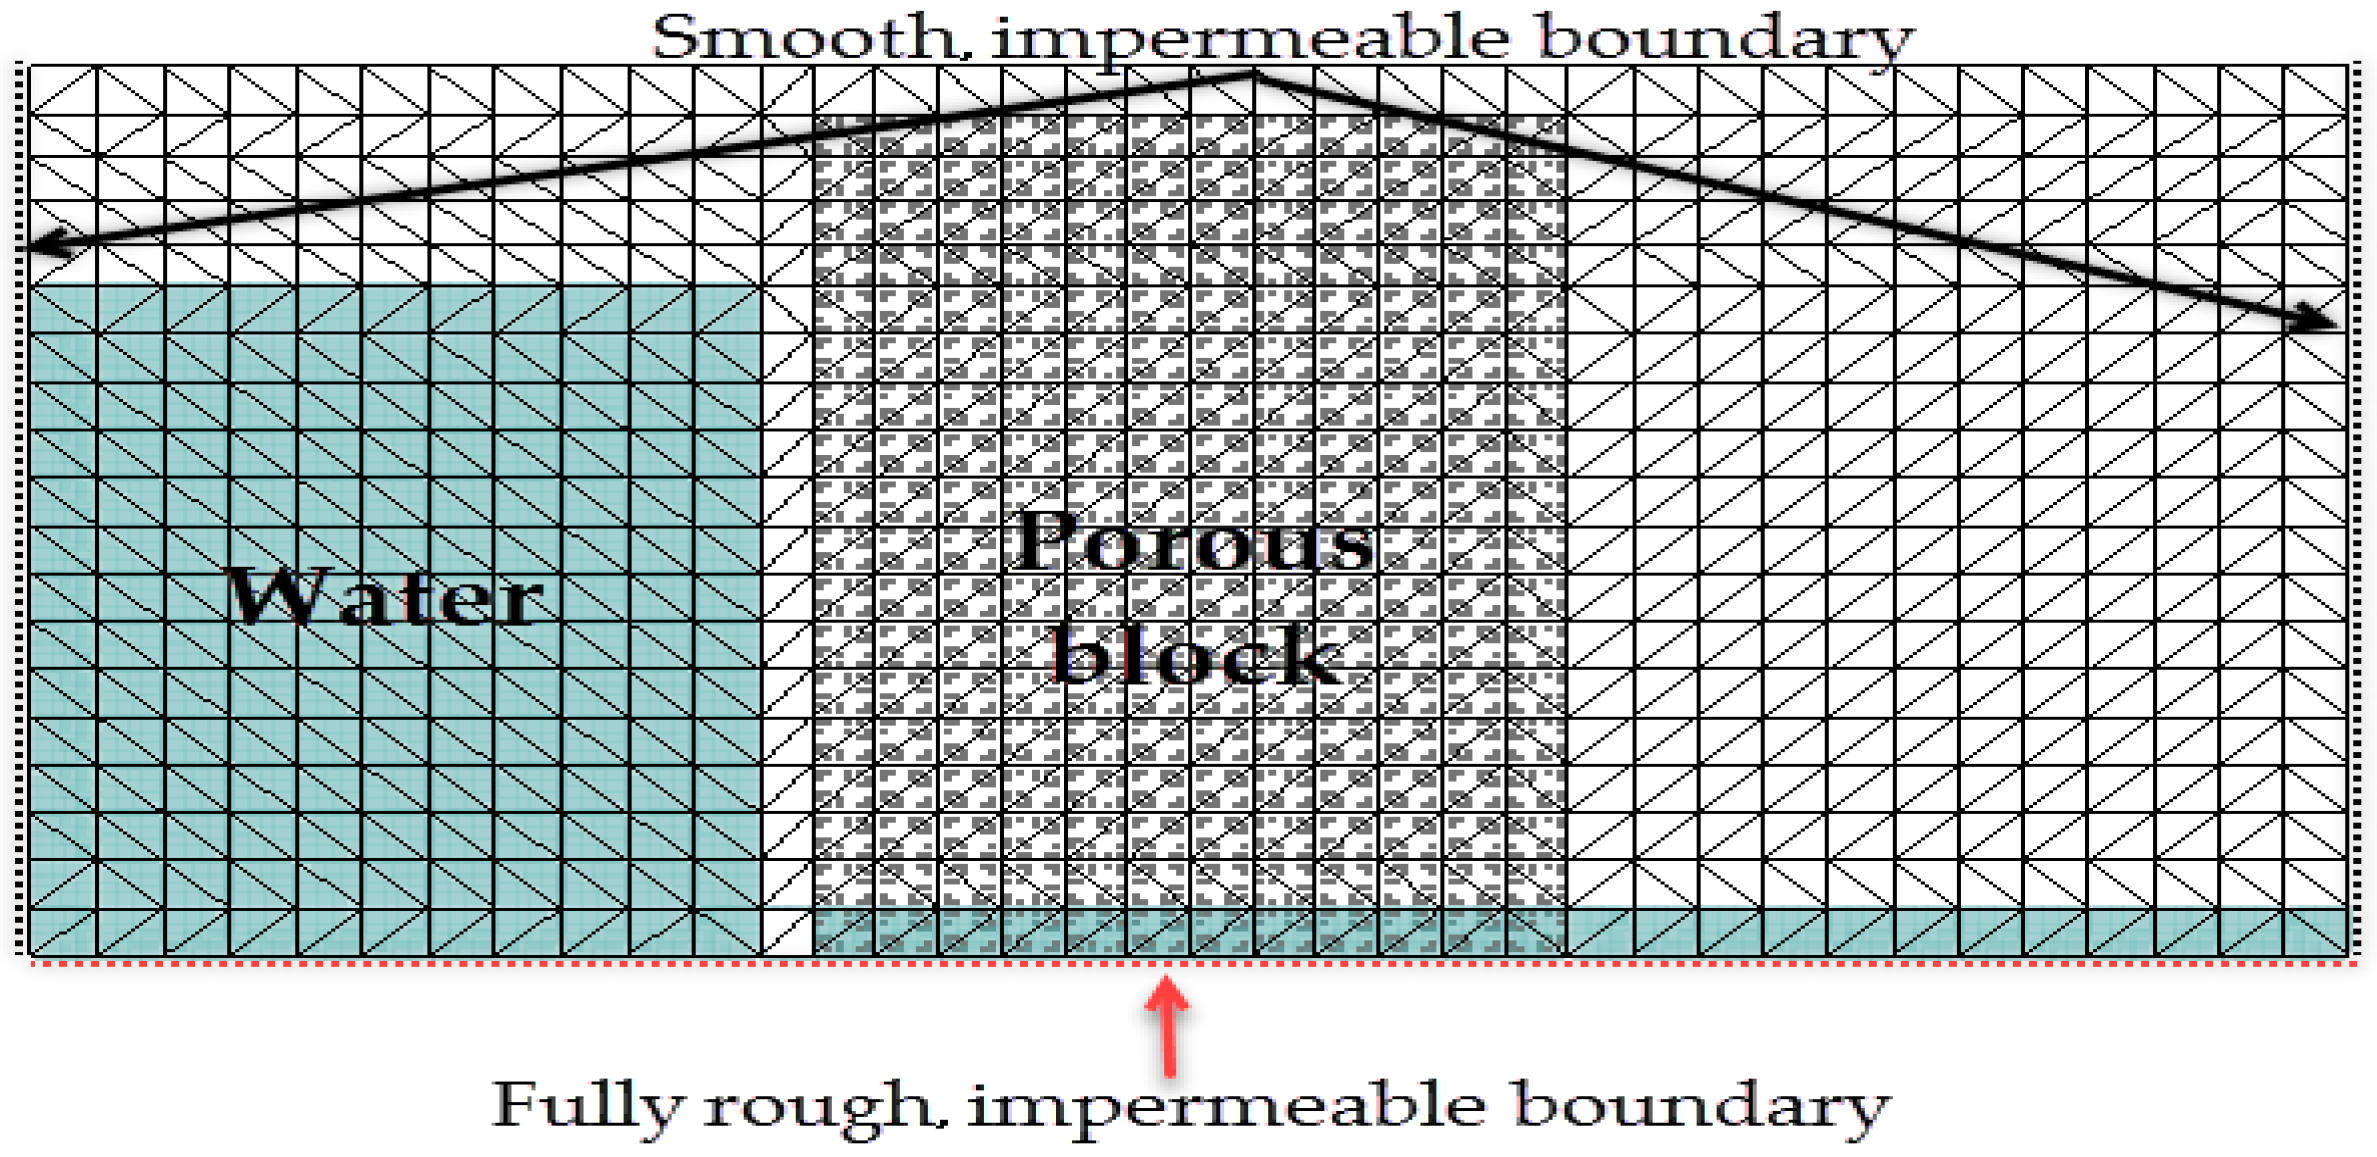
In order to validate the capability of the current MPM algorithm to model the water–soil interaction, a numerical simulation of the flow through a porous block was performed and the calculated results were compared with the experimental data obtained by Liu et al. [35]. The experiment as sketched in Figure 3 was carried out in a transparent water tank with a size of 0.892 m × 0.44 m × 0.58 m, the porous block, which was made of gravel, was located at the center of the water tank (x = 0.30–0.59 m), and it was 0.29 m long, 0.44 m wide, and 0.37 m high. The water on the left side of the water tank was separated from the porous block by a movable gate with a thickness of 0.02 m, and the height was set to 0.35 m, and the porous block was confined in the initial region to ensure that the porous media was not allowed to move. The material parameters used in this simulation are listed in Table 1. The computational domain was divided into 4104 tetrahedral elements. Each mesh element in the porous block part contained four material points, while each element in the water contained 10 material points.
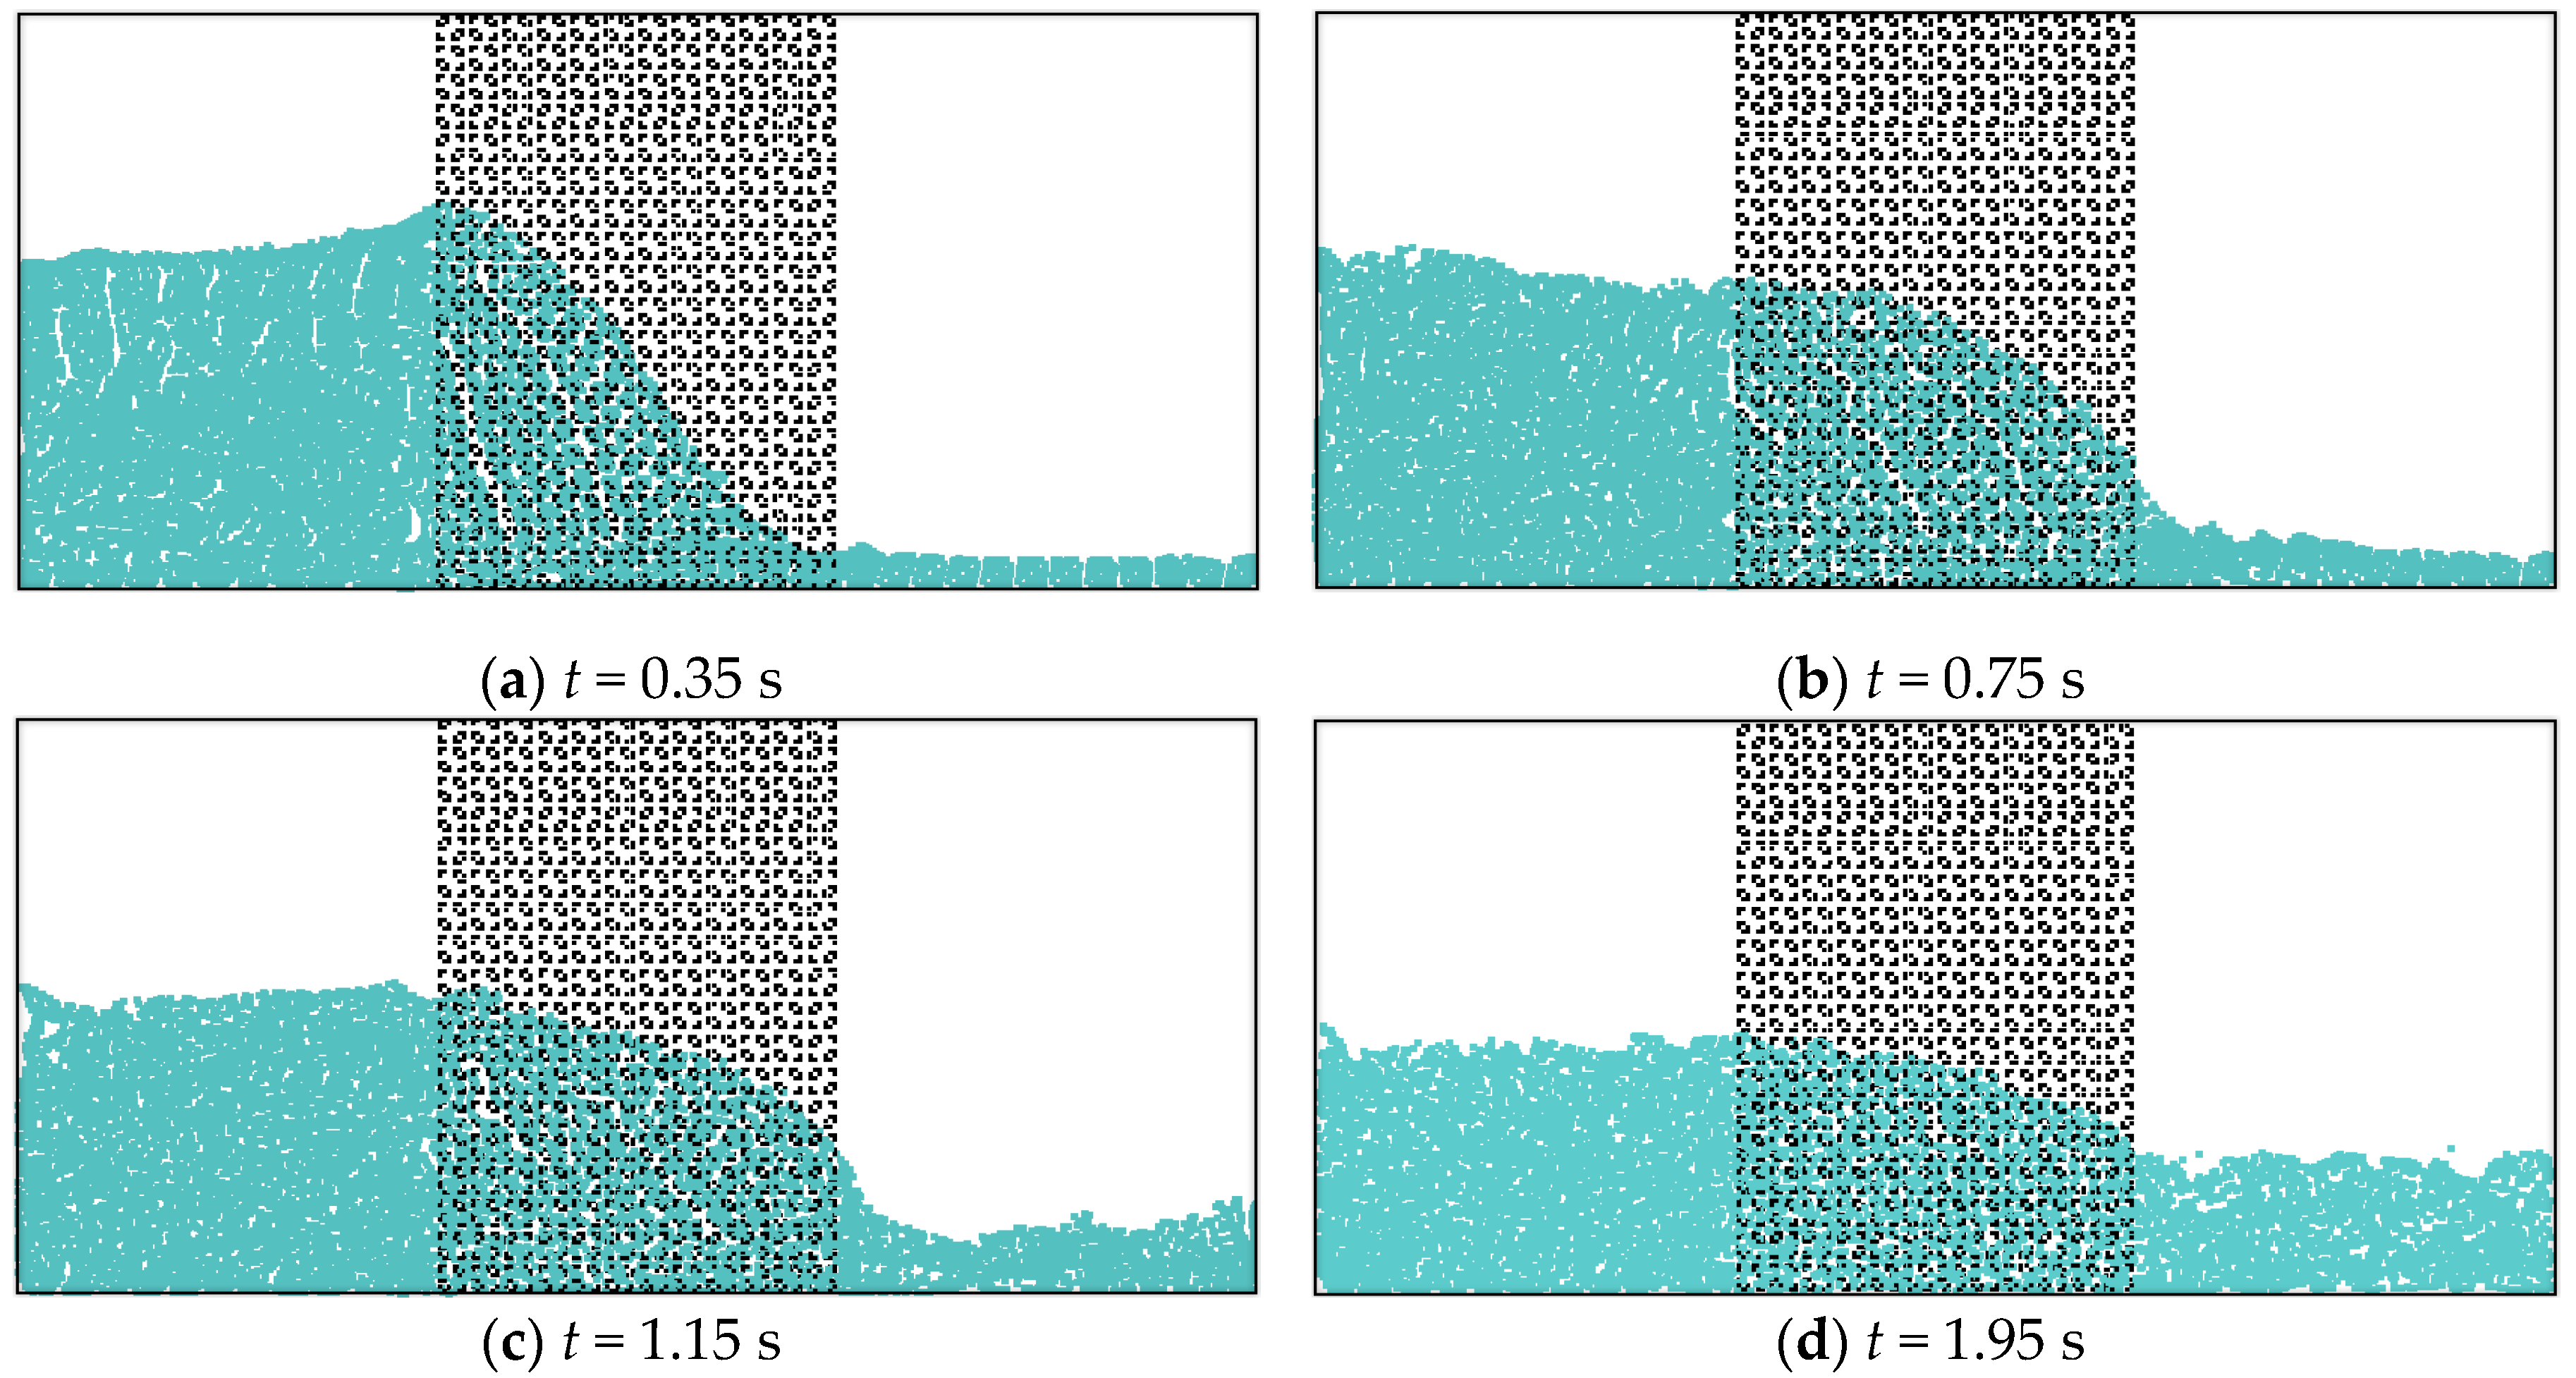
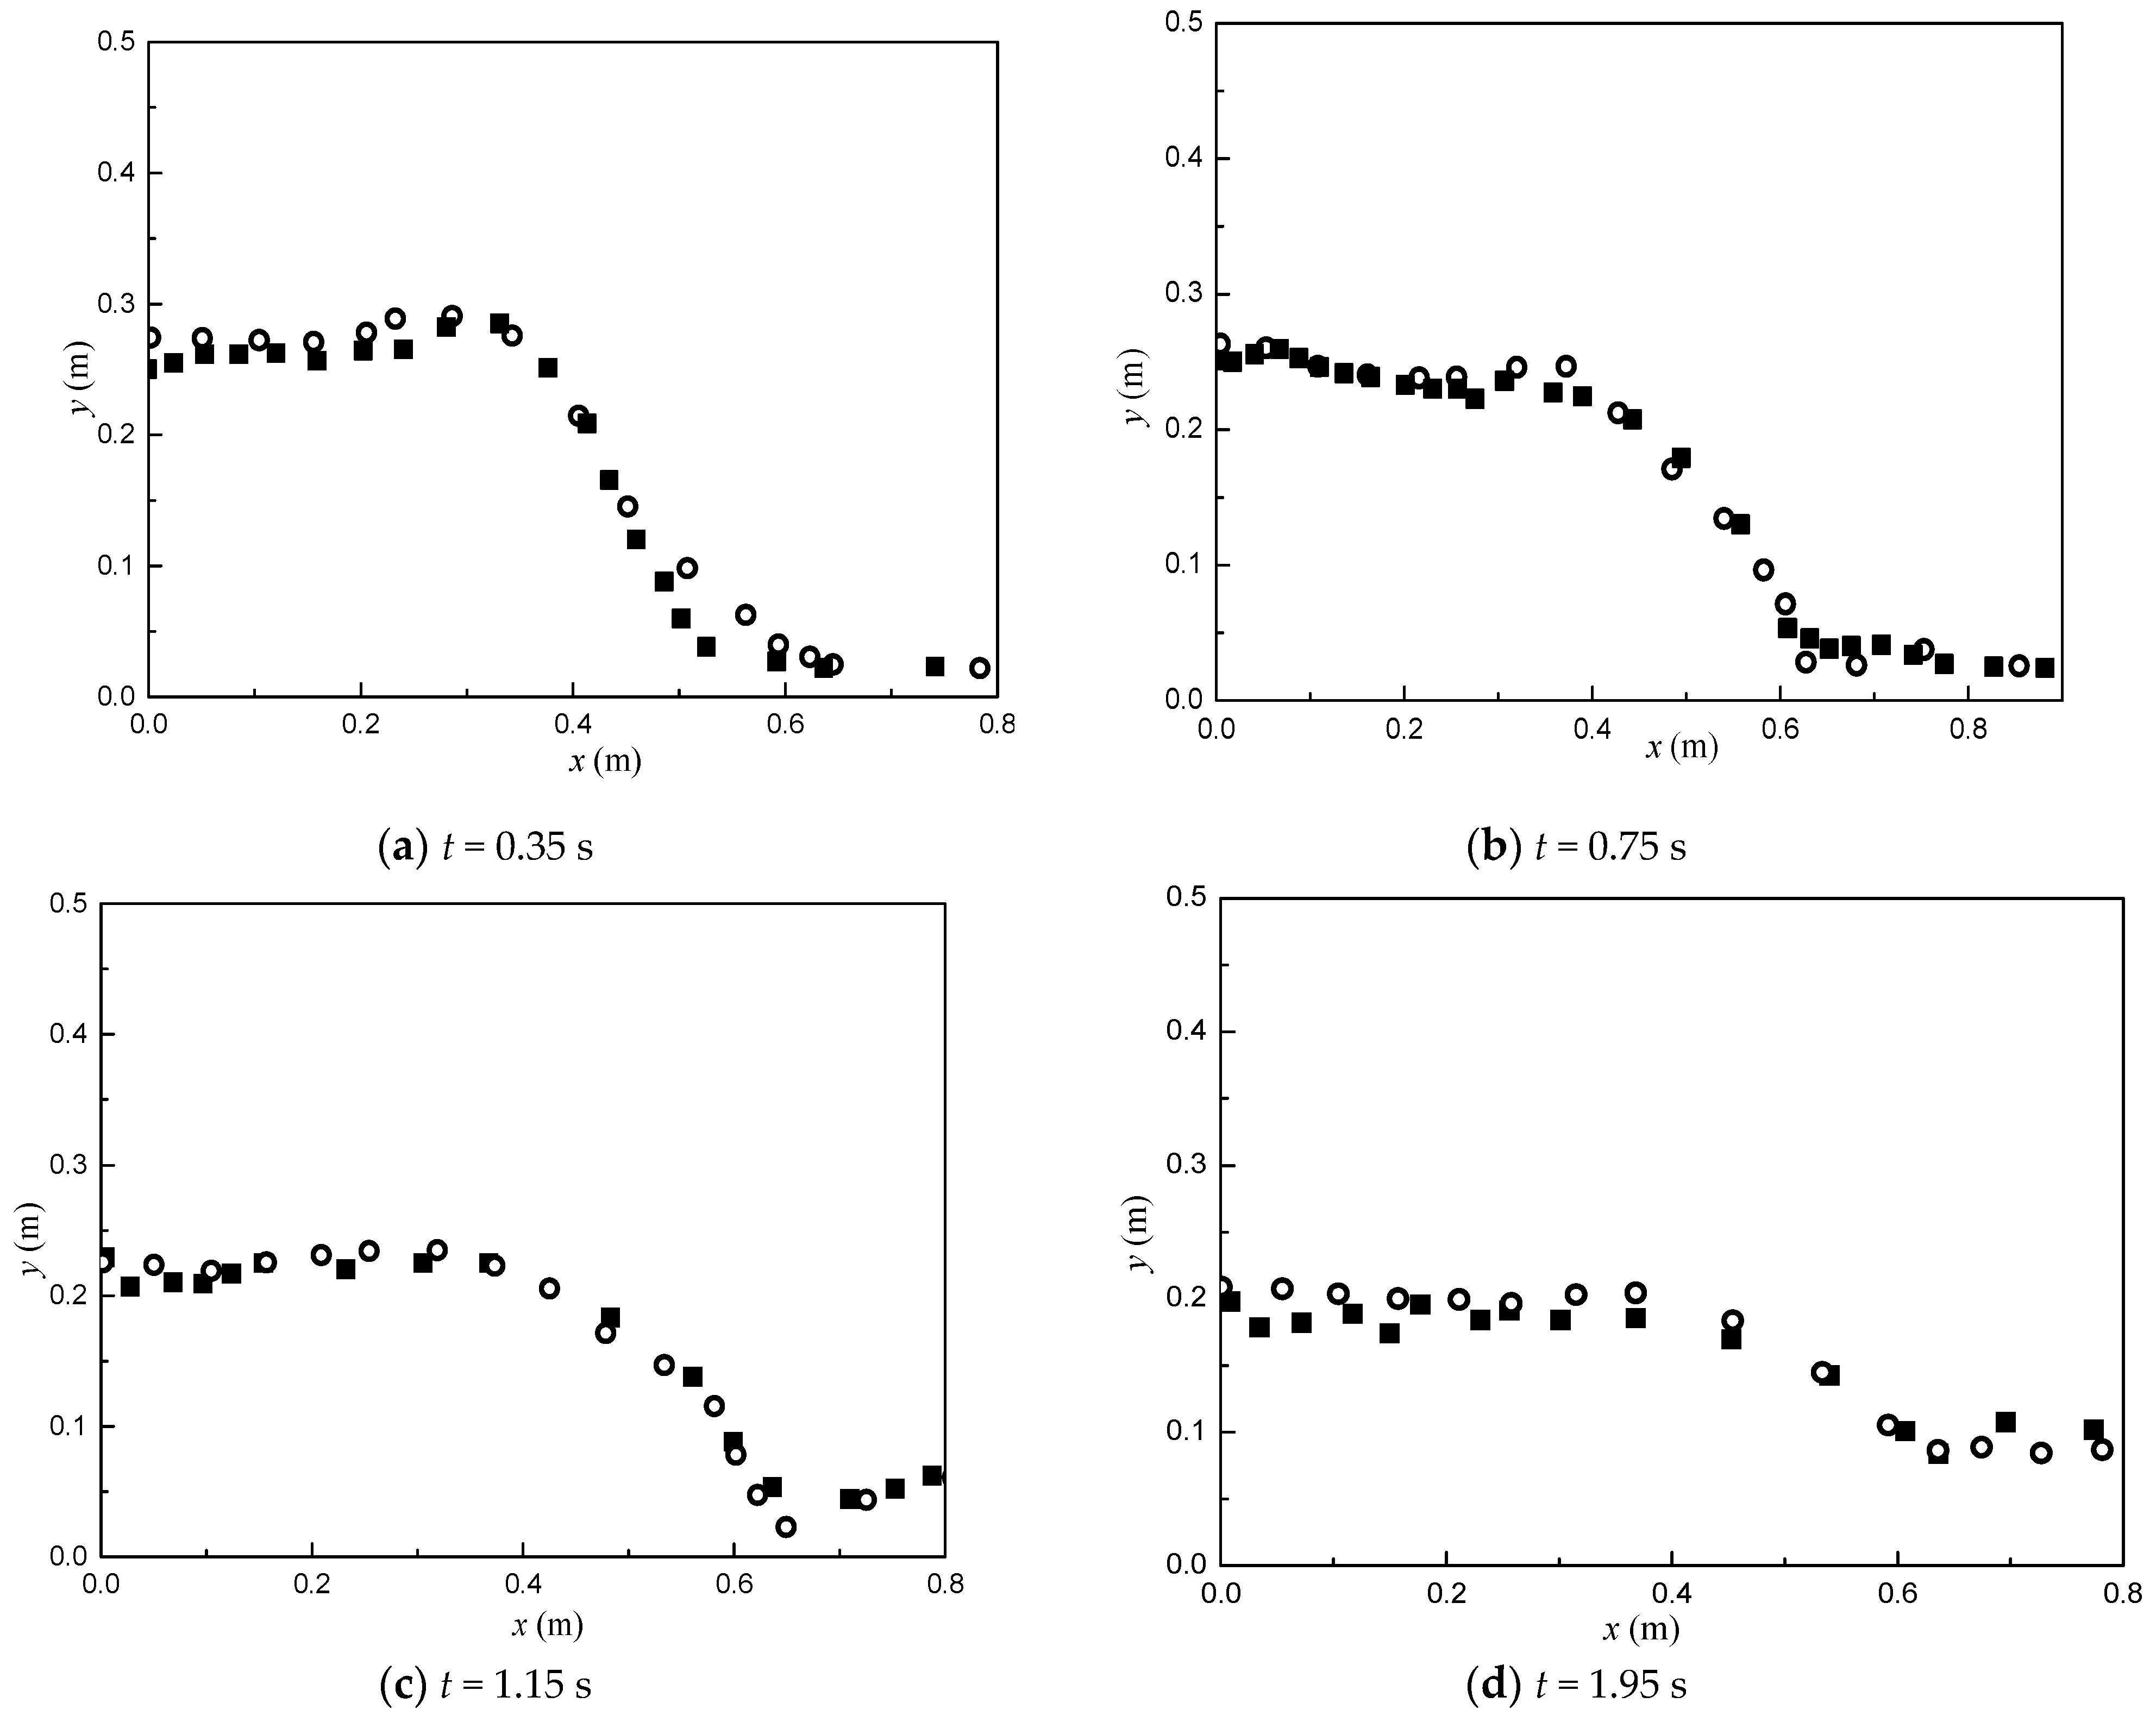
The simulation process was divided into two stages, the first stage was the initialization of stress, also called the gravity loading process. At this stage, the lateral displacement of the water was constrained and the stress initialization was done by increasing the gravity until the solution converged to a quasi-static equilibrium, which was checked by evaluating the normalized kinetic energy and the normalized out-of-balance force falls below a predefined tolerance as given in [31]. In addition, a local damping coefficient of 0.75 was applied to accelerate the convergence to quasi-static equilibrium allowing a considerable reduction in the computational time. In the second stage, the lateral constraint of water was removed to simulate the instantaneous moving process of the gate, and then water flow impacted the porous block. Figure 4 shows some snapshots of the flow through the porous block at time of 0.35, 0.75, 1.15, and 1.95 s and the calculated free-surface profiles agree well with that of the experimental results [35], and comparisons of free surface profiles are shown in Figure 5. It is proven that the double-point MPM can simulate the process of flow through the porous medium considering the water–soil interaction.
3.2. Overtopping Failure of Homogeneous Embankments
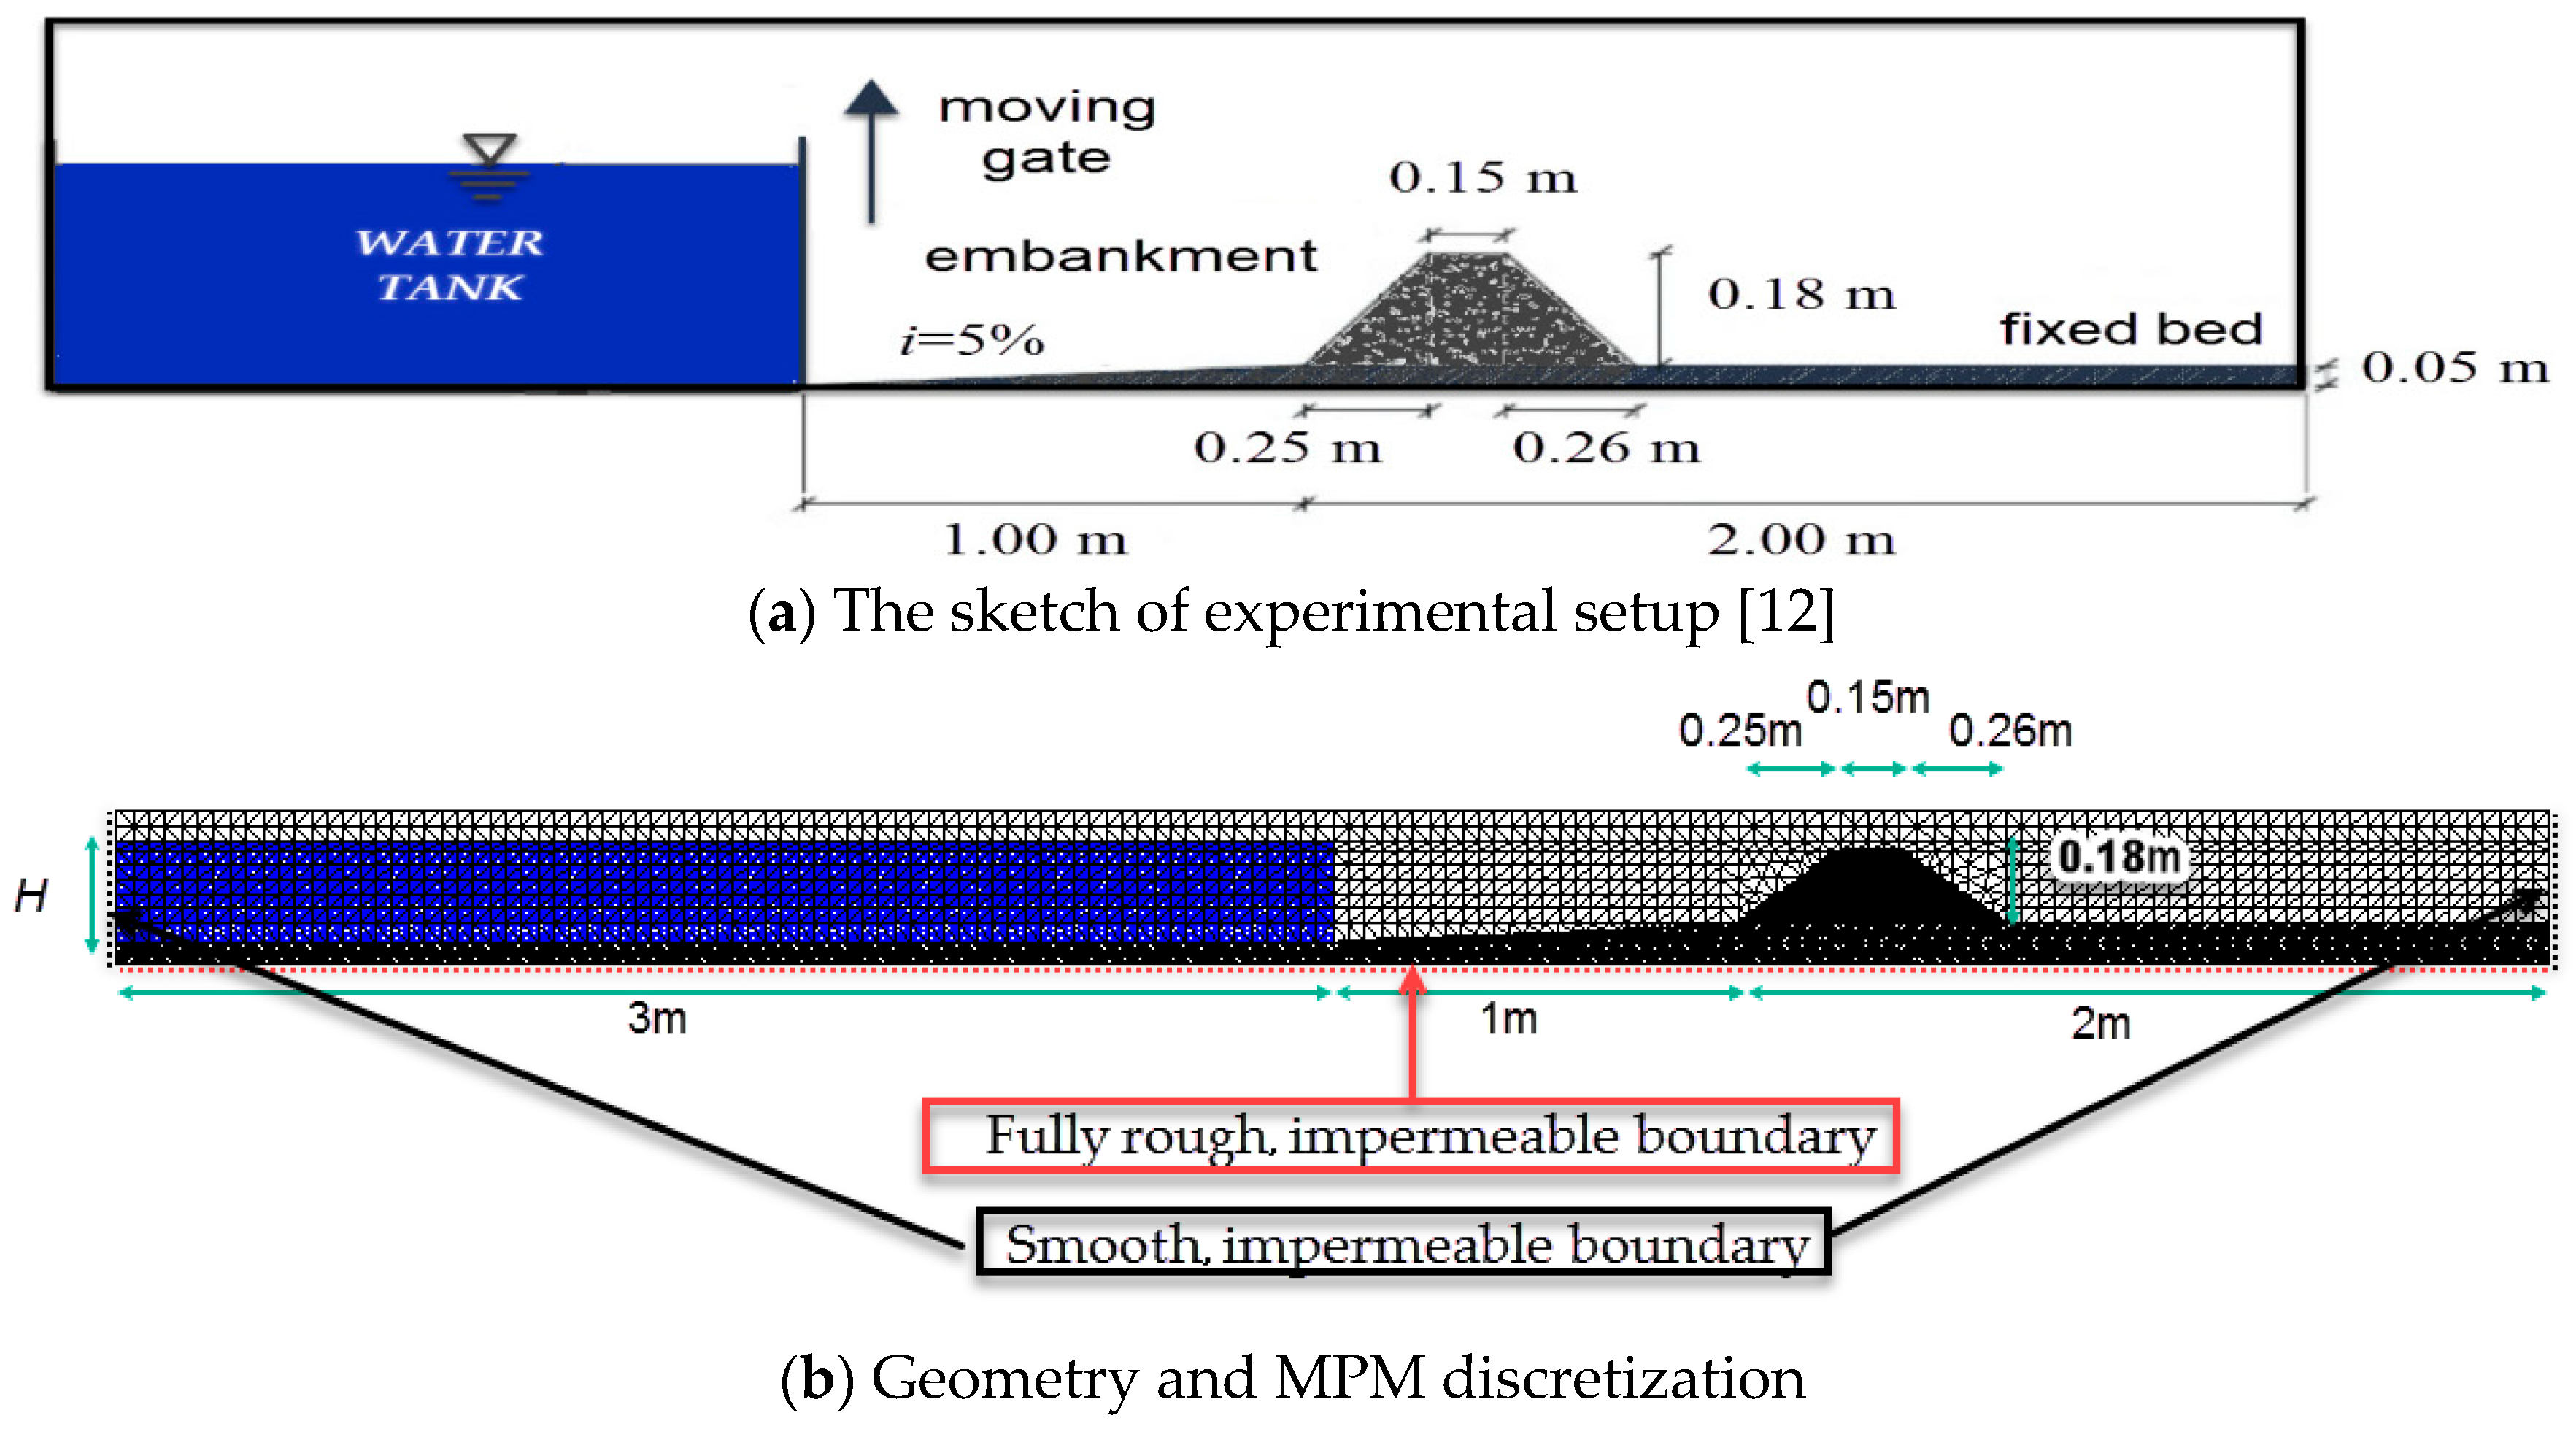
For a better understanding of the embankments failure mechanism and process due to the overtopping flow, in this section, MPM modeling of the overtopping erosion of a homogeneous embankment considering free water surface flow, water–soil interaction, and seepage effects was performed and the simulated results were compared with the experimental data obtained by Evangelista et al. [12]. The effects of the cohesion, internal fiction angle, initial porosity, and maximum porosity of soil on the embankment failure were investigated. As sketched in Figure 6a, this experiment was carried out in a Perspex horizontal channel with a 0.40 m wide rectangular cross-section and transparent walls. A 3.00 m long tank with a moving gate was used to store water, in which H represents the water level. The gate was suddenly lifted to produce the dam-break flow, which propagates over the downstream channel bottom. The first segment of the rigid bed was 1.00 m long and had a mild slope (5%), the subsequent one was a 2.00 m long, 0.05 m thick horizontal segment, on which the embankment was built.
According to Evangelista et al. [12], the friction at the lateral interface of the channel has no significant wall effects and the embankment undergoes an almost plane process because the flow overtops the entire embankment width. For these reasons, in our simulation, the overtopping failure process was simplified approximately as a two-dimensional problem. In addition, the gate opening was considered instantaneous following the work of Lauber and Hager [36]. The computational domain was divided into a set of tetrahedral elements with the size of 0.05 m. Each mesh element in the embankment part contained four material points, while each element in the water contained 10 material points (see Figure 6b). The water was modeled as a weak compressible fluid, and the Mohr–Coulomb model was used as the constitutive model of the soil. The material parameters used in this simulation are listed in Table 2. Three different cases with initial water level of H = 0.2, 0.25 and 0.395 m were conducted.
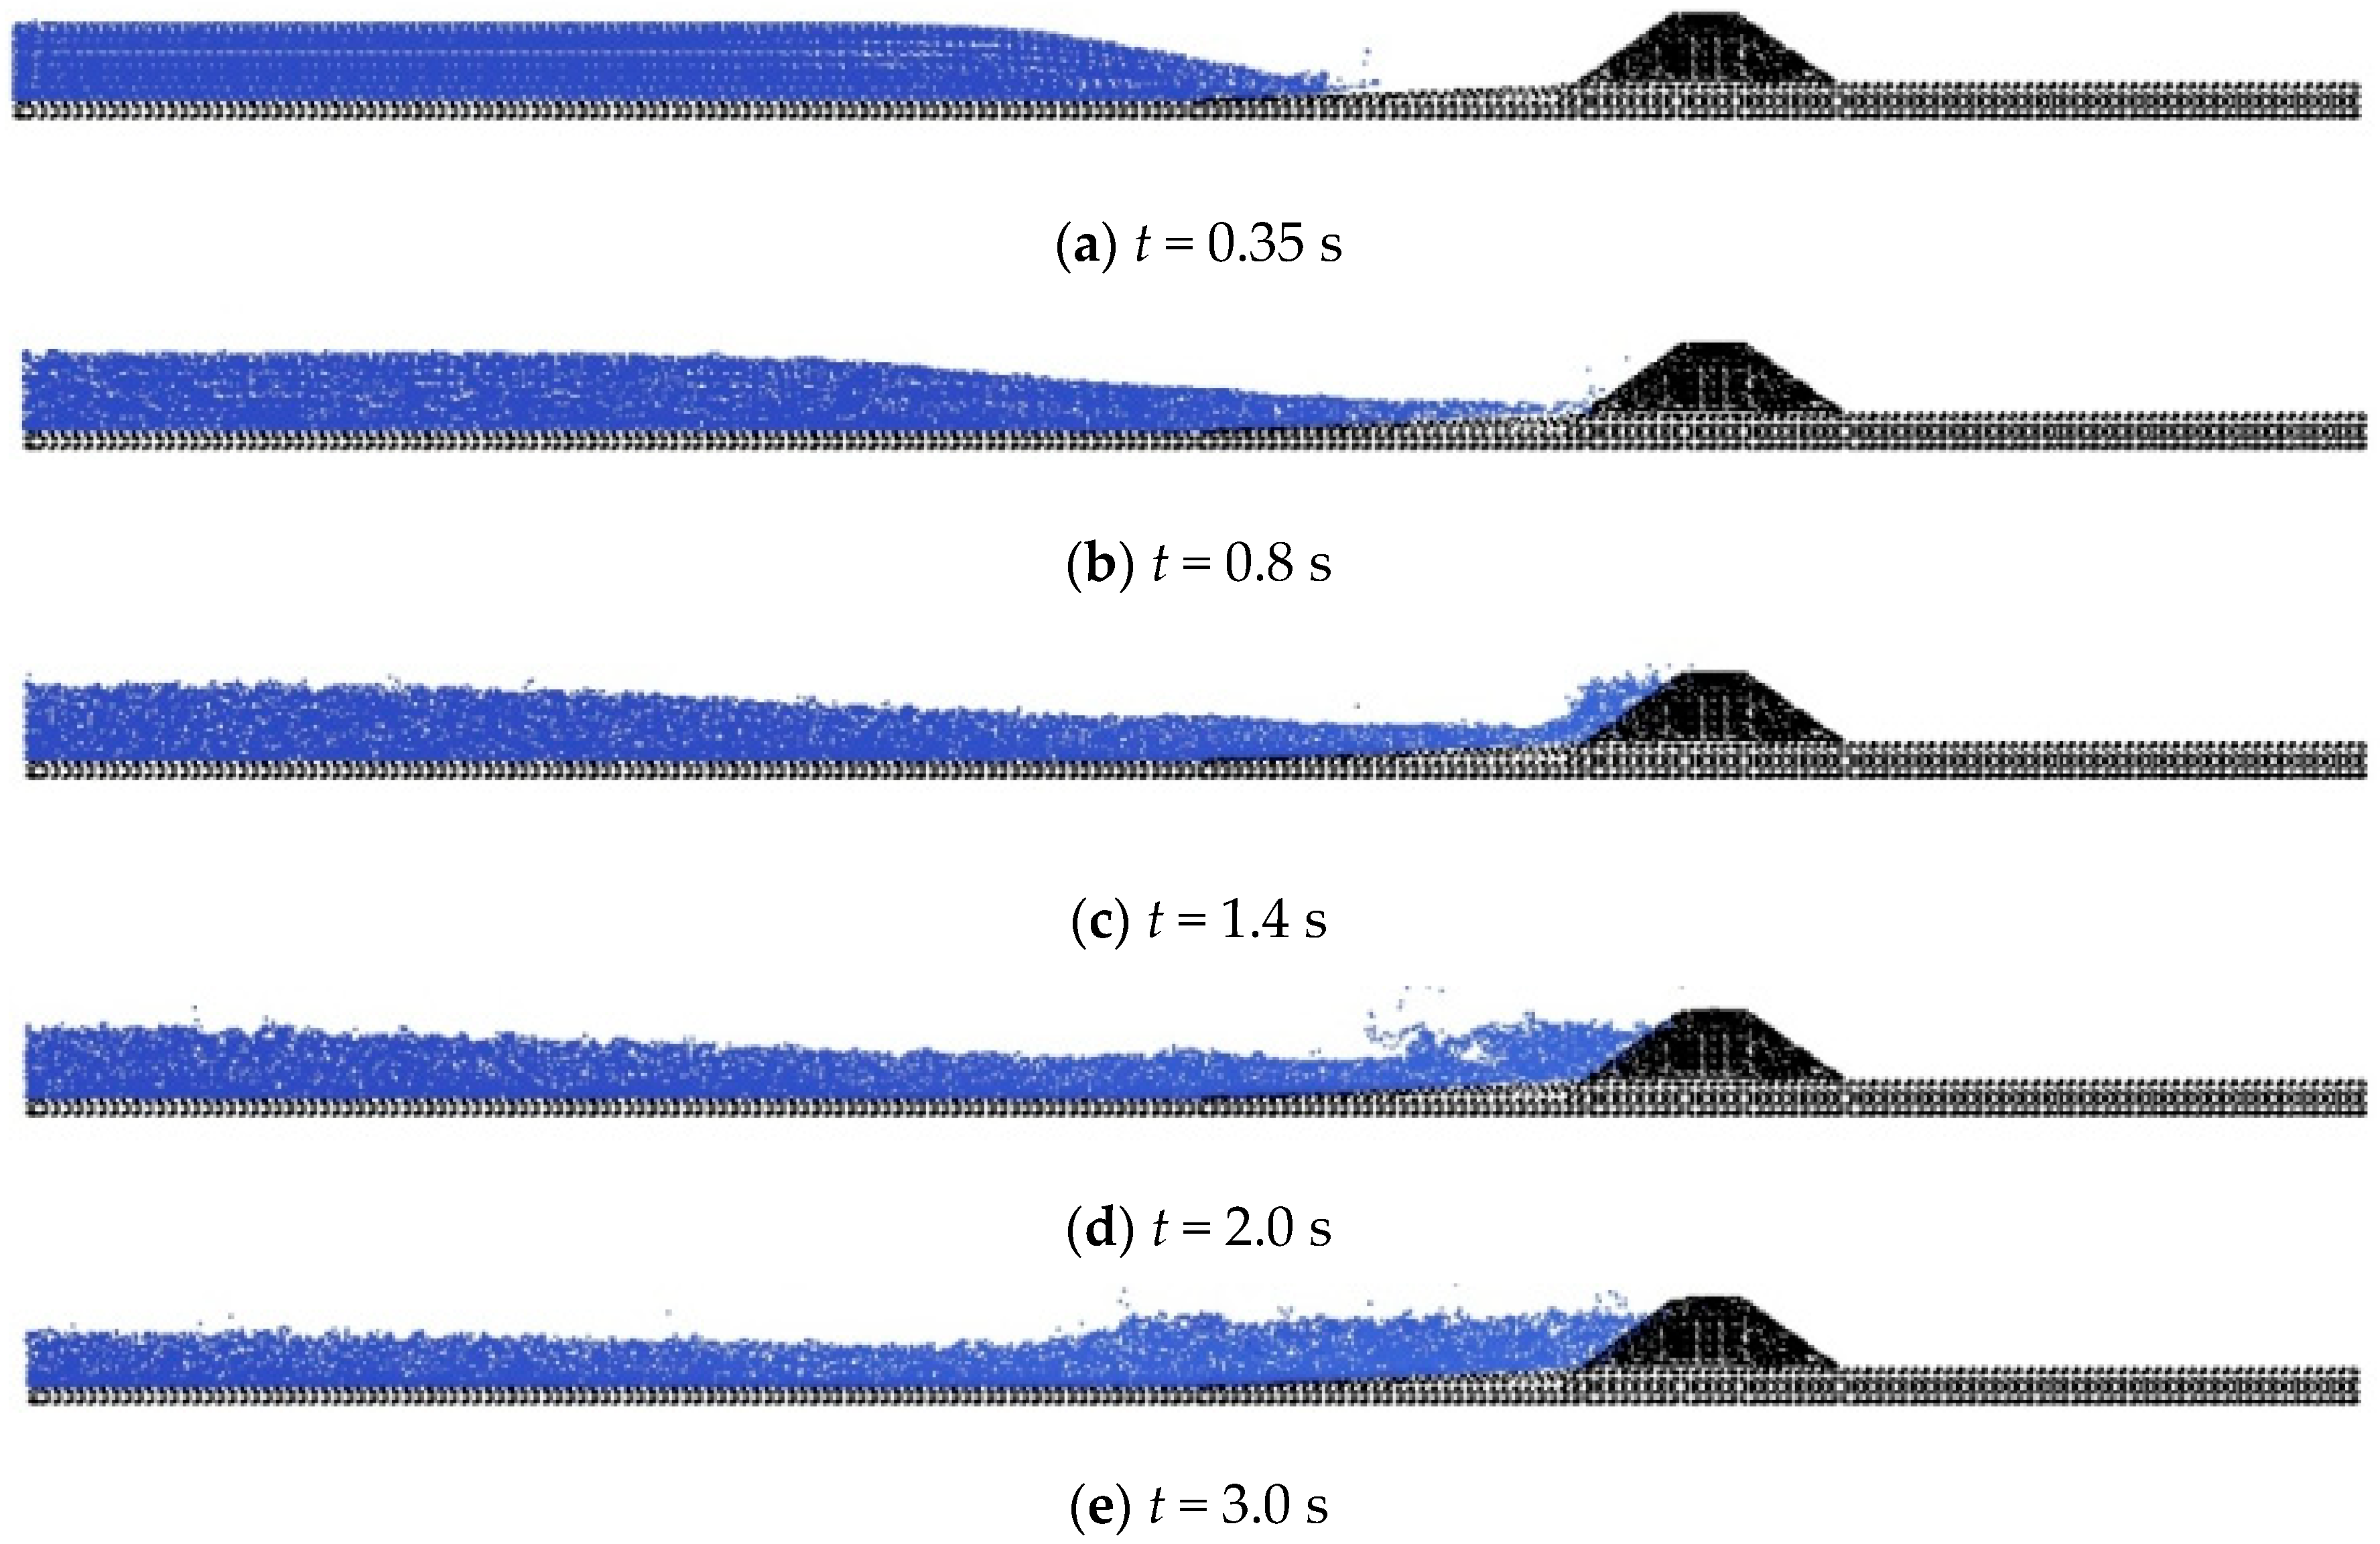
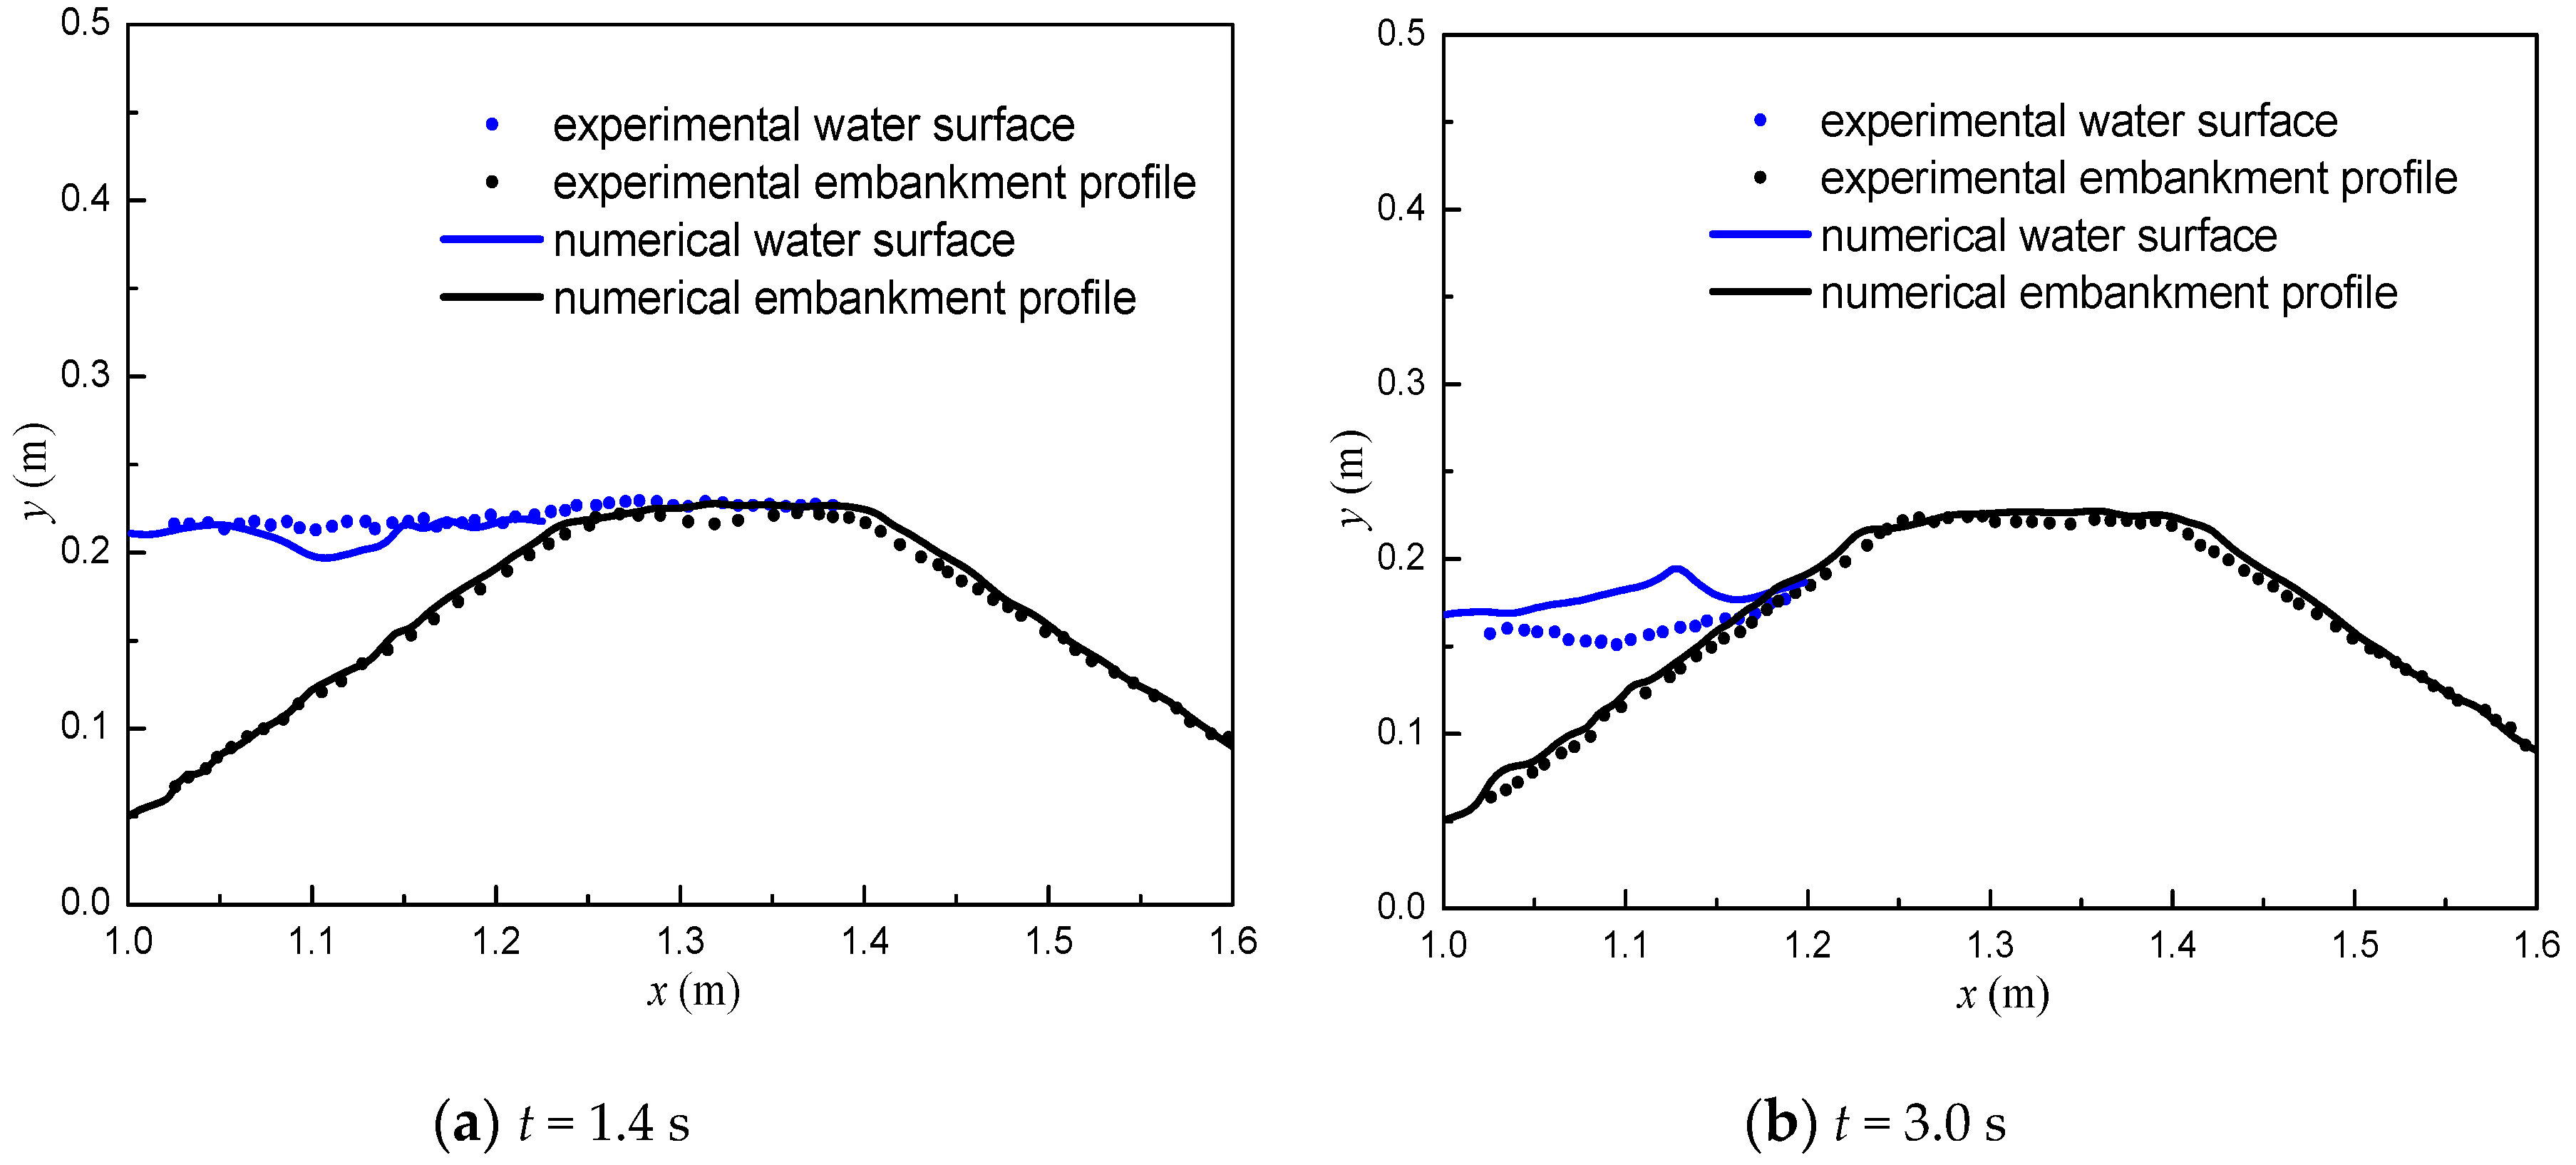
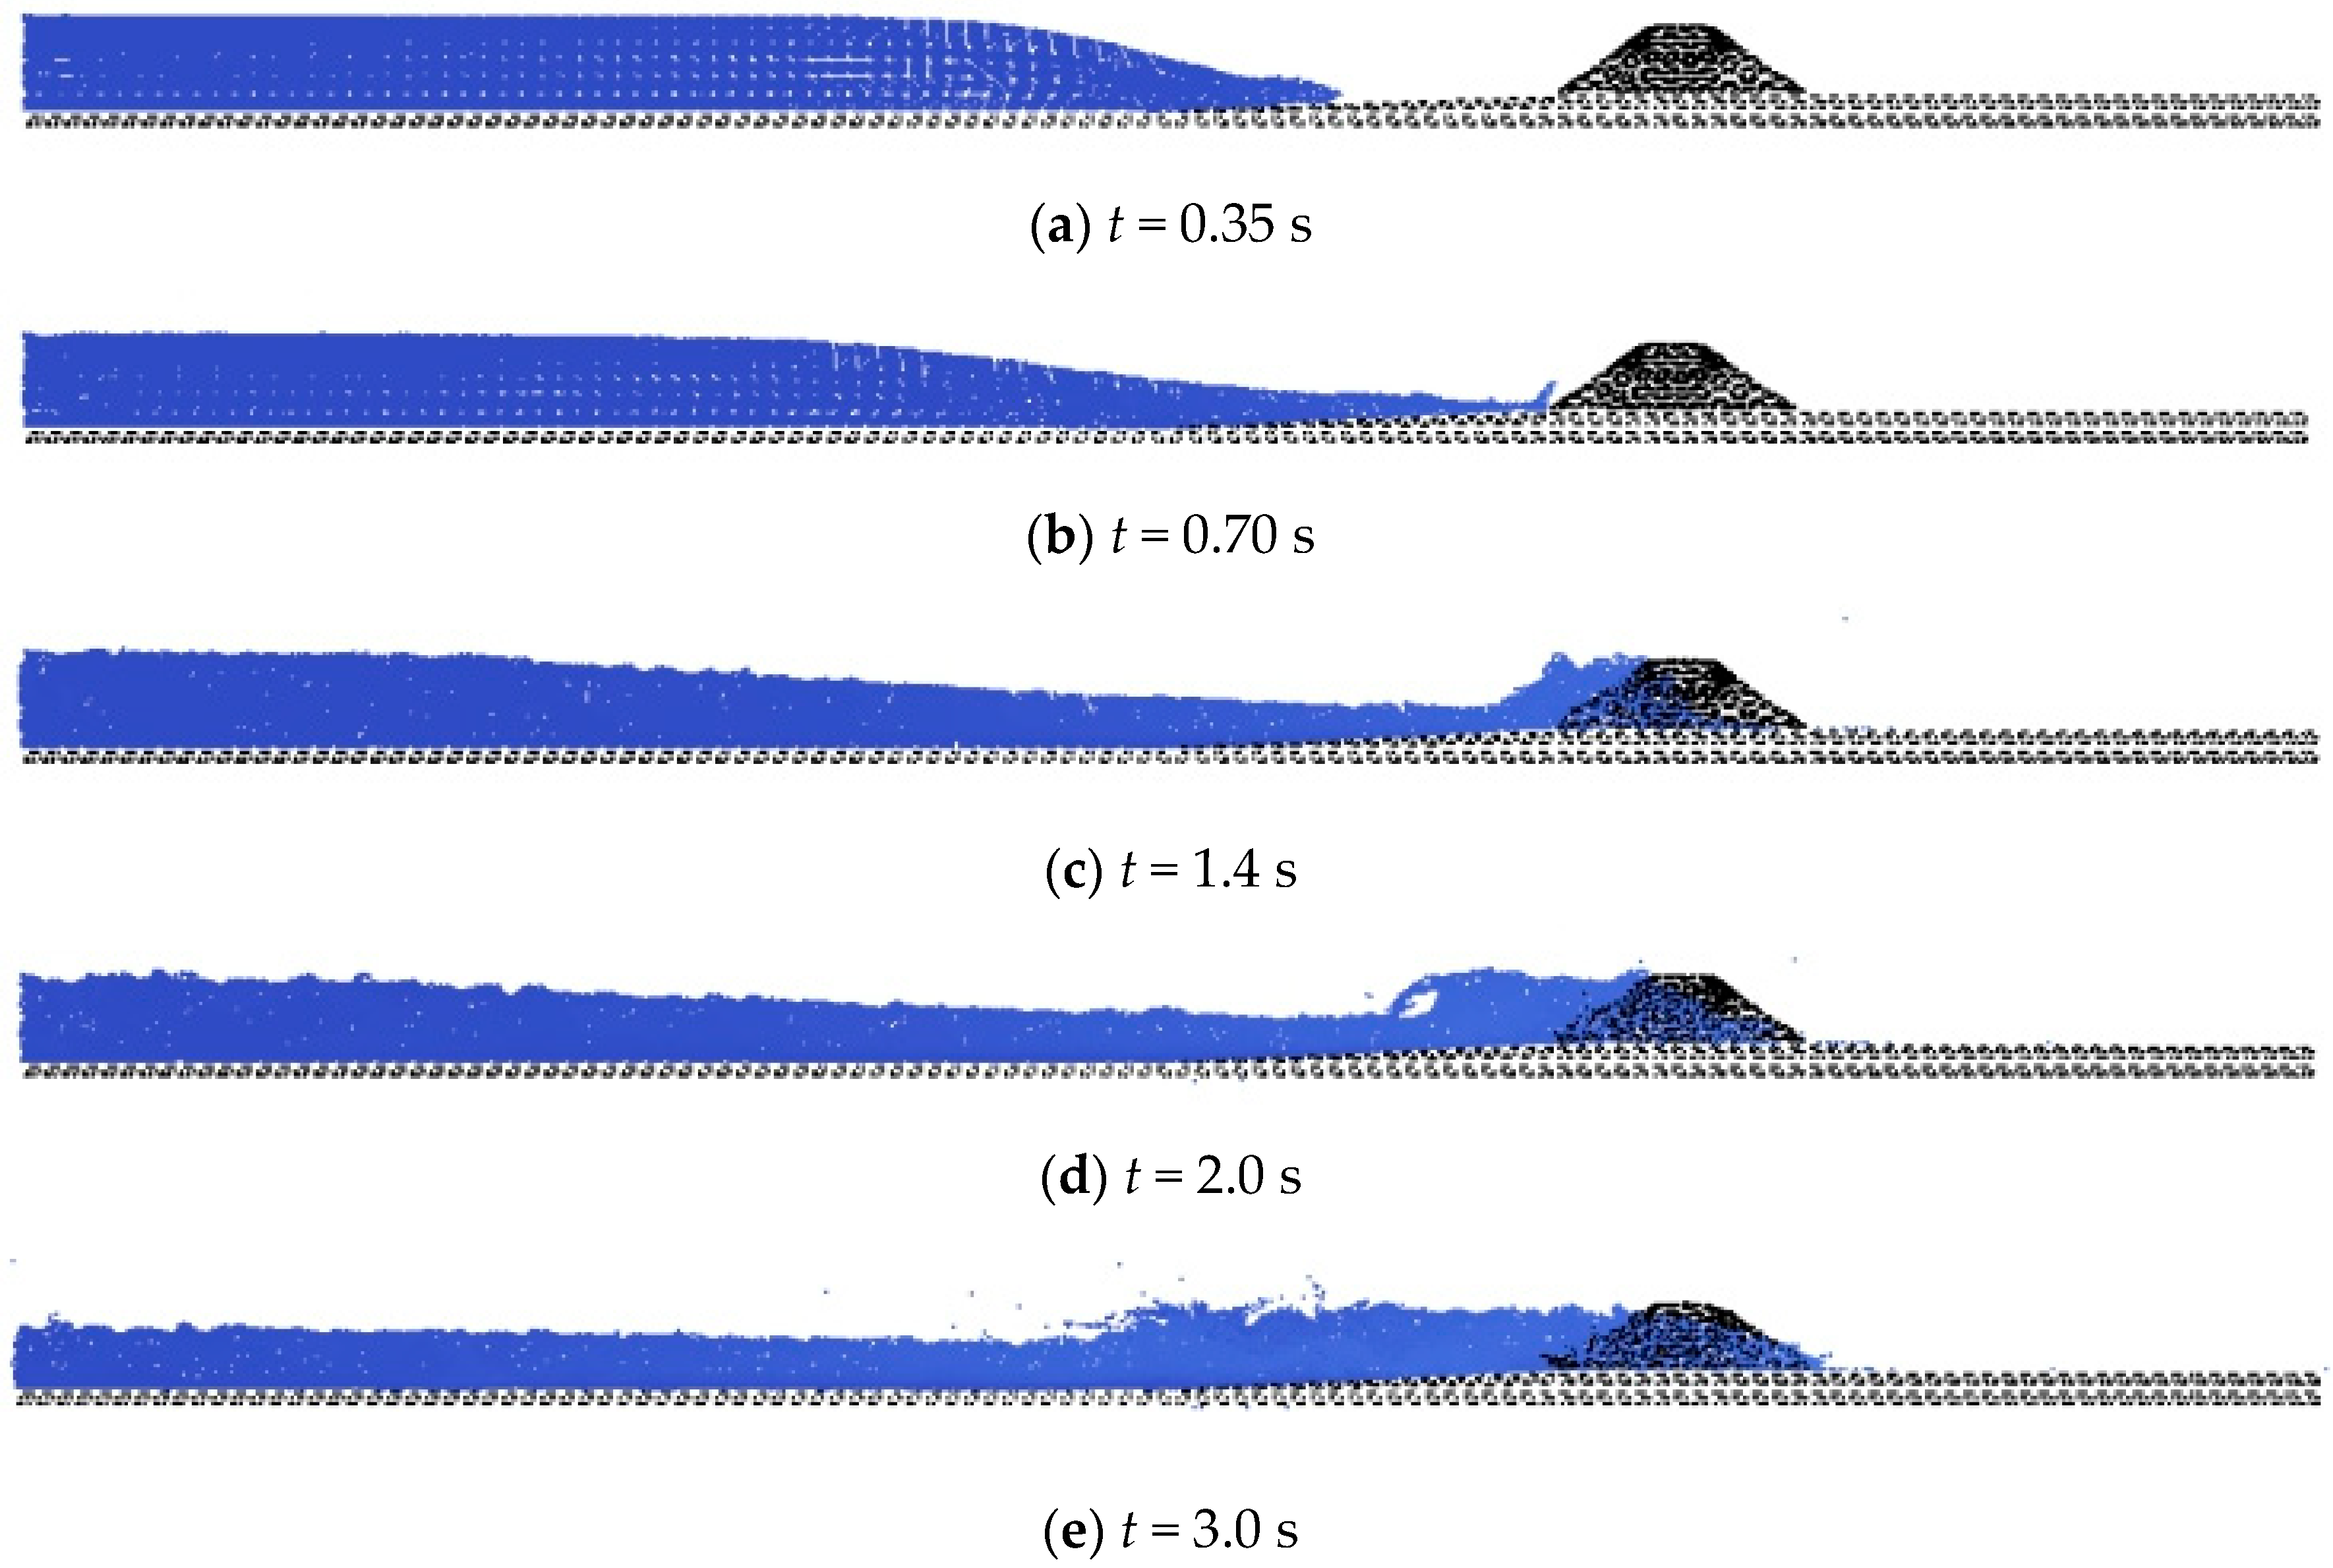
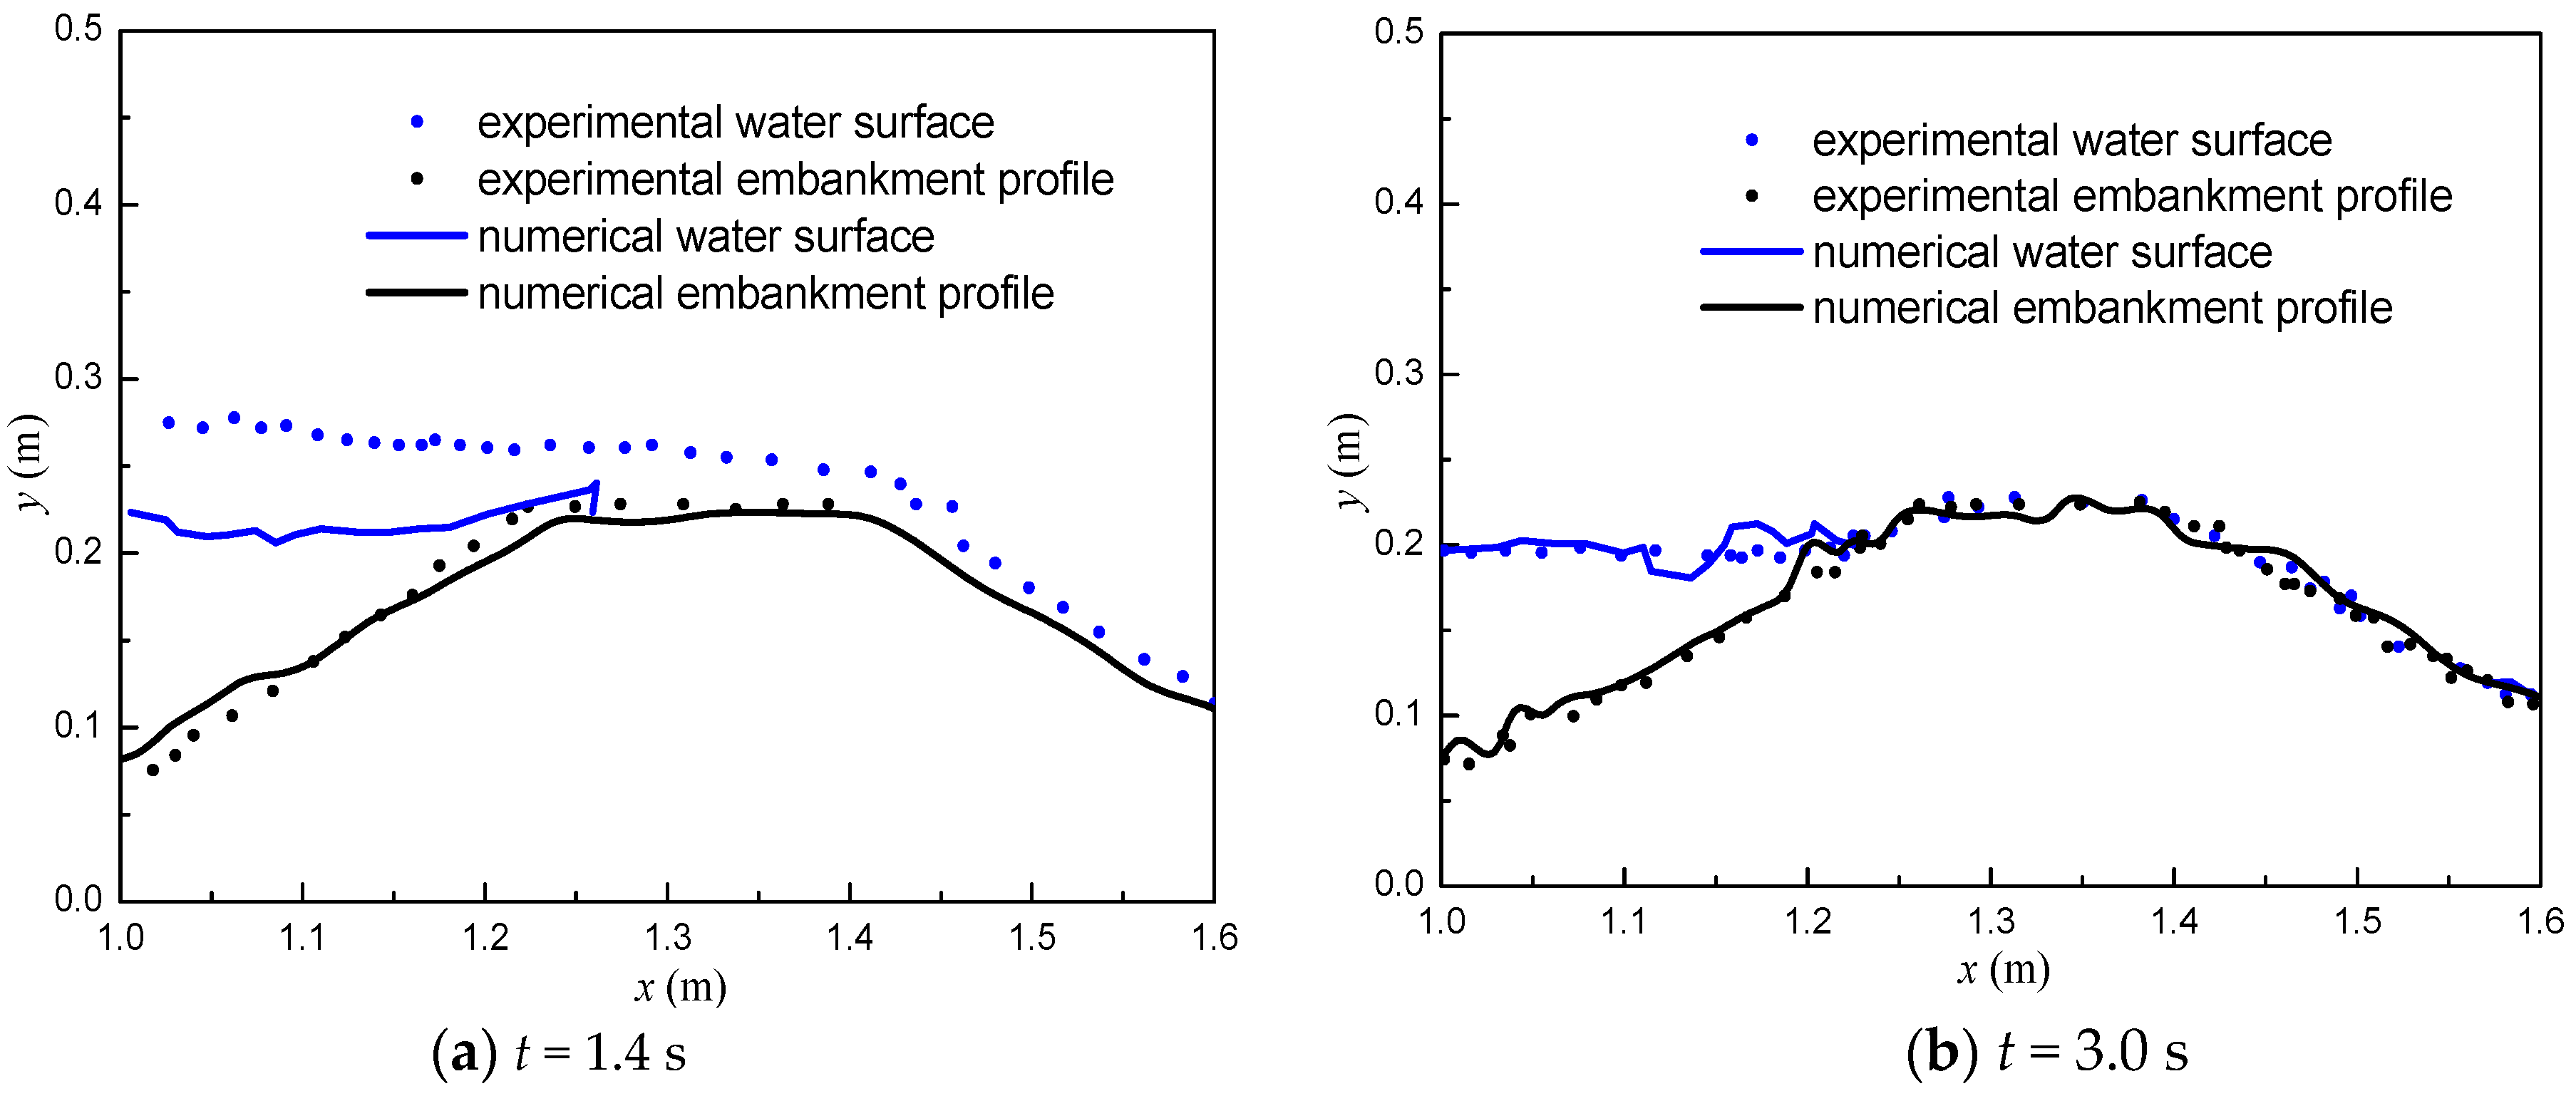
For the first case (H = 0.2 m), Figure 7 shows several snapshots of the simulated water surface and the embankment profiles along the channel at different times of 0.35, 0.8, 1.4, 2.0, and 3.0 s. Comparisons between the numerically simulated results and the experimental ones [12] are illustrated in Figure 8. Specifically, the embankment (black color) profiles and the water surface (blue color) at times 1.4 and 3.0 s, respectively, after the gate removal are plotted: Solid lines represent the numerical results and dotted lines indicate the experimental ones. In this case, the initial water level in the water tank was almost equal to the top elevation of embankment, thus the gate opening–induced dam break flow did not have enough energy to overtop the dike embankment, and therefore, it induced erosion only on the upstream slope of the embankment.
For the second case (H = 0.25 m), Figure 9 shows several snapshots of the simulated water surface and the embankment profiles along the channel at different times of 0.35, 0.8, 1.4, 2.0, and 3.0 s. Comparisons between the numerically simulated results and the experimental ones [12] are illustrated in Figure 10. Specifically, the embankment (black color) profiles and the water surface (blue color) at times 1.4 and 3.0 s, respectively, after the gate removal are plotted: Solid lines represent the numerical results and dotted lines indicate the experimental ones. In this case, the initial water level in tank was higher than the top elevation of embankment, thus the gate opening–induced dam breaking flow overtopped the embankment and eroded it along its entire profile. The upstream slope erosion was more prominent due to the higher potential energy of the dam breaking flow. This dam breaking flow also reached the crest of the embankment this time, progressively eroding it as it passed.
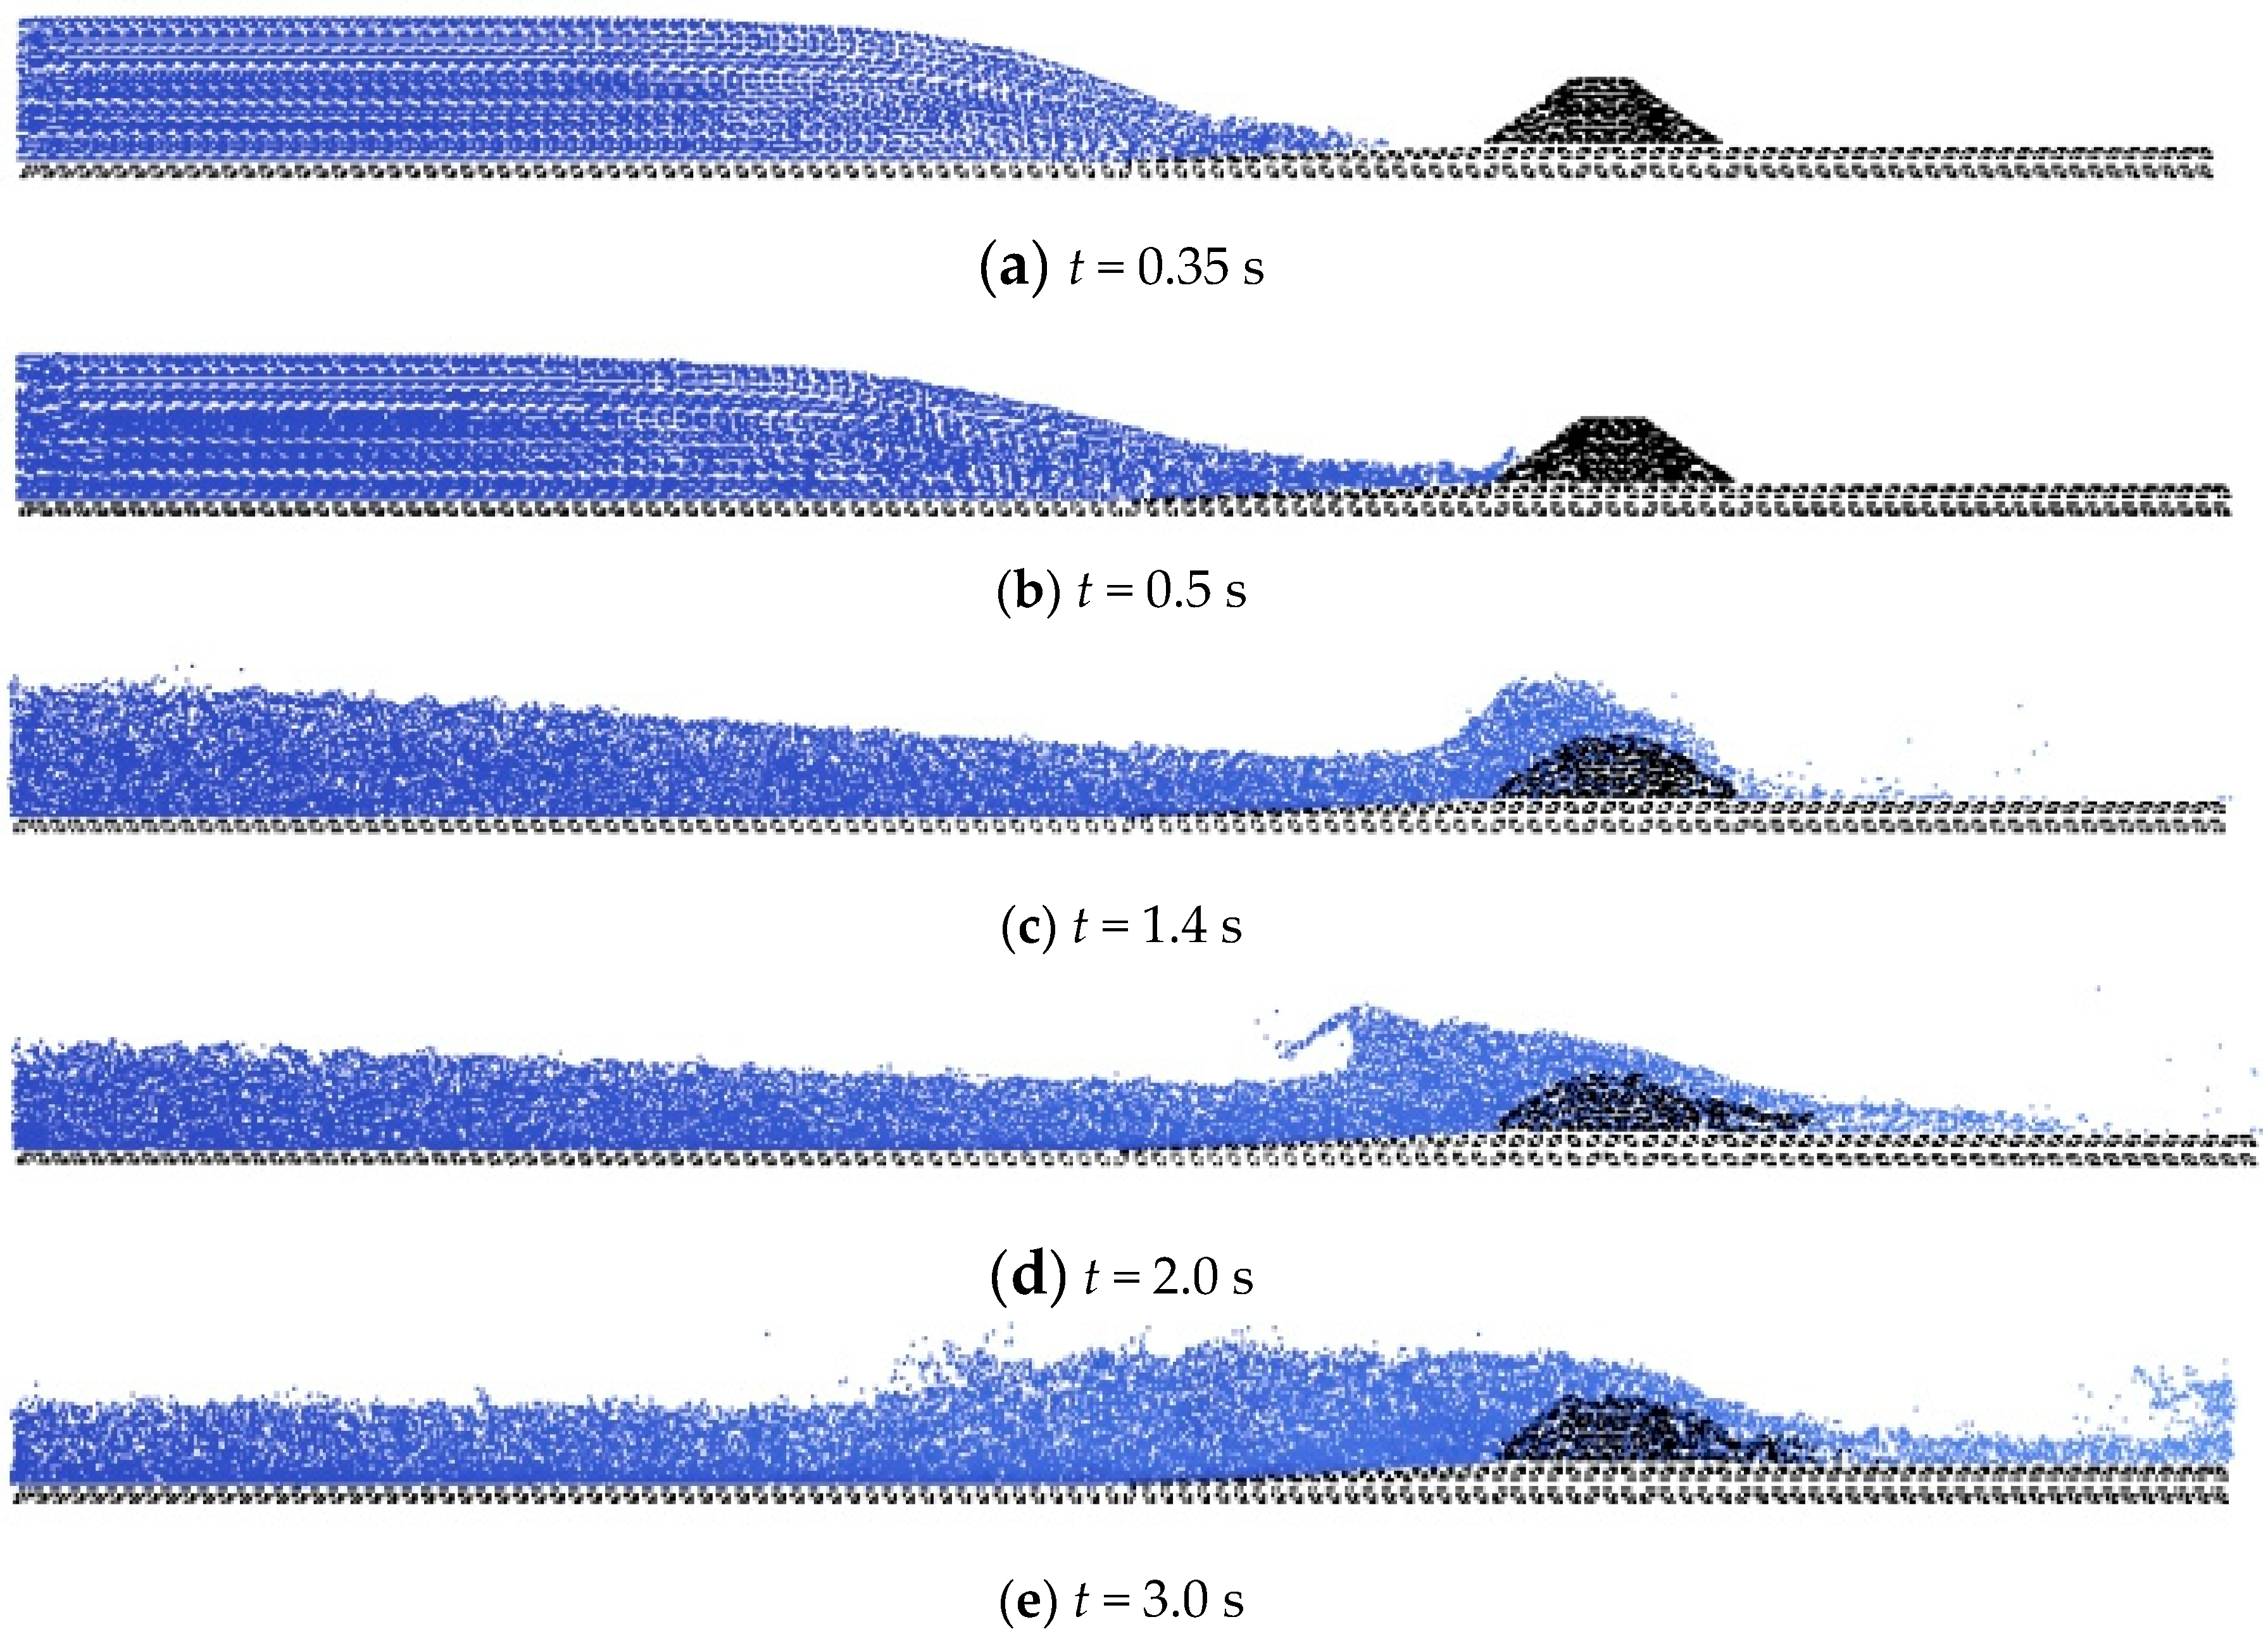
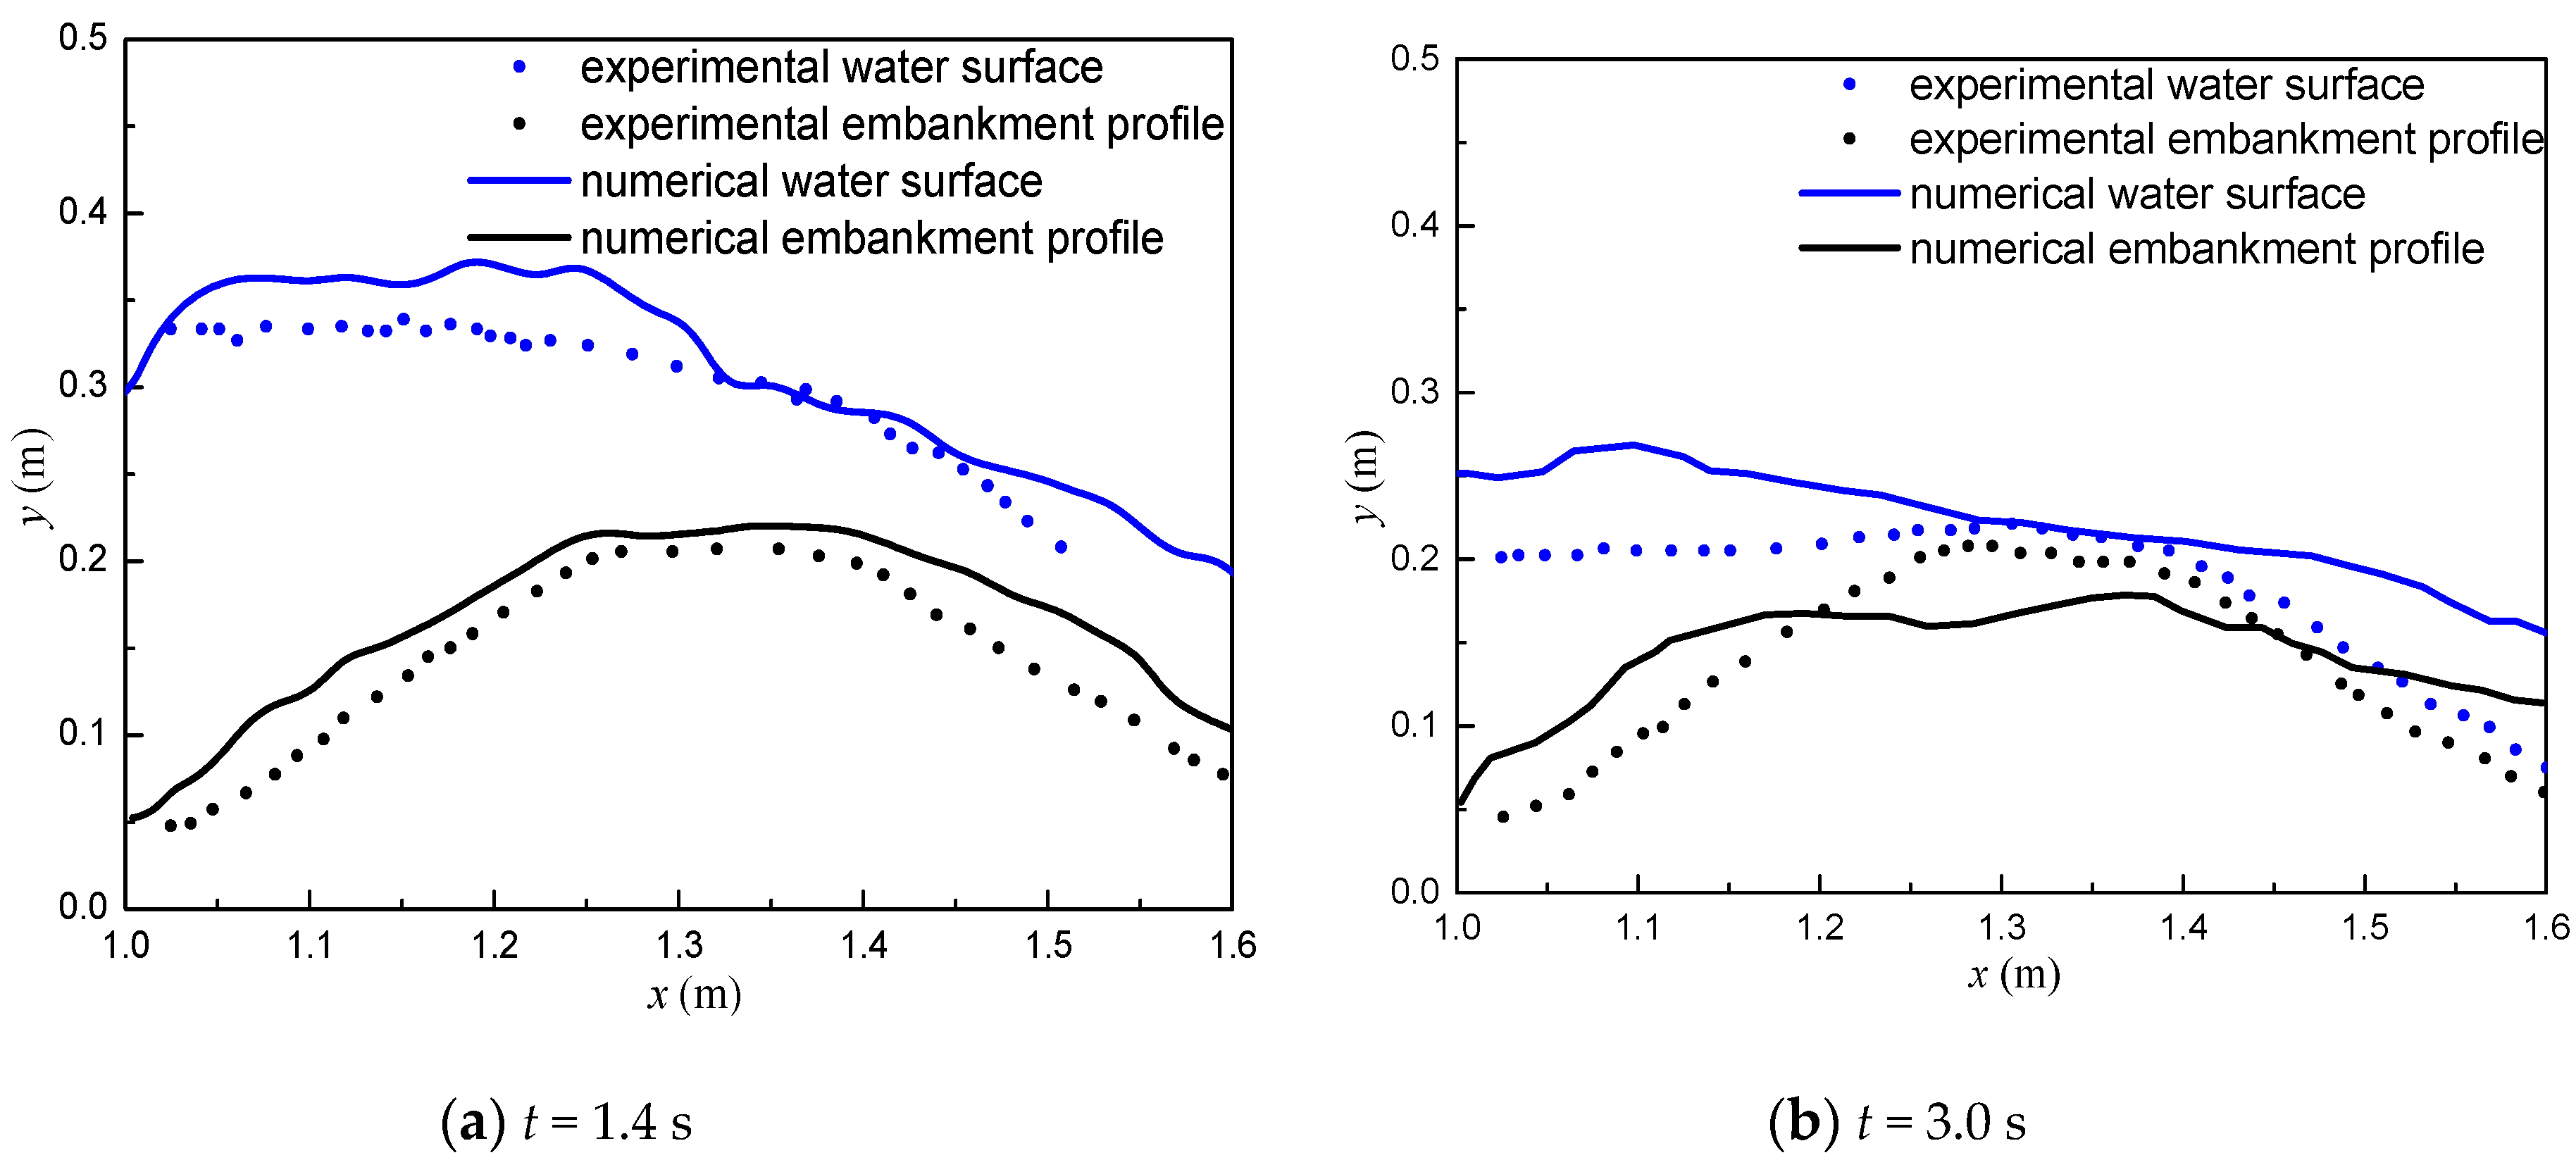
For the third case (H = 0.395 m), Figure 11 shows several snapshots of the simulated water surface and the embankment profiles along the channel at different times of 0.35, 0.8, 1.4, 2.0, and 3.0 s. Comparisons between the numerically simulated results and the experimental ones [12] are illustrated in Figure 12. Specifically, the embankment (black color) profiles and the water surface (blue color) at times 1.4 and 3.0 s, respectively, after the gate removal are plotted: Solid lines represent the numerical results and dotted lines indicate the experimental ones. In this case, the potential energy of the gate opening induced dam break flow was about two times that in the previous case, thus leading to more prominent erosion in the embankment. The erosion was quite homogeneous along the entire profile, and the embankment profile shape was rounded during the process. During the process, steep portions of the embankment slopes underwent a combination of surface erosion and sliding failures due to the loss of supporting material.
In general, the erosion process of the embankment was greatly affected by the upstream water level elevation. The higher the initial water level, the more serious was the rate of damage of the embankment. By analyzing the embankment erosion process at low, medium, and high water levels, it can be seen that when the water level is low or medium (H = 0.2, 0.25 m), the water flow coming to the embankment takes a long time, and the erosion is mainly concentrated on the upstream slope surface. When the water level is high (H = 0.395 m), the water flow has a larger energy and rises rapidly along the embankment and overtops the crest to the downstream. Under the erosion and seepage of the water flow, the entire embankment is damaged seriously. Overall, the numerical simulation can relatively reproduce the overtopping erosion phenomenon, which validates the capacity of the proposed double-point MPM to model the overtopping failure of the homogeneous embankments with considering free water surface flow, water–soil interaction, and seepage effects.
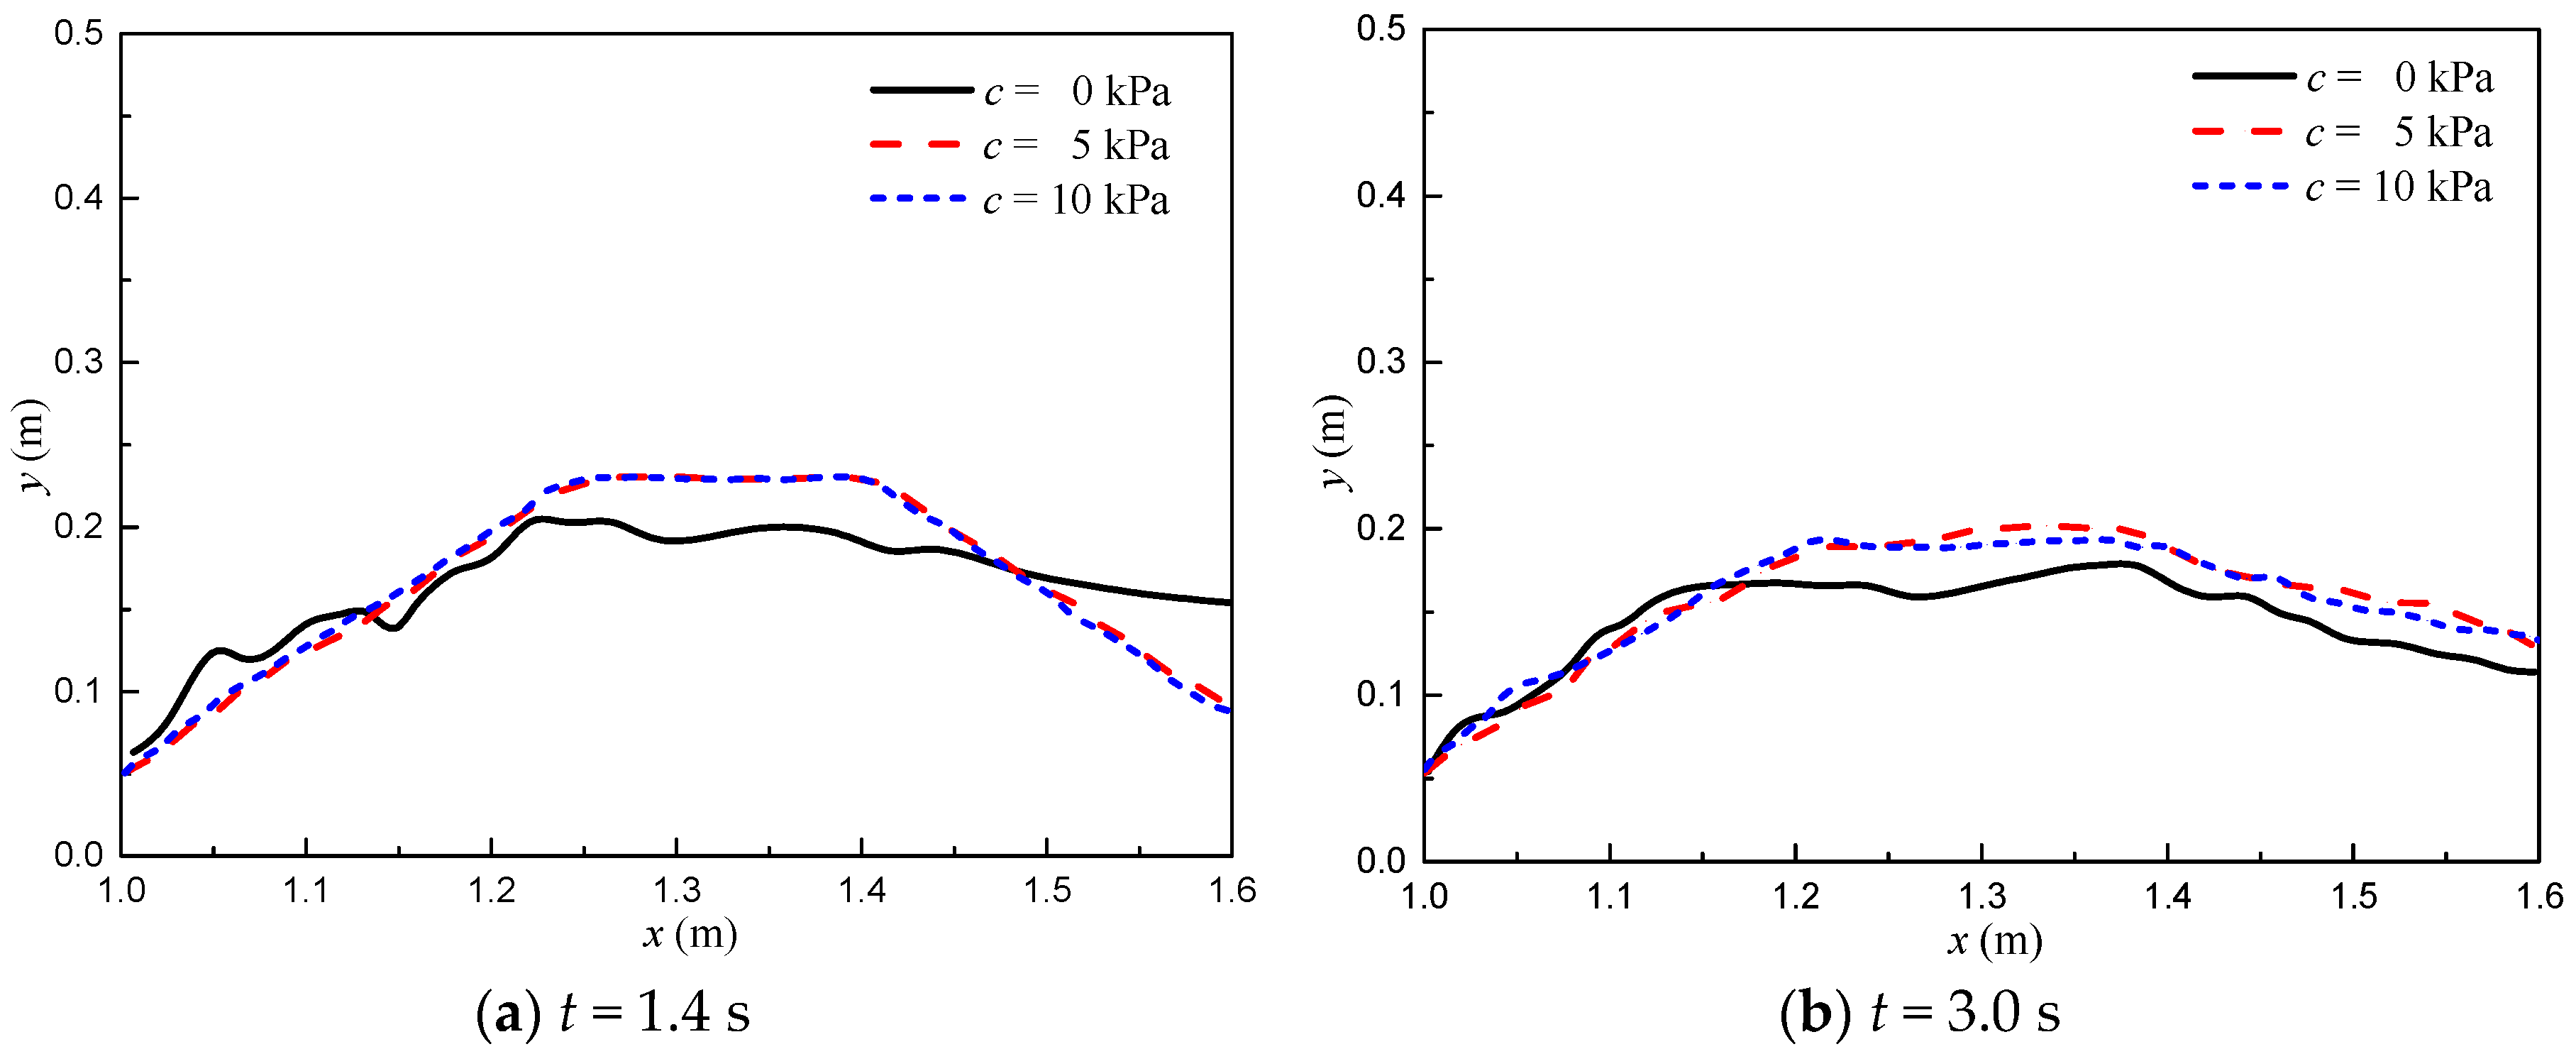
In the previous simulation, the homogeneous embankments were considered as non-cohesive. However, we must remember that many embankments were built from cohesive materials, which behave quite differently than non-cohesive materials. In order to study the effect of cohesion on the embankment erosion process, the previous third case (H = 0.395 m) was selected, the simulations were conducted with three cohesions of c = 0, 5, and 10 kPa, the other conditions remained unchanged. Simulated results are shown in Figure 13, the erosion rate of the upstream and downstream slopes was more serious when c = 0 kPa. However, when c = 5 and 10 kPa, the rate of embankment erosion was very small and almost negligible. It can be seen that the increase of soil cohesion can effectively improve the resistance. As the cohesion increases, the erosion caused by the water flow is weakened, but when increased to a certain extent, the effect is weakened.
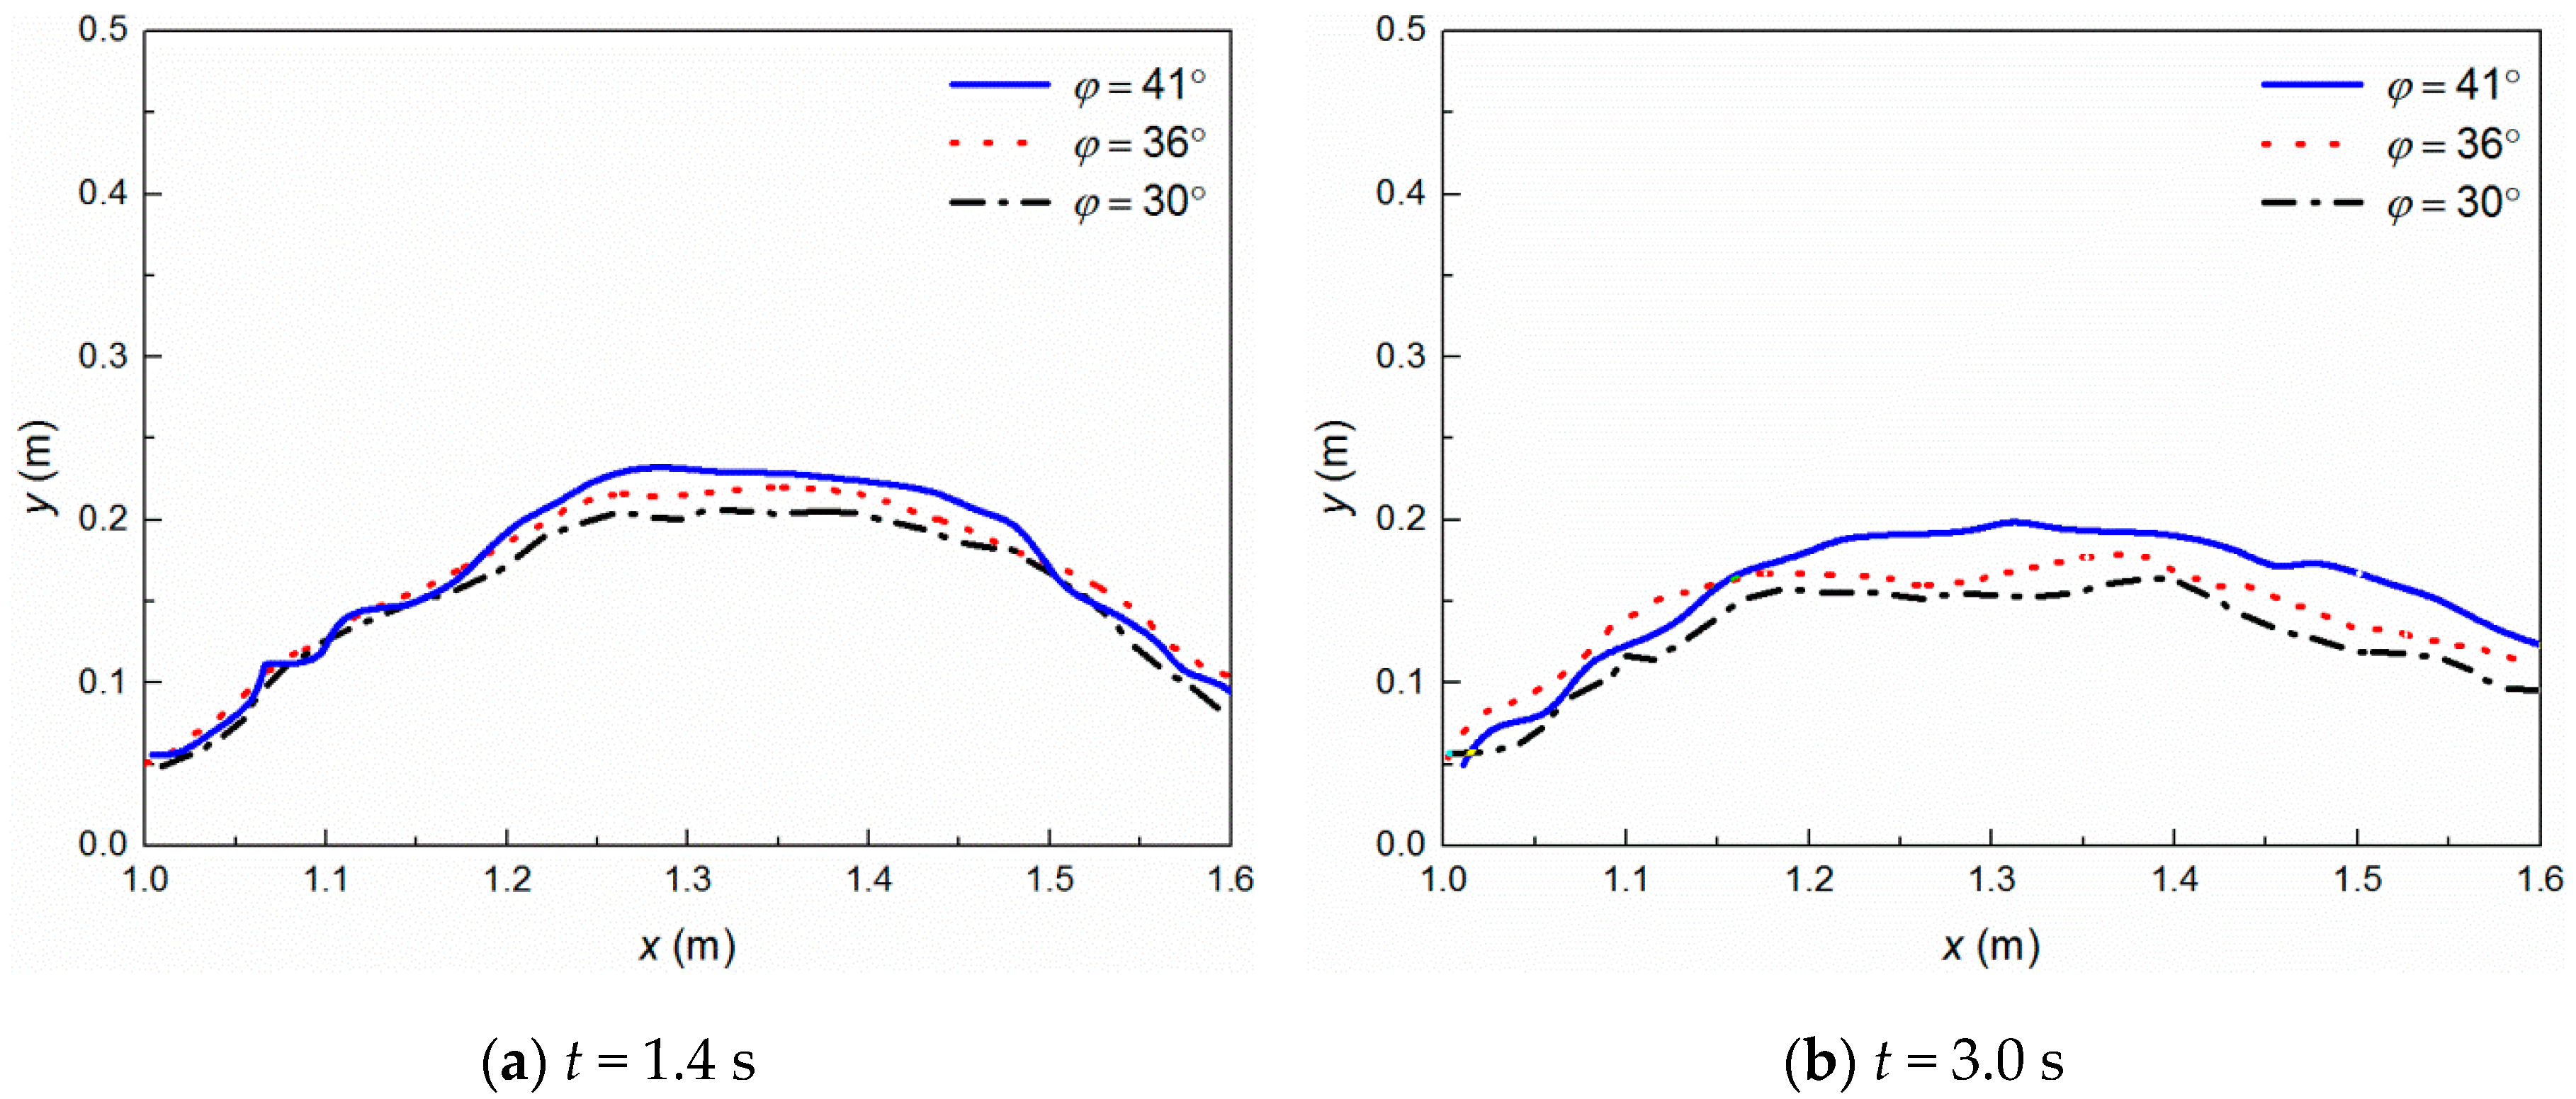
The effect of the internal fiction angle on the embankment erosion process was also investigated. Three different internal fiction angles ( = 30°, 36°, 41°) were used in the case of the initial water level H = 0.395 m, and the other parameters were the same as in the previous simulations. The calculated embankment profiles for different internal fiction angles at t = 1.4 s and t = 3.0 s are shown in Figure 14. Results show that the larger the internal friction angle is, the weaker the erosion will be. It is the internal friction angle that influences the contact between soil particles. For the small internal friction angle, it has weak resistance to overtopping flow, whereas a large friction angle can retard the flow.
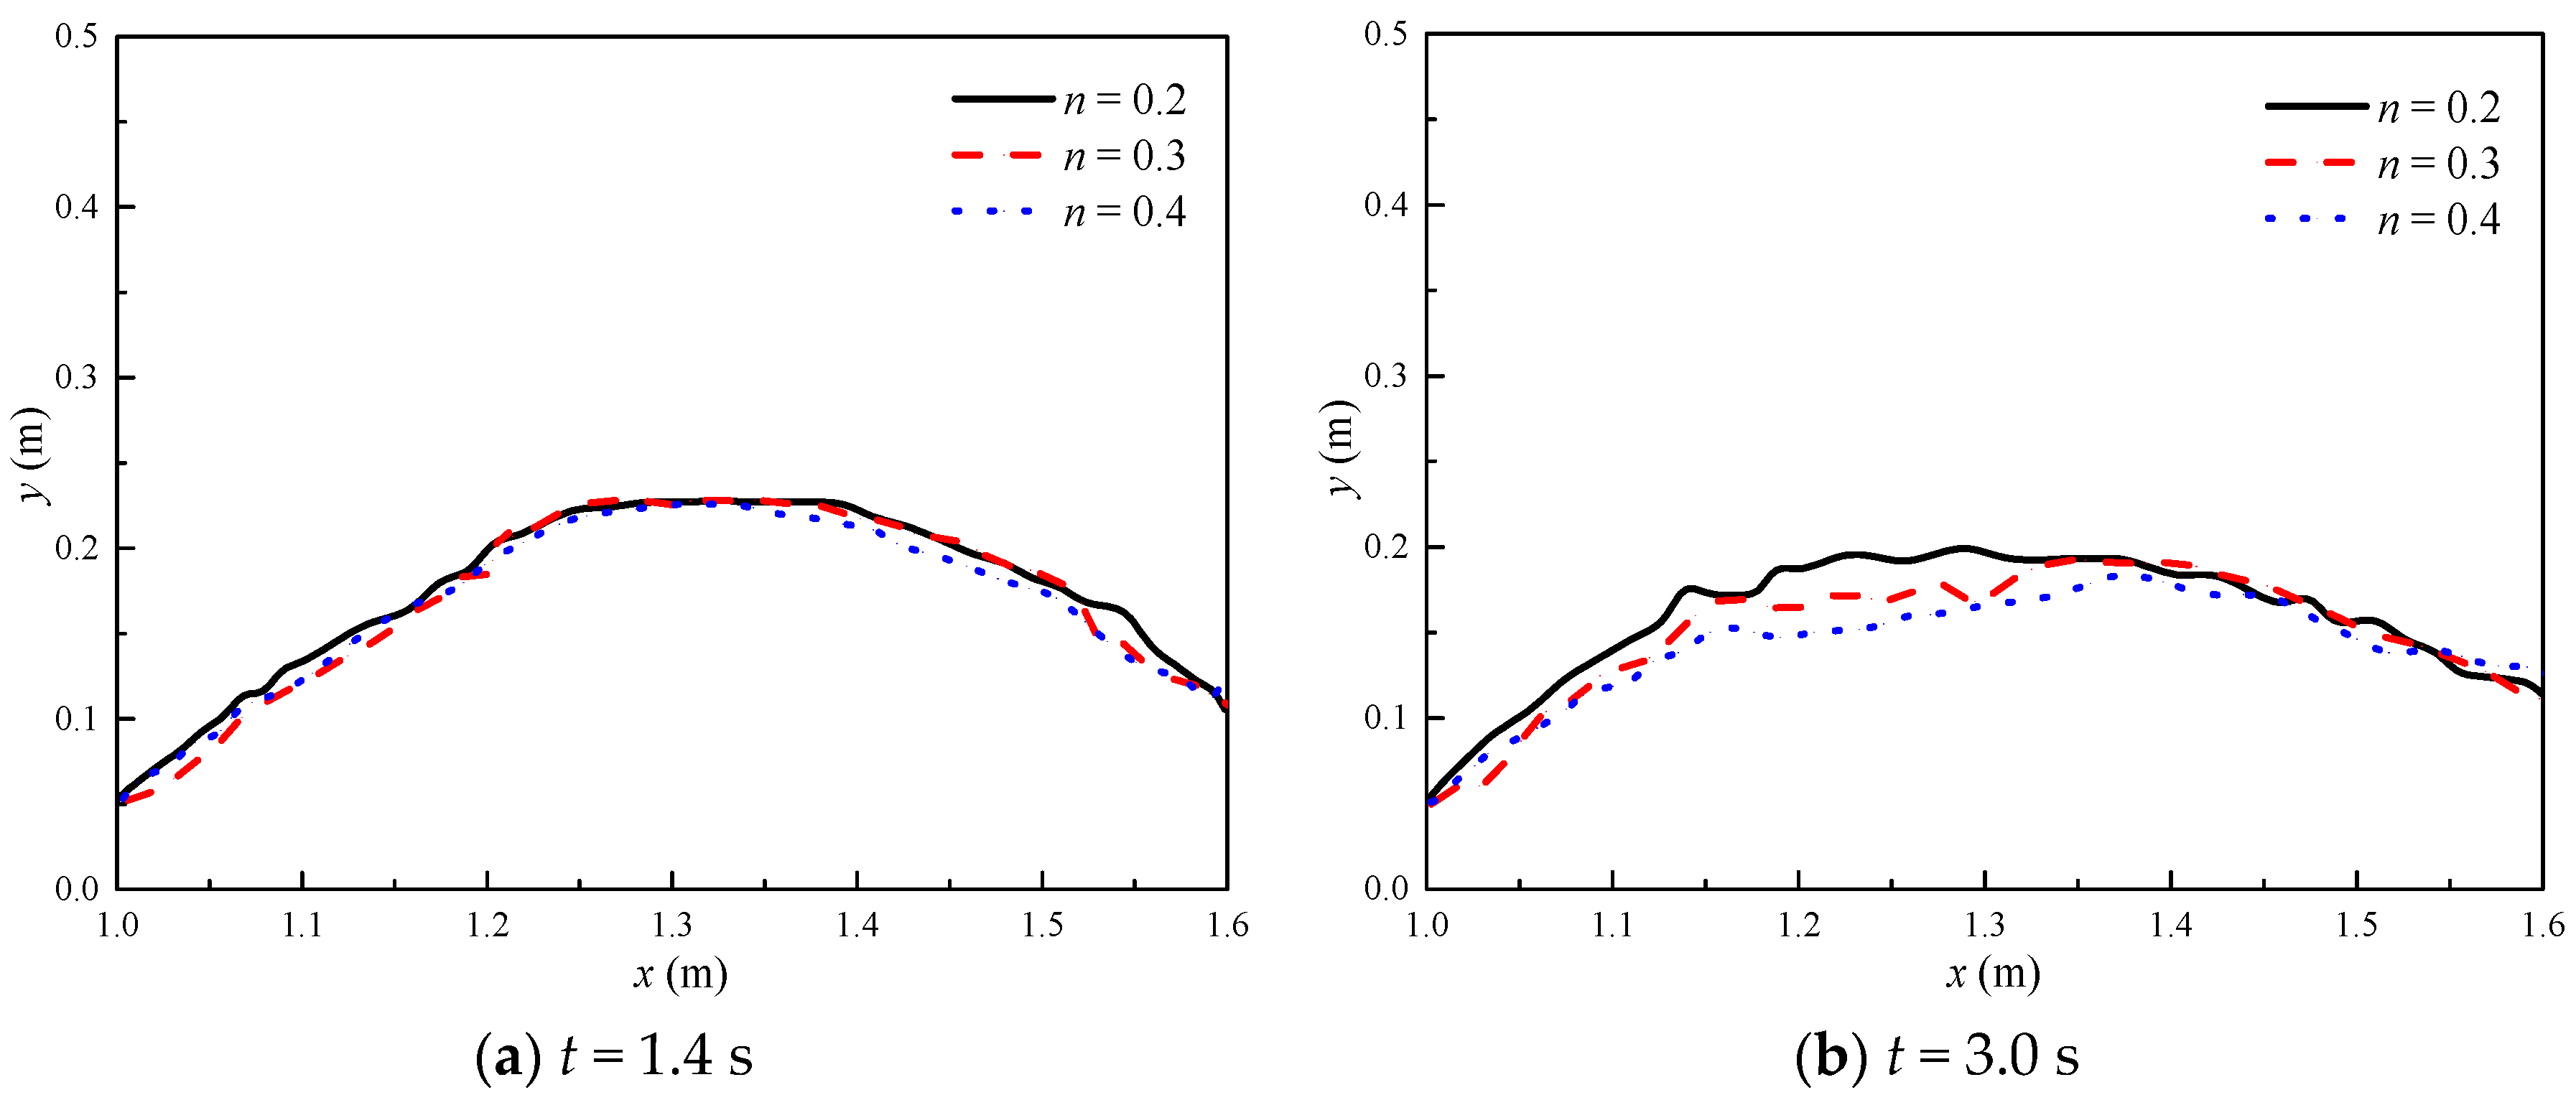
In order to investigate the effect of the initial porosity on the embankment erosion process, three different initial porosities (n = 0.2, 0.3, 0.4) were selected to model in the case of the initial water level H = 0.395 m, and the other parameters were also the same as in the previous simulations. The calculated embankment profiles for different porosities at t = 1.4 s and t = 3.0 s are shown in Figure 15. It can be seen that in the early stage (t = 1.4 s) of the embankment failure, the erosion was not very obvious, only surface erosion caused by the water flow occurred and there was no infiltration. However, the profiles of the embankments at t = 3.0 s were different. The larger the porosity of the soil, the more obvious the embankment erosion. It indicates that the water flows began to infiltrate into the embankment in the middle stage, and the embankment erosion was induced by the water flow and seepage, and the seepage failure mainly occurred in the middle and later stages. With the gradual infiltration of the water flow, the water flow infiltrated completely in the later stage, and the pores of the soil were filled with water, the soil became saturated. When the effective stress of the soil skeletons is 0, the soil may be liquefied and moved with the water flow. Hence, decreasing the porosity of the soil can slow down the infiltration rate and reduce the damage of the embankments.
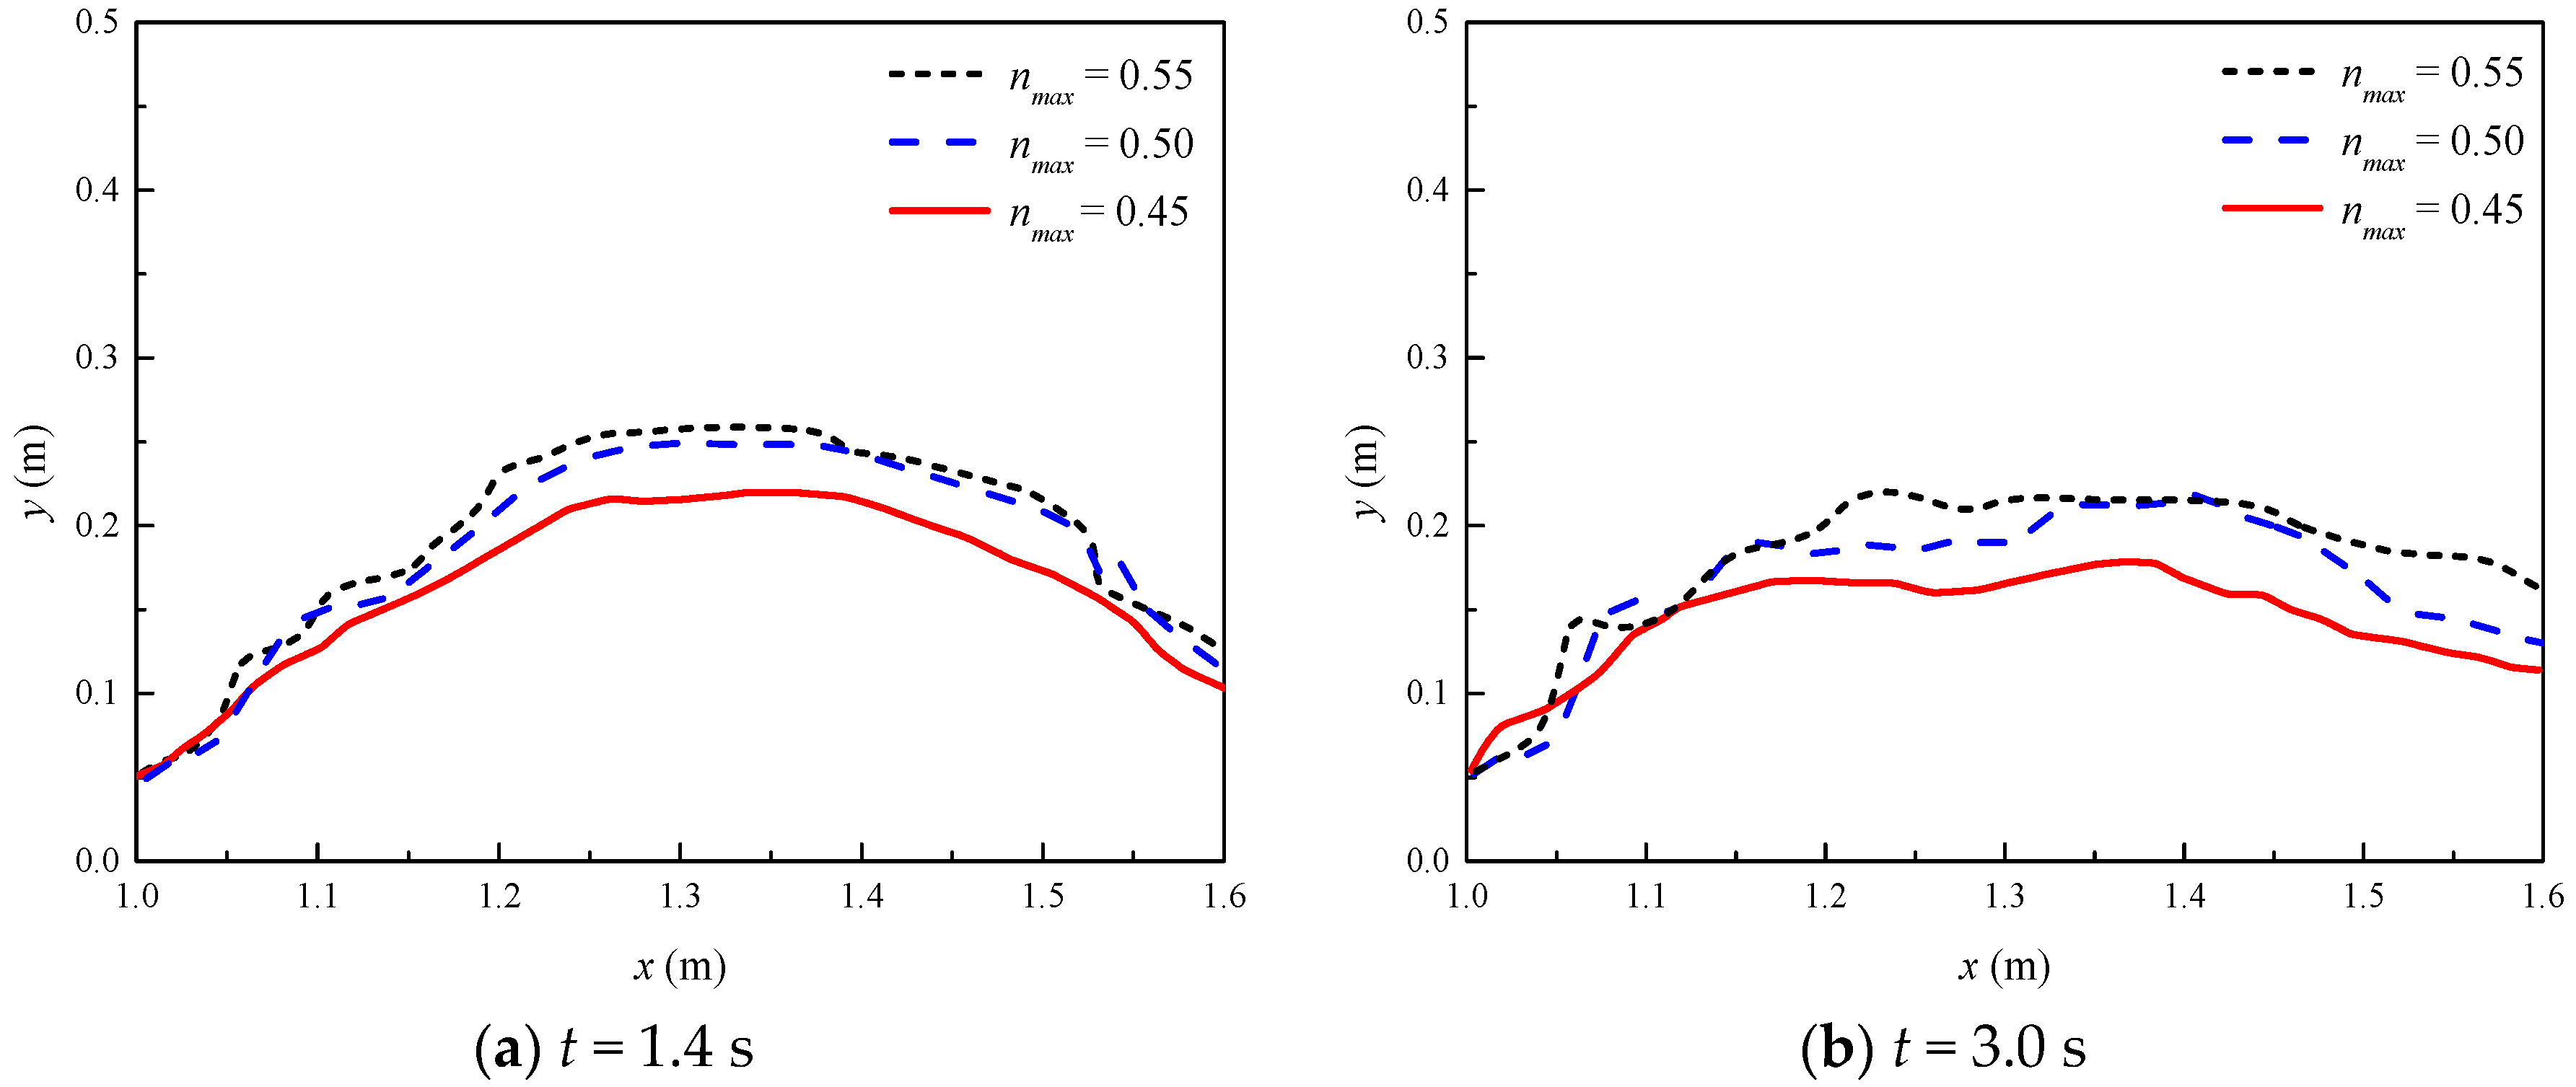
In the proposed double-point two-phase MPM, a pre-given maximum porosity nmax was used to distinguish the saturated soils as a solid-like or liquid-like state. When the porosity was larger than nmax, fluidization occurred. The grains are not in contact and float together with the liquid phase. Here, three cases of different porosities (nmax = 0.45, 0.50, 0.55) were conducted to study the effect of maximum porosity on the embankment erosion process, and the other conditions were the same as in the previous simulations. The calculated embankment profiles for different cases at t = 1.4 s and t = 3.0 s are shown in Figure 16. Results show that the maximum porosity plays an important role on the dam failure due to overtopping flow. The larger the maximum porosity is, the more difficult it is for soil particles to reach the fluidization state. Hence, it is very important to get the right maximum porosity in the simulations, and more accurate simulation results can only be obtained with the appropriate value.
4. Conclusions
In this paper, a double-point two-phase material point method was employed to model problems involving free water surface flow, large deformations, and water–soil interaction. The proposed method was first validated by the example of the flow through a porous block problem. Then a numerical investigation of failure process in homogeneous embankments due to overtopping flow was performed. By comparing the water flow and embankments profiles with the experimental data, it was shown that the current double-point two-phase MPM can predict the overtopping flow pattern and the development of embankment erosion with good accuracy, and the higher the initial water level, the more obviously and faster the embankment is eroded. Furthermore, the effects of the cohesion, internal fiction angle, initial porosity, and maximum porosity of soil on the embankment failure were investigated. The results show that these parameters have important influence on the erosion process. With the increase of the cohesion, the resistance of the embankment can be improved to a certain extent, but the effect of the cohesion is gradually weakened. The larger the internal friction angle is, the weaker the erosion will be. In addition, the larger the initial porosity of the soil, the more obvious the embankment erosion. The larger the maximum porosity is, the more difficult it is for soil particles to reach the fluidization state. These investigated results indicate that the double-point two-phase MPM is capable of predicting and reproducing the failure process of embankments due to the overtopping flow. The proposed method is an alternative promising tool for investigating complex failure mechanism in water–soil interaction.
Author Contributions
Y.-S.Y. and T.-T.Y. conducted the numerical computations and data analysis; Y.-S.Y. and L.-C.Q. drafted the manuscript; Y.H. did the proof reading and editing. All authors contributed to the work.
Funding
This research was funded by the National Key R & D Program of China (No. 2018YFC0406604) and the National Natural Science Foundation of China (No. 11772351).
Acknowledgments
The authors would like to acknowledge Anura3D MPM Research Community for providing the external version of the software Anura3D_v2016.
Conflicts of Interest
The authors declare no conflict of interest.
References
- Confalonieri, U.B.; Menne, R.; Akhtar, K.L.; Ebi, M.; Hauengue, R.S.K. Climate Change 2007: Impacts, Adaptation and Vulnerability; Contribution of Working Group II to the Fourth Assessment Report of the Intergovernmental Panel on Climate Change; Parry, M.L., Canziani, O.F., Palutikof, J.P., van der Linden, P.J., Hanson, C.E., Eds.; Cambridge University Press: Cambridge, UK, 2007. [Google Scholar]
- Larese, A.; Rossi, R.; Oñate, E.; Toledo, M.Á.; Morán, R.; Campos, H. Numerical and experimental study of overtopping and failure of rockfill dams. Int. J. Geomech. 2015, 15, 1–23. [Google Scholar] [CrossRef]
- Powledge, G.R.; Ralston, D.C.; Miller, P.; Chen, Y.H.; Clopper, P.E.; Temple, D.M. Mechanics of overflow erosion on embankments. II: Hydraulic and design considerations. J. Hydraul. Eng. 1989, 115, 1056–1075. [Google Scholar] [CrossRef]
- Tingsanchali, T.; Chinnarasri, C. Numerical modeling of dam failure due to overtopping. Hydrol. Sci. J. 2001, 46, 113–130. [Google Scholar] [CrossRef]
- Chinnarasri, C.; Tingsanchali, T.; Weesakul, S.; Wongwises, S. Flow patterns and damage of dike overtopping. Int. J. Sediment Res. 2003, 18, 301–309. [Google Scholar]
- Leopardi, A.; Oliveri, E.; Greco, M. Numerical simulation of gradual earth-dam failure. In Proceedings of the 2nd International Conference New Trends in Water and Environmental Engineering for Safety and Life: Eco-Compatible Solutions for Aquatic Environments, Capri, Italy, 24–28 June 2002. [Google Scholar]
- Pontillo, M.; Schmocker, L.; Greco, M.; Hager, W.H. 1D numerical evaluation of dike erosion due to overtopping. J. Hydraul. Res. 2010, 48, 573–582. [Google Scholar] [CrossRef]
- Volz, C.; Rousselot, P.; Vetsch, D.; Faeh, R. Numerical modelling of non-cohesive embankment breach with the dual-mesh approach. J. Hydraul. Res. 2012, 50, 587–598. [Google Scholar] [CrossRef]
- Mizutani, H.; Nakagawa, H.; Yoden, T.; Kawaike, K.; Zhang, H. Numerical modelling of river embankment failure due to overtopping flow considering infiltration effects. J. Hydraul. Res. 2013, 51, 681–695. [Google Scholar] [CrossRef] [Green Version]
- Guan, M.; Wright, N.; Sleigh, P. 2D Process-Based Morphodynamic Model for Flooding by Noncohesive Dyke Breach. J. Hydraul. Eng. 2014, 140, 04014022. [Google Scholar] [CrossRef] [Green Version]
- Kakinuma, T.; Shimizu, Y. Large-scale experiment and numerical modeling of a riverine levee breach. J. Hydraul. Eng. 2014, 140, 04014039. [Google Scholar] [CrossRef]
- Evangelista, S. Experiments and Numerical simulations of dike erosion due to a wave impact. Water 2015, 7, 5831–5848. [Google Scholar] [CrossRef]
- Gingold, R.A.; Monaghan, J.J. Smoothed particle hydrodynamics: Theory and applications to non-spherical stars. Mon. Not. R. Astron. Soc. 1977, 181, 375–389. [Google Scholar] [CrossRef]
- Lucy, L. A numerical approach to testing the fission hypothesis. Astron. J. 1977, 81, 1013–1024. [Google Scholar] [CrossRef]
- Koshizuka, S.; Oka, Y. Moving-particle semi-implicit method for fragmentation of incompressible fluid. Nucl. Sci. Eng. 1996, 123, 421–434. [Google Scholar] [CrossRef]
- Belytschko, T.; Lu, Y.Y.; Gu, L. Element free Galerkin methods. Int. J. Numer. Meth. Eng. 1994, 37, 229–256. [Google Scholar] [CrossRef]
- Sulsky, D.; Chen, Z.; Schreyer, H.L. A particle method for history-dependent materials. Comput. Methods Appl. Mech. Eng. 1994, 118, 176–196. [Google Scholar] [CrossRef]
- Sulsky, D.; Zhou, S.J.; Schreyer, H.L. Application of a particle-in-cell method to solid mechanics. Comput. Phys. Commun. 1995, 87, 236–252. [Google Scholar] [CrossRef]
- Gotoh, H.; Hyashi, M.; Oda, K.; Sakai, T. Gridless analysis of slope failure of embankment by overflow. Ann. J. Hydraul. Eng. JSCE 2002, 46, 439–444. [Google Scholar] [CrossRef]
- Gotoh, H.; Ikari, H.; Tanioka, H.; Yamamoto, K. Numerical simulation of river-embankment erosion due to overflow by particle method. Proc. Hydraul. Eng. 2008, 52, 979–984. [Google Scholar] [CrossRef]
- Li, L.; Rao, X.; Amini, F.; Tang, H.W. SPH Modeling of Hydraulics and Erosion of HPTRM Levee. J. Adv. Res. Ocean Eng. 2015. [Google Scholar] [CrossRef]
- Zhang, W.; Maeda, K.; Saito, H.; Li, Z.; Huang, Y. Numerical analysis on seepage failures of dike due to water level-up and rainfall using a water–soil-coupled smoothed particle hydrodynamics model. Acta Geotech. 2016, 11, 1401–1418. [Google Scholar] [CrossRef]
- Liu, C.J.; Ning, B.H.; Ding, L.Q.; Zhang, S.F. Simulation of piping erosion process of dike foundation with element free method. Water Resour. Power 2012, 30, 58–61. [Google Scholar]
- Nikolic, M.; Ibrahimbegovic, A.; Miscevic, P. Discrete element model for the analysis of fluid-saturated fracturedporo-plastic medium based on sharp crack representation with embedded strong discontinuities. Comput. Methods Appl. Mech. Eng. 2016, 298, 407–427. [Google Scholar] [CrossRef]
- Zhao, X.Y.; Liang, D.F. MPM modelling of seepage flow through embankments. In Proceedings of the Twenty-Sixth International Ocean and Polar Engineering Conference, Rhodes, Greece, 26 June–1 July 2016. [Google Scholar]
- Martinelli, M.; Rohe, A.; Soga, K. Modeling dike failure using the Material Point Method. Procedia Eng. 2017, 175, 341–348. [Google Scholar] [CrossRef]
- Ma, S.; Zhang, X.; Qiu, X.M. Comparison study of MPM and SPH in modeling hypervelocity impact problems. Int. J. Impact Eng. 2009, 36, 272–282. [Google Scholar] [CrossRef]
- Mackenzie-Helnwein, P.; Arduino, P.; Shin, W.; Moore, J.A.; Miller, G.R. Modeling strategies for multiphase drag interactions using the material point method. Int. J. Numer. Methods Eng. 2010, 83, 295–322. [Google Scholar] [CrossRef]
- Abe, K.; Soga, K.; Bandara, S. Material Point Method for Coupled Hydromechanical Problems. J. Geotech. Geoenviron. Eng. 2013, 140, 04013033. [Google Scholar] [CrossRef]
- Bandara, S.; Soga, K. Coupling of soil deformation and pore fluid flow using material point method. Comput. Geotech. 2015, 63, 199–214. [Google Scholar] [CrossRef]
- Fern, J.; Rohe, A.; Soga, K.; Alonso, E. The Material Point Method for Geotechnical Engineering: A Practical Guide; CRC Press, Taylor & Francis Group: Boca Raton, FL, USA, 2019. [Google Scholar]
- Soga, K.; Alonso, E.; Yerro, A.; Kumar, K.; Bandara, S. Trends in large-deformation analysis of landslide mass movements with particular emphasis on the material point method. Géotechnique 2015, 66, 1–26. [Google Scholar]
- Martinelli, M. Soil-Water Interaction with Material Point Method; Technical Report; Deltares: Delft, The Netherlands, 2016. [Google Scholar]
- Ceccato, F.; Yerro, A.; Martinelli, M. Modelling Soil-Water Interaction with the Material Point Method. Evaluation of single-point and double-point formulations. In Proceedings of the NUMGE, Porto, Portugal, 25–29 June 2018. [Google Scholar]
- Liu, L.-F.; Lin, P.Z.; Chuang, K.-A.; Sakakiyama, T. Numerical modelling of wave interaction with porous structures. J. Waterw. Port Coast. Ocean. Eng. ASCE 1999, 125, 322–330. [Google Scholar] [CrossRef]
- Lauber, G.; Hager, W.H. Experiments to dambreak wave: Horizontal channel. J. Hydraul. Res. 1998, 36, 291–307. [Google Scholar] [CrossRef]
Figure 1.
The schematic model for the double-point two-phase material point method (MPM) [32].
Figure 1.
The schematic model for the double-point two-phase material point method (MPM) [32].

Figure 2.
Schematic diagram for soil behavior [34].
Figure 2.
Schematic diagram for soil behavior [34].

Figure 3.
Geometry and discretization of the problem of flow through the porous block.

Figure 4.
Some snapshots of the flow through the porous block.

Figure 5.
Comparison of free surface profile for flow through porous block: Simulation (▪) and experiment (⚬).
Figure 5.
Comparison of free surface profile for flow through porous block: Simulation (▪) and experiment (⚬).

Figure 6.
Experimental setup [12] and MPM model for the embankment overtopping problem.
Figure 6.
Experimental setup [12] and MPM model for the embankment overtopping problem.

Figure 7.
Snapshots of the simulated water surface and the embankment profiles along the channel (H = 0.2 m).
Figure 7.
Snapshots of the simulated water surface and the embankment profiles along the channel (H = 0.2 m).

Figure 8.
Comparisons of the free water surface and embankment profiles between the simulation and experiment (H = 0.2 m).
Figure 8.
Comparisons of the free water surface and embankment profiles between the simulation and experiment (H = 0.2 m).

Figure 9.
Snapshots of the simulated water surface and the embankment profiles along the channel (H = 0.25 m).
Figure 9.
Snapshots of the simulated water surface and the embankment profiles along the channel (H = 0.25 m).

Figure 10.
Comparisons of the free water surface and embankment profiles between the simulation and experiment (H = 0.25 m).
Figure 10.
Comparisons of the free water surface and embankment profiles between the simulation and experiment (H = 0.25 m).

Figure 11.
Snapshots of the simulated water surface and the embankment profiles along the channel (H = 0.395 m).
Figure 11.
Snapshots of the simulated water surface and the embankment profiles along the channel (H = 0.395 m).

Figure 12.
Comparisons of the free water surface and embankment profiles between the simulation and experiment (H = 0.395 m).
Figure 12.
Comparisons of the free water surface and embankment profiles between the simulation and experiment (H = 0.395 m).

Figure 13.
The effect of the cohesion on the embankment profiles (H = 0.395 m).

Figure 14.
The effect of the internal fiction angle on the embankment profiles.

Figure 15.
The effect of the initial porosity on the embankment profiles.

Figure 16.
The effect of maximum porosity on the embankment profiles.


Table 1.
The material parameters for flow through the porous block.
| Material | Parameter | Value |
|---|---|---|
| Porous block | Density (kg/m3) | 2700 |
| Young modulus (kPa) | 1000 | |
| Poisson’s ratio | 0.3 | |
| Initial porosity | 0.49 | |
| Mean diameter (mm) | 15.9 | |
| Water | Density (kg/m3) | 1000 |
| Bulk modulus (kPa) | 2.15 × 10⁴ | |
| Dynamic viscosity (kPa·s) | 1 × 10⁻⁶ |
Table 2.
The material parameters of the two phase materials.
| Material | Parameter | Value |
|---|---|---|
| Sand | Density (kg/m3) | 2680 |
| Young modulus (kPa) | 1000 | |
| Poisson’s ratio | 0.3 | |
| Internal friction angle (°) | 36 | |
| Cohesion (kN) | 0 | |
| Initial porosity Maximum porosity | 0.40 0.45 | |
| Mean diameter (mm) | 0.2 | |
| Water | Density (kg/m3) | 1000 |
| Bulk modulus (kPa) | 2.15 × 10⁴ | |
| Dynamic viscosity (kPa·s) | 1 × 10⁻⁶ |
© 2019 by the authors. Licensee MDPI, Basel, Switzerland. This article is an open access article distributed under the terms and conditions of the Creative Commons Attribution (CC BY) license (http://creativecommons.org/licenses/by/4.0/).
Share and Cite
MDPI and ACS Style
Yang, Y.-S.; Yang, T.-T.; Qiu, L.-C.; Han, Y. Simulating the Overtopping Failure of Homogeneous Embankment by a Double-Point Two-Phase MPM. Water 2019, 11, 1636. https://doi.org/10.3390/w11081636
AMA Style
Yang Y-S, Yang T-T, Qiu L-C, Han Y. Simulating the Overtopping Failure of Homogeneous Embankment by a Double-Point Two-Phase MPM. Water. 2019; 11(8):1636. https://doi.org/10.3390/w11081636
Chicago/Turabian StyleYang, Yong-Sen, Ting-Ting Yang, Liu-Chao Qiu, and Yu Han. 2019. "Simulating the Overtopping Failure of Homogeneous Embankment by a Double-Point Two-Phase MPM" Water 11, no. 8: 1636. https://doi.org/10.3390/w11081636
Note that from the first issue of 2016, this journal uses article numbers instead of page numbers. See further details here.