Article

Hydrogeochemical Characteristics and Genesis of Geothermal Water from the Ganzi Geothermal Field, Eastern Tibetan Plateau

1
Key Laboratory of Shale Gas and Geoengineering, Institute of Geology and Geophysics, Chinese Academy of Sciences, Beijing 100029, China
2
College of Earth and Planetary Sciences, University of Chinese Academy of Sciences, Beijing 100049, China
3
Institutions of Earth Science, Chinese Academy of Sciences, Beijing 100029, China
*
Author to whom correspondence should be addressed.
Water 2019, 11(8), 1631; https://doi.org/10.3390/w11081631
Submission received: 2 July 2019 / Revised: 30 July 2019 / Accepted: 5 August 2019 / Published: 7 August 2019
(This article belongs to the Section Hydrology)

Abstract

:
The Ganzi geothermal field, located in the eastern sector of the Himalayan geothermal belt, is full of high-temperature surface manifestations. However, the geothermal potential has not been assessed so far. The hydrochemical and gas isotopic characteristics have been investigated in this study to determine the geochemical processes involved in the formation of the geothermal water. On the basis of δ18O and δD values, the geothermal waters originate from snow and glacier melt water. The water chemistry type is dominated by HCO3-Na, which is mainly derived from water-CO2-silicate interactions, as also indicated by the 87Sr/86Sr ratios (0.714098–0.716888). Based on Cl-enthalpy mixing model, the chloride concentration of the deep geothermal fluid is 37 mg/L, which is lower than that of the existing magmatic heat source area. The estimated reservoir temperature ranges from 180–210 °C. Carbon isotope data demonstrate that the CO2 mainly originates from marine limestone metamorphism, with a fraction of 74–86%. The helium isotope ratio is 0.17–0.39 Ra, indicating that the He mainly comes from atmospheric and crustal sources, and no more than 5% comes from a mantle source. According to this evidence, we propose that there is no magmatic heat source below the Ganzi geothermal field, making it a distinctive type of high-temperature geothermal system on the Tibetan Plateau.

1. Introduction

Geothermal energy has the potential to become a major green energy resource in the future and will contribute to reducing atmospheric carbon emissions [1,2]. High-temperature geothermal systems have been used globally to generate electricity [3,4,5]. High-temperature geothermal systems are commonly related to volcanic activities alongside plate boundaries with the heat source from magma [6]. Examples include the Taupo Volcanic Zone in New Zealand [7,8] and Krafla in Iceland [9]. As part of the Mediterranean-Himalayan geothermal belt, Tibet, Yunnan, and western Sichuan in China host the most high-temperature geothermal systems [10,11,12,13]. The Yunnan Rehai volcanic geothermal system has a mantle-derived magmatic heat source. There are non-volcanic high-temperature geothermal systems with a magmatic heat source, e.g., Yangbajing geothermal field, Yangyi geothermal field, and Gulu geothermal field in the Nimu-Nagchu geothermal belt of central Tibet. They are believed to have a partially melted magma chamber as heat sources [12,13]. However, there are also high-temperature geothermal systems that don’t have a magmatic heat source, e.g., hydrochemical and gas isotopic geochemistry have shown that the Batang high-temperature geothermal system in western Sichuan does not have magmatic heat source [14,15]. The heat of the geothermal system does not have to be supplied by magma and can be produced in areas of tectonic activity [6]. Such situations are very rare [16].
Since the late 1980s, a preliminary geological and hydrochemical investigation was carried out in Ganzi owing to strong hydrothermal manifestations including hot springs, boiling springs, fumaroles, and steaming ground [17]. Nevertheless, the origin and genetic mechanism of the geothermal fluid remains unclear. Hydrochemistry and gas chemistry as well as isotopes genetic information of geothermal systems are very useful in determining geothermal reservoir temperature, water and heat source, etc. In fact, different chemical geothermometers usually give varied reservoir temperatures. The processes of degassing, mixing, or dilution that occur during fluid ascent affect the equilibrium of fluid and minerals and affect the accuracy of temperatures estimated by thermometers. As a result, some traditional thermometers fail to predict subsurface temperatures [6,18]. Therefore, the appropriate geothermometers should be selected to estimate reservoir temperature on the premise that the hydrogeochemical processes associated with a geothermal fluid have first been accurately determined.
In this study, a detailed hydrochemical and isotopic investigation was carried out on the geothermal water and gas samples collected from Ganzi geothermal field. The purposes of this study are: (i) to determine the origin and hydrogeochemical formation processes of the geothermal fluids and provide a preliminary analysis of the heat source, (ii) to analyse the cooling processes and composition of the deep fluid, and (iii) to identify the applicable geothermometers for estimating the reservoir temperature at this site.

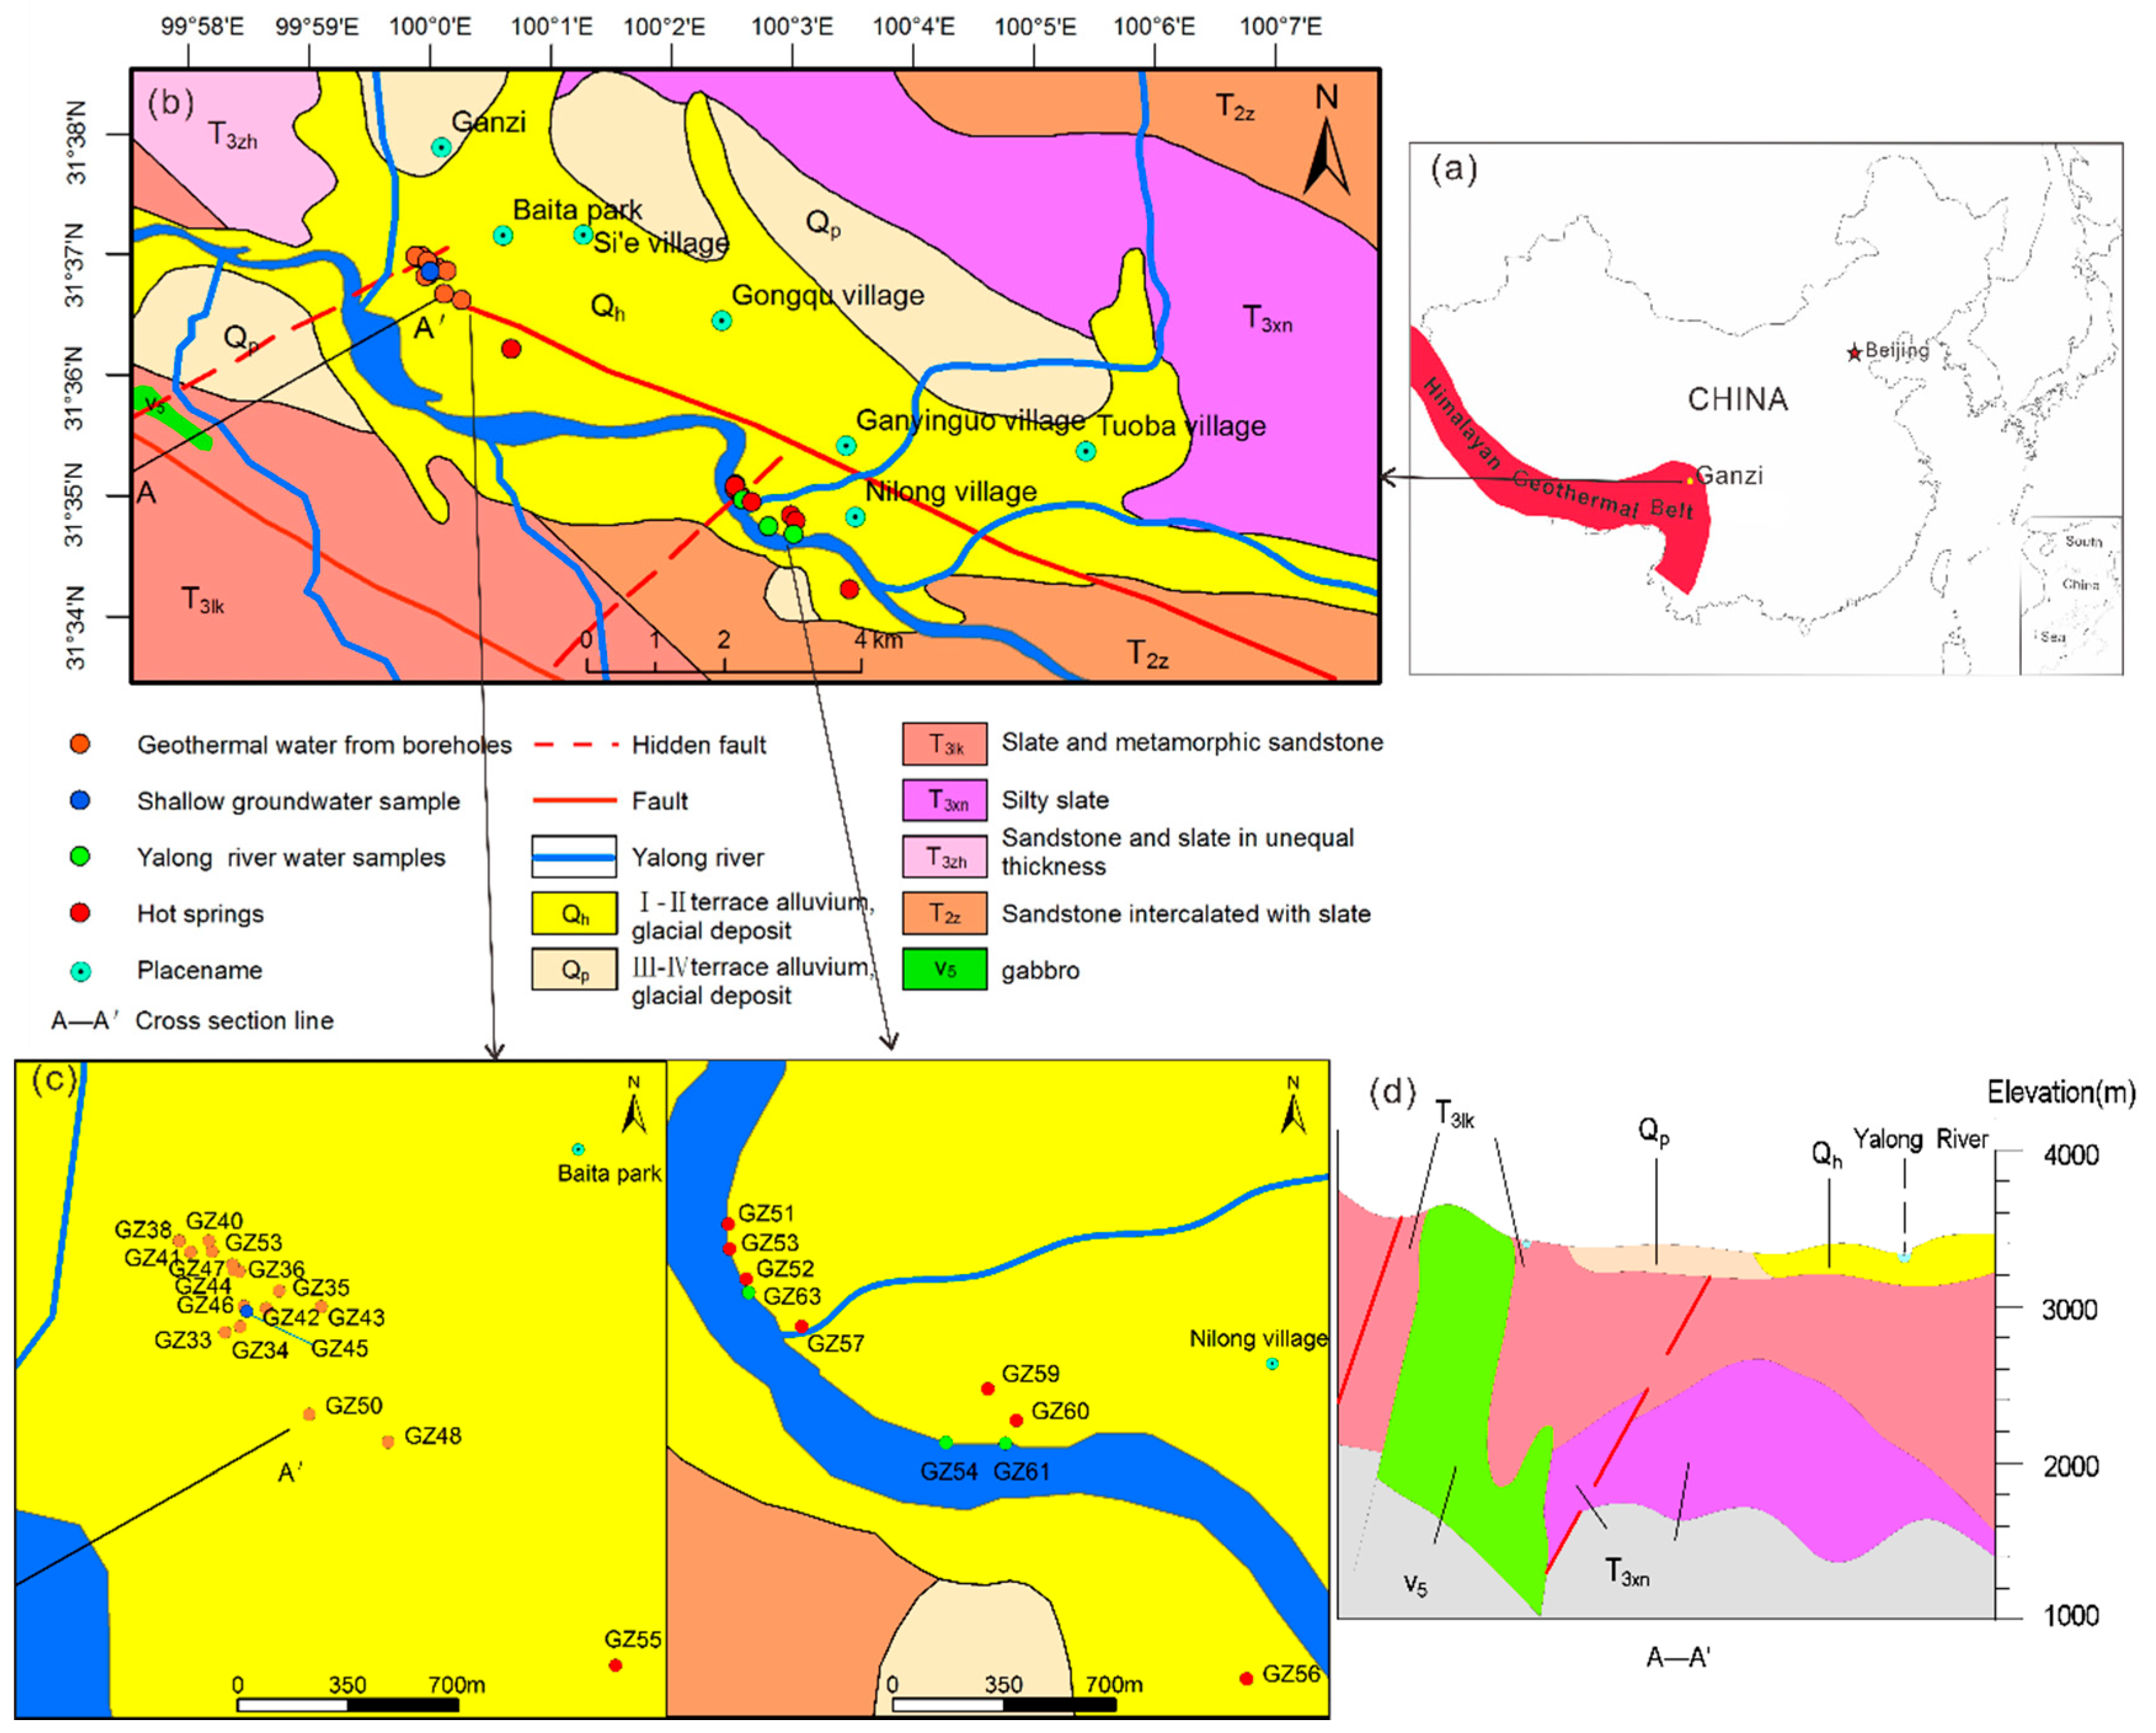
2. Geological Setting of the Study Area

The Ganzi geothermal field is located at the eastern margin of the Tibetan Plateau, which was formed by the continental collision between the Indian plate and the Eurasian plate. This geothermal field is located in the eastern part of the Himalayan geothermal belt (Figure 1a) [10,11]. Since the late Cenozoic era, the eastern block of the Tibet Plateau has been extruded to the southeast, forming the eastern Himalayan syntaxis, which is characterized by tectonic activity [19,20]. The Ganzi basin is located along the eastern Himalayan syntaxis at the collision front. Large strike-slip faults and strong compressive torsional stress have produced significant structural features, and the associated conditions are significantly different from the tensile stress environment in other geothermal fields, such as Yangbajing on the Tibet Plateau [5]. The Ganzi basin is located at the confluence of two major fault zones: the Ganzi-Yushu fault zone to the west and the Xianshuihe fault zone to the east [21,22]. The Xianshuihe fault zone and the Ganzi-Yushu fault zone are distributed in echelon near Ganzi [23]. Due to the sinistral strike-slip faulting in Ganzi since the Himalayan period, E-W transtensional faults have formed between the two main NW-oriented faults, and these local NW-SE- and E-W-oriented tensile stress environments control the boundaries of the basin [24].
The Ganzi basin is distributed along the Yalong River. This rhomboid-shaped basin has an east-west length of 21.9 km and a north-south width of approximately 6.1 km. The Yalong River Valley is approximately 3400 m above sea level and the boiling temperature of water is about 89 °C at 3400 m. The annual average air temperature is 5 °C, and the annual precipitation is 626 mm on average. Hot springs are exposed along the NW-striking Ganzi fault [17].
The stratigraphy in the Ganzi basin (see Figure 1b,d) include Quaternary alluvial and glacial deposits, upper Triassic Luokongsongduo Formation, upper Triassic Xinduqiao Formation, upper Triassic Zhuowo Formation, and middle Triassic Zagunao Formation. The Quaternary layer, located in the centre of the basin, covers the Ganzi faults. The Triassic Luokongsongduo Formation is mainly composed of a set of slate and metamorphic quartz sandstone. This formation is exposed in the southwest of the basin and represents the main reservoir of the Ganzi geothermal field. The Triassic Xinduqiao Formation, exposed in the northeast of the basin, is a set of low-grade metamorphic sandstone dominated by a silty slate. The Triassic Zhuowo Formation is mainly composed of feldspar-quartz sandstone and slate of unequal thickness, and this formation is mainly exposed at the surface in the north of the basin. The underlying Triassic Zagunao Formation is composed mainly by sandstones intercalated with a small amount of slate and is exposed in a small area on the southeast side of the basin. According to the Ganzi geothermal well report by Ganzi Kangsheng Geothermal Limited Company (2012) [25], the secondary alteration mineral pyrite is observed in many places along fracture surfaces below the depth of 120 m. The pyrite is mostly idiomorphic or semi-idiomorphic, with average particle sizes of 3–5 mm and only a few up to 8 mm. Black carbonaceous shale can be observed at depths of approximately 230 m in the well. Carboniferous-Permian crystalline limestone is exposed in the surrounding area [26].

3. Sampling and Analysis

In November 2017, 22 groups of water samples and 12 groups of gas samples were collected from the Ganzi geothermal field, of which 13 were from geothermal wells, five from hot springs, one from a shallow well, and three from the Yalong River. The sampling sites are shown in Figure 1c. Both borehole water and hot spring samples were taken directly from outlets. Temperature, pH, electrical conductivity (EC), and total dissolved solids (TDS) were measured in situ by a portable multi-parameter controller (HQ40D, Hach, Loveland, CO, USA). HCO3/CO32− was titrated by a portable digital titrator (16900 Digital Titrator, Hach, Loveland, CO, USA) in the field using phenolphthalein and methyl orange colourants as indicators. All the samples were filtered through a 0.22 μm membrane into a polyethylene flask and sealed with a Parafilm sealing membrane. SiO2 was sampled by diluting with purified water to prevent precipitation. For cation and trace element analysis, HNO3 (6 mol/L) was added to the samples until the pH was less than 2.
Trace elements were determined by ICP-MS NesION300D and ICP-OES 5300DV (PerkinElmer, Connecticut, USA), and the analytical accuracy was better than 0.5%. The cations (K+, Na+, Ca2+ and Mg2+) and anions (F, Cl, NO3 and SO42−) were analysed by Ion Chromatography (Dionex ICS1100 , Thermo Fisher Scientific, Massachusetts, USA) (detection limit is 0.05 mg/L) in the Laboratory of Water Isotope and Water-Rock Interaction, at the Institute of Geology and Geophysics, Chinese Academy of Sciences (IGG-CAS). Stable isotopes of hydrogen and oxygen were measured by a Picarro L1102-I laser water isotope analyser, Inc., Santa Clara, CA, USA using the Vienna standard mean ocean water (VSMOW) as the standard. The detection precisions were ±0.1‰ and ±0.5‰ for δ18O and δD, respectively. Strontium isotopes were determined by a thermal surface ionization mass spectrometer (9444, Phoenix, IsotopX, Manchester, UK) at the Beijing Research Institute of Uranium Geology. δ34SSO4 and δ18OSO4 values were measured by Delta-S and Delta-V mass spectrometers, respectively, in the Laboratory for Stable Isotope Geochemistry, IGG-CAS. The detection accuracy was better than 0.2‰.
Gas sampling refers to the method introduced by Stefan (2000a) [27]. A 50 mL glass bottle was used as the sample container. For gas collection in hot springs, an inverted polyethylene funnel was connected with tubing. The polyethylene funnel was submerged into the hot spring, and the tubing was inserted deep into the glass bottle. For gas collection from geothermal wells, the tubing was directly attached to the spout. A copper pipe is connected in the middle of the tubing. The copper pipe was submerged in cold water to cool the hot water. The other end of the tubing was inserted deep into the glass bottle. During the entire gas collection process, the glass bottle was always submerged in geothermal water until it was almost fully displaced by gas, at which point the bottle was closed with a rubber plug. The sealed glass bottle was covered with an aluminium cap. To prevent atmospheric contamination, the glass bottle was placed upside down in a 500-mL plastic bottle filled with geothermal water. The volume components in the gas were measured by an MAT 271 gas isotope ratio mass spectrometer, with a relative standard deviation of ±5%. The carbon isotopic values of CO2 were measured by a gas isotope ratio mass spectrometer (Thermo-Fisher Scientific Delta Plus XP, Massachusetts, USA), with an error limit of ±0.2‰. Noble gas isotope measurements, including the ratios 3He/4He and 4He/20Ne, were analysed by a Noblesse noble gas isotope mass spectrometer with an accuracy ±3%. Gas components, carbon isotopes, and noble gas isotopes were all measured in the Key Laboratory of Petroleum Resources Research, IGG-CAS.

4. Results and Discussion

4.1. Origin and Recharge Source of Geothermal Water

Deuterium and oxygen stable isotopes are widely used as effective tracers to determine the origins of geothermal waters [28,29,30,31,32]. The δ18O and δD values of the geothermal water in this study range from −17.2‰ to −14.1‰ and from −133.5‰ to −106.1‰, respectively (Table 1). In Figure 2, the distribution of hydrogen and oxygen isotopes in rivers is consistent with the local meteoric water line (LMWL) [33]. Since the moisture source in the eastern part of the Tibet Plateau is mainly from the eastern side, the same as Chengdu [34], the equation of the meteoric water line δD = 7.53δ18O + 1.42 in Chengdu, Sichuan province is regarded as the LMWL [33]. With respect to the LMWL, a positive shift is present in the oxygen isotope values of the geothermal water (Figure 2). This oxygen isotope shift is interpreted to have resulted from the exchange of 18O between water and rock at high temperatures (>150 °C) because rocks are commonly enriched in the heavy oxygen isotope [35]. In general, the distribution of hydrogen and oxygen isotopic values in geothermal waters is close to that of atmospheric precipitation. Therefore, the geothermal water is recharged by meteoric precipitation. Due to the altitude effect on hydrogen and oxygen isotopes, the isotopic values decrease as the recharge elevation increases [35]. Therefore, because of the altitude effect, isotopic values are often used to determine the recharge elevation of groundwater. Since the δ18O shift cannot be neglected in this region, it is necessary to correct the oxygen shift. The oxygen isotope values are corrected by returning them to the meteoric water line while keeping the δD values constant. Assuming that the δ18Ocorrected is the δ18O value corrected for oxygen isotope shift and δD is the measured value, δ18Ocorrected = (δD − 1.42)/7.53 [33]. Then δ18Ocorrected is used to calculate the recharge elevation. The most depleted δ18O value of the geothermal water after the δ18O correction is −17.9‰. The multi-year weighted-mean δ18O value of −6.7‰ in Chengdu (approximately 500 m above sea level) based on Global Network of Isotopes in Precipitation (GNIP) data is chosen as the reference value [36]. Gao et al. (2011) [37] obtained an altitude gradient of δ18O values on the Tibetan Plateau of −3‰/1000 m on the basis of data from five monitoring stations. Our research team obtained an altitude gradient of δ18O values of −3.4‰/1000 m [14]. In this paper, the recharge elevation of geothermal water is estimated using both altitude gradients. The calculated recharge elevations are 4233 m and 3794 m, respectively. The Ganzi district is surrounded by mountains. The snow-capped mountain peak named Zhuodana to the south is 5200 m above sea level. Therefore, the geothermal waters are derived from snow and glacier melt water on the nearby mountains.

4.2. Genesis of Geothermal Water

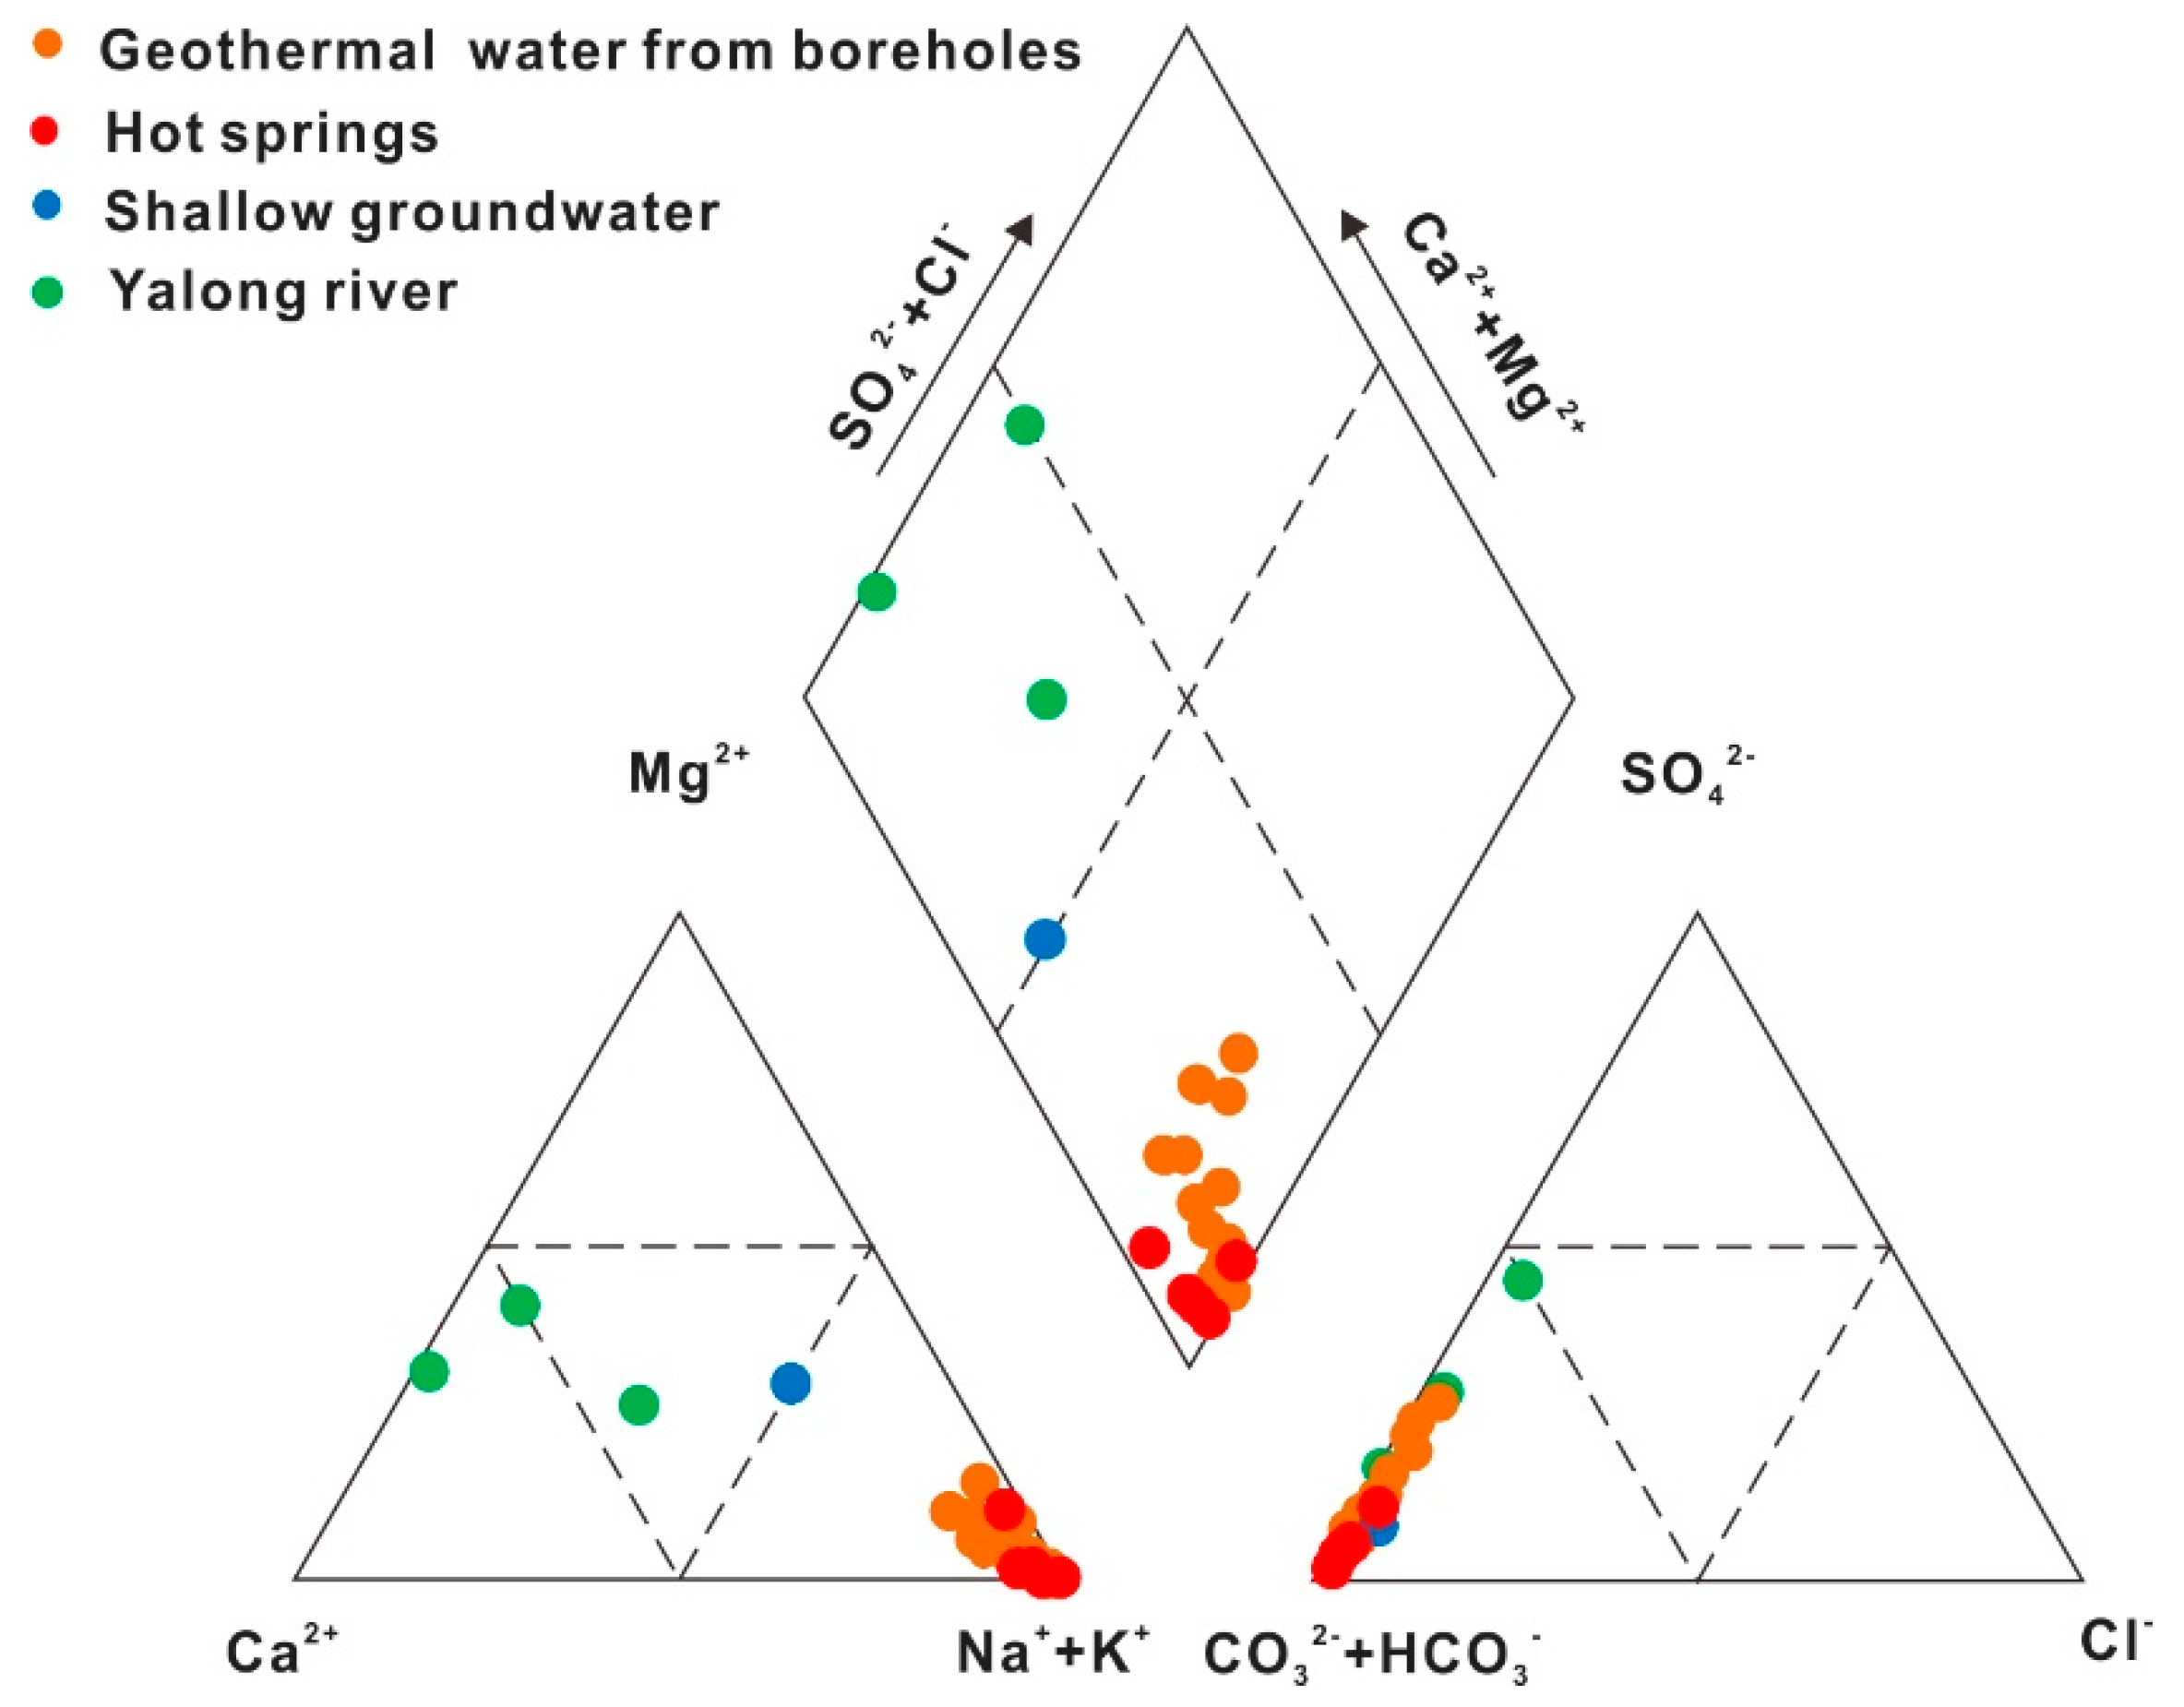
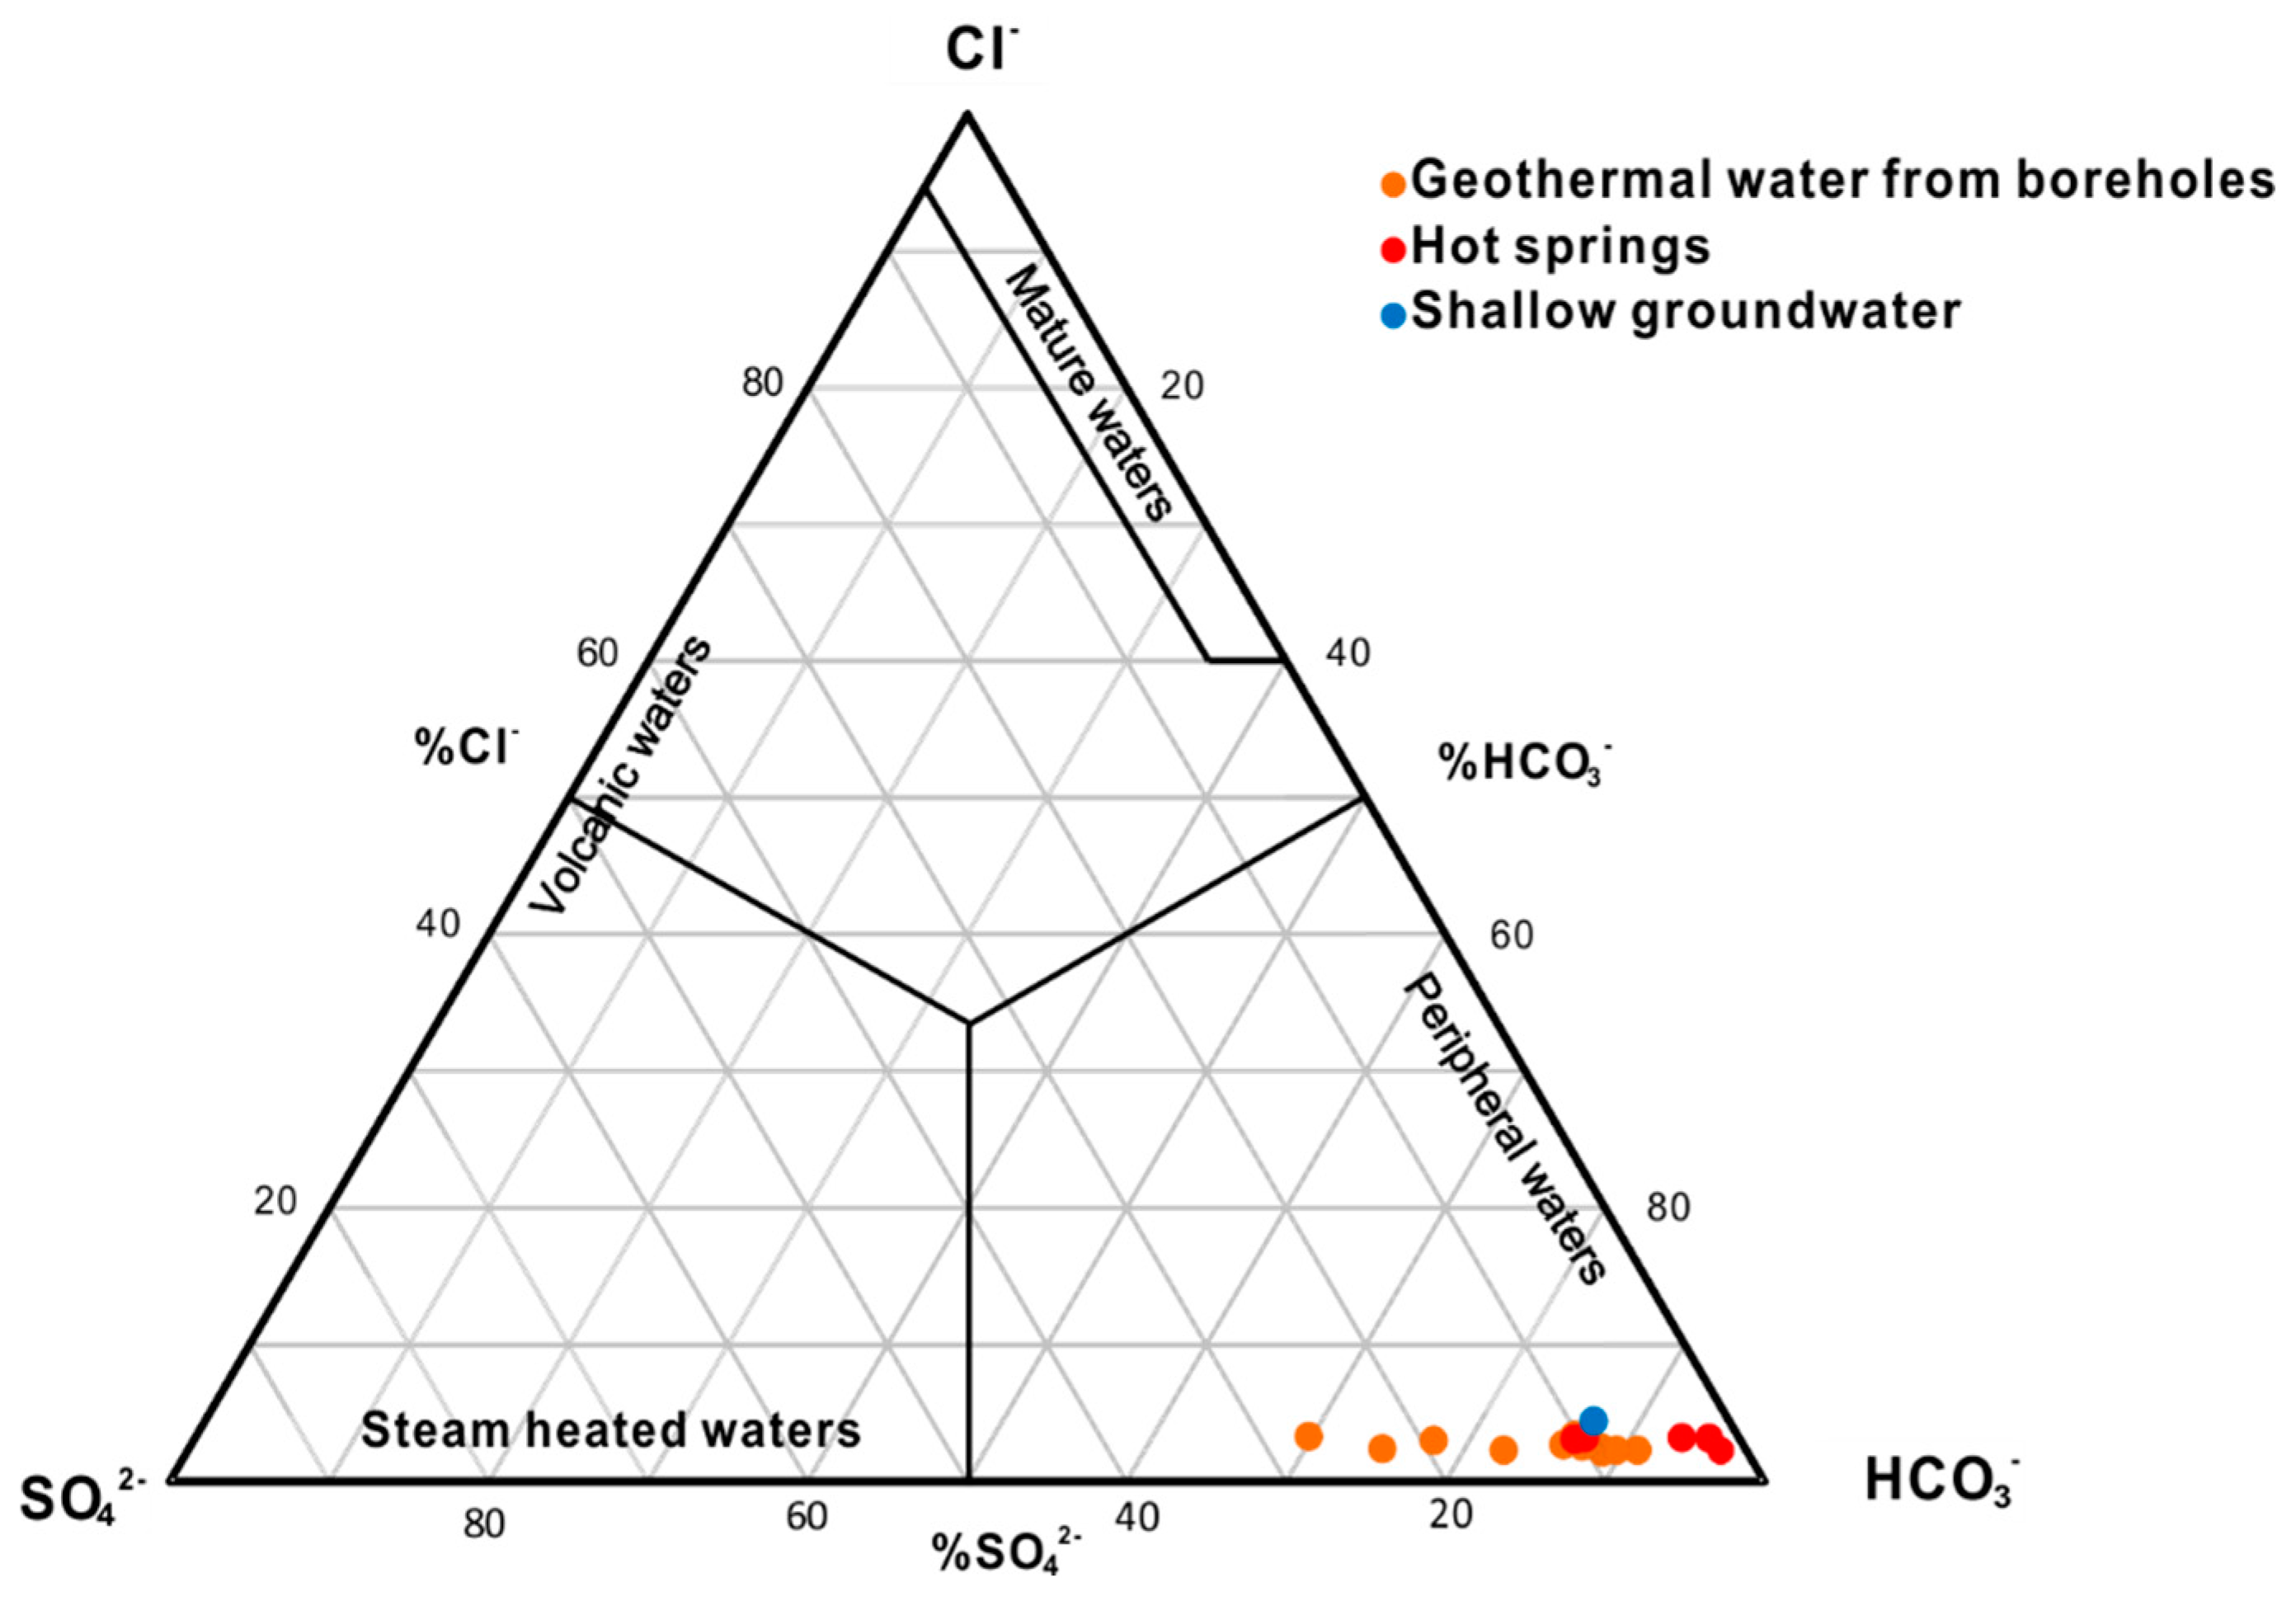
4.2.1. Hydrogeochemical Characteristics

The results of the field tests (pH, temperature, EC, TDS) and laboratory analyses (major ion concentrations) are shown in Table 1. According to the properties and chemical composition of the samples, water samples are separated into geothermal water, shallow groundwater and river water. Geothermal water includes hot springs and geothermal water from boreholes. The infrared temperature of the geothermal water is 40–89 °C. The depth of the geothermal boreholes ranges from 30 to 180 m. The geothermal waters are alkaline, with a pH of 7.4–9.4. The TDS values range from 326 to 1798 mg/L, with an average of 787 mg/L. The Piper diagram shows that the hydrochemical types of the geothermal water are HCO3-Na and HCO3·SO4-Na (Figure 3). The shallow groundwater was collected from a well with a depth of 20 m. The hydrochemical type is HCO3-Na·Mg, and the water has a pH of 8.1 and a TDS value of 285 mg/L. The river water is alkaline, with a pH of 7.3–8.4. The TDS values are low, ranging from 119 to 281 mg/L. The water types of river water are HCO3-Ca·Mg, HCO3·SO4-Ca·Na·Mg, and HCO3·SO4-Ca·Mg. A geological investigation indicates that the river water is mainly recharged from surrounding mountain snowmelt and precipitation. Based on the Cl-SO42−-HCO3 diagram [38], all samples are classified in Figure 4. All the geothermal waters fall in the peripheral water field, and the water samples have a high content of HCO3.

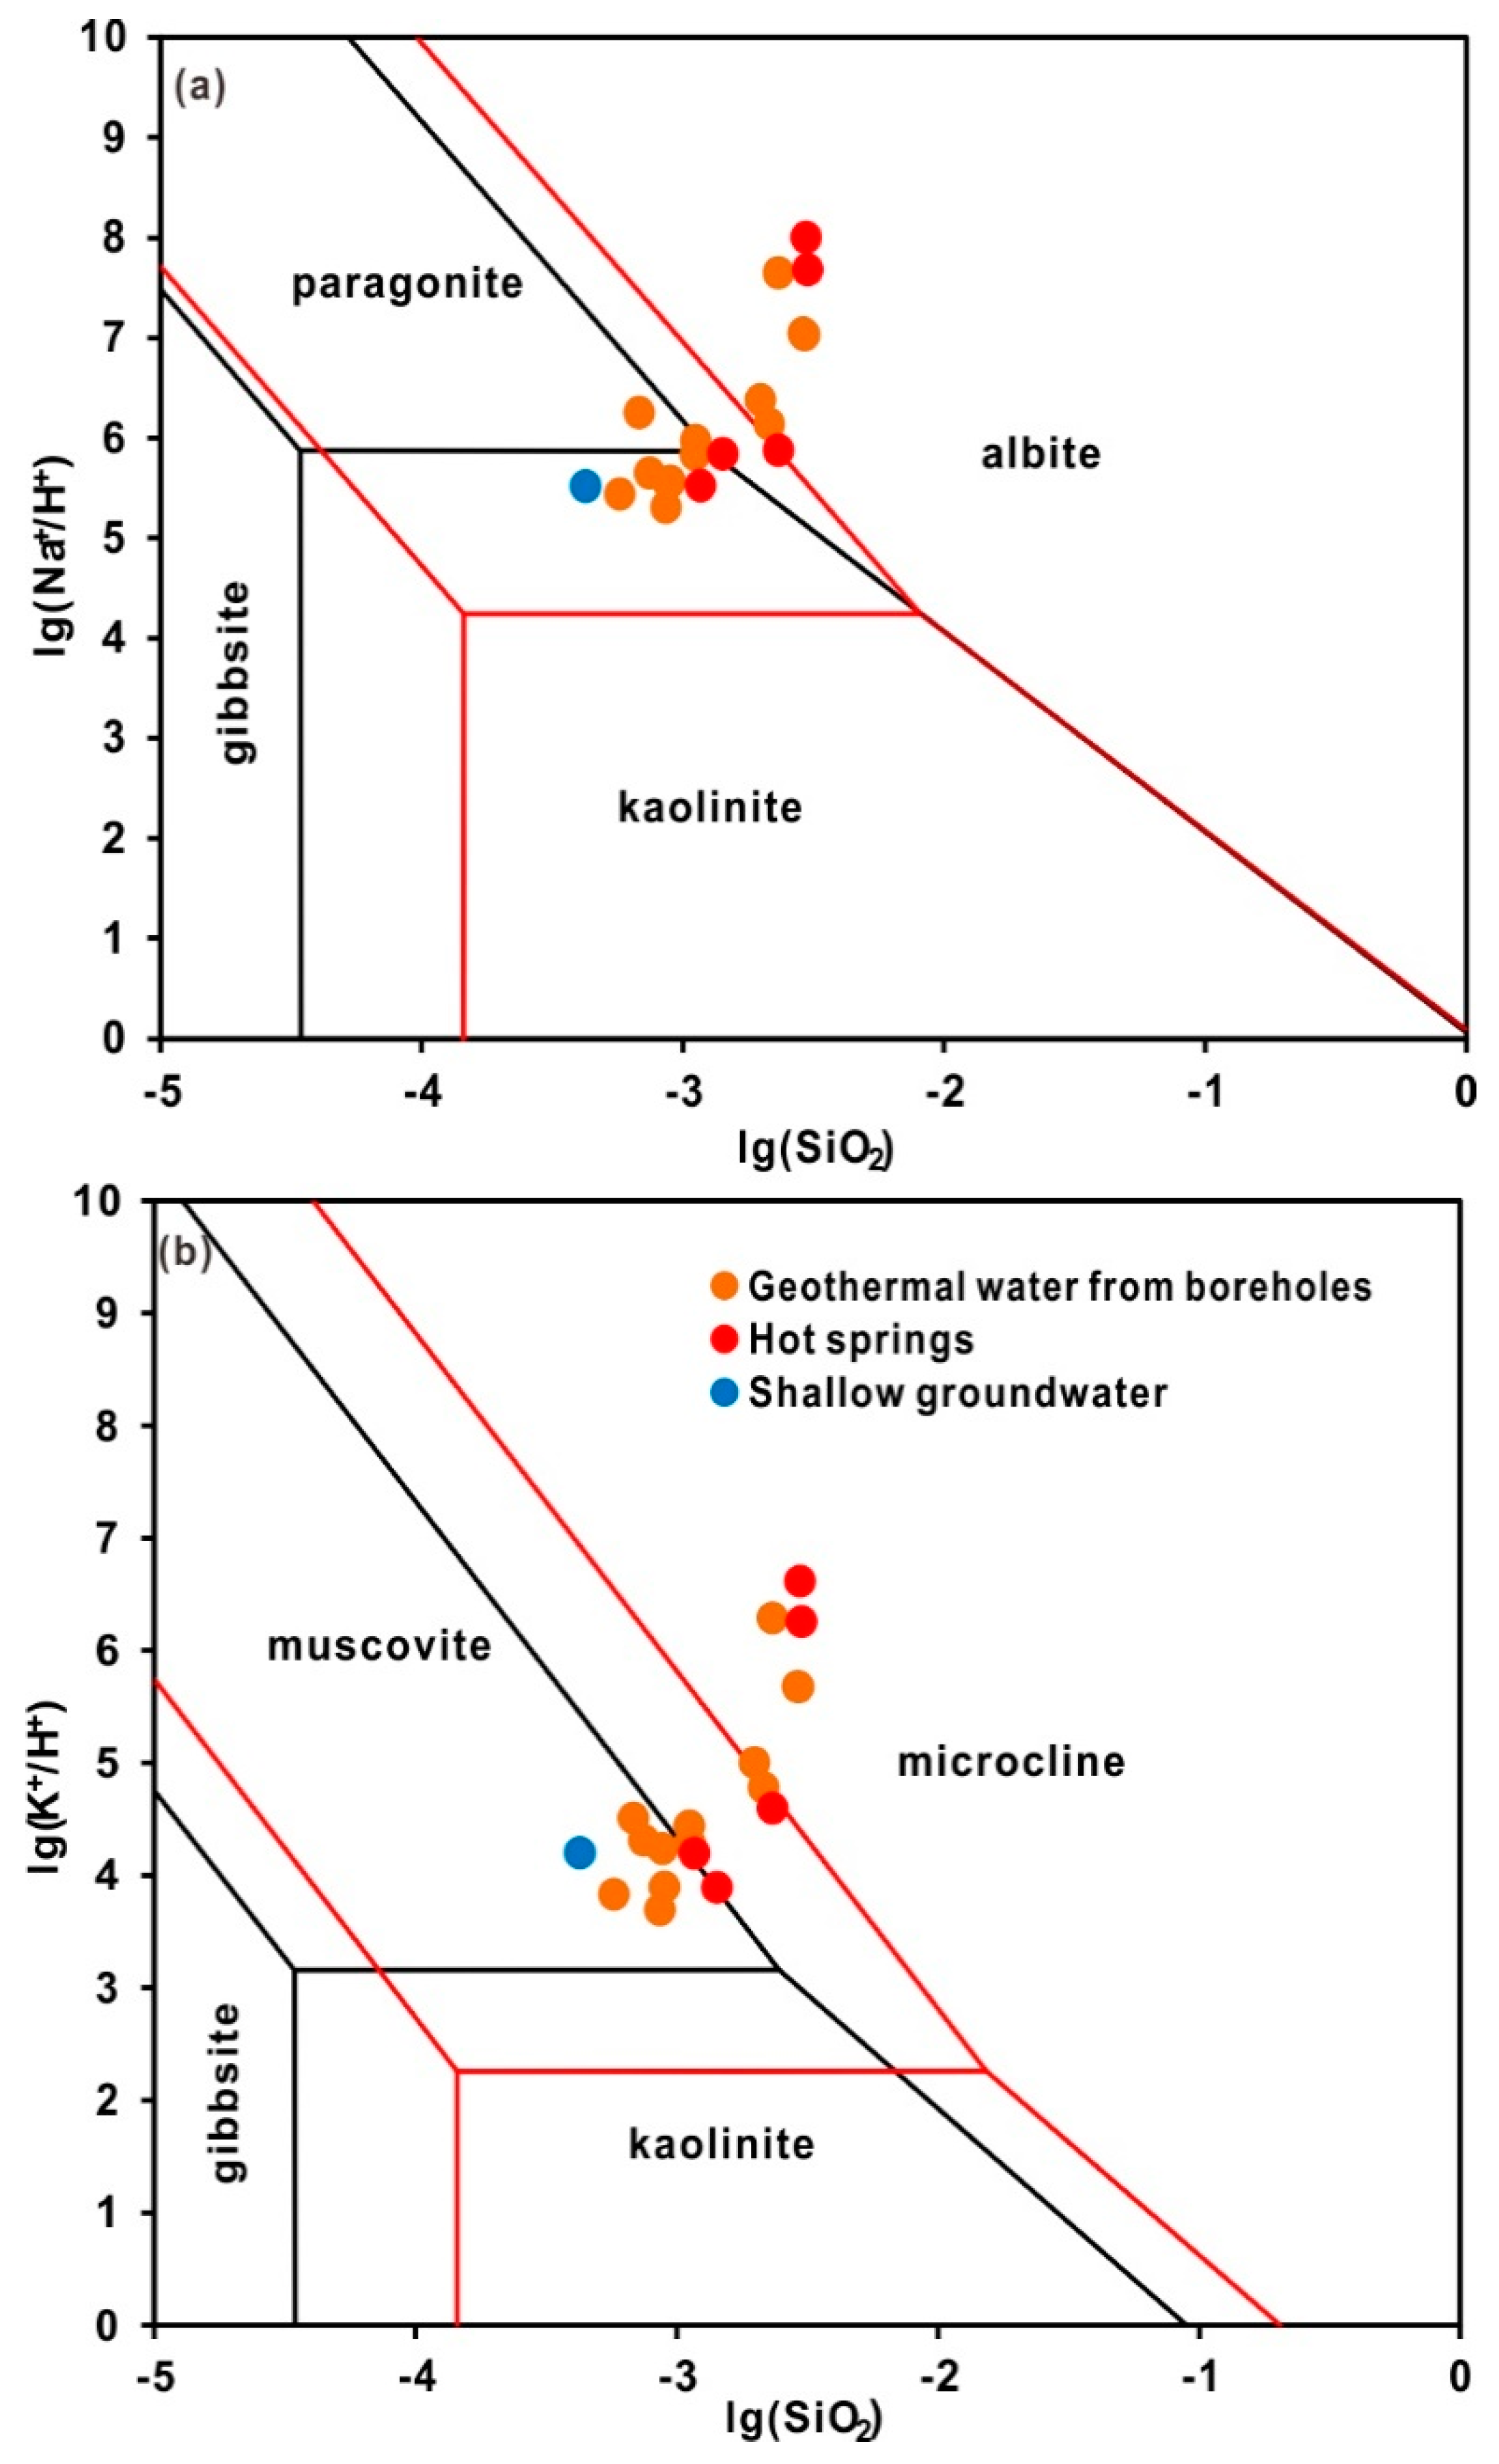
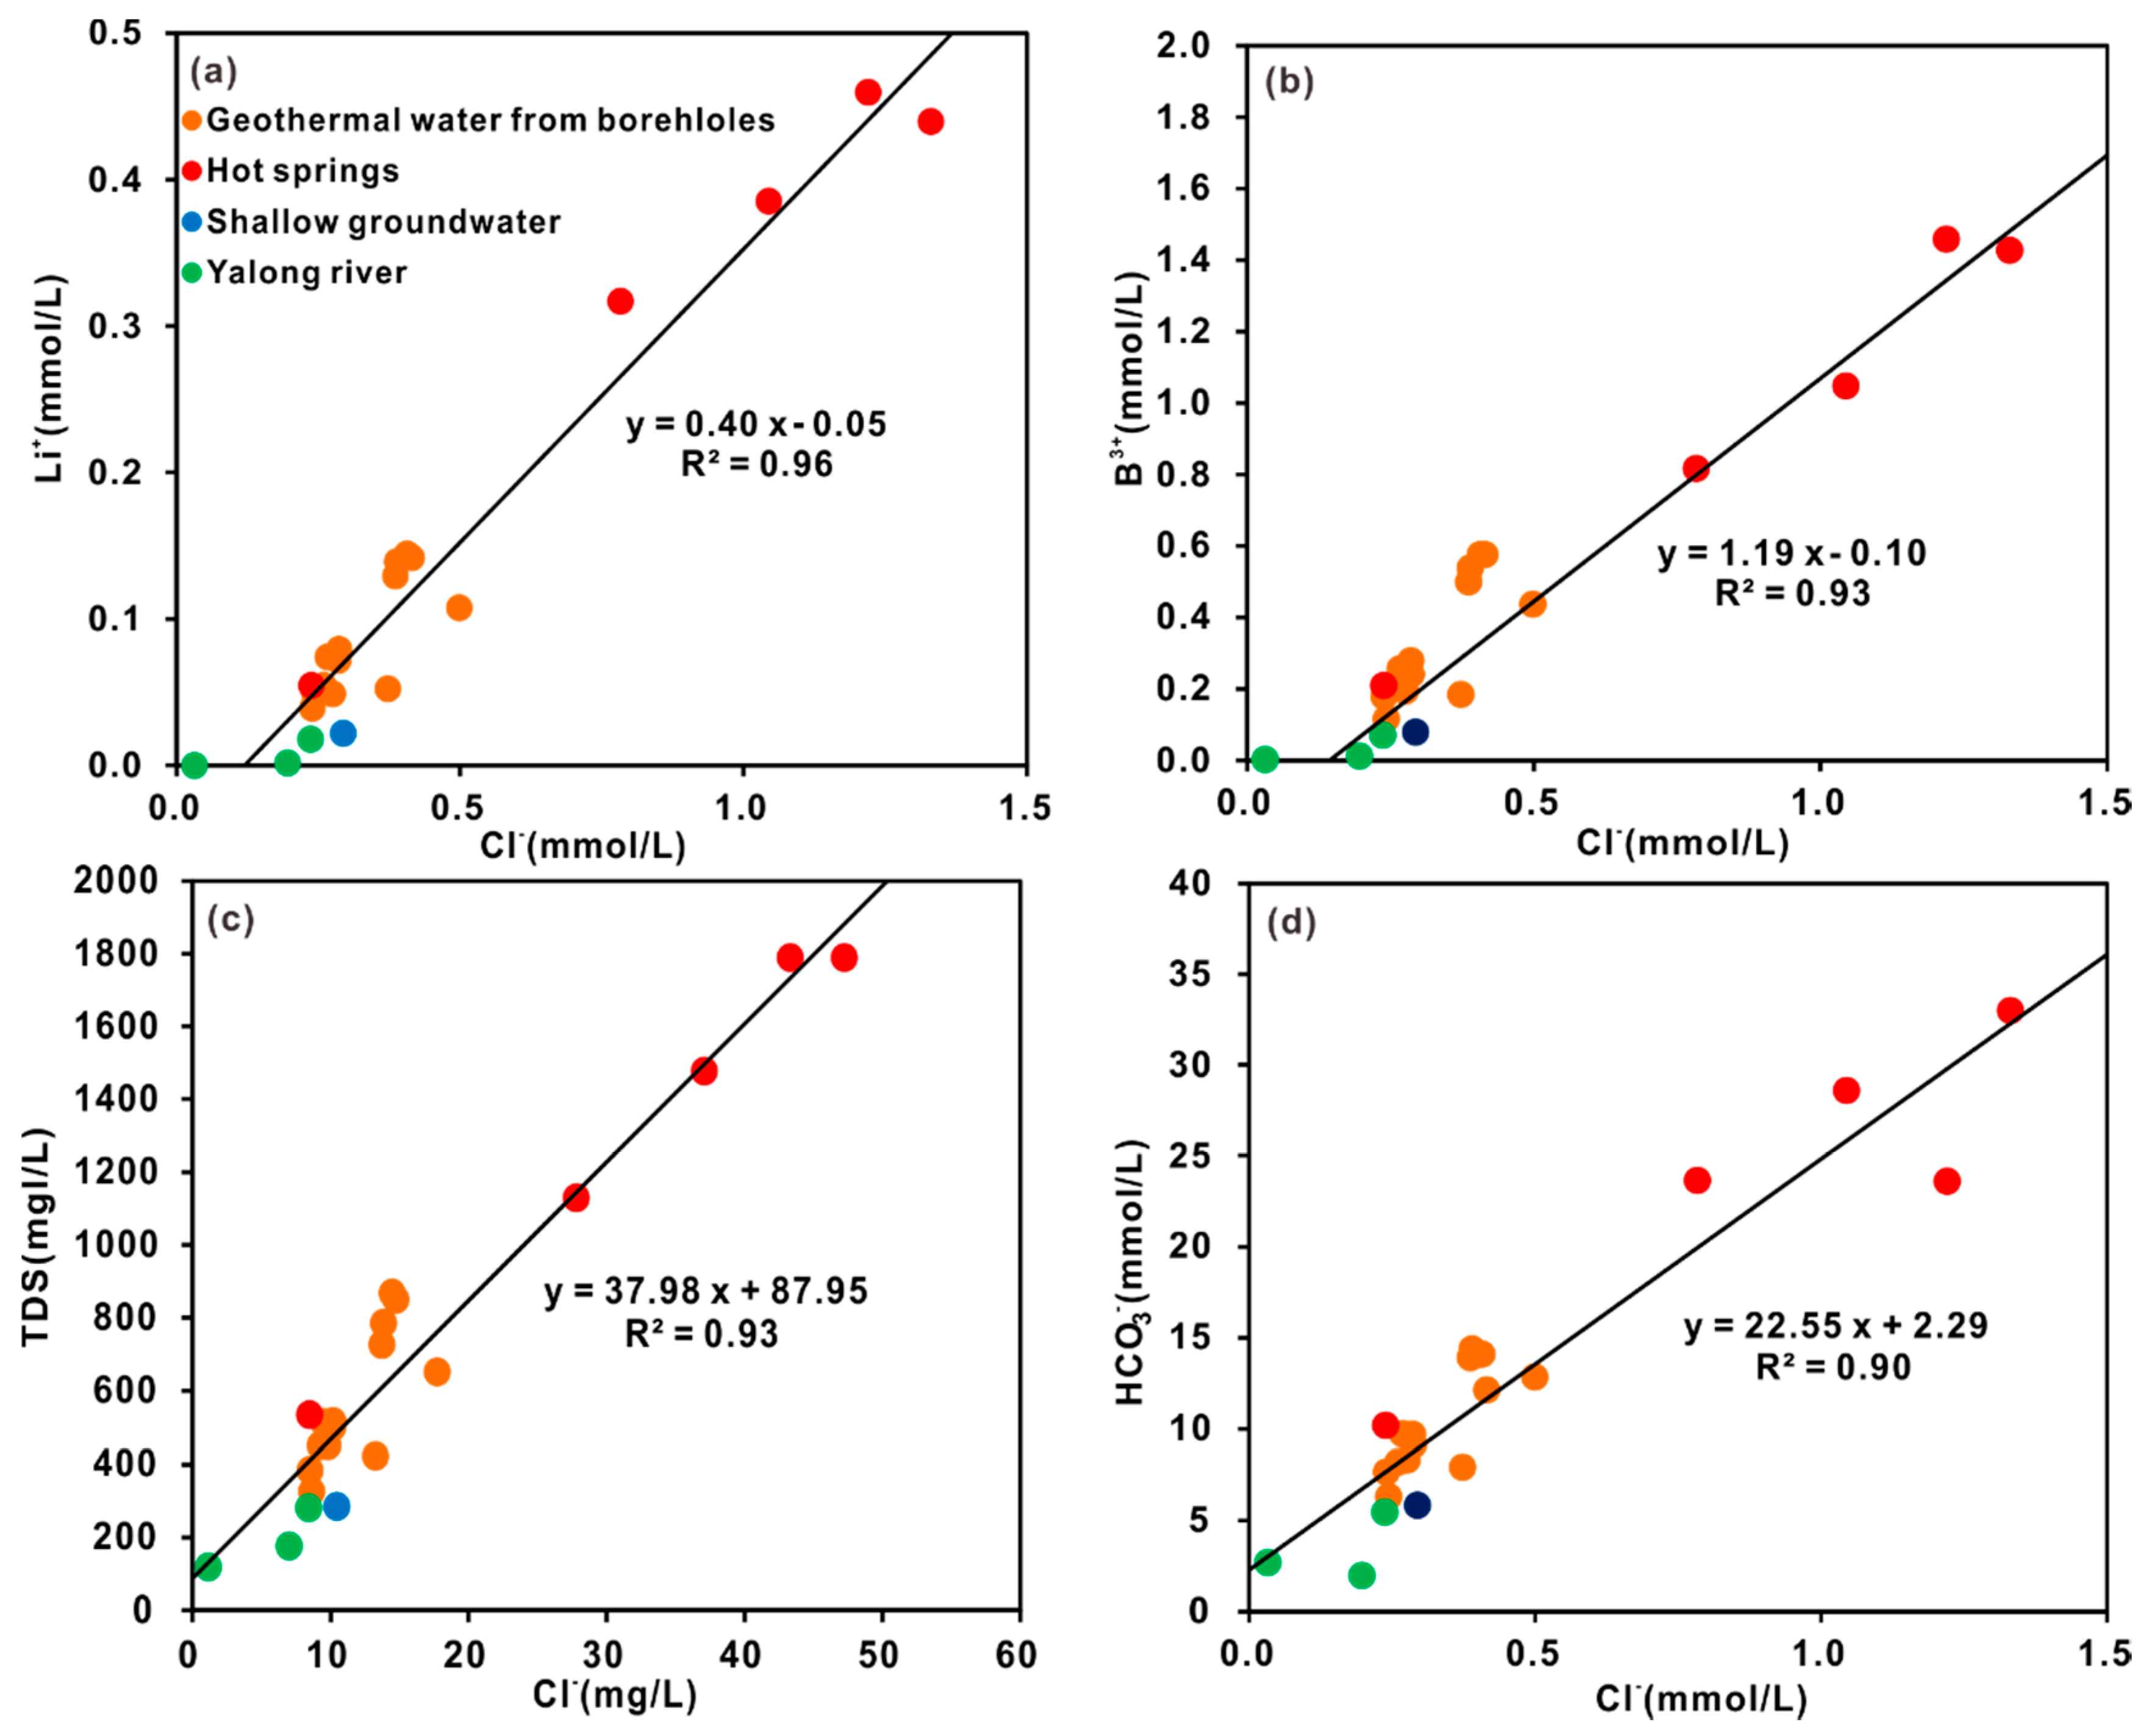
4.2.2. Water-Rock Interaction and Mixing Process

A molar ratio of Na+/Cl equal to 1 is usually attributed to halite dissolution. The correlation diagram shown in Figure 5a shows that the Na+/Cl molar ratio is much higher than 1. Therefore, an additional source of Na+ exists and may be related to the dissolution of silicate minerals in metamorphic sandstone and slate at depth [39]. In addition, if Ca2+, Mg2+, HCO3 and SO42− only come from calcite, dolomite, and gypsum weathering, the milligram equivalent ratio of Ca2+ + Mg2+ and HCO3 + SO42− should be 1. However, the HCO3 + SO42− value is greater than the Ca2+ + Mg2+ value, and the excess HCO3 + SO42− must be balanced by Na+ (Figure 5b). The molar ratio of (Na+ + K+)/HCO3 is approximately 1:1 (Figure 5c). These results indicate that the hydrochemical composition is likely mainly controlled by the dissolution of silicate minerals. Subsequently, the weathering of silicate minerals is estimated based on geothermal water with mineral phase equilibrium analysis [40,41].
The chemical activity plots of the Na2O-Al2O3-SiO2-H2O system and the K2O-Al2O3-SiO2-H2O system are shown in Figure 6. The interaction between hot water and aluminosilicate minerals occurs throughout the rocks underground. The accumulation of chemical elements in solution by the dissolution of endophytic minerals leads to the formation of secondary minerals. Thus, the system can achieve chemical equilibrium and dynamic equilibrium, and establish a balance between the number of elements entering and precipitate from the solution. The water samples all lie in the stability field of albite and paragonite, indicating that Na+ is mainly subject to the dissolution equilibrium of these two minerals (Figure 7a). K+ is mainly controlled by the dissolution equilibrium of muscovite and microcline (Figure 7b). The thermal waters reveal an equilibrium with aluminosilicate minerals, which are predominant in the Triassic reservoirs in the research area. Moreover, Na-HCO3 waters are common in geothermal systems associated with metamorphic rocks with high CO2 contents [42,43]. Therefore, the high concentrations of Na+ and K+ in the geothermal water is due to the dissolution of silicate minerals, including albite, paragonite, muscovite and microcline, by CO2.
Since Cl is conservative, it is usually possible to study hydrochemical processes and groundwater circulation according to the relationship between major ions and Cl [44,45]. The relationships of Li+, B3+, TDS, and HCO3 versus Cl are shown in Figure 7. The linear correlations show a binary mixing line between the shallow water and deep geothermal fluid (Figure 7). As shown in the HCO3 vs Na+ + K+ and Na+ vs Cl correlation plots (Figure 5a,c), the geothermal water samples also plot along an assumed mixing line. The correlation coefficient R2 of the mixing lines are all greater than 0.9, indicating that geothermal water from boreholes and hot springs belong to the same deep geothermal fluid. The deep fluid can mix with shallow water to different degrees while rising to the surface. Based on the analysis of the local geological background, the deep geothermal fluid can rise along the NW-trending faults and subsequently ascends to the surface through different fault intersections, forming hot springs and the geothermal water in boreholes.

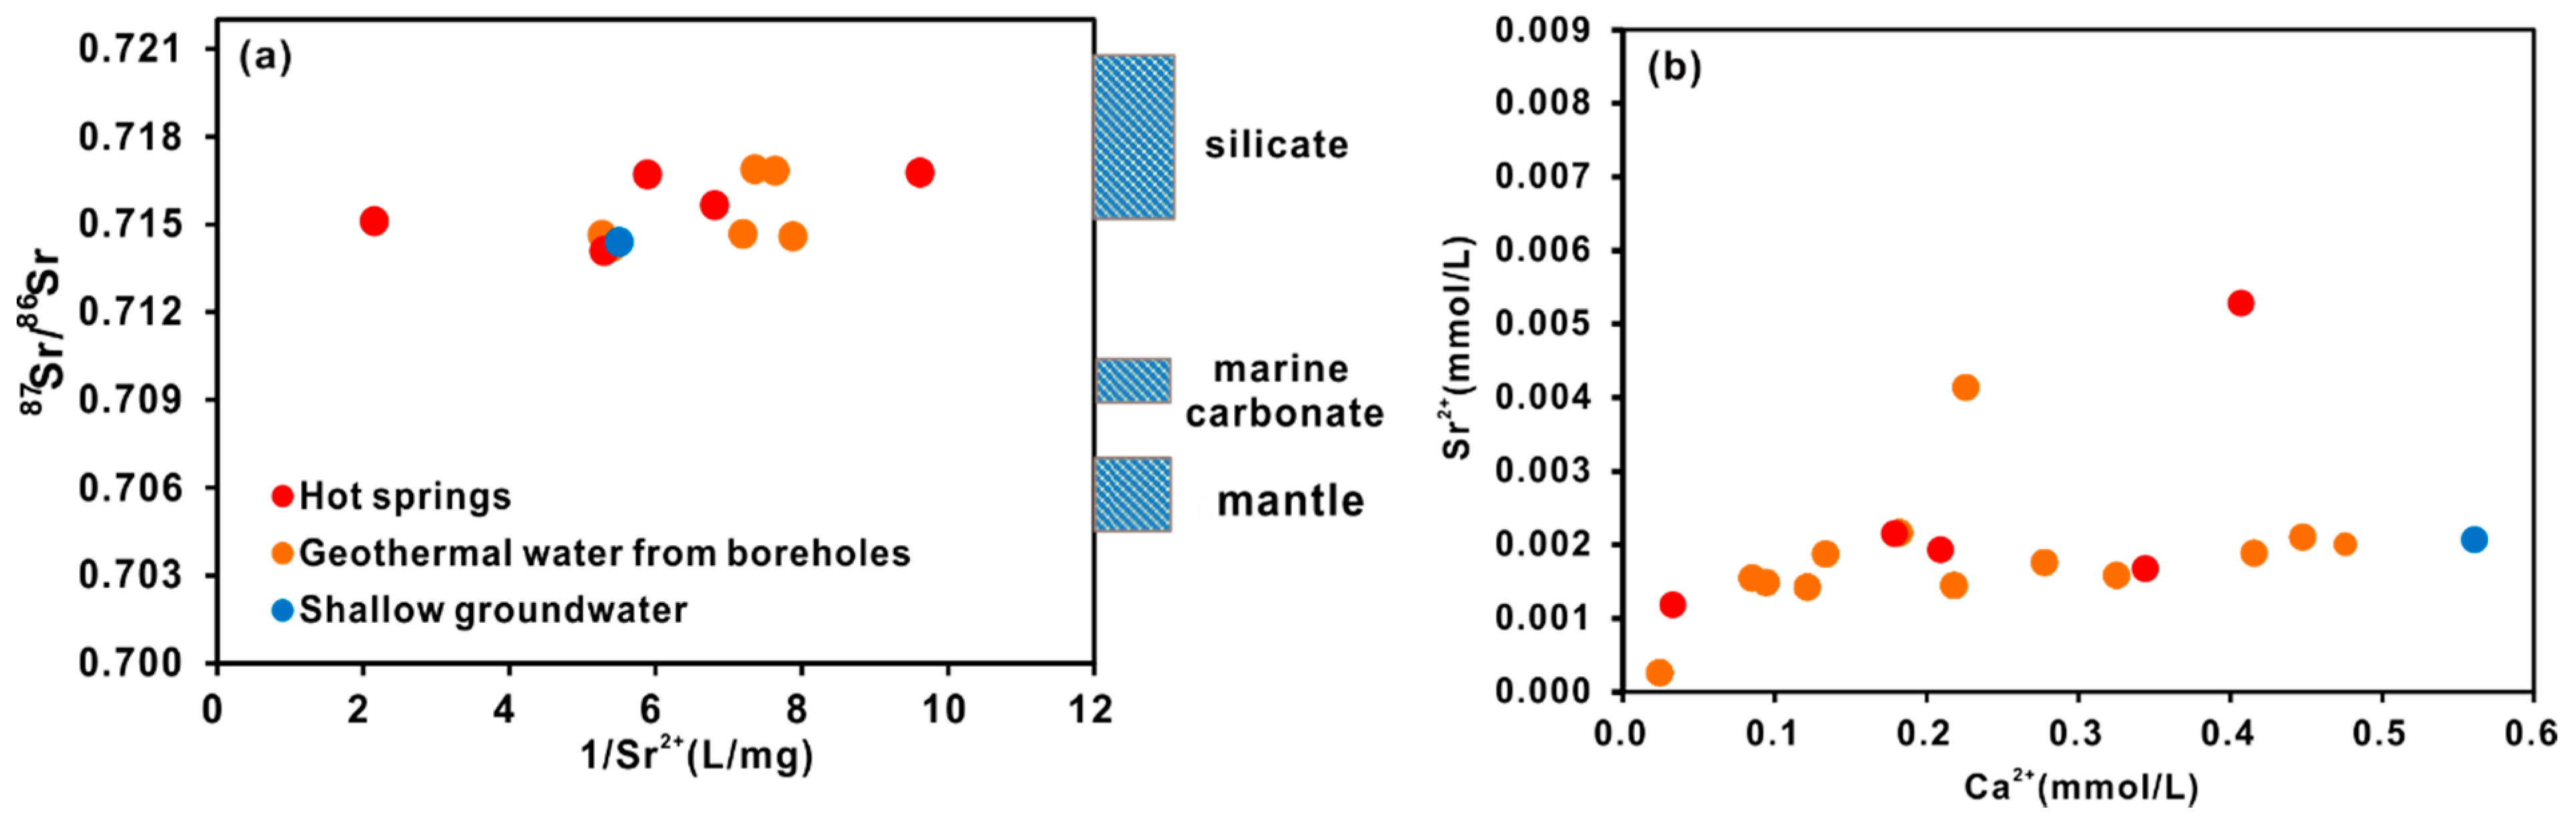
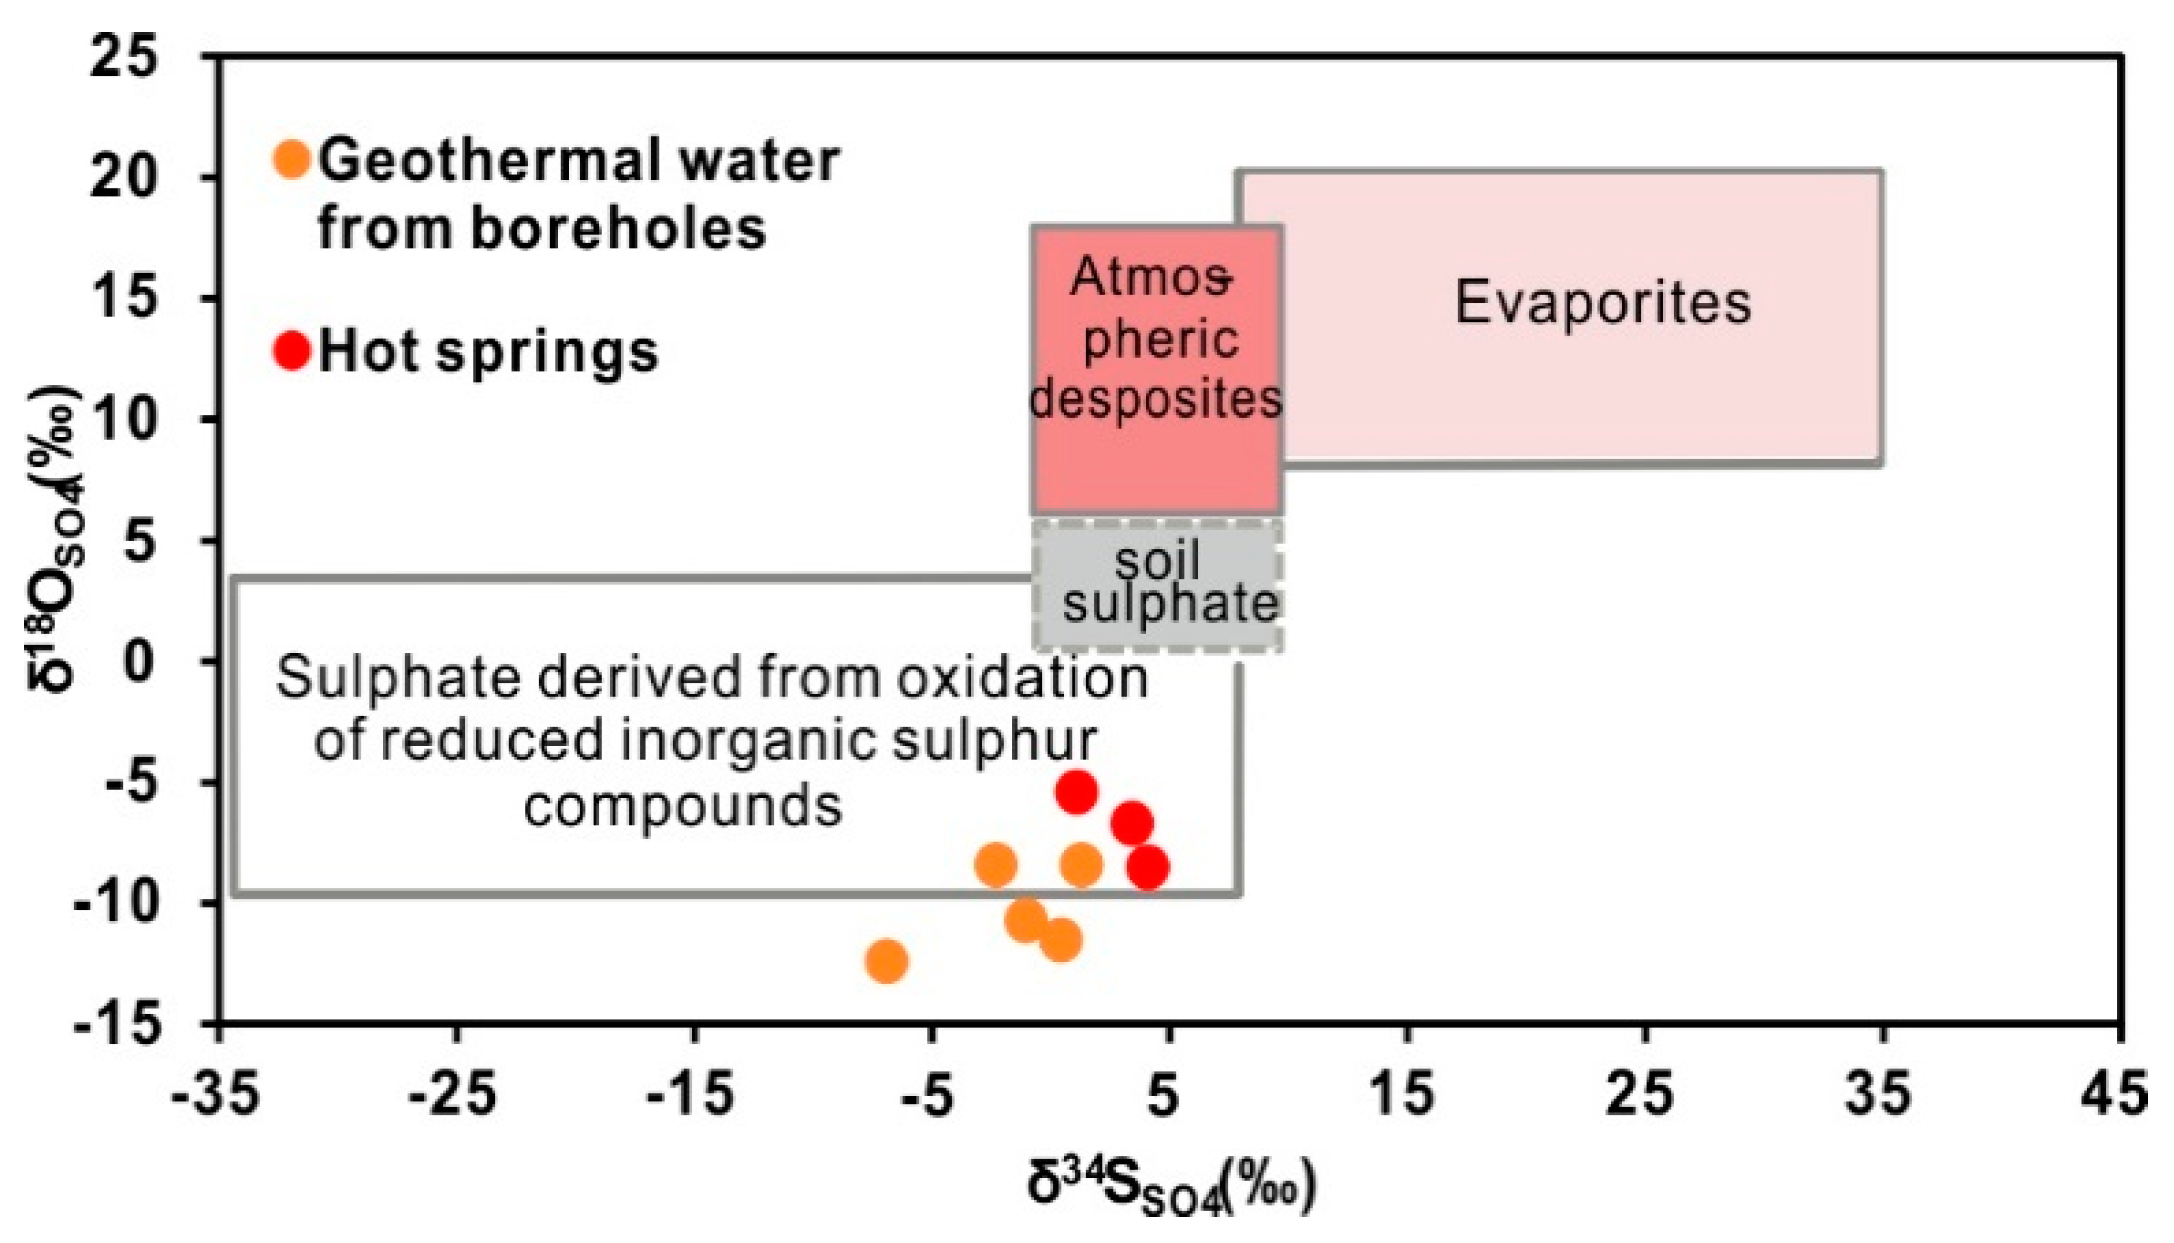
4.2.3. Constraints from 87Sr/86Sr and δ34SSO4

The Sr isotope ratio is an extremely important tracer for effectively constraining mineral weathering in thermal water [30]. Minerals that interact with groundwater have a predictable range of 87Sr/86Sr ratios. The 87Sr/86Sr ratio is determined by the Rb/Sr ratio, the initial 87Sr/86Sr value of the rocks at the time they formed and the age of the minerals. The amount of radiogenic 87Sr varies in rocks and is generated by the decay of 87Rb [46]. However, compared with the half-life of 87Rb (4.88 × 10¹⁰ a), the residence time of groundwater is very short, thus, the radiogenic nature of 87Sr can be neglected in the process of groundwater movement. Strontium isotopes exhibit negligible isotope mass fractionation during mineral dissolution and precipitation due to the large mass number. Therefore, strontium isotopes in the water have the advantage of maintaining the isotopic characteristics of the rocks from which they are derived, such as silicates and carbonates.
Generally, the Sr concentrations in carbonate rocks and evaporites are high, and the 87Sr/86Sr ratios are low. The Sr concentrations of silicate rocks are low, and the 87Sr/86Sr ratios are high [47,48]. The 87Sr/86Sr ratio of 0.707–0.709 in marine carbonates can be used as an end-member based on previous studies [49,50,51]. The 87Sr/86Sr ratio of the silicate rocks in the Yangtze valley in China is usually >0.715 [52]. The homogeneous mantle has an 87Sr/86Sr ratio of 0.702–0.705 [46]. The 87Sr/86Sr values of waters in the Ganzi area are relatively uniform, ranging between 0.714098 and 0.716888, with an average value of 0.715383. The 87Sr/86Sr values fall above the strontium isotope ratio of marine carbonate and are almost covered by the characteristic values of silicates (Figure 8a). Thus, the strontium is mainly controlled by the weathering of silicate minerals. Additionally, the correlation diagram between strontium and calcium shows that the concentration of Sr2+ hardly changes with that of Ca2+. Hence, Sr2+ is not mainly derived from the dissolution of carbonate minerals (Figure 8b). If the dissolution of carbonate minerals were the main process, the strontium concentration would increase with increases in the Ca2+ concentration. The combination of these isotopic data and the local geological setting suggests that hot water flows through the Triassic sandstone and slate reservoir, which is predominantly composed of silicates.
In the geothermal water, sulphate is the second major dissolved anion, with an average concentration of 79.8 mg/L. The maximum concentration of SO42− reached 213.3 mg/L. Sulphate has a wide variety of sources, including natural and anthropogenic sources. The geological constituents, including dissolution of sulphate-rich evaporites, oxidation of sulphides and meteoric precipitation, are the major natural sources [53,54]. Sulphur isotopes can be used to discriminate among the different sources and provide a description of the sulphur cycle. Therefore, the δ34SSO4 values, together with δ18OSO4, are used to help us understand the behaviour of sulphate in the geothermal water.
Human activity in the research area is rare, so anthropogenic sulphate can be excluded. Taking the cities of Chengdu and Lhasa as references, the sulphate concentration in precipitation in Chengdu is 10.6 mg/L on average and that in Lhasa ranges from 0––9.4 mg/L, with an average of 1 mg/L [55]. In contrast, the average SO42− concentration of the geothermal water in Ganzi is approximately 79.8 mg/L. The significant difference between precipitation and geothermal water indicates that sulphate in precipitation does not play an essential role in the sulphur budget of the geothermal water.
The dissolution of gypsum or anhydrite does not produce significant and measurable isotopic effects [35,56,57,58]. The δ34SSO4 values show a wide range, varying from −6.9‰ to 4.1‰, with an average of 0.02‰. However, the δ34SSO4 values of the Triassic gypsum in the north-eastern Sichuan basin range from 18.1–25.8‰ [59]. The δ34S values of Triassic anhydrite in the Sichuan basin range from 20.99–39.64‰ [60]. The δ34SSO4 values in our analytical results are markedly below those of the typical evaporite minerals. Therefore, the contribution of evaporite dissolution to the sulphate of thermal water can be neglected. In contrast, the δ34SSO4 value is low, which is similar to that of pyrite in rocks. The δ34SSO4 value of Triassic pyrite in rocks is 2.13‰ [59]. Toran and Harris (1989) [61] summarized the isotopic effect of the process of sulphide oxidation, and the results show that the δ34S values in SO42− decreases by 2–5.5‰ during the biological oxidation of sulphide. Therefore, the δ34SSO4 value produced by oxidation of pyrite is −3.37–0.13‰. The average δ34SSO4 value of the geothermal water lies in the range of δ34SSO4 values produced by the oxidation of sulphide. Furthermore, the secondary alteration mineral pyrite is present in many places along fracture surfaces below the depth of 120 m [25]. These findings jointly indicate that the SO42− in the geothermal water is mainly derived from the oxidation of pyrite.
Additionally, in the sulphate source classification diagram, the samples mainly plot in the field associated with the oxidation of reduced inorganic sulphur compounds (Figure 9) [62]. The points falling below the sulphate reduction field may be ascribed to oxygen isotope exchange between sulphate ion and water. Since the oxygen isotope values of the water are low, the oxygen isotope values in sulphate are also low because of isotopic exchange.

4.3. Origin of Geothermal Gases

The compositions of the gas samples are shown in Table 2. The volume percentage of CO2 varies greatly from 6.08% to 91.05%, with an average value of 53.62%. The volume percentage of N2 also widely ranges between 6.36% and 82.93%, with an average value of 38.51%. The CH4 concentrations range from 0.66% to 11.37%. The O2 concentrations are lower than 5%, with the exception of the concentration of sample GZ53 (5.25%). The He, Ar, and H2 concentrations are each no more than 2%. The gases are characterized by the absence of H2S, HCl, SO2, and other acidic gases.

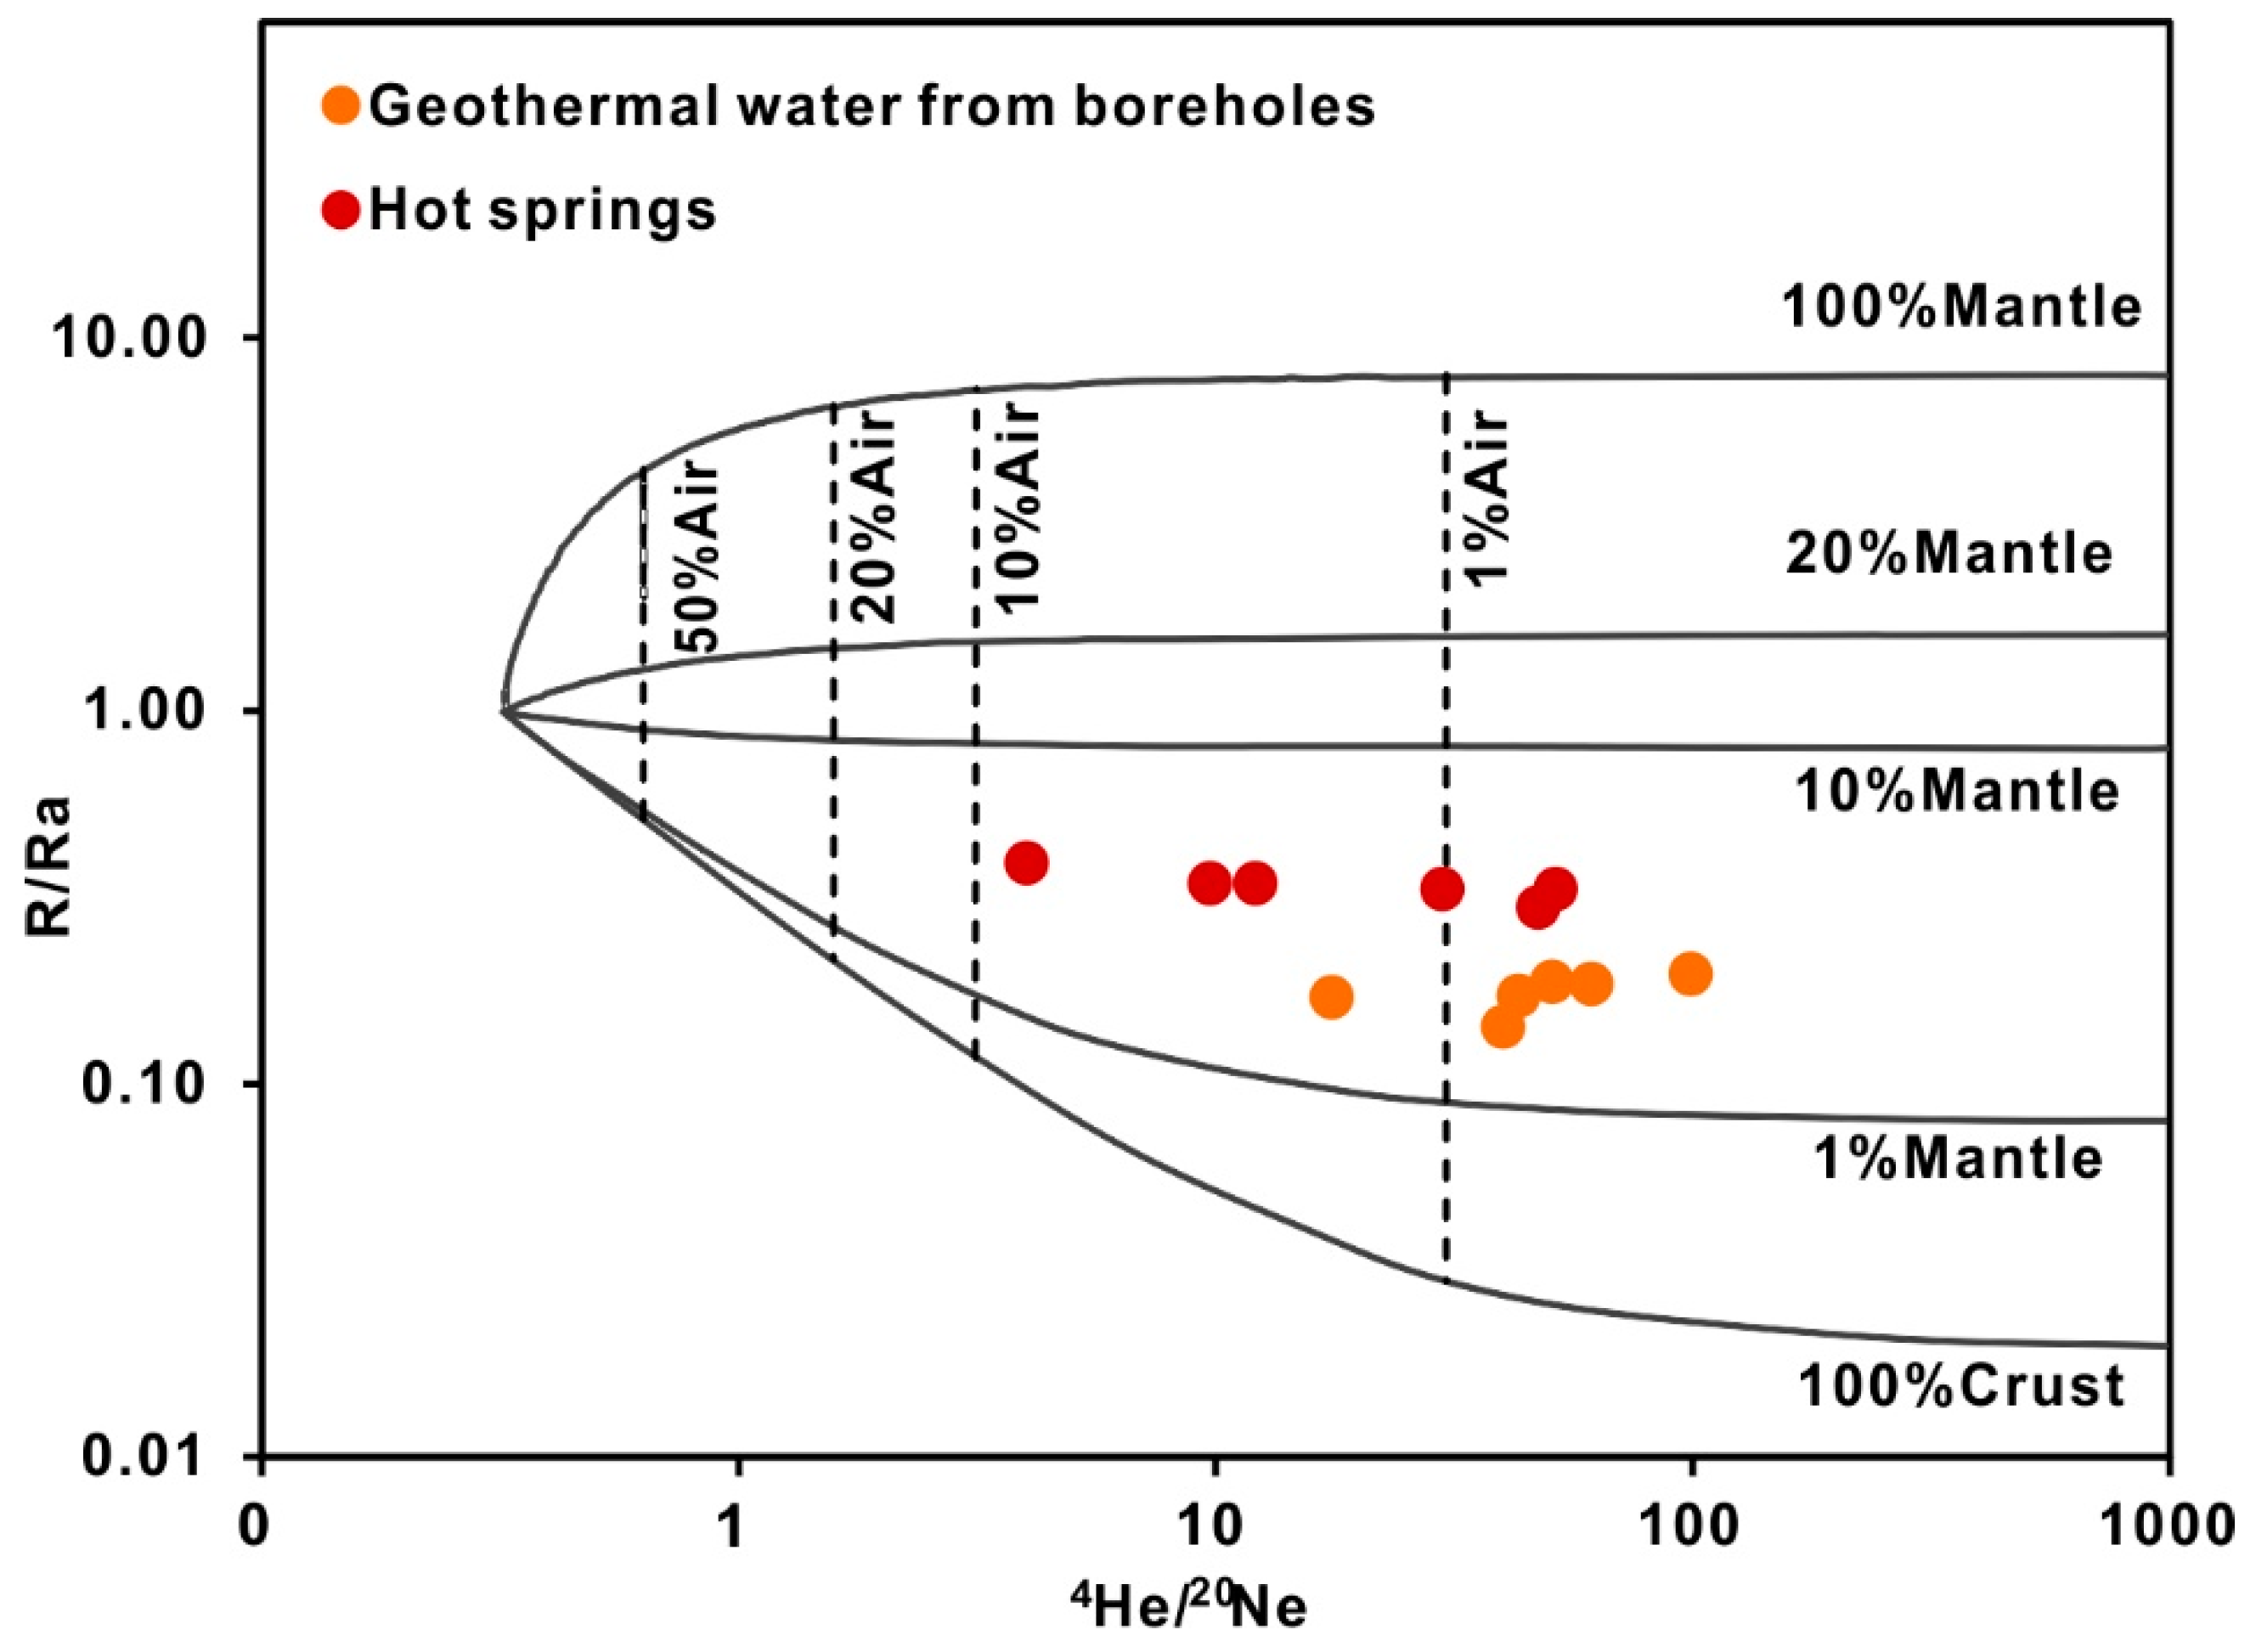
4.3.1. Helium Isotope

Noble gases can be used as a basic indication of gas origins due to their chemically inert nature. Helium is an excellent tracer for demonstrating the influence of crustal and mantle volatiles [63,64,65]. 3He is derived from the mantle, and 4He is mainly produced by the radioactive decay of U and Th in the crust [66,67]. Therefore, the ratio of 3He/4He can be used to study the material source contribution ratio of the crust and the mantle in geothermal systems. The 3He/4He ratio is usually expressed by R, and the 3He/4He ratio in the atmosphere is usually expressed by Ra. The value of Ra, i.e., 1.384 × 10⁻⁶, is basically constant [63]. The R/Ra ratio in the mantle (represented by mid-ocean ridge basalt, MORB) is approximately 8 [63,68]. However, the R/Ra ratio in the crust rarely exceeds 0.02 [69]. Gas isotope geochemical analyses also use the 4He/20Ne ratio to determine the influence of the atmosphere on samples. The 4He/20Ne isotope ratio in the atmosphere is approximately 0.318 [70]. The air pollution of most gas samples is less than 1%, and for individual samples, it is less than 10% (Figure 10). The 4He/20Ne isotope ratios of the crust and the mantle are both approximately 1000 [63]. The plot of the R/Ra ratio versus the 4He/20Ne ratio can be used to identify the gas origin (Figure 10). Samples from the Ganzi geothermal fluid yield 3He/4He ratios of 0.17−0.39 Ra, indicating that no more than 5% of the He is derived from a mantle source. The contribution of mantle material to the gas in this system is very weak. Thus, the He mainly comes from atmospheric and crustal sources.

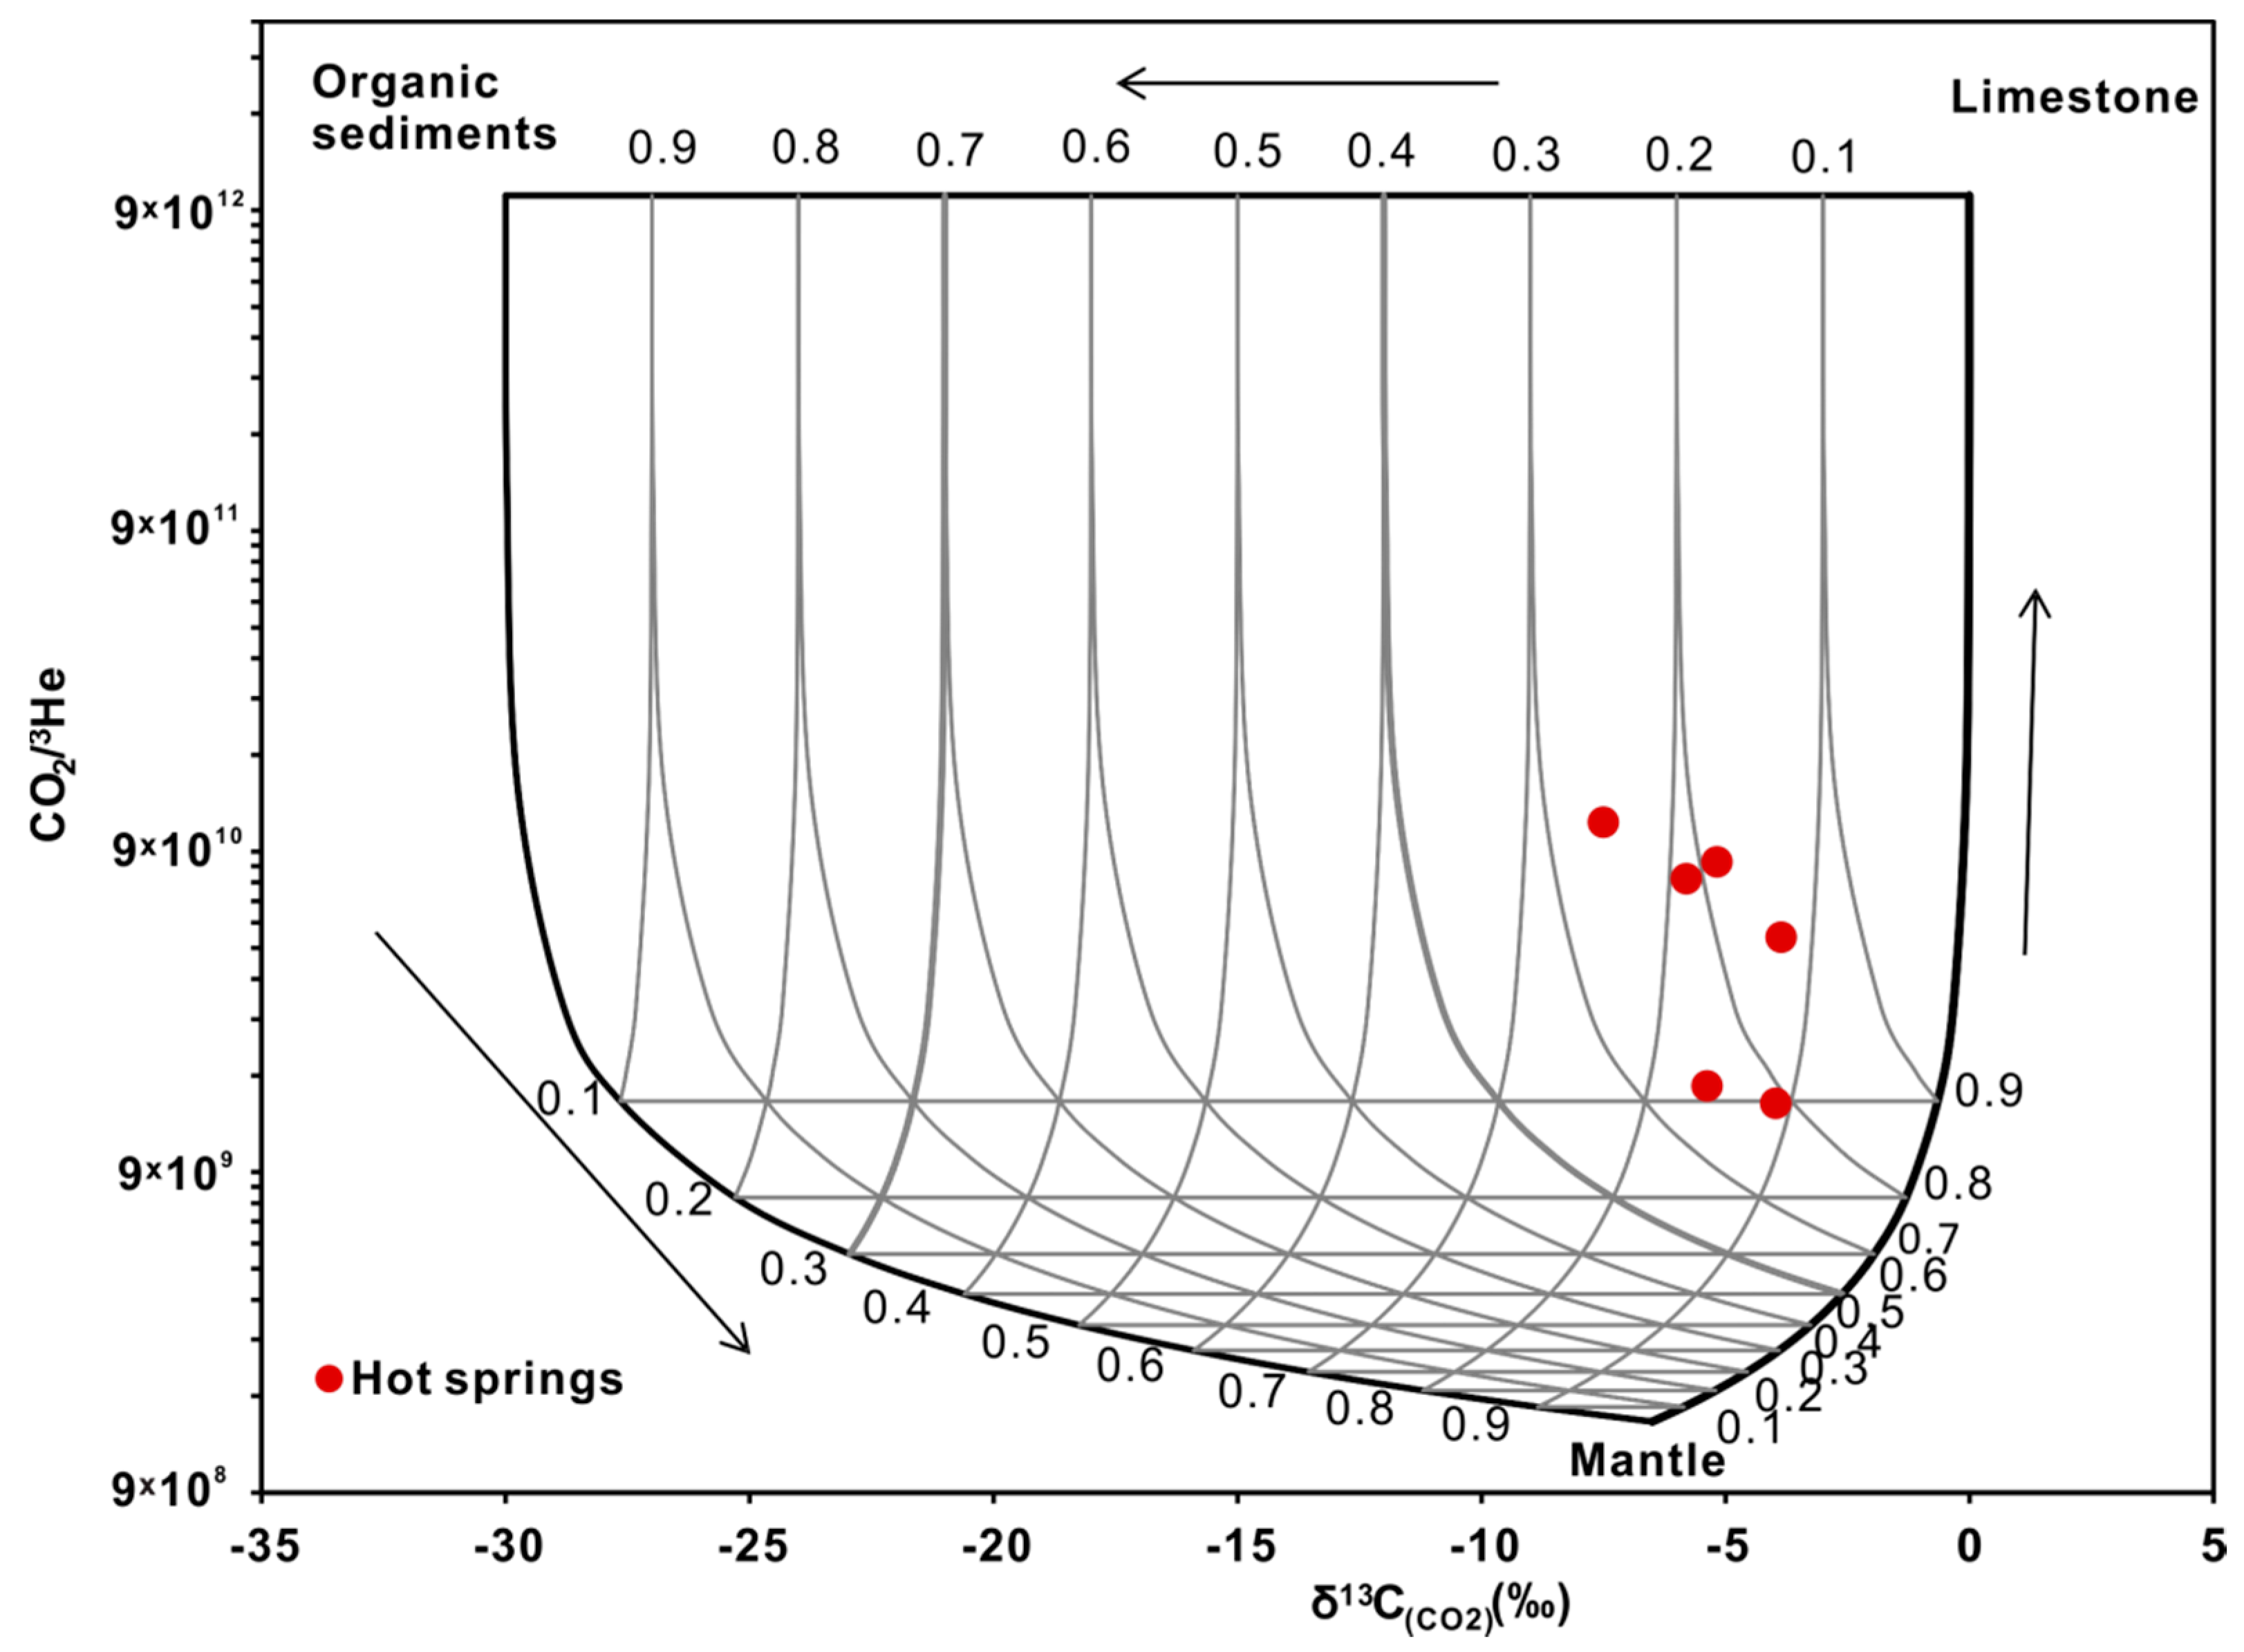
4.3.2. Carbon Isotopes

The study of the carbon isotopic composition of geothermal gases is of great significance for determining the origin of CO2 and understanding the genesis of the geothermal system [71]. There are three main sources of CO2: marine limestone, sedimentary organic carbon and mantle components [72]. These carbon end members have different δ13CCO2 isotopic compositions. The δ13CCO2 value of marine limestone is close to 0‰, that of sedimentary organic carbon is low, i.e., less than −20‰, and that of gas derived from the upper mantle is −6.5 ± 2.5‰ [73,74]. As shown in Figure 11, the carbon isotopic composition of CO2 and the CO2/3He ratio can jointly indicate the source of CO2 [74]. The contribution percentage of marine limestone to the CO2 in the geothermal gas is 74–86%, with an average value of 80%, and the contributions of sedimentary organic and mantle sources are markedly lower. Therefore, CO2 is mainly derived from the high-temperature metamorphism of marine carbonate rock. The contribution ratio of each end member is shown in Table 2. The study area features Carboniferous-Permian limestone beneath the Triassic sandstone and slate, and this limestone likely represents the source of the CO2 [26].

4.4. Geothermal Reservoir Temperature

4.4.1. Chemical Geothermometers

Chemical geothermometers use empirical or experimental calibrations to determine the reservoir temperature based on chemical equilibrium reactions. These methods include silica geothermometers and cationic geothermal thermometers. Whether the chemical geothermometers are appropriate depends on their applicable calibration temperature, the controlled mineral balance phases, and the sensitivity to compositional changes during the ascent of the hot water to the surface [27]. Silicate minerals in reservoirs dissolve rapidly in CO2-rich waters, hence, neither quartz nor chalcedony precipitation comes up to it for kinetic reasons. Therefore, silica geothermometers are not suitable for this area.
The various assumptions should keep in mind to predict subsurface temperatures in geothermal systems. The Na-K geothermometer is controlled by the equilibrium between the geothermal water and alkali feldspars. This relationship is consistent with the equilibrium minerals in the Ganzi geothermal field. The systems involving Na-K are likely to respond most slowly to temperature changes and to maintain deep equilibration temperatures. Also, Na-K geothermometer is unaffected by mixing with cold water during ascent. Due to the water cooling by conduction or boiling, the feldspars including albite and microcline re-equilibrate in response to the decrease of temperature. Even so, the Na/K ratio is not affected by conduction or boiling because aluminium is a governing factor for the precipitation of feldspar [75]. Therefore, the Na-K geothermometer should give a reliable result in the Ganzi geothermal field. The calculation results of Na-K and Na-Li geothermometers [76] are shown in Table 3. The Na-K geothermometer provides an average reservoir temperature value of 192 °C, which is similar to the result from the Na-Li geothermometer of 198 °C. The Na-Li geothermometer is controlled by complete equilibrium reactions of mineral assemblages, including albite, K-feldspar and clay minerals [77]. Moreover, the most widely used cation geothermometer is the Na-K-Mg triangle diagram proposed by Giggenbach (1988) [75], as shown in Figure 12. This method assumes that geothermal water has reached an equilibrium state in the reservoir with the mineral assemblage of albite, potassium feldspar, muscovite and chlorite in the surrounding rock. The Na-K-Mg ternary diagram can be used to classify hot waters as fully equilibrium with rocks, partially equilibrium, or immature. This indicates whether solute thermometers are suitable for geothermal water. A few water samples of Ganzi geothermal water are distributed near the fully equilibrated mineral dissolution line. In these cases, the water-rock reaction reached equilibrium, suggesting that the Na-K-Mg geothermometer is adequate for the study area. The reservoir temperature obtained from the Na-K-Mg triangle plot is approximately 200 °C. Water samples are distributed along the mixing line, indicating a tendency to mix with cold water. Given the good agreement between the results calculated by the Giggenbach diagram, Na-K and Na-Li geothermometer, the reservoir temperature of the Ganzi geothermal water can be approximately estimated to ca. 197 °C.

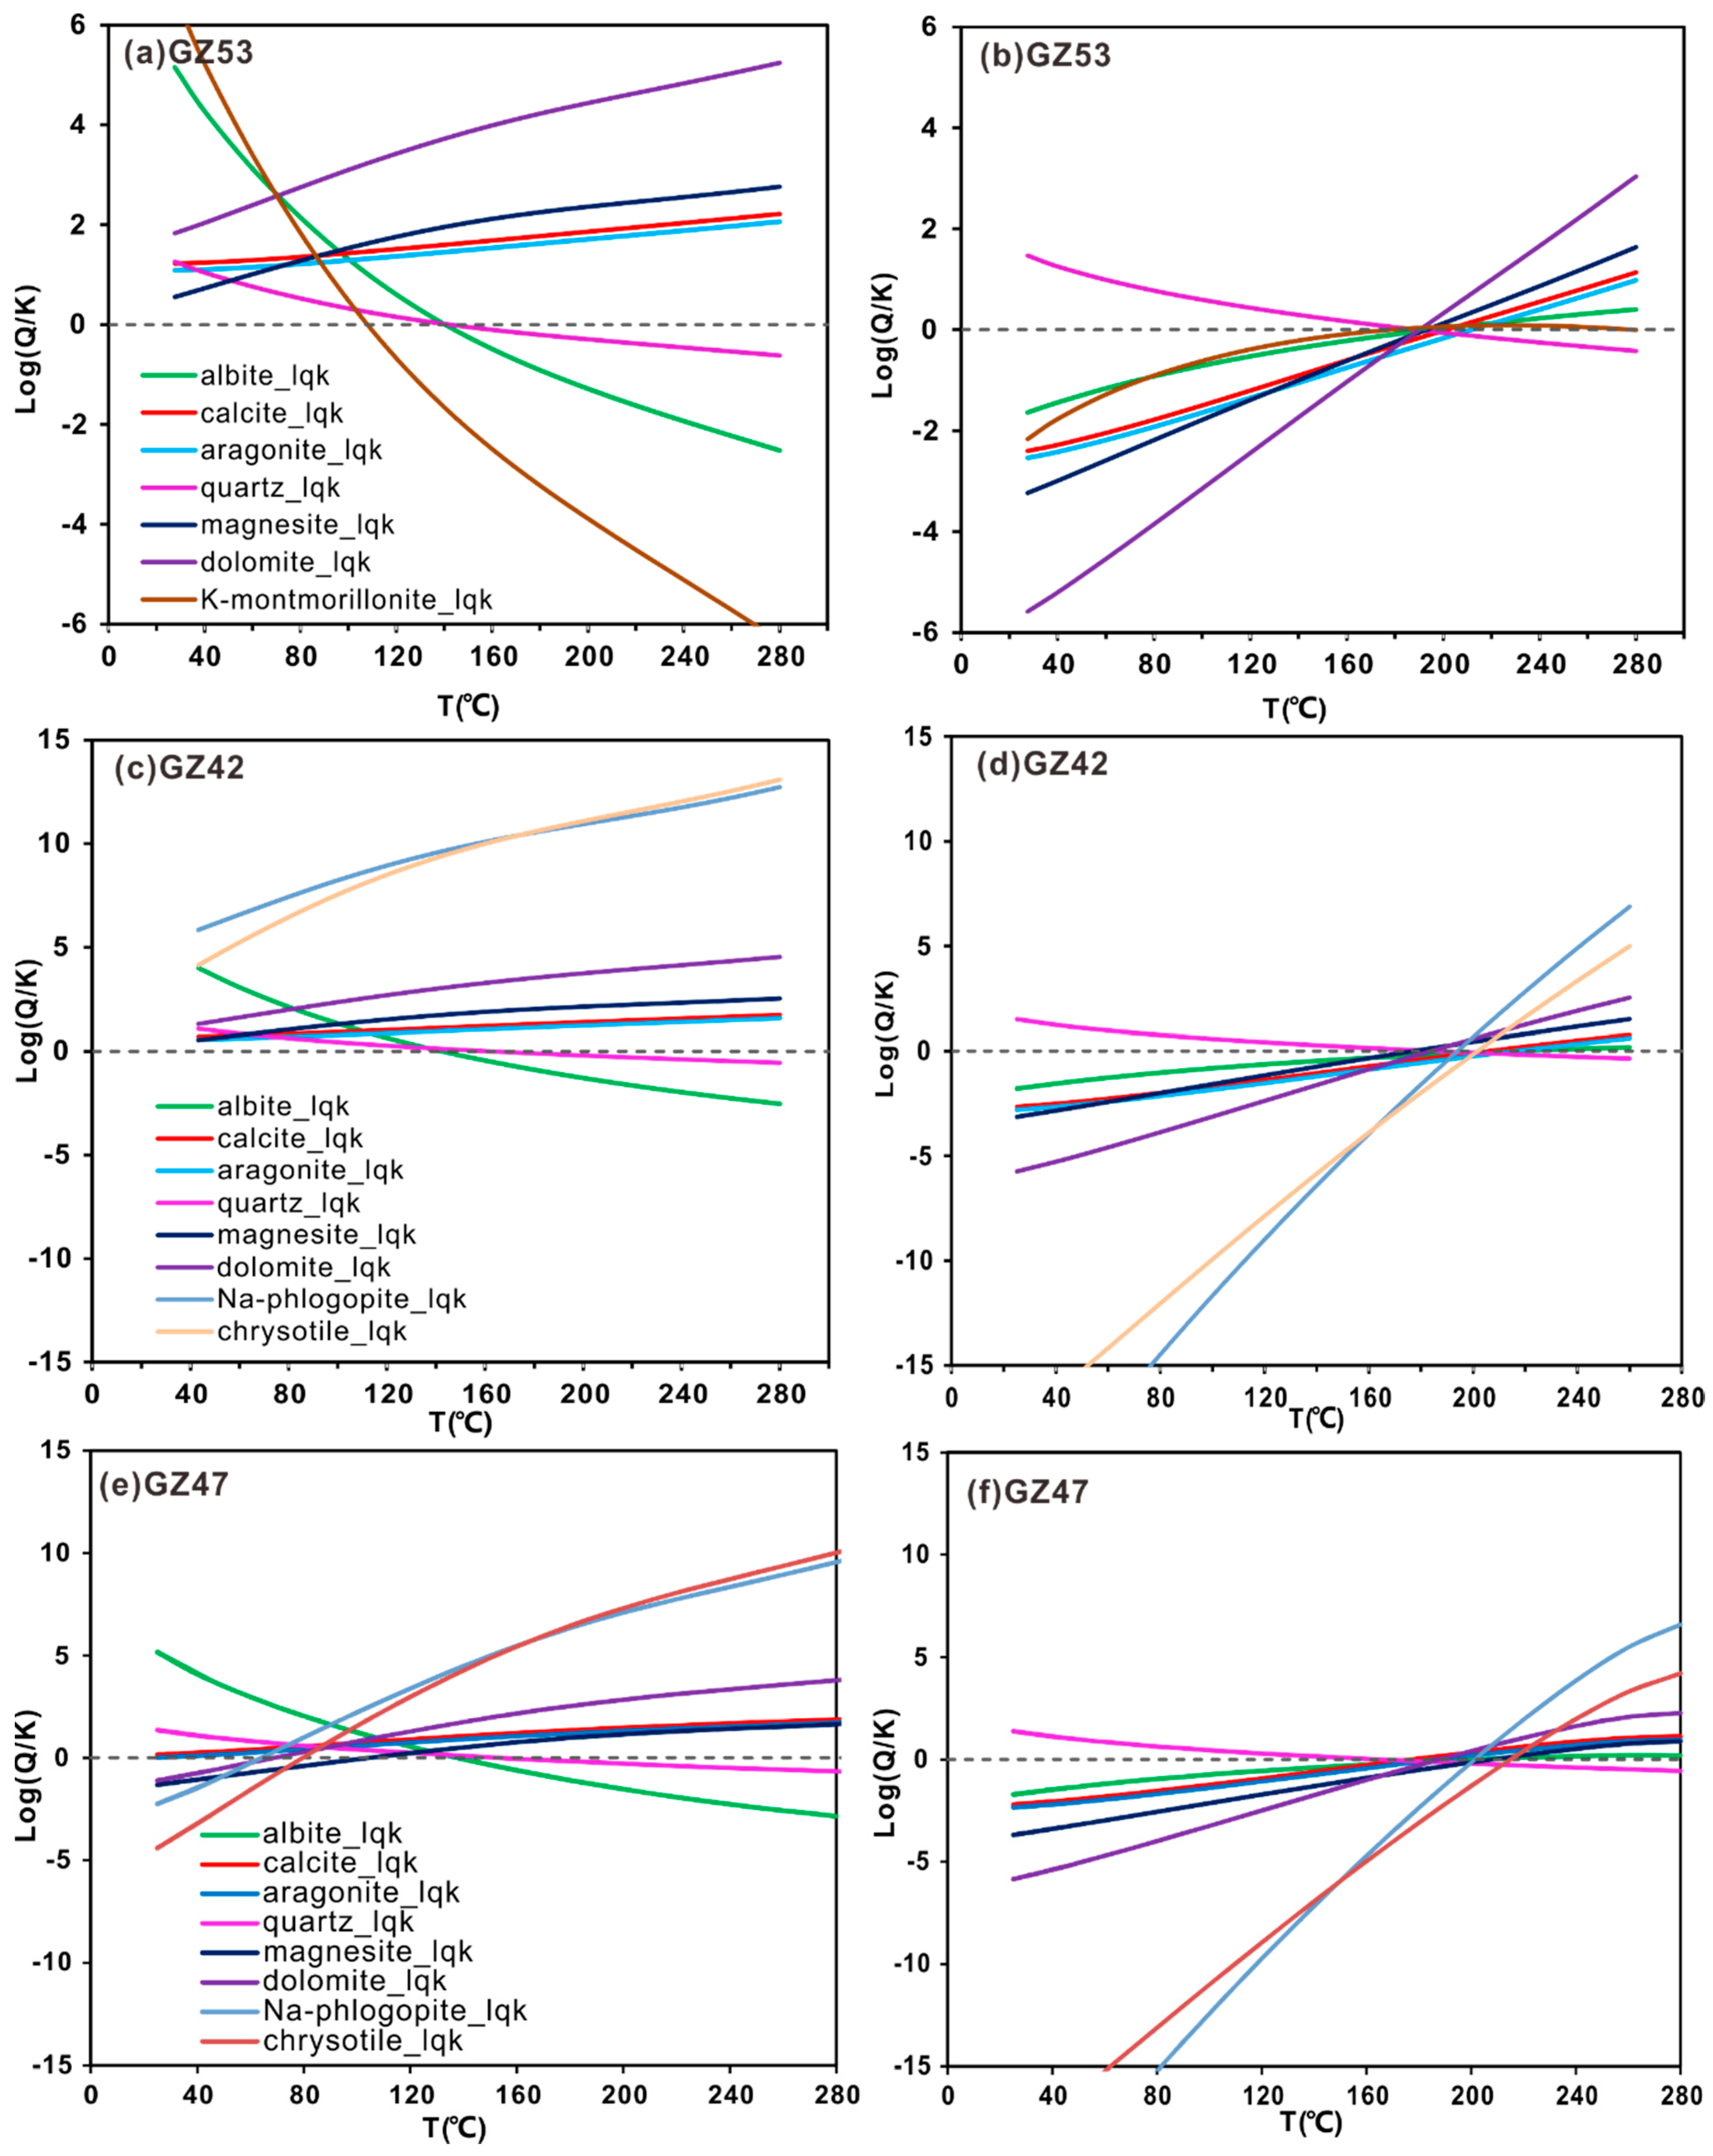
4.4.2. Geothermometrical Modelling

Reed and Spycher (1984) [78] first proposed the application of a geochemical thermodynamic simulation to constrain the deep reservoir temperature of a geothermal fluid. As with the classical solute geothermometers, the main basis assumption of multi-component geothermometer is that there is a chemical equilibrium (or approximately equilibrium) between the deep geothermal fluid and some minerals in the reservoir. Compared with chemical geothermometers for geothermal water, this method has the advantage of identifying multi-mineral equilibrium and recognizing secondary processes, such as CO2 degassing, during fluid ascent [78,79,80]. Geothermometrical modelling progressively simulates temperatures to obtain the equilibrium temperature of the water and a set of minerals. The saturation indexes at different temperatures are calculated by the SOLVEQ-XPT code according to the chemical composition of the geothermal water. The selection of the mineral set depends on the reservoir lithology and hydrogeochemical characteristics. Therefore, the curves of mineral Log(Q/K) with increasing temperature are plotted in Figure 13. The GZ53, GZ42, and GZ47 samples are presented as representative samples. The GZ53 sample is shown to have almost reached the equilibrium state because it is close to the equilibrium line in the Giggenbach ternary diagram. GZ42 and GZ47 samples are as representatives of partially equilibrium samples in the Na-K-Mg ternary diagram. The primary results before corrected are shown in Figure 13a,c,e and saturation indices cannot converge to zero. CO2 degassing has a strong effect on the pH of the liquid, which influences the mineral equilibrium. Therefore, to eliminate the effect of CO2 degassing, equal amounts of HCO3 and H+ are added to geothermal water to generate additional CO2 [79]. In the GZ53 sample, the assumed equilibrium mineral phases are albite, calcite, dolomite, quartz, chalcedony, K-montmorillonite, aragonite, and magnesite. Additionally, 0.5 mol/L CO2 was added into the fluid to simulate the saturation indices of minerals. Furthermore, in order to correct the Al concentration analysis, the approach FixAl is used to force the water in equilibrium with Al-bearing mineral. Microcline is selected as the Al-bearing mineral since it is suitable for forced equilibrium systems with pH values ranging from 5.5 to greater than 9 [79]. The minerals reach equilibrium at convergence temperatures ranging from 190 °C to 210 °C (Figure 13b). In sample GZ42, 0.1 mol/L of CO2 is assumed to have degassed from the fluid, and the convergent temperature is approximately 180–210 °C (Figure 13d). In sample GZ47, there is 0.05 mol/L of CO2 have degassed from water and the convergent temperature is estimated as 180–210 °C (Figure 13f). The main difference between samples is the number of CO2 degassing and the obtained reservoir temperatures are basically the same. These equilibrium temperatures are in good agreement with the reservoir temperature obtained by the Na-K-Mg ternary plot.

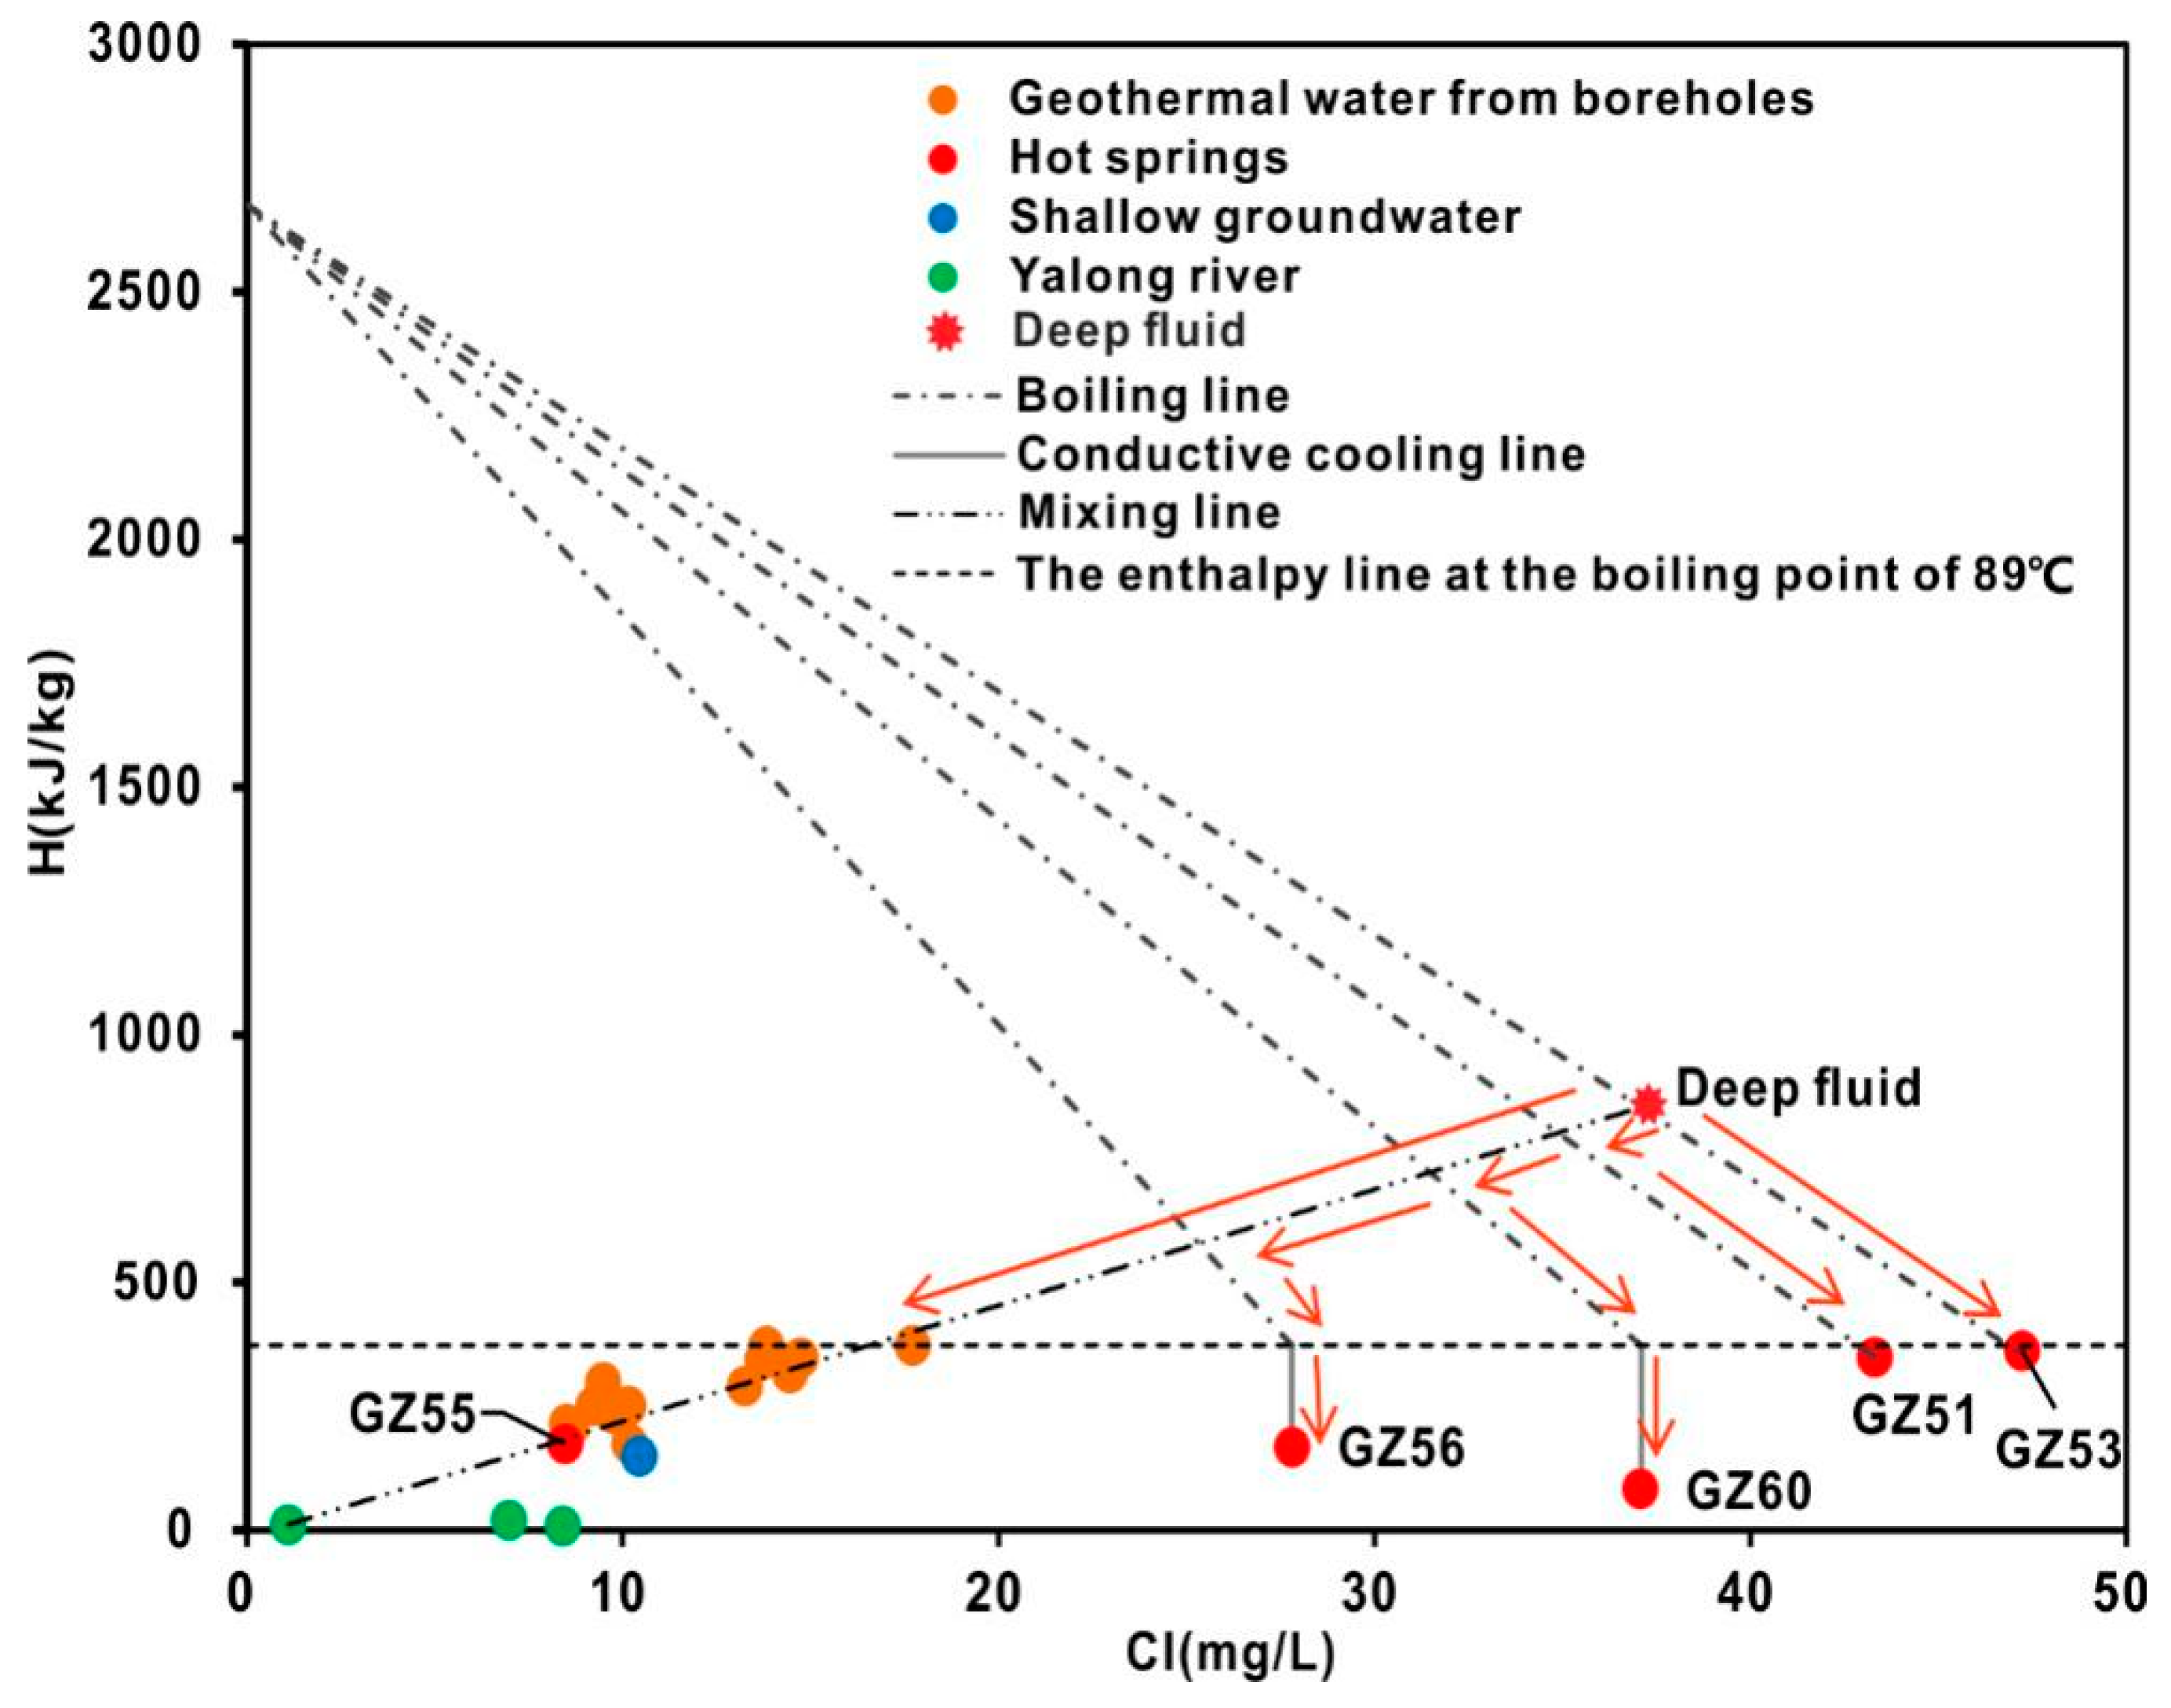
4.4.3. Cl-Enthalpy Mixing Model

The Cl-enthalpy plot is very useful for evaluating the detailed cooling processes experienced by geothermal fluids during the ascent process [81]. The cooling processes of geothermal water rising to the surface mainly include adiabatic boiling, conductive cooling and mixing with cool water. The geothermal fluid may have experienced one or a combination of these processes. Cl is a conservative element that can indicate the mixing process of geothermal fluids. The enthalpy of the hot water in the zone of mixing is less than the enthalpy of the hot water at depth owing to the escape of steam during ascent. Therefore, the appropriate reservoir temperature and Cl concentrations of the deep geothermal fluids can be evaluated by the Cl-enthalpy mixing model [6,82]. Several simplifying assumptions are made when applying the Cl-enthalpy mixing model. (i) Mass and heat conservation are always assumed during and after mixing. (ii) It is assumed that the chemical reactions that occur after mixing are negligible and do not alter the water composition. (iii) More importantly, the mixing model can only be applied if the sampled waters are truly mixed. This has been proved according to the linear correlations between major ions and Cl, which show a binary mixing line between the shallow water and deep geothermal fluid. Then, a diagram of enthalpy against Cl concentrations for water samples is presented in Figure 14.
The enthalpy of water samples are using the enthalpy at the measured temperatures according to the saturated steam table of pure waters. The adiabatic boiling line from the hot water samples to the separated steam represents the variation in enthalpy and Cl content of fluid caused by the process of steam separation during ascent. One of the adiabatic boiling lines that goes through the deep fluid is constructed from two points. One point has an enthalpy corresponding to saturated steam at 100 °C (2676 kJ/kg) and a chloride concentration of 0 mg/L. The other point is the GZ53 sample with the maximum Cl content. The mixing line is the line that shows the heat and the Cl contents of the mixture of deep water with cold water. The mixing line starts from cold water and goes through geothermal waters from boreholes to the deep fluid. The mixing line intersects with the above adiabatic boiling line at one point. This point represents the deep geothermal fluid. The enthalpy of deep fluid is 852 kJ/kg, indicating that the reservoir temperature is approximately 200 °C. The result is also consistent with the temperature deduced from the Giggenbach ternary diagram. Geothermal water from boreholes and the GZ55 hot spring are located on the mixing line. They are formed by the mixing of cold water and deep fluid in different proportions.
The emerging temperatures of geothermal water samples GZ53 and GZ51 are close to the boiling temperature for local atmospheric pressure, indicating that these geothermal fluids have undergone adiabatic cooling while ascending. The GZ53 water sample loses heat due to adiabatic boiling (separation of steam), which also leads to the increasing concentration of chloride. The deduced chloride concentration of deep fluid is 37 mg/L. Similarly, the GZ51 water sample is formed by two processes: first, it mixes with cold water and then boils along the adiabatic boiling line. For the GZ56 and GZ60 thermal springs, the emerging temperature is lower than the local boiling temperature. They cool down rapidly and have experienced the conductive cooling process. The two waters first have experienced mixing between deep fluid and cold water, then the adiabatic boiling process, and finally conductive cooling to produce the springs present at the surface.

4.5. Geothermal Water Circulation Depth

The geothermal gradient and heat flow were measured in the Aba area north of Ganzi. The Aba and Ganzi areas both belong to the Songpan-Ganzi block of northern Tibet. The heat flow value is 94.7 mw/m2, which is higher than the average value of 63 mw/m2 in the continental area of China [83,84]. The geothermal gradient is approximately 32.69 °C/km [83], and the estimated reservoir equilibrium temperature is approximately 180–210 °C. Therefore, the circulation depth of geothermal water can be calculated by the following formula [85]:
D = (T − T0)/G × 100
where D represents the circulation depth (m), T is the reservoir temperature (°C), which is 180–200 °C, T0 is the annual average temperature (°C), which is 5 °C in the study area, and G is the geothermal gradient (°C/km), which is 32.69 °C/km. The resulting geothermal water circulation depth is 5–6 km.

4.6. Heat Source

The Ganzi geothermal field is located on the Tibetan Plateau with a lithosphere thickness of more than 60 kilometres. Therefore, the amount of mantle heat able to reach the surface by heat diffusion and fluid convection is limited. The 3He/4He ratios are 0.17–0.39 Ra, indicating that no more than 5% of the helium is derived from a mantle source. This situation is very different from the Rehai geothermal system with a 3He/4He ratio of 1.17–4.05 Ra [86], which has been demonstrated to be associated with a mantle-derived magmatic heat source. Therefore, in the Ganzi geothermal field, it seems unlikely the existence of an underlying mantle-derived magma chamber acting as a heat source. The water types of the parent geothermal fluids of the Yangbajing and Gulu geothermal fields are Cl-Na type, with Cl concentrations as high as 767 mg/L and 845 mg/L, respectively [13]. The high Cl concentrations can come from magma degassing. However, based on the Cl-enthalpy diagram, in the Ganzi geothermal system, the Cl concentration of the deep fluid is 37 mg/L, and the enthalpy is 852 kJ/kg (reservoir temperature of 200 °C). This much lower Cl concentration also indicates that the fluid composition is not directly correlated to a magma degassing. Therefore, the preliminary analysis indicates that there is neither a mantle nor a crustal melt layer below Ganzi as a heat source. This situation is very similar to the Batang high-temperature geothermal field, which has no magmatic heat source [14,15].

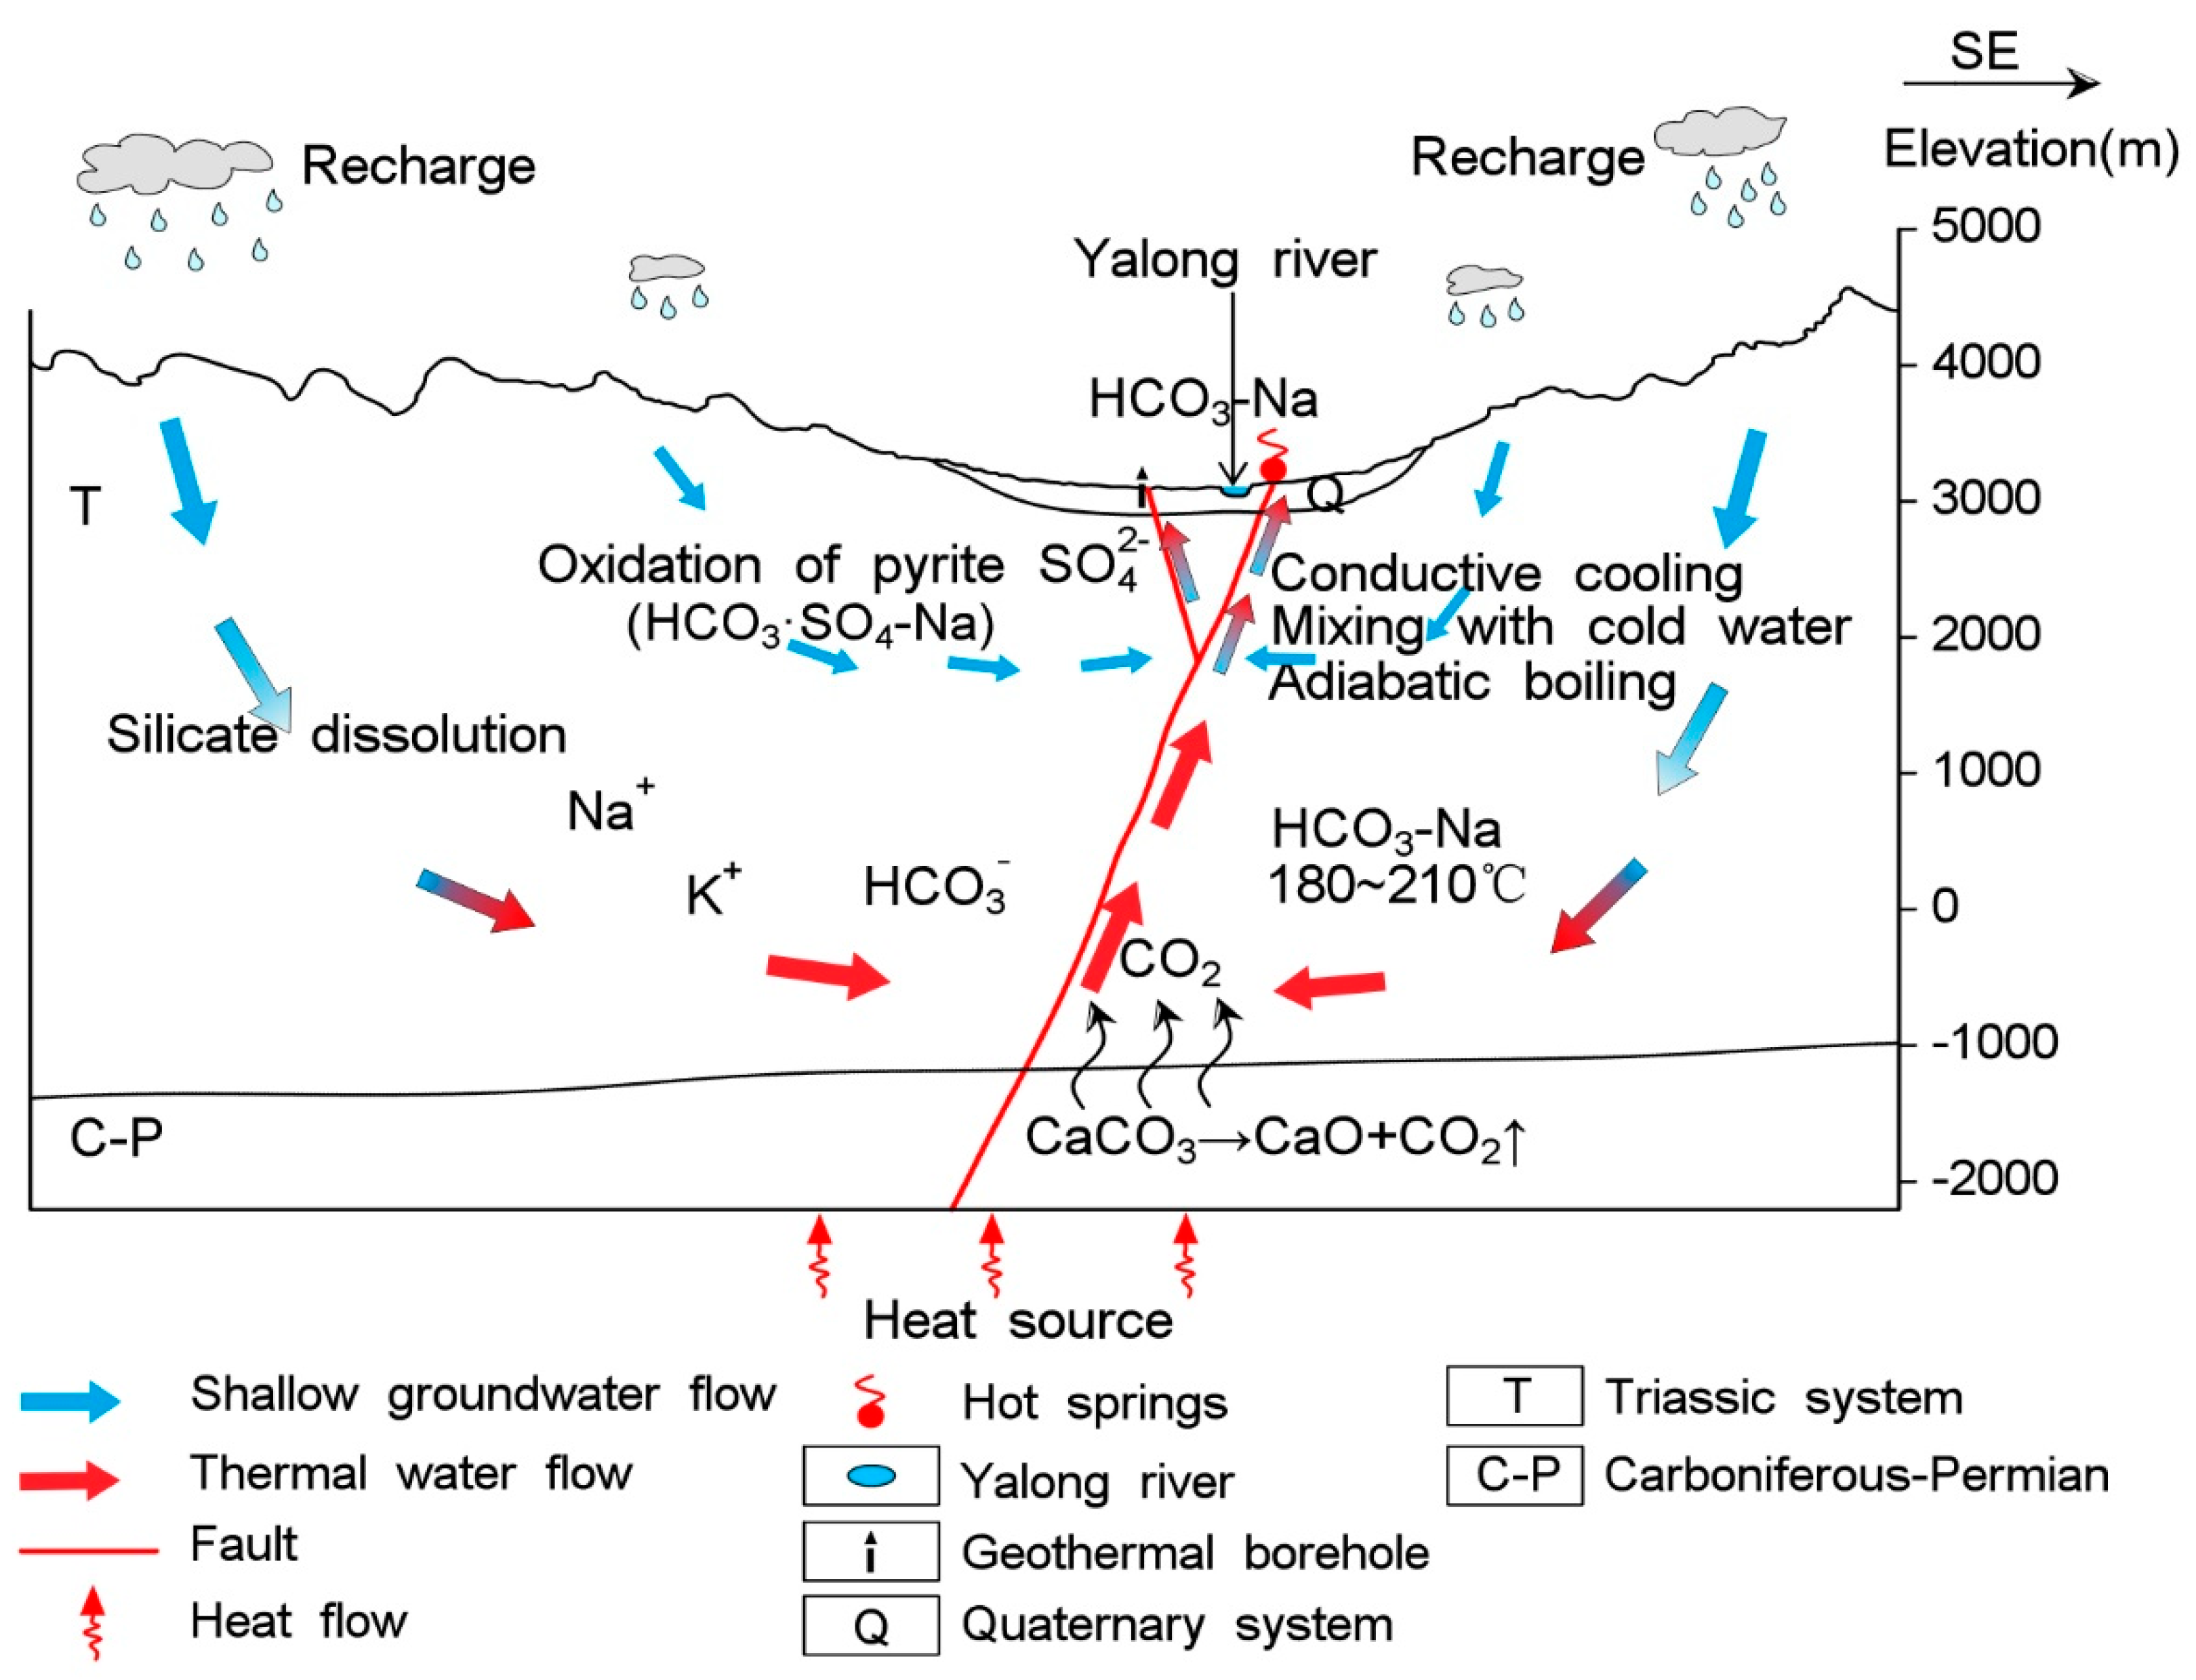
4.7. Conceptual Genetic Model

According to the geological setting and hydrochemical and isotopic data, a conceptual genetic model of the geothermal fluid of the Ganzi area is proposed in the schematic diagram of Figure 15. The geothermal water is recharged by snow melt water from surrounding high mountains. The recharge elevation is estimated to be 4233 m or 3794 m based on different altitude-dependent isotopic gradients. High mountains surround the study area, and Zhuonashan peak (5200 m) to the south features the highest elevations. The infiltrated water flows through the Tertiary silicate reservoir and combines with CO2 derived from deep marine metamorphic carbonate to form the HCO3-Na hydrochemical type. On the basis of 86Sr/87Sr data, it is can be deduced that the waters flow through the silicate reservoir. Long-term groundwater movement at depth results in the absorption of heat from the surrounding hot rock, producing a deep fluid with high temperatures of approximately 180–210 °C. The estimated circulation depth is approximately 5–6 km. Along the pathway of the groundwater flow, sulphate is formed due to oxidation of sulphides in the shallow rocks. Quaternary deposits comprising fluvial alluvium and glacial deposits serve as cap rocks for the geothermal system. The geothermal fluid rises to the surface through deep faults and fractures, which can be regarded as hydrothermal channels. The hot springs and geothermal wells are located along a NW-oriented fault. During the ascent of the waters, the hot water experiences mixing with cool water, adiabatic boiling, and conductive heating and emerges through the subsidiary fractures near the surface. These processes induce chemical composition re-equilibration and changes in the temperature, resulting in the geothermal fluid that emerges at the surface.

5. Conclusions

The Ganzi geothermal field is a typical high-temperature geothermal field on the Tibetan Plateau. The hydrochemistry, gas composition and isotopic composition (δD, δ18O, 87Sr/86Sr, δ34SSO4, δ18OSO4, δ13CCO2, 3He/4He and 4He/20Ne of geothermal fluid have been investigated with the following conclusions:
  • The hydrochemical type is mainly HCO3-Na in geothermal water. The fluids have passed through the Triassic silicate reservoir, and its characteristics are mainly derived from water-CO2-silicate interactions. During ascent, the deep geothermal water experienced different cooling processes, including mixing with cool water, adiabatic boiling and conductive cooling, either individually or in combination.
  • The stable oxygen and hydrogen isotopic data indicate that the geothermal water originates as snow and glacier melt water from the surrounding mountains, and the obvious shift in the δ18O values of the thermal waters is due to water-rock interactions at high temperatures. The isotopic data indicate that the CO2 is mainly derived from marine limestone decomposition, accounting for 74.3–85.6% of the CO2 in the system. The helium isotope ratios range from 0.17–0.39 Ra, indicating that the He is mainly a binary mixture between atmospheric and crustal sources.
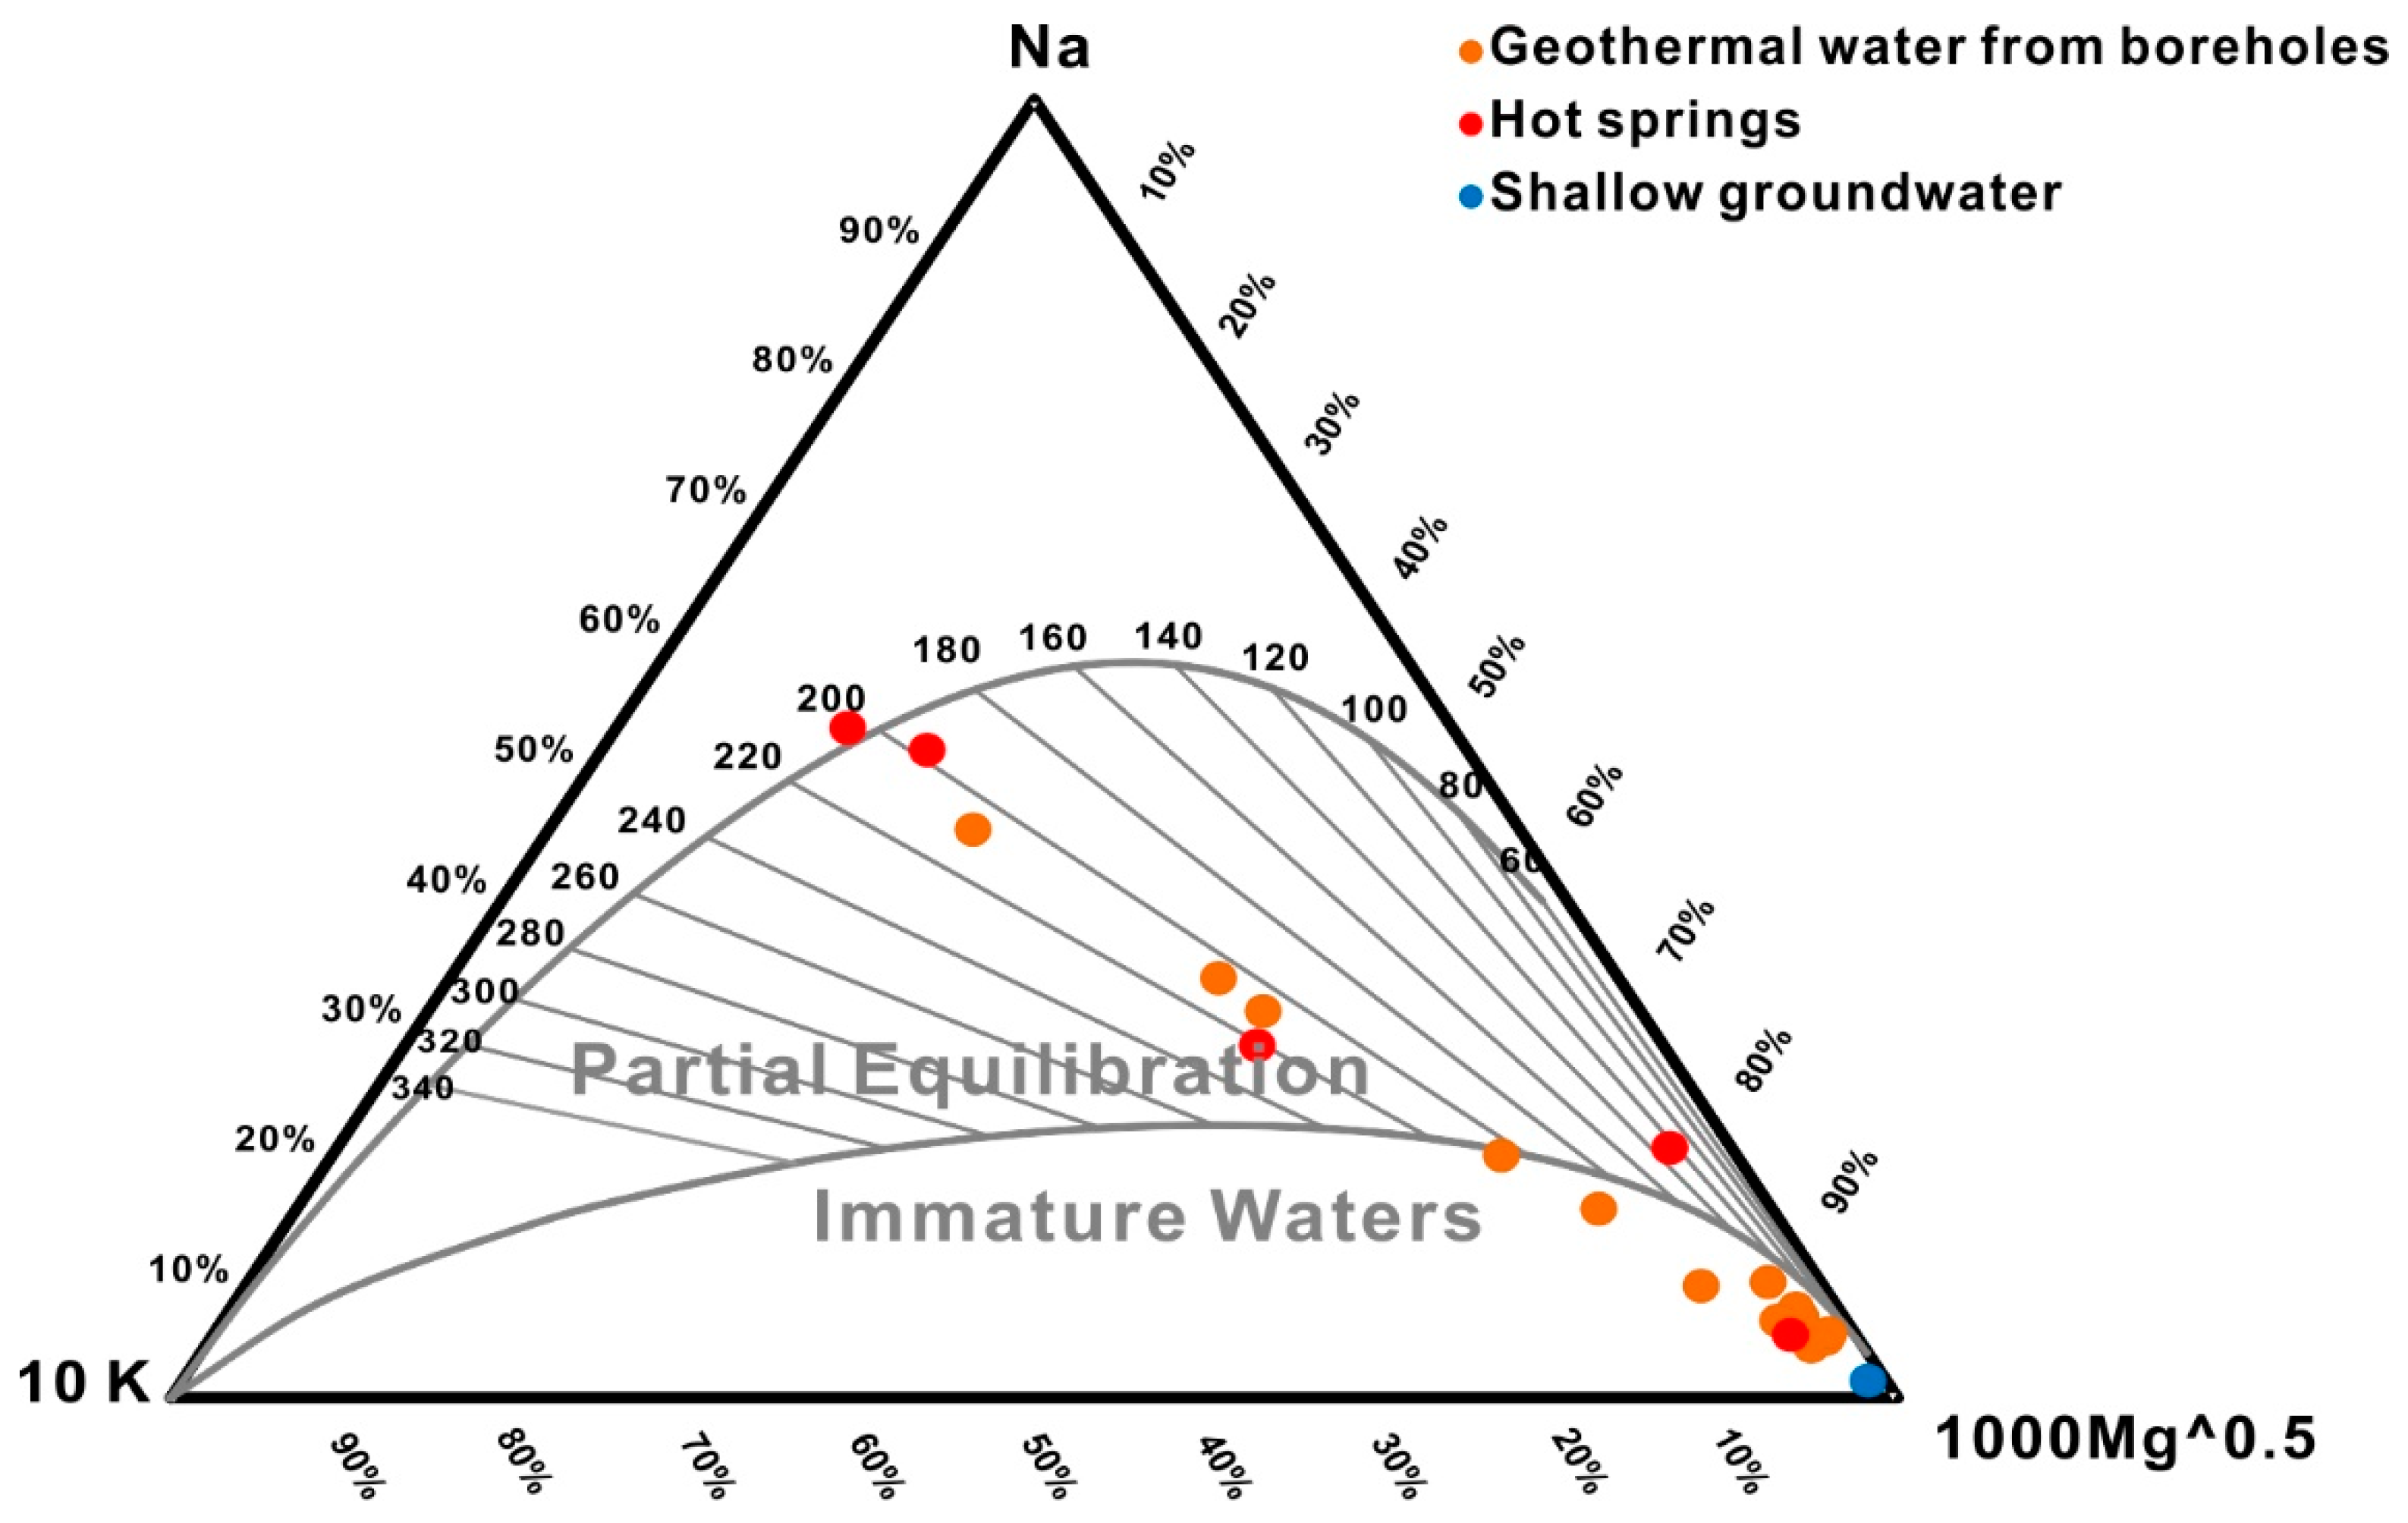
  • Both cationic geothermometers, including the Na-K-Mg ternary diagram and the Na-K and Na-Li ratios, and the Cl-enthalpy mixing model yield reliable temperature estimates of approximately 197 °C and 200 °C, respectively. The convergent reservoir equilibrium temperature of 180–210 °C is obtained via geothermometrical modelling.
  • All data strongly indicate the absence of a magmatic heat source below the Ganzi geothermal field.

Author Contributions

Y.F. conducted literature retrieval, experimental data processing, data analysis and research, and prepared diagrams and manuscript. Z.P. designed research, guided data interpretation and corrected the manuscript. Y.F., D.L. and J.T. conducted field investigation and sample collection; T.H., Y.H., and Y.L. helped to adjust the structure and format of the article.

Funding

This research was funded by the National Natural Science Foundation of China, grant number 41430319.

Acknowledgments

We thank to the editor-in-Chief, associate editor and anonymous reviews for their insightful comments. Thanks also goes to Yingchun Wang and Yuanzhi Cheng for discussions and useful suggestions on an earlier version of the manuscript. Appreciation goes to Yanlong Kong and Ji Luo for their instructive advice, and Yi Xu, Zhenyi Zhou and Zewei Qu for assisting us with field works; Y.F. would like to thank Shikuan Zhang and Yucheng Zhang for their support and company all through these years!

Conflicts of Interest

The authors declare no conflict of interest.

References

  1. Pang, Z.; Hu, S.; Wang, J. A roadmap to geothermal energy development in China. Keji Daobao Sci. Technol. Rev. 2012, 30, 18–24. [Google Scholar]
  2. Vonsée, B.; Crijns-Graus, W.; Liu, W. Energy technology dependence—A value chain analysis of geothermal power in the EU. Energy 2019, 178, 419–435. [Google Scholar] [CrossRef]
  3. Aksoy, N. Power generation from geothermal resources in Turkey. Renew. Energy 2014, 68, 595–601. [Google Scholar] [CrossRef]
  4. Carlino, S.; Troiano, A.; Di Giuseppe, M.G.; Tramelli, A.; Troise, C.; Somma, R.; De Natale, G. Exploitation of geothermal energy in active volcanic areas: A numerical modelling applied to high temperature Mofete geothermal field, at Campi Flegrei caldera (Southern Italy). Renew. Energy 2016, 87, 54–66. [Google Scholar] [CrossRef]
  5. Guo, Q.; Pang, Z.; Wang, Y.; Tian, J. Fluid geochemistry and geothermometry applications of the Kangding high-temperature geothermal system in eastern Himalayas. Appl. Geochem. 2017, 81, 63–75. [Google Scholar] [CrossRef]
  6. Nicholson, K. Geothermal Fluids: Chemistry and Exploration Techniques, 1st ed.; Springer: Berlin/Heidelberg, Germany, 1993; pp. 3–7. [Google Scholar]
  7. Bernal, N.F.; Gleeson, S.A.; Dean, A.S.; Liu, X.-M.; Hoskin, P. The source of halogens in geothermal fluids from the Taupo Volcanic Zone, North Island, New Zealand. Geochim. Cosmochim. Acta. 2014, 126, 265–283. [Google Scholar] [CrossRef]
  8. Giggenbach, W.F. Variations in the chemical and isotopic composition of fluids discharged from the Taupo Volcanic Zone, New Zealand. J. Volcanol. Geotherm. Res. 1995, 68, 89–116. [Google Scholar] [CrossRef]
  9. Zierenberg, R.A.; Schiffman, P.; Barfod, G.H.; Lesher, C.E.; Marks, N.E.; Lowenstern, J.B.; Mortensen, A.K.; Pope, E.C.; Bird, D.K.; Reed, M.H.; et al. Composition and origin of rhyolite melt intersected by drilling in the Krafla geothermal field, Iceland. Contrib. Mineral. Petrol. 2013, 165, 327–347. [Google Scholar] [CrossRef]
  10. Hochstein, M.P.; Regenauer-Lieb, K. Heat generation associated with collision of two plates: The Himalayan geothermal belt. J. Volcanol. Geotherm. Res. 1998, 83, 75–92. [Google Scholar] [CrossRef]
  11. Liao, Z.; Zhao, P. Yunnan-Tibet Geothermal Belt-Geothermal Resources and Case Histories, 1st ed.; Science Press: Beijing, China, 1999; pp. 1–8. (In Chinese) [Google Scholar]
  12. Guo, Q. Hydrogeochemistry of high-temperature geothermal systems in China: A review. Appl. Geochem. 2012, 27, 1887–1898. [Google Scholar] [CrossRef]
  13. Wang, X.; Wang, G.; Lu, C.; Gan, H.; Liu, Z. Evolution of deep parent fluids of geothermal fields in the Nimu—Nagchu geothermal belt, Tibet, China. Geothermics 2018, 71, 118–131. [Google Scholar] [CrossRef]
  14. Tian, J.; Pang, Z.; Guo, Q.; Wang, Y.; Li, J.; Huang, T.; Kong, Y. Geochemistry of geothermal fluids with implications on the sources of water and heat recharge to the Rekeng high-temperature geothermal system in the Eastern Himalayan Syntax. Geothermics 2018, 74, 92–105. [Google Scholar] [CrossRef]
  15. Li, J.; Sagoe, G.; Yang, G.; Liu, D.; Li, Y. The application of geochemistry to bicarbonate thermal springs with high reservoir temperature: A case study of the Batang geothermal field, western Sichuan Province, China. J. Volcanol. Geotherm. Res. 2019, 371, 20–31. [Google Scholar] [CrossRef]
  16. Zhang, X.; Hu, Q. Development of Geothermal Resources in China: A Review. J. Earth Sci. 2018, 29, 452–467. [Google Scholar] [CrossRef]
  17. Zhao, Q. Characteristics of steam-type hydrothermal system in Ganzi geothermal field. Groundwater 1989, 3, 182–187. (In Chinese) [Google Scholar]
  18. Spycher, N.; Peiffer, L.; Sonnenthal, E.L.; Saldi, G.; Reed, M.H.; Kennedy, B.M. Integrated multicomponent solute geothermometry. Geothermics 2014, 51, 113–123. [Google Scholar] [CrossRef]
  19. Ding, L.; Zhong, D.; Yin, A.; Kapp, P.; Harrison, T.M. Cenozoic structural and metamorphic evolution of the eastern Himalayan syntaxis (Namche Barwa). Earth Planet. Sci. Lett. 2001, 192, 423–438. [Google Scholar] [CrossRef]
  20. Wang, E.; Meng, K.; Su, Z.; Meng, Q.; Chu, J.J.; Chen, Z.; Wang, G.; Shi, X.; Liang, X. Block rotation: Tectonic response of the Sichuan basin to the southeastward growth of the Tibetan Plateau along the Xianshuihe-Xiaojiang fault. Tectonics 2014, 33, 686–718. [Google Scholar] [CrossRef]
  21. Qu, W.; Lu, Z.; Zhang, Q.; Hao, M.; Wang, Q.; Qu, F.; Zhu, W. Present-day crustal deformation characteristics of the southeastern Tibetan Plateau and surrounding areas by using GPS analysis. J. Asian Earth Sci. 2018, 163, 22–31. [Google Scholar] [CrossRef]
  22. Shifeng, W.; Erchie, W.; Xiaomin, F.; Bihong, F. Late Cenozoic systematic left-lateral stream deflections along the Ganzi-Yushu fault, Xianshuihe fault system, Eastern Tibet. Int. Geol. Rev. 2008, 50, 624–635. [Google Scholar] [CrossRef]
  23. Lanxiang, W.X.B. Study on the deformation composition and the motion feature of the Xianshuihe active fault zone. Earthq. Res. China 1985, 1, 53–59. (In Chinese) [Google Scholar]
  24. Han, L.; Huang, J.; Fan, M.; Liu, Z.; Yang, X.; Li, T.; Jiang, H.; Peng, B. Remote Sensing Image Interpretation of Geological Environment in Garze, Sichuan. Acta Geol. Sichuan 2011, 31, 470–473. (In Chinese) [Google Scholar]
  25. Completion Report of Zhuode Geothermal Well in Ganzi; Ganzi Kangsheng Geothermal Limited Company: Sichuan, China, 2012. (In Chinese)
  26. The Geological Survey Team of the Sichuan Bureau of Geology. Regional Geological Survey Report of the Ganziregion; Sichuan provincial bureau of geology and mineral resources: Sichuan, China, 1980. (In Chinese) [Google Scholar]
  27. Arnórsson, S. Isotopic and Chemical Techniques in Geothermal Exploration, Development and Use; International Atomic Energy Agency: Venna, Austria, 2000; pp. 89–95. [Google Scholar]
  28. Shestakova, A.; Guseva, N.; Kopylova, Y.; Khvaschevskaya, A.; Polya, D.; Tokarev, I. Geothermometry and Isotope Geochemistry of CO2-Rich Thermal Waters in Choygan, East Tuva, Russia. Water 2018, 10, 729. [Google Scholar] [CrossRef]
  29. Chandrajith, R.; Barth, J.A.C.; Subasinghe, N.D.; Merten, D.; Dissanayake, C.B. Geochemical and isotope characterization of geothermal spring waters in Sri Lanka: Evidence for steeper than expected geothermal gradients. J. Hydrol. 2013, 476, 360–369. [Google Scholar] [CrossRef]
  30. Fusari, A.; Carroll, M.R.; Ferraro, S.; Giovannetti, R.; Giudetti, G.; Invernizzi, C.; Mussi, M.; Pennisi, M. Circulation path of thermal waters within the Laga foredeep basin inferred from chemical and isotopic (δ18O, δD, 3H, 87Sr/86Sr) data. Appl. Geochem. 2017, 78, 23–34. [Google Scholar] [CrossRef]
  31. Chen, L.; Ma, T.; Du, Y.; Xiao, C.; Chen, X.; Liu, C.; Wang, Y. Hydrochemical and isotopic (2H, 18O and 37Cl) constraints on evolution of geothermal water in coastal plain of Southwestern Guangdong Province, China. J. Volcanol. Geotherm. Res. 2016, 318, 45–54. [Google Scholar] [CrossRef]
  32. Zhang, Y.; Xu, M.; Li, X.; Qi, J.; Zhang, Q.; Guo, J.; Yu, L.; Zhao, R. Hydrochemical characteristics and multivariate statistical analysis of natural water system: A case study in Kangding County, Southwestern China. Water 2018, 10, 80. [Google Scholar] [CrossRef]
  33. Xudong, W. Stable isotope compositions for meteoric water from Chengdu and their implication of climate. Acta Geol. Sichuan 2009, 1, 52–54. (In Chinese) [Google Scholar]
  34. Li, J.; Pang, Z.; Kong, Y.; Huang, T.M.; Zhou, M.Z. Contrasting seasonal distribution of stable isotopes and deuterium excess in precipitation over China. Fresenius Environ. Bull. 2014, 23, 2074–2085. [Google Scholar]
  35. Clark, I.D.; Fritz, P. Environmental Isotopes in Hydrogeology, 2nd ed.; CRC press: Boca Raton, FL, USA, 1997; pp. 55, 117, 210–212. [Google Scholar]
  36. Jia, G.; Wei, K.; Chen, F.; Peng, P. Soil n-alkane δD vs. altitude gradients along Mount Gongga, China. Geochim. Cosmochim. Acta 2008, 72, 5165–5174. [Google Scholar] [CrossRef]
  37. Gao, J.; Masson-Delmotte, V.; Yao, T.; Tian, L.; Risi, C.; Hoffmann, G. Precipitation water stable isotopes in the south Tibetan Plateau: Observations and modeling. J. Clim. 2011, 24, 3161–3178. [Google Scholar] [CrossRef]
  38. Giggenbach, W.F. Chemical techniques in geothermal exploration. In Application of Geochemistry of Geothermal Reservoir Development, 1st ed.; D’Amore, F., Ed.; UNITAR/UNDP: Rome, Italy, 1991; pp. 119–144. [Google Scholar]
  39. Meybeck, M. Global chemical weathering of surficial rocks estimated from river dissolved loads. Am. J. Sci. 1987, 287, 401–428. [Google Scholar] [CrossRef]
  40. Helgeson, H.C.; Garrels, R.M.; MacKenzie, F.T. Evaluation of irreversible reactions in geochemical processes involving minerals and aqueous solutions—II. Applications. Geochim. Cosmochim. Acta 1969, 33, 455–481. [Google Scholar] [CrossRef]
  41. Shvartsev, S.L.; Sun, Z.; Borzenko, S.V.; Gao, B.; Tokarenko, O.G.; Zippa, E. V Geochemistry of the thermal waters in Jiangxi Province, China. Appl. Geochem. 2018, 96, 113–130. [Google Scholar] [CrossRef]
  42. Pasvanoğlu, S. Hydrogeochemical study of the thermal and mineralized waters of the Banaz (Hamamboğazi) area, western Anatolia, Turkey. Environ. Earth Sci. 2012, 65, 741–752. [Google Scholar] [CrossRef]
  43. Vengosh, A.; Helvaci, C.; Karamanderesi, I.H. Geochemical constraints for the origin of thermal waters from western Turkey. Appl. Geochem. 2002, 17, 163–183. [Google Scholar] [CrossRef]
  44. Tarcan, G.; Gemici, Ü. Water geochemistry of the Seferihisar geothermal area, Izmir, Turkey. J. Volcanol. Geotherm. Res. 2003, 126, 225–242. [Google Scholar] [CrossRef]
  45. Dotsika, E.; Leontiadis, I.; Poutoukis, D.; Cioni, R.; Raco, B. Fluid geochemistry of the Chios geothermal area, Chios Island, Greece. J. Volcanol. Geotherm. Res. 2006, 154, 237–250. [Google Scholar] [CrossRef]
  46. Faure, G.; Powell, J.L. Strontium Isotope Geology, 1st ed.; Springer: Berlin/Heidelberg, Germany, 1972; pp. 10–33. [Google Scholar]
  47. Palmer, M.R.; Edmond, J.M. The strontium isotope budget of the modern ocean. Earth Planet. Sci. Lett. 1989, 92, 11–26. [Google Scholar] [CrossRef]
  48. Palmer, M.R.; Edmond, J.M. Controls over the strontium isotope composition of river water. Geochim. Cosmochim. Acta 1992, 56, 2099–2111. [Google Scholar] [CrossRef]
  49. Capo, R.C.; Stewart, B.W.; Chadwick, O.A. Strontium isotopes as tracers of ecosystem processes: Theory and methods. Geoderma 1998, 82, 197–225. [Google Scholar] [CrossRef]
  50. Han, G.; Liu, C.-Q. Strontium isotope and major ion chemistry of the rainwaters from Guiyang, Guizhou Province, China. Sci. Total Environ. 2006, 364, 165–174. [Google Scholar] [CrossRef] [PubMed]
  51. Han, G.; Liu, C.-Q. Water geochemistry controlled by carbonate dissolution: A study of the river waters draining karst-dominated terrain, Guizhou Province, China. Chem. Geol. 2004, 204, 1–21. [Google Scholar] [CrossRef]
  52. Wang, Z.-L.; Zhang, J.; Liu, C.-Q. Strontium isotopic compositions of dissolved and suspended loads from the main channel of the Yangtze River. Chemosphere 2007, 69, 1081–1088. [Google Scholar] [CrossRef] [PubMed]
  53. Samborska, K.; Halas, S.; Bottrell, S.H. Sources and impact of sulphate on groundwaters of Triassic carbonate aquifers, Upper Silesia, Poland. J. Hydrol. 2013, 486, 136–150. [Google Scholar] [CrossRef]
  54. Hosono, T.; Delinom, R.; Nakano, T.; Kagabu, M.; Shimada, J. Evolution model of δ34S and δ18O in dissolved sulfate in volcanic fan aquifers from recharge to coastal zone and through the Jakarta urban area, Indonesia. Sci. Total Environ. 2011, 409, 2541–2554. [Google Scholar] [CrossRef] [PubMed]
  55. Du, F. Inorganic Sulfur and Nitrogen Isotope Variation in Atmospheric Precipitation at Chengdu, China. Master’s Thesis, Chengdu University of Technology, Chengdu, China, 2012. (In Chinese). [Google Scholar]
  56. Raab, M.; Spiro, B. Sulfur isotopic variations during seawater evaporation with fractional crystallization. Chem. Geol. Isot. Geosci. Sect. 1991, 86, 323–333. [Google Scholar] [CrossRef]
  57. Möller, P.; Geyer, S.; Salameh, E.; Dulski, P. Sources of mineralization and salinization of thermal groundwater of Jordan. Acta Hydrochim. Hydrobiol. 2006, 34, 86–100. [Google Scholar] [CrossRef]
  58. Taylor, B.E.; Wheeler, M.C.; Nordstrom, D.K. Isotope composition of sulphate in acid mine drainage as measure of bacterial oxidation. Nature 1984, 308, 538–541. [Google Scholar] [CrossRef]
  59. Zhu, G.; Zhang, S.; Liang, Y.; Dai, J.; Li, J. Isotopic evidence of TSR origin for natural gas bearing high H2S contents within the Feixianguan Formation of the northeastern Sichuan Basin, southwestern China. Sci. China Ser. D Earth Sci. 2005, 48, 1960. [Google Scholar] [CrossRef]
  60. Cai, C.; Li, K.; Zhu, Y.; Xiang, L.; Jiang, L.; Cai, X.; Cai, L. TSR origin of sulfur in Permian and Triassic reservoir bitumen, East Sichuan Basin, China. Organ. Geochem. 2010, 41, 871–878. [Google Scholar] [CrossRef]
  61. Toran, L.; Harris, R.F. Interpretation of sulfur and oxygen isotopes in biological and abiological sulfide oxidation. Geochim. Cosmochim. Acta 1989, 53, 2341–2348. [Google Scholar] [CrossRef]
  62. Marques, J.M.; Graça, H.; Eggenkamp, H.G.M.; Neves, O.; Carreira, P.M.; Matias, M.J.; Mayer, B.; Nunes, D.; Trancoso, V.N. Isotopic and hydrochemical data as indicators of recharge areas, flow paths and water—Rock interaction in the Caldas da Rainha—Quinta das Janelas thermomineral carbonate rock aquifer (Central Portugal). J. Hydrol. 2013, 476, 302–313. [Google Scholar] [CrossRef]
  63. Sano, Y.; Wakita, H. Geographical distribution of 3He/4He ratios in Japan: Implications for arc tectonics and incipient magmatism. J. Geophys. Res. Solid Earth 1985, 90, 8729–8741. [Google Scholar] [CrossRef]
  64. Hilton, D.R.; Hammerschmidt, K.; Teufel, S.; Friedrichsen, H. Helium isotope characteristics of Andean geothermal fluids and lavas. Earth Planet. Sci. Lett. 1993, 120, 265–282. [Google Scholar] [CrossRef]
  65. Umeda, K.; Ninomiya, A.; McCrank, G.F. High 3He emanations from the source regions of recent large earthquakes, central Japan. Geochem. Geophys. Geosyst. 2008, 9. [Google Scholar] [CrossRef]
  66. Oxburgh, E.R.; O’nions, R.K.; Hill, R.I. Helium isotopes in sedimentary basins. Nature 1986, 324, 632–635. [Google Scholar] [CrossRef]
  67. Gautheron, C.; Moreira, M.; Allègre, C. He, Ne and Ar composition of the European lithospheric mantle. Chem. Geol. 2005, 217, 97–112. [Google Scholar] [CrossRef]
  68. Hoke, L.; Lamb, S.; Hilton, D.R.; Poreda, R.J. Southern limit of mantle-derived geothermal helium emissions in Tibet: Implications for lithospheric structure. Earth Planet. Sci. Lett. 2000, 180, 297–308. [Google Scholar] [CrossRef]
  69. Ballentine, C.J.; Burnard, P.G. Production, release and transport of noble gases in the continental crust. Rev. Mineral. Geochem. 2002, 47, 481–538. [Google Scholar] [CrossRef]
  70. Ozima, M.; Podosek, F.A. Noble Gas Geochemistry, 2nd ed.; Cambridge University Press: Cambridge, UK, 2002; pp. 12–15. [Google Scholar]
  71. Lyon, G.L.; Hulston, J.R. Carbon and hydrogen isotopic compositions of New Zealand geothermal gases. Geochim. Cosmochim. Acta 1984, 48, 1161–1171. [Google Scholar] [CrossRef]
  72. Mutlu, H.; Güleç, N.; Hilton, D.R. Helium—Carbon relationships in geothermal fluids of western Anatolia, Turkey. Chem. Geol. 2008, 247, 305–321. [Google Scholar] [CrossRef]
  73. Veizer, J.; Ala, D.; Azmy, K.; Bruckschen, P.; Buhl, D.; Bruhn, F.; Carden, G.A.F.; Diener, A.; Ebneth, S.; Godderis, Y.; et al. 87Sr/86Sr, δ13C and δ18O evolution of Phanerozoic seawater. Chem. Geol. 1999, 161, 59–88. [Google Scholar] [CrossRef]
  74. Sano, Y.; Marty, B. Origin of carbon in fumarolic gas from island arcs. Chem. Geol. 1995, 119, 265–274. [Google Scholar] [CrossRef]
  75. Giggenbach, W.F. Geothermal solute equilibria. derivation of Na-K-Mg-Ca geoindicators. Geochim. Cosmochim. Acta 1988, 52, 2749–2765. [Google Scholar] [CrossRef]
  76. Kharaka, Y.K.; Lico, M.S.; Law, L.M. Chemical geothermometers applied to formation waters, Gulf of Mexico and California basins. AAPG Bull. 1982, 66, 588. [Google Scholar]
  77. Sanjuan, B.; Millot, R.; Asmundsson, R.; Brach, M.; Giroud, N. Use of two new Na/Li geothermometric relationships for geothermal fluids in volcanic environments. Chem. Geol. 2014, 389, 60–81. [Google Scholar] [CrossRef]
  78. Reed, M.; Spycher, N. Calculation of pH and mineral equilibria in hydrothermal waters with application to geothermometry and studies of boiling and dilution. Geochim. Cosmochim. Acta 1984, 48, 1479–1492. [Google Scholar] [CrossRef]
  79. Pang, Z.-H.; Reed, M. Theoretical chemical thermometry on geothermal waters: Problems and methods. Geochim. Cosmochim. Acta 1998, 62, 1083–1091. [Google Scholar] [CrossRef]
  80. Asta, M.P.; Gimeno, M.J.; Auqué, L.F.; Gómez, J.; Acero, P.; Lapuente, P. Secondary processes determining the pH of alkaline waters in crystalline rock systems. Chem. Geol. 2010, 276, 41–52. [Google Scholar] [CrossRef]
  81. Fournier, R.O. Chemical geothermometers and mixing models for geothermal systems. Geothermics 1977, 5, 41–50. [Google Scholar] [CrossRef]
  82. Li, J.; Yang, G.; Sagoe, G.; Li, Y. Major hydrogeochemical processes controlling the composition of geothermal waters in the Kangding geothermal field, western Sichuan Province. Geothermics 2018, 75, 154–163. [Google Scholar] [CrossRef]
  83. Xu, M. Study on the Present Geothermal Field and Lithospheric Thermal Structure in the Sichuan Basin. Ph.D. Thesis, University of Chinese Academy of Sciences, Beijing, China, 2011. (In Chinese). [Google Scholar]
  84. Jiang, G.Z.; Gao, P.; Rao, S.; Zhang, L.Y.; Tang, X.Y.; Huang, F.; Zhao, P.; Pang, Z.H.; He, L.J.; Hu, S.B.; et al. Compilation of heat flow data in the continental area of China (4th edition). Chin. J. Geophys.-Chin. Ed. 2016, 59, 2892–2910. [Google Scholar]
  85. Li, G.; Li, F. The Circulation Law, Sustainable Development and Utilization of Geothermal Water in Guanzhong Basin; Science Press: Beijing, China, 2010; p. 100. [Google Scholar]
  86. Shangguan, Z.; Zhao, C.; Li, H.; Gao, Q.; Sun, M. Evolution of hydrothermal explosions at Rehai geothermal field, Tengchong volcanic region, China. Geothermics 2005, 34, 518–526. [Google Scholar] [CrossRef]
Figure 1. (a) location of the Himalayan geothermal belt and the study area [10], (b) Geological setting of the Ganzi geothermal field, (c) sampling sites, (d) cross section of the Ganzi region.
Water 11 01631 g001
Figure 2. δD vs δ18O plot shows the isotopic composition of all water samples from the Ganzi geothermal field. LMWL stands for the local meteoric water line (δD = 7.53δ18O + 1.42) in Chengdu, Sichuan province [33].
Water 11 01631 g002
Figure 3. Piper diagram of water samples from the Ganzi geothermal field.
Water 11 01631 g003
Figure 4. Cl-SO42−-HCO3 ternary plot for the water samples [38].
Water 11 01631 g004
Figure 5. (a) Relationship between Na+ and Cl, (b) relationship between Ca2+ + Mg2+ and HCO3 + SO42−, (c) relationship between Na+ + K+ and HCO3 for water samples from Ganzi.
Water 11 01631 g005
Figure 6. Equilibrium of the water samples with aluminosilicate minerals: (a) Na2O-Al2O3-SiO2-H2O system, (b) K2O-Al2O3-SiO2-H2O system. The phase boundaries are plotted for 100 °C (in black) and 200 °C (in red).
Water 11 01631 g006
Figure 7. (a) Li+ vs. Cl correlation plot (b) B3+ vs. Cl correlation plot (c) total dissolved solids (TDS) vs. Cl correlation plot, (d) HCO3 vs. Cl correlation plot for water samples.
Water 11 01631 g007
Figure 8. (a) The diagram of 87Sr/86Sr ratio vs 1/Sr2+ for waters from Ganzi. The 87Sr/86Sr ratios of marine carbonates range from 0.707–0.709 [49,50,51]. The 87Sr/86Sr ratios of the silicate rocks in the Yangtze valley in China are usually >0.715, as referenced from Wang et al. (2007) [52]. The 87Sr/86Sr ratios of the mantle are 0.702–0.705 [46], (b) Sr2+ vs Ca2+ plot.
Water 11 01631 g008
Figure 9. The plot of δ34SSO4 and δ18OSO4 for thermal waters from Ganzi. Variations in δ34SSO4 and δ18OSO4 values observed in the atmosphere, evaporites, soil sulphate and oxidized sulphur [62].
Water 11 01631 g009
Figure 10. Diagram of the 4He/20Ne ratios vs the R/Ra ratios. The three end members used to build the mixing line are the atmosphere (R/Ra = 1, 4He/20Ne = 0.318) [63], mantle (R/Ra = 8, 4He/20Ne = 1000), and continental crust (R/Ra = 0.02, 4He/20Ne = 1000) [63,69]. The 3He/4He ratio is usually expressed as R. The 3He/4He ratio in the atmosphere, Ra, is 1.384 × 10⁻⁶ [63].
Water 11 01631 g010
Figure 11. Variation in the CO2/3He ratio and δ13CCO2 composition of the geothermal gas. The compositional end members of organic sediments, limestone, and mantle have the following values: δ13CCO2 = −30‰, 0‰, and −6.5‰, CO2/3He = 1 × 10¹³, 2 × 10⁹ and 1 × 10¹³, respectively [74].
Water 11 01631 g011
Figure 12. Giggenbach diagram for geothermal water samples [75].
Water 11 01631 g012
Figure 13. Variation in temperature with Log(Q/K) values of minerals for the original water samples (a) GZ53, (c) GZ42, (e) GZ47. Variation in temperature with Log(Q/K) values of minerals corrected for CO2 degassing for original water samples (b) GZ53, (d) GZ42, (f) GZ47. For discussions on methodology, see Pang and Reed, 1998 [79].
Water 11 01631 g013
Figure 14. Cl-enthalpy plot for water samples.
Water 11 01631 g014
Figure 15. Schematic diagram of the conceptual model of the Ganzi geothermal field.
Water 11 01631 g015
Table 1. Chemical and isotope composition of water samples (n.m. = not measured).
Sample IDTypeAltitude (m)Well Depth (m)T (°C)pHEc (μs/cm)TDS (mg/L)Ca2+ (mg/L)Mg2+ (mg/L)Na+ (mg/L)K+ (mg/L)CO32− (mg/L)HCO3 (mg/L)Cl (mg/L)SO42− (mg/L)F (mg/L)NO3 (mg/L)
GZ33Geothermal water from boreholes3362180898.213446518.73.8374.725.9078317.772.935.21.8
GZ36335430697.3120542219.010.9223.99.0048313.2146.614.91.1
GZ37333140617.6102745017.97.2203.37.205009.2119.612.90.9
GZ39336480577.811694507.316.8174.413.305079.845.84.63.2
GZ40333440507.670632616.69.9151.86.203848.674.911.91.0
GZ41333550627.911374995.310.7216.414.5059110.154.16.20.0
GZ42334940788.824308683.40.3405.329.06686014.458.824.31.0
GZ433359180878.815317853.81.9374.527.45187713.879.027.00.9
GZ44334660738.0118651311.15.0225.67.705939.586.214.80.8
GZ463301170538.475038313.08.8157.14.704668.5 48.19.71.0
GZ47329240838.021307274.90.3345.325.3084813.767.925.41.1
GZ48334290849.418678501.00.1397.928.812874014.771.724.80.8
GZ50330680807.614045159.04.1206.717.0055710.248.817.70.8
GZ55Hot springs3272 437.610765347.111.5180.014.006218.58.36.50.0
GZ513315 839.4389017891.30.1860.858.4357143943.365.317.70.0
GZ533334 859.1349017898.40.1836.552.4123201347.2213.316.50.9
GZ563284 407.52330112816.34.3517.19.60144127.822.56.91.0
GZ603333 637.42630147713.71.6706.061.20174437.1152.514.20.9
GZ45Shallow groundwater334620378.156828522.418.858.64.7035610.427.32.60.0
GZ54Yalong river3315 58.423517635.517.76.91.001207.084.80.01.4
GZ613336 37.333928156.521.547.33.603328.4106.01.21.9
GZ633342 28.014811941.711.61.30.401631.125.70.20.5
Sample IDTypeSiO2 (mg/L)Li+ (mg/L)B3+ (mg/L)Sr2+ (μg/)δ18O ‰δD ‰87Sr/86Srδ34SSO4δ18OSO4Charge Balance (%)Water Type
GZ33Geothermal water from boreholes118.90.84.8127−16.8−130.20.714594−2.3−8.42.8HCO3-Na
GZ3651.60.42.0177−16.3−126.1n.m.n.m.n.m.−1.3HCO3·SO4-Na
GZ3753.80.42.3185−17.2−129.40.714235−6.9−12.4−50HCO3-Na
GZ3944.80.32.1190−16.6−126.50.714644−1.0−10.7−0.7HCO3-Na
GZ4034.40.31.3166−15.9−123.3n.m.n.m.n.m.−1.9HCO3-Na
GZ4166.90.53.1165−17.0−129.7n.m.n.m.n.m.−2.2HCO3-Na
GZ42173.61.06.3136−16.3−130.50.716888n.m.n.m.−1.8HCO3-Na
GZ43175.71.05.9131−16.3−131.70.7168311.3−8.4−6.0HCO3-Na
GZ4467.20.52.8155−16.8−128.6n.m.n.m.n.m.−6.8HCO3-Na
GZ4640.80.32.0139−16.5−126.00.7146640.4−11.5−6.1HCO3-Na
GZ47128.60.95.5125−16.7−132.7n.m.n.m.n.m.−3.4HCO3-Na
GZ48139.31.06.323−16.6−132.3n.m.n.m.n.m.−4.0HCO3-Na
GZ5052.70.62.6364−15.3−122.2n.m.n.m.n.m.−5.4HCO3-Na
GZ55Hot springs70.20.42.3189−16.0−125.00.714098n.m.n.m.−7.0HCO3-Na
GZ51177.93.216.0104−14.7−132.10.7167671.1−5.40.0HCO3·CO3-Na
GZ53180.03.115.7170−14.7−133.50.716706n.m.n.m.−6.9HCO3-Na
GZ5685.32.29.0465−15.0−127.20.7151153.4−6.7−2.8HCO3-Na
GZ60139.32.711.5147−15.3−131.00.7156604.1−8.5−0.7HCO3-Na
GZ45Shallow groundwater25.50.20.9182−15.6−120.40.714394n.m.n.m.−12.1HCO3-Na·Mg
GZ54Yalong river8.20.00.1245−14.1−106.1n.m.n.m.n.m.−5.1HCO3·SO4-Ca·Mg
GZ6114.20.10.8299−14.2−106.3n.m.n.m.n.m.−8.2HCO3·SO4-Ca·Na·Mg
GZ638.20.00.0174−15.2−112.3n.m.n.m.n.m.−2.2HCO3-Ca·Mg
Table 2. Volume fraction, isotope composition of gas samples and the contribution ratio of limestone, mantle and organic sedimentary for CO2.
Sample IDTypeHe (%.vol)H2 (%.vol)O2 (%.vol)Ar (%.vol)N2 (%.vol)CH4 (%.vol)CO2 (%.vol)3He/4HeR/Ra4He/20Neδ13CCO2 (‰)Mantle (%)Organic Sedimentary (%)Limestone (%)
GZ34Geothermal water from boreholes 0.0620.0000.671.7370.7311.3715.452.42 × 10−70.1743.08
GZ350.0600.0091.171.5771.998.9516.252.63 × 10−70.1950.59
GZ380.0760.0041.061.3382.938.526.082.60 × 10−70.1961.26
GZ390.0300.0021.791.2775.525.9415.462.40 × 10−70.1717.48
GZ470.0501.4390.670.4029.827.6459.992.76 × 10−70.2098.98
GZ500.0600.0993.311.0958.109.6027.742.00 × 10−70.1439.97
GZ52hot springs0.0120.0051.570.1812.572.5583.124.17 × 10−70.3047.34−5.461777
GZ530.0010.0055.250.2513.830.3780.305.49 × 10−70.394.01−7.512574
GZ560.0040.0030.930.056.361.6291.054.67 × 10−70.3329.84−3.921286
GZ570.0120.1321.020.0912.033.5483.174.67 × 10−70.3351.52−4.071281
GZ590.0020.7193.080.1516.880.6678.514.84 × 10−70.3512.10−5.211782
GZ600.0020.0030.930.0511.331.3486.354.85 × 10−70.359.71−5.811980
Table 3. Chemical geothermometry estimates of reservoir temperature.
Sample IDNa-K(°C)
Giggenbach (1988) [75]
Na-Li(°C)
Kharaka et al. (1982) [76]
GZ33205184
GZ36168173
GZ37161181
GZ39212183
GZ40170191
GZ41202193
GZ42207197
GZ43209200
GZ44159192
GZ46151176
GZ47209200
GZ48208197
GZ50217201
GZ55213187
GZ51203223
GZ53198222
GZ56126232
GZ60221224
GZ45215200

