The NPP-Based Composite Indicator for Assessing the Variations of Water Provision Services at the National Scale


1
Department of Geography, School of Geography and Tourism, Shaanxi Normal University, Xi’an 710119, China
2
School of Tourism & Research Institute of Human Geography, Xi’an International Studies University, Xi’an 710128, China
3
Center for Systems Integration and Sustainability, Michigan State University, East Lansing, MI 48823, USA
*
Author to whom correspondence should be addressed.
Water 2019, 11(8), 1628; https://doi.org/10.3390/w11081628
Submission received: 11 June 2019
/
Revised: 3 August 2019
/
Accepted: 5 August 2019
/
Published: 7 August 2019
(This article belongs to the Section Water Resources Management, Policy and Governance)
Abstract
:Water provision (WP) is an important service of the terrestrial ecosystem, which contributes to water availability for consumptive use and in situ water supply, sustains the production or flows of multiple ecosystem services (ES). Spatially explicit mapping of WP is critical for incorporating the ES concept into the decision-making processes of land-use and ecological conservation planning. Traditionally, regional complexes hydrological process models were simplified and used for mapping WP of the ecosystem at broad scales, but this approach is significantly limited by data accessibility and difficulty validating the results. To fill the gap, an NPP-based composite indicator model that simulates WP by multiplying NPP and its variations with the soil infiltration capacity factor, annual precipitation and the slope of the land surface is proposed in this paper. These parameters are chosen to map WP because they are closely related to hydrological processes. The model results were validated using observed runoff data of the eleven river basins in China. We then applied this approach to analyze the spatiotemporal changes of WP in China from 2000 to 2013. The results show that: (1) the average value of WP was lowest in the Northwest Arid Area ecoregions while the highest value of WP was in the South China ecoregion. (2) The linear trend of WP in the Loess Plateau and Hengduan Mountains ecoregions were increased while decreased in the other nine ecoregions. (3) The WP in the north of the Qinghai-Tibet Plateau presented a significant decrease trend mostly because the land cover change (e.g., grassland convert into dessert) and decreasing precipitation; the decreasing of the WP in Yunan-Guizhou Plateau are because the farmland convert into settlement land and the significant decrease of precipitation and significantly increase of temperature; the significant increase of the WP in Northeast China are because the increasing of forest and farmland, the grassland and wetland convert into farmland and forest, and the significant decrease of temperature and increase of precipitation; Although the increase of precipitation has played an important role in promoting WP, the significant increase of WP in the Loess Plateau was mainly due to the farmland convert into forest and grassland ecosystem types. The indicator explored by this research is benefiting for revealing the variations of WP under different land-use change and climate change, and informed the decision-making process of land-use policy or conservation planning at data-scarce regions or broaden spatial scales.
1. Introduction
Ecosystems provide multiple water-related services to human beings, such as freshwater supply, water quality purification, surface water regulation, mitigating flood in rain season and sustaining water flow in the dry season [1,2]. However, with the intensification of human activities and climate warming, the water resources crisis is becoming more and more serious, making it increasingly challenging to maintain ecosystems for sustainable services [3,4]. Especially, the water provision service (WP) of terrestrial ecosystems have drawn much attention because freshwater is essential to support human wellbeing and socio-economic development [5]. The WP concept thus has been incorporated into the conservation planning in multiple regions and at different spatial scales [6,7]. Recently, China has released a number of national policies to conserve critical ecological areas, such as the National Ecological Functional Zonation program, the Key Ecologically Functional Zones, the Ecological Redline Policy, and the National Parks protected area [6,7,8,9]. To best inform the decision-making and implementation of these national policies, there is a pressing need to develop ES mapping models that are both easy-to-use and scientifically credible across spatial scales. However, most current WP mapping approaches are based on complex hydrologic process models, which require very detailed model parameters, fine-scale data, and complicated calibration processes [10,11,12,13]. Although hydrologic process models are well accepted by scholars and the accuracy of model results is relatively higher than the simplified models, it is still challenging to apply these models to large-scale research because of model adaptations and data accessibility. One potential solution to the challenges of finding a more suitable spatially explicit model for a large scale is to develop a composite indicator model based on remote sensing data [10].
Recently, remote sensing has been widely used in the simulation of ecosystem attributes, such as mapping water body variations and monitoring land-surface vegetation change at broad scales [14,15,16]. The remote-sensing-based composite indicator approach requires fewer data inputs but can generate spatially explicit results and explain the environmental change well [12,13]. For example, the Leaf Area Index was used for mapping water interception [17], the Normalized Difference Water Index were used to map land surface water [18], the remote sensing-based water-related spectral reflectance indices was widely used for modeling the land surface water body characterization, vegetation water status estimation, soil water content assessment, and wetland monitoring [13]. As we all know, the components of an ecosystem, such as soil, water, carbon, phosphates and a variety of living organisms, are highly related and determine the production of multiple ecosystem services [1,17,18]. For example, the NPP (Net primary productivity) of vegetation as the energy input of the ecosystem that governs the delivery of many provisioning, regulating services and some culture services [19,20]. However, the water balance integrating precipitation input, soil water storage, and atmospheric evaporative demand, appears to be the dominant control of NPP in many areas [21]. Therefore, some scholars use a carbon-based quantitative assessment model which is using the biomass or NPP as the main parameter to combine with multiple ecosystems attributes data to evaluate ecosystem services [22,23,24,25]. For example, Carreño et al. [23] used the multiplication of biomass, soil texture, precipitation, temperature and the other topography indicators to map five critical ecosystem services in Argentina. Barral et al. [24] used the NPP as the proxy of biomass to map seven ecosystem services with multiple environmental parameters at the local scale of Southeast Pampas of Argentina. Therefore, the combination of annual mean NPP of vegetation and other parameters of the ecosystem can be used for mapping water and nutrient retention service of the ecosystem [25]. It is promising to develop such a model that can be applied to inform policy decision-making processes at multi-scales (such as at local, regional and national scale) [10,26].
This study aims to use an NPP-based composite indicator model for spatially explicit mapping of the water provision service (WP) of the ecosystem and apply the model to a national scale case study. This article begins with describing of parameter components of the composite indicator and evaluating the model in eleven basins in China. Next, we analyze the spatiotemporal patterns and driving factors (such as climate variations and land-use change) of WP in these eleven ecoregions of China from 2000 to 2013. Finally, we discuss the applicability of the model to assess WP across spatial scales, and the potential WP conservation policy implication of the findings.
2. Data and Methods
2.1. Study Area
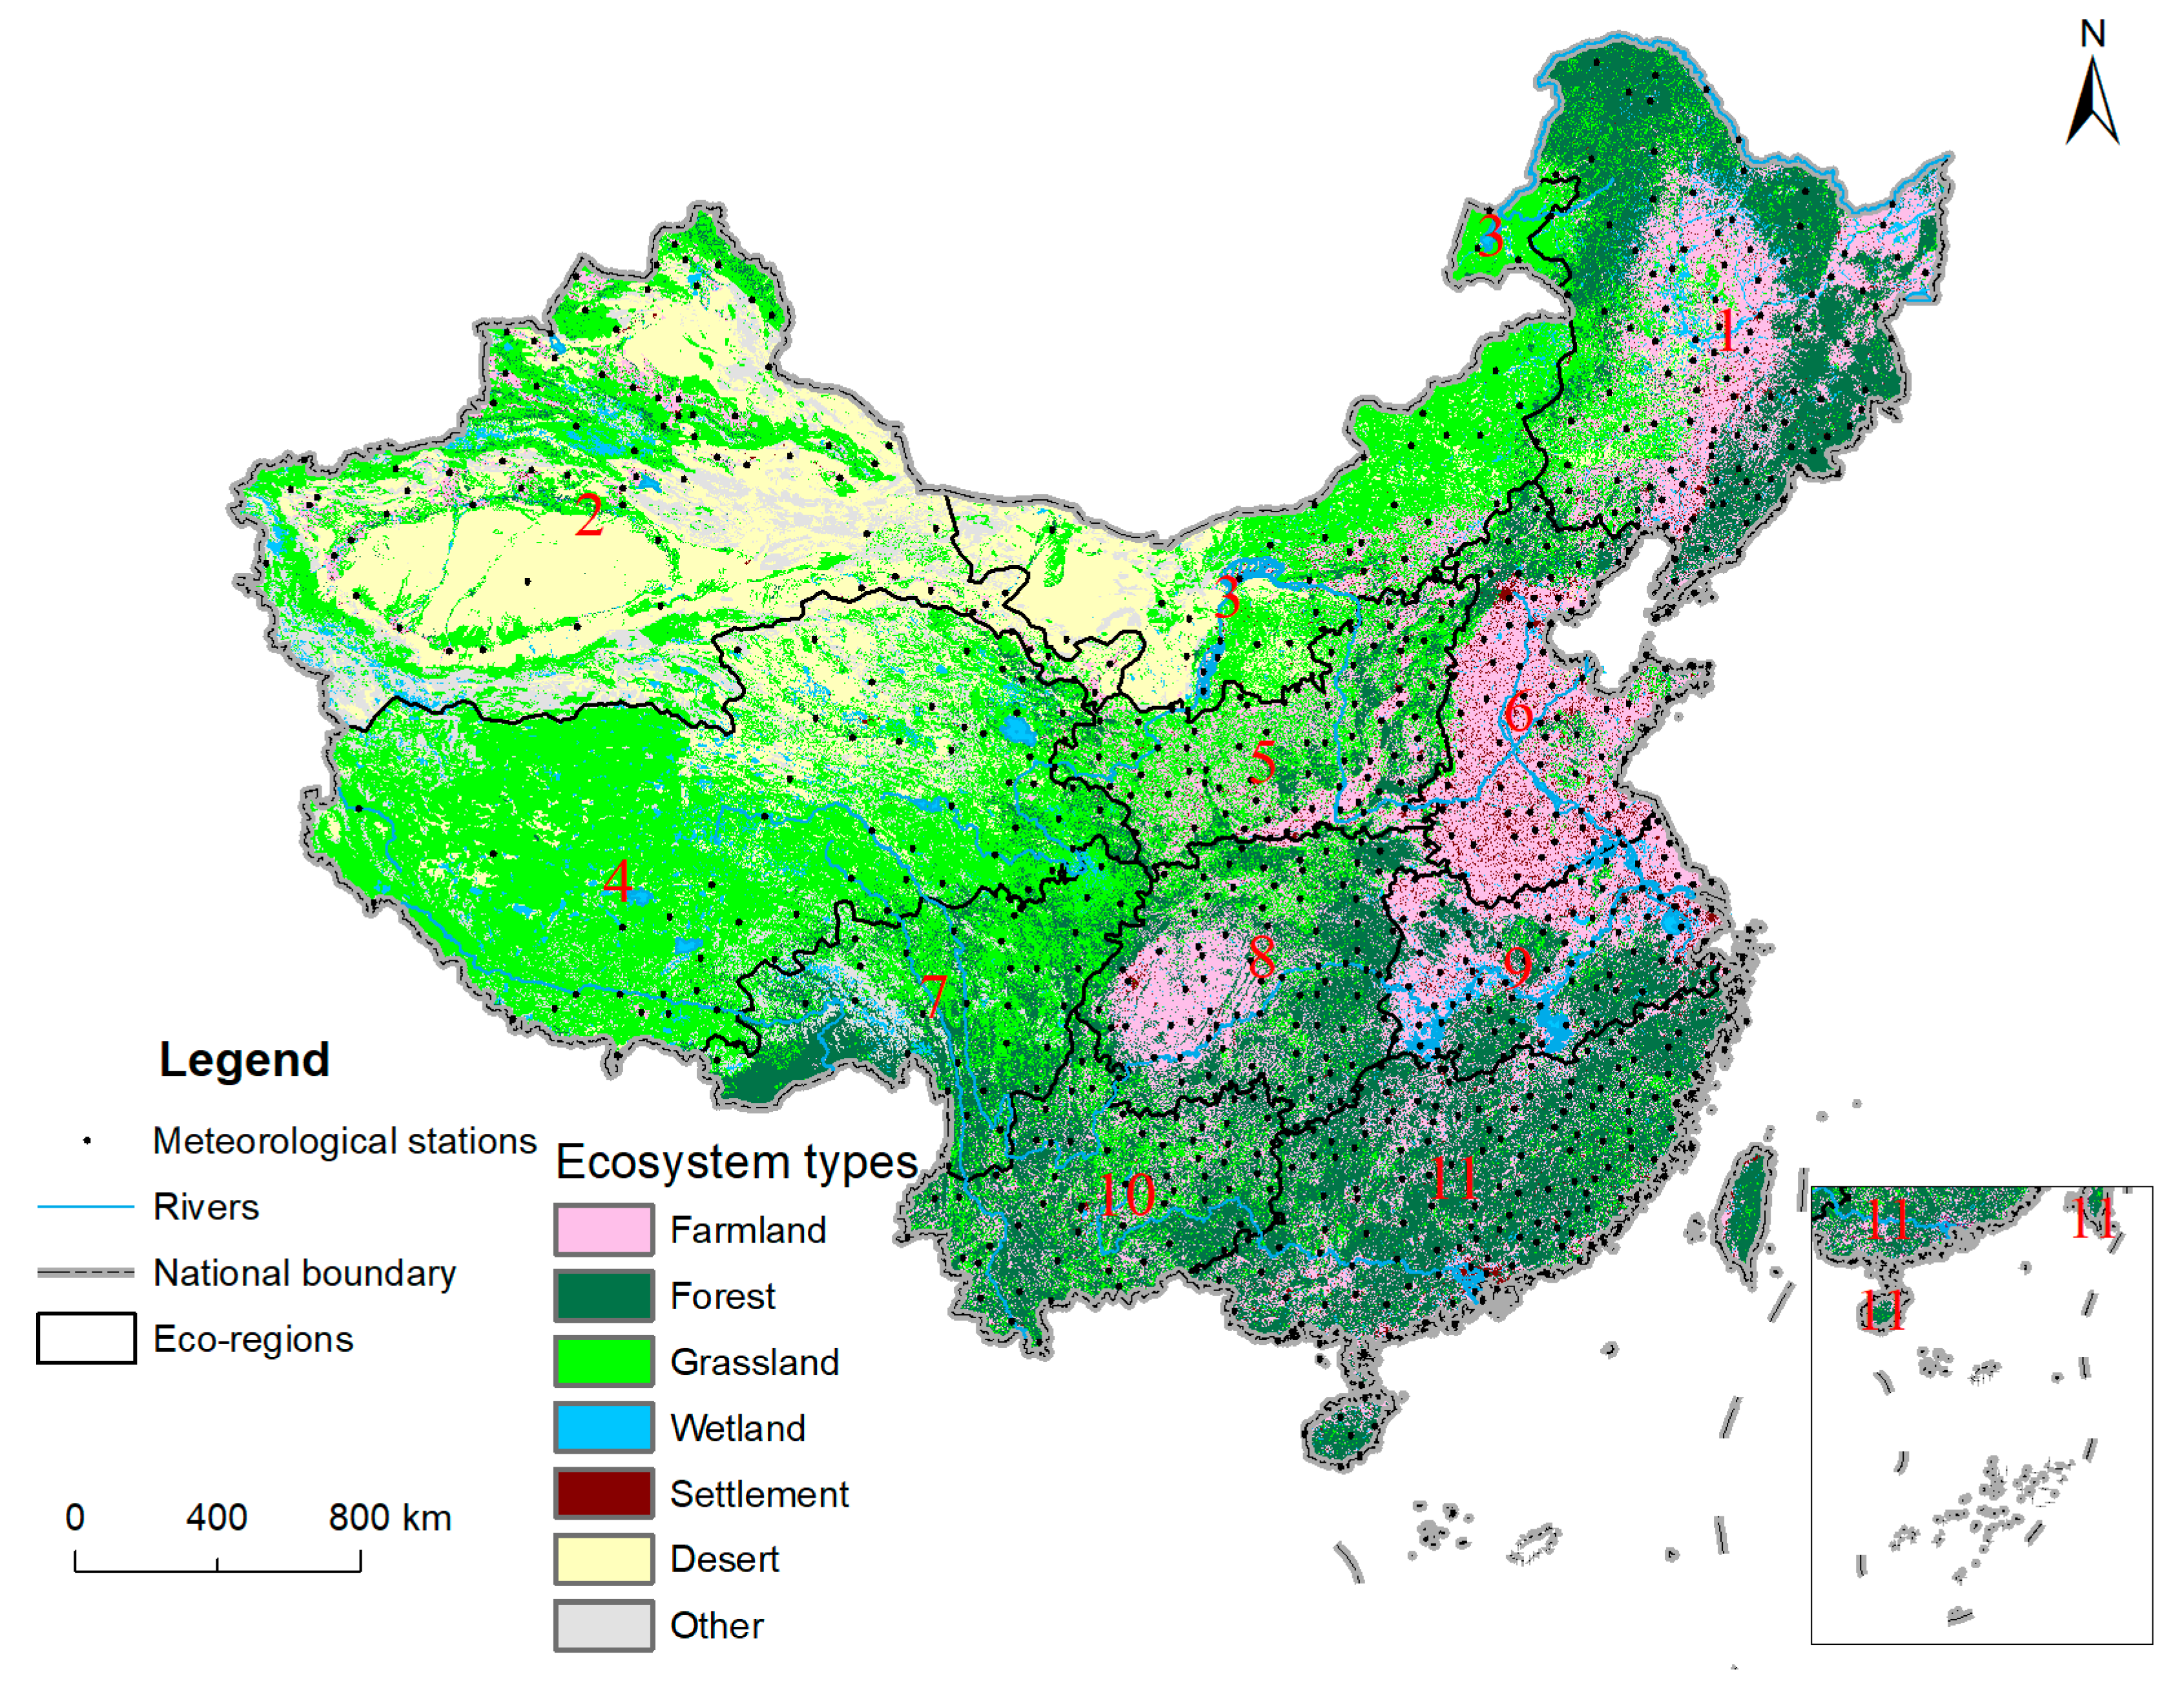
China, with the land area of 9.6 million square kilometers, is character by diverse geomorphic and climate types, populations (1.395 billion by 2018) and social-economic development levels. The main ecosystem types of China are include grassland (31.37%), forest (24.06%), farmland (19.6%), desert (13.41%), other (6.49%), wetland (3.54%) and settlement (1.54%) (Figure 1). Along latitude gradient from the south to the north, its tropical zone, warm temperate zone and the cold temperate zone [27,28]. China has rich river network systems. The well-known seven major river systems in China include the Pearl River system, Yangtze River system, Yellow River system, Huaihe River system, Liaohe River system, Haihe River system and Songhuajiang River system. These seven major river basins cover around 64 percent of the country’s total land area. Based on precipitation, temperature, altitude, vegetation index and geomorphological conditions, the land territory of China were divided into eleven ecoregions [29]: the Northeast China (1), Northwest arid area (2), Inner Mongolia plateau (3), Qinghai-Tibet Plateau (4), the Loess Plateau (5), the northern China (6), the Hengduan Mountains (7), the Sichuan and Chongqing region (8), the Middle and lower reaches of the Yangtze River (9), the Yunan-Guizhou Plateau (10) and the South China (11) (Figure 1).
2.2. The NPP-Based Model for Mapping WP
The net primary production (NPP) of vegetation combined with a variety of other ecosystem attributes are used as a composite indicator model for mapping the WP service at a large scale [23,26] (Equation (1)):
where WP refers to the capability of the water provision service of the ecosystem. The NPP is the annual net primary production of vegetation. The VCnpp describes the standard deviation of the NPP within a year. We used the terrestrial Carnegie Ames-Stanford Approach (CASA) to estimate the NPP of ecosystems [30] (Equation (2)). The VCnpp is the standard deviation of the monthly NPP within a year. Soil infiltration capacity factor Fsic is derived from the USDA (United States Department of Agriculture) soil texture dataset, with 13 categories of soil particles [31]. In ascending order, they are clay (heavy), silty clay, clay, silty clay loam, clay loam, silt, silt loam, sandy clay, loam, sandy clay loam, sandy loam, loamy sand, and sand. Each category is assigned a value of 1/13, 2/13,…, and 13/13, following the same order. Annual precipitation map Fpre was interpolated from 837 meteorological station data in China using the ordinary Kriging method in the Geostatistical Analyst modular of the ArcGIS 10.2 software (ESRI) (Redlands, CA, USA). The Fslo refers to the slope of the land surface.
WP = NPP × (1−VCnpp) × Fsic × Fpre × (1 − Fslo)
The terrestrial Carnegie Ames-Stanford Approach (CASA) was used to estimate the NPP of vegetation. The CASA model advocates determining the NPP of vegetation as the product of the modulated absorbed photosynthetically active radiation (APAR) and the light use efficiency (ε) factor [30,32]:
where NPP(x,t) describes the net primary production of location x at time t, APAR refers to the canopy-absorbed incident solar radiation (MJ × m−2), and the parameter ε(x,t) is the light use efficiency (g × C·× MJ−1).
Except for NPP, all the parameters of VCnpp, Fslo, and Fpre factors are standardized between 0 and 1 by the maximum and minimum values of their values from the year 2000 to 2013. The units of the WP are dimensionless. In this study, the value of WP in China is ranged from 0 to 466.51. The zero WP regions are located at the desert areas of the Northwest arid ecoregion, where no vegetation cover is distributed and the annual precipitation is zero. The largest WP regions are located in the tropical monsoon rainforest of Hainan Island of South China ecoregion where the NPP and annual precipitation is the largest in China. All the spatial analysis (e.g., interpolation and raster calculation) was performed in ArcGIS 10.2 software (ESRI).
2.3. Other Analysis Methods
The linear regression trend approach has been widely used in trend detection for vegetation change and climate variations in a continuous period [33]. In this paper, we used linear regression to analyze the changing trend of WP, precipitation, and temperature from 2000 to 2013. The classification of linear trend is determined by the value of the linear trend and its significance level. It is classified into five categories: significantly decrease (P < 0.05 and linear trends a < 0), no changes (a = 0), no significant decrease (P > 0.05 and a < 0), no significant increase (P > 0.05 and a > 0), and significantly increase (P < 0.05 and a > 0). Pearson’s correlation analyses were performed using the function of [r,p] = corr (X,Y) in MATLAB Version R2010b (Natick, MA, USA). [33], which can return both the correlation coefficients r and p-value (significant test) simultaneously, where r and p represent the correlation coefficient matrix and the matrix of significant test results and X and Y are the respective vectors of WP and climate variation (e.g., annual precipitation or temperature) characteristics from 2000 to 2013. The significance of correlations between climate factors and annual WP are classified into five categories: significantly negative (P < 0.05 and the Person correlation coefficient (R) < 0), no significant negative (P > 0.05 and R < 0), no significant positive (P > 0.05 and R > 0), significant positive (P < 0.05 and R > 0), and no relations (R = 0).
2.4. Data Sources
The data used for mapping WP were as follows: daily meteorological data (solar radiation, precipitation, and temperature) from 2000 to 2013 were retrieved from the China Meteorological Data Sharing Service System (https://data.cma.cn/site/index.html) (Figure 1). Data at 837 stations within China were used to produce meteorological raster maps at 250m resolution using the ordinary Kriging method in the Geostatistical Analyst modular of the ArcGIS 10.2 (ESRI) software. The 250 m MODIS NDVI data acquired from the Atmosphere Archive and Distribution System were used to calculate the annual total NPP (https://ladsweb.modaps.eosdis.nasa.gov/). Spatial distribution data of terrestrial ecosystem types in China in 2000 and 2010 were collected from the Resource and Environment Data Cloud Platform (http://www.resdc.cn/). Topographical parameters were derived from the Shuttle Radar Topography Mission (STRM) digital elevation data at 90 m resolution (http://srtm.csi.cgiar.org/). The soil properties data was provided by the Cold and Arid Regions Sciences Data Center in Lanzhou (http://westdc.westgis.ac.cn). All the raster maps data were interpolated or resampled to 250 m resolution in the ArcGIS10.2 software (ESRI) before being input into the WP model for further analysis.
3. Results and Discussion
3.1. Evaluate of the Model Result
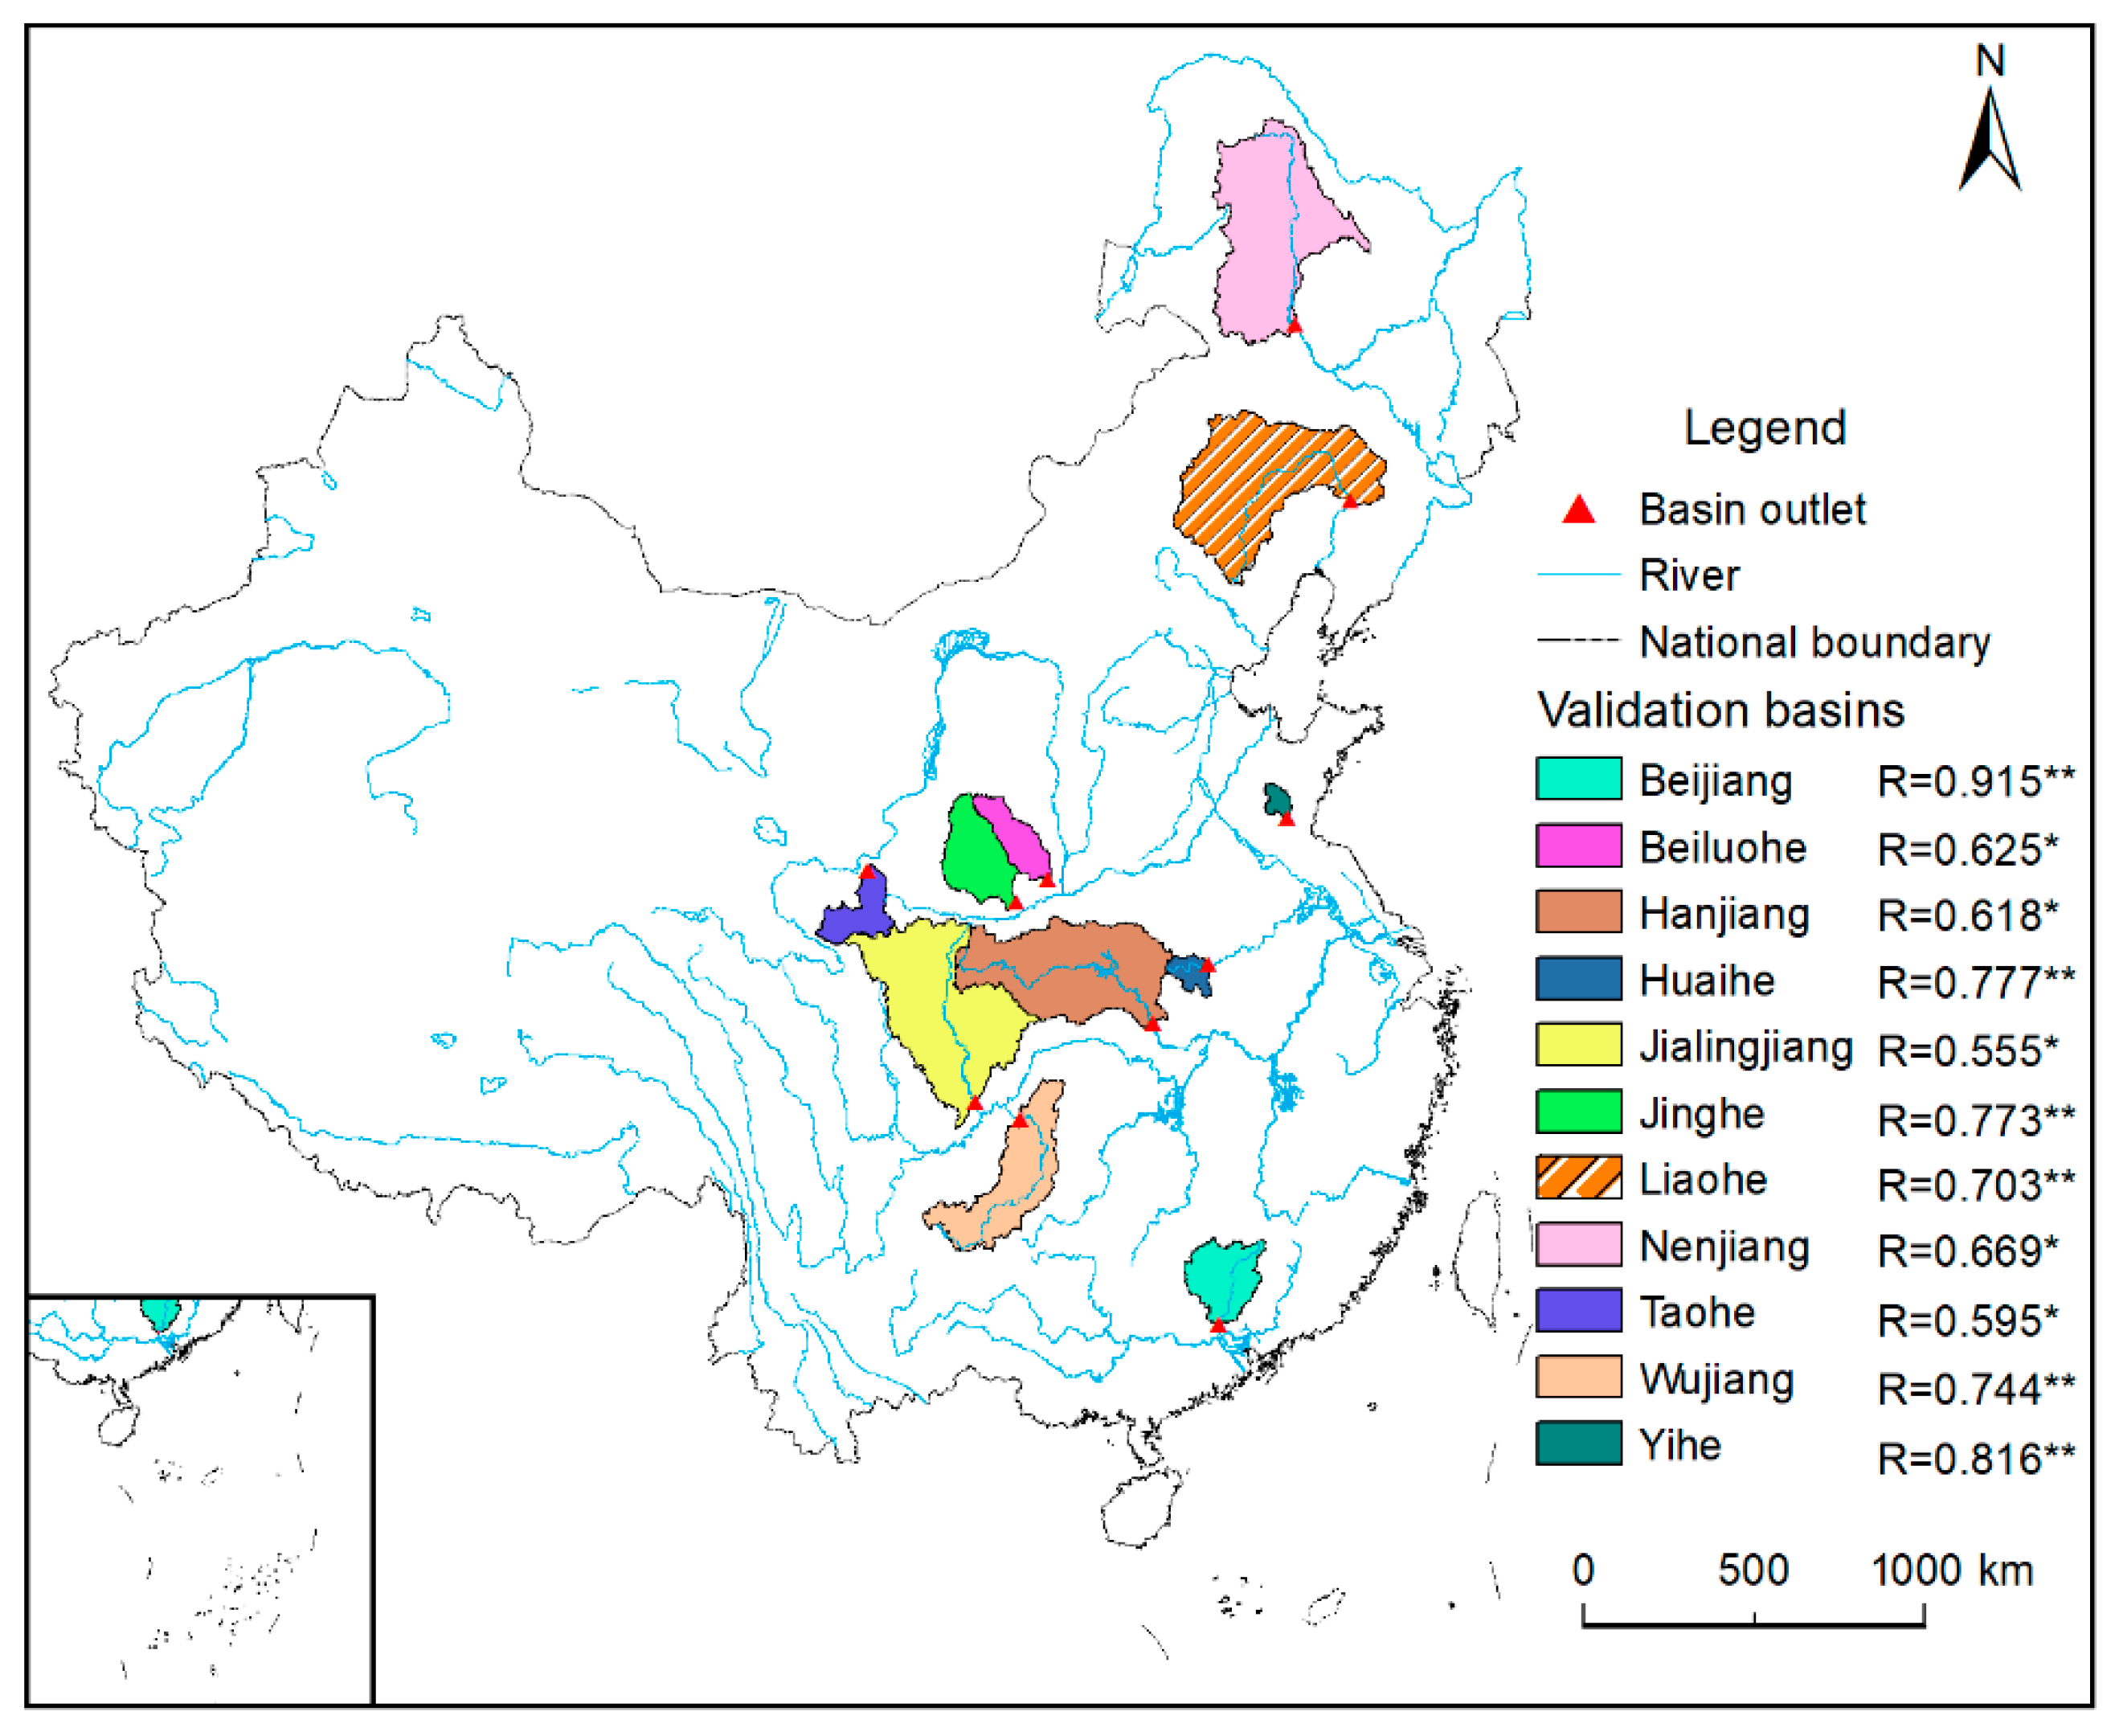
Generally, the validation of the processes-based model at the local scale is relatively simple to use the observation data. However, the validation of the regional model is very difficult because they usually applications based on parameterization rules developed at the local scale are performed at the regional scale where only gauge data are available for comparison [12]. In addition, due to data and parameter uncertainty and the fact that the distributed model cannot be calibrated at the regional scale, the model results remain uncertain [12]. Therefore, the accurate assessment of “available water” is difficult, especially in data-scarce regions [5]. Although many scholars believe that it is impossible to verify numerical models applied to large scales because the complexity and heterogeneity of geographical and ecological environment bring many uncertainties for verification and validation [10,23,34]. However, in this study, the runoff of the eleven highly representative sub-basins of the seven major river systems in China was used to evaluate the WP model results from 2000 to 2013 (Figure 2). The Pearson correlation coefficient between the WP and the runoff of the sub-basin were all higher than the significance test of 0.05, which indicates that the explored WP model has good accuracy and availability on a large scale. Therefore, we believe that the NPP-based model is a suitable approach for mapping WP and can be used in the further analysis of spatial patterns and linear trend assessment processes (Figure 2).
3.2. Spatiotemporal Patterns Variations of WP
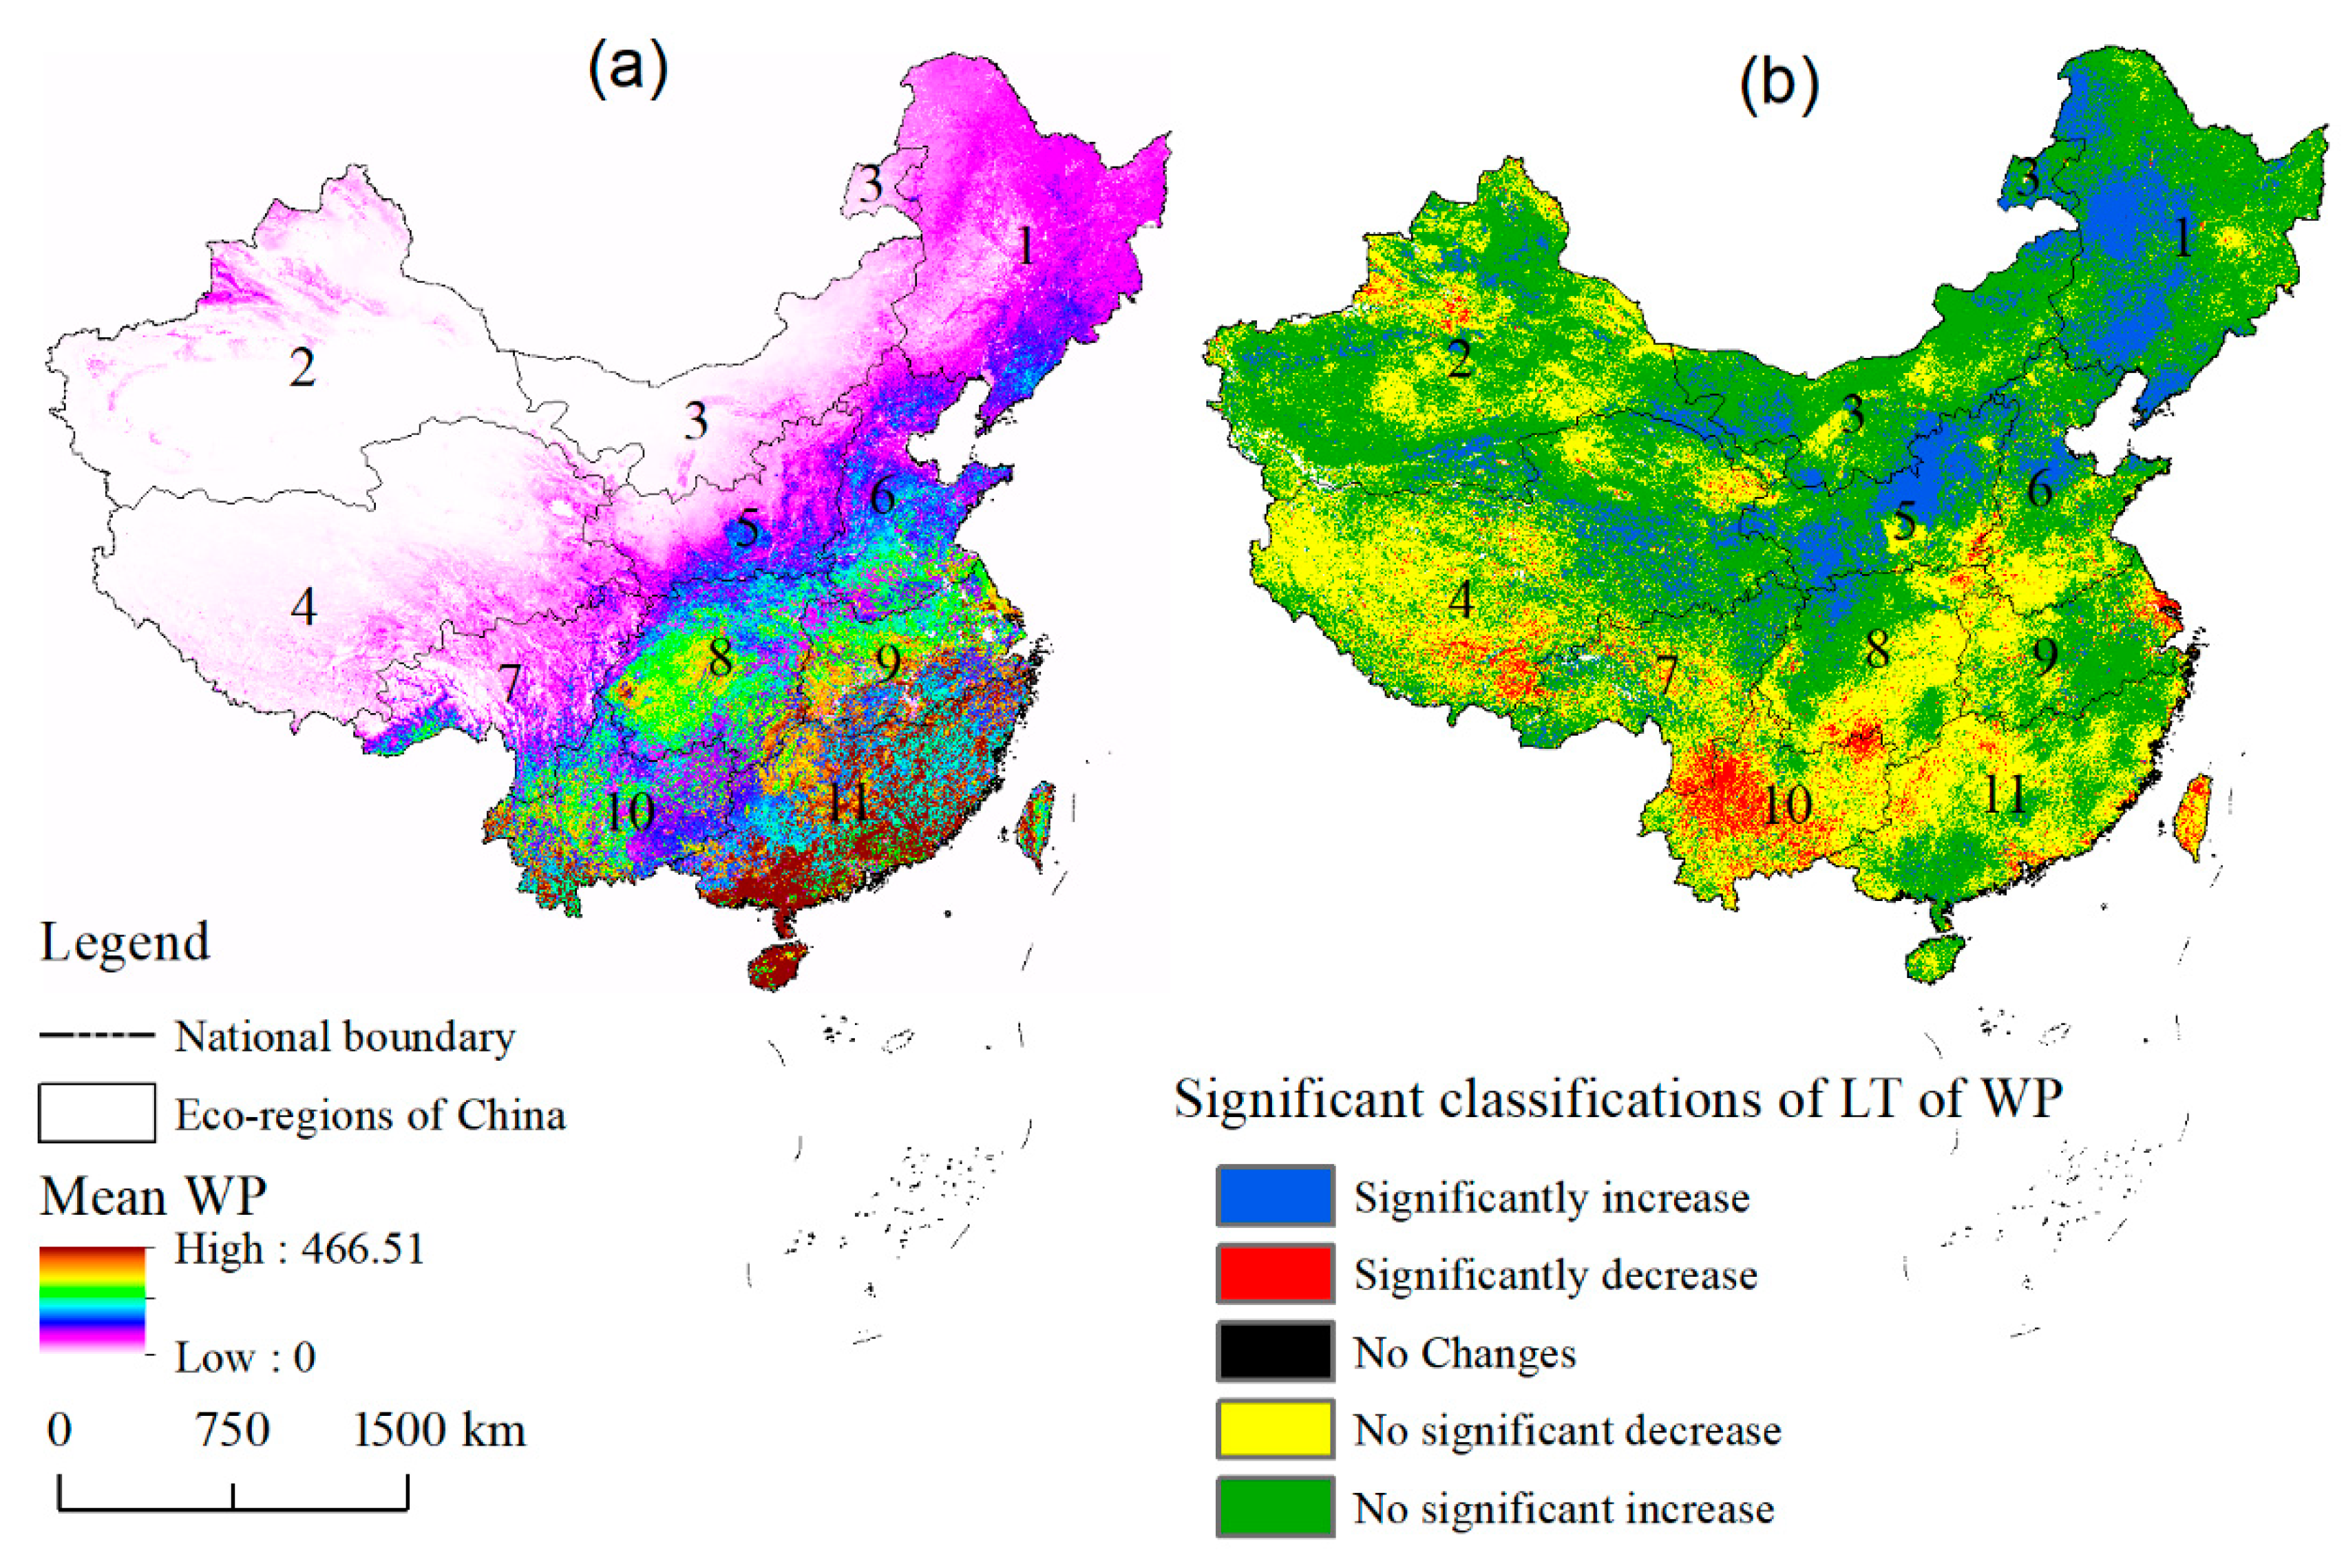
It can be obtained by analyzing Figure 3a, the annual mean WP increased from the northwest to the southeast of China and the spatial distributions of WP in the eleven ecoregions of China from 2000 to 2013 had tremendous heterogeneity. The average value of WP in China was 26.78 units (Figure 3a). The average WP was lowest in the Northwest Arid Area ecoregions with a value of only 1.19 units. The highest WP was in the South China ecoregion with the value of 98.35 units. The average WP values in other nine ecoregions follow the order of Qinghai-Tibet Plateau (3.04) < Inner Mongolia Plateau (3.44) < Northeast (17.90) < Hengduan Mountains (18.37) < Loess Plateau (18.54) < Northern China (37.53) < Sichuan and Chongqing (58.30) < Yunnan-Guizhou Plateau (58.42) < Middle and lower reaches of the Yangtze River (69.96) (Figure 3a).
The WP in the Loess Plateau and Hengduan Mountains ecoregions presented an increasing trend from 2000 to 2013, while a decreasing trend in the other nine ecoregions. Base on the variations and significant levels of the change, the linear trend of WP were classified into five types (Figure 3b). Although the annual WP in China from 2000 to 2013 slightly declined (−1.08 unit per year), the areas with increased WP (62.51%) were larger than the areas with decreased WP (36.49%). Furthermore, the significantly increased regions (11.43%) were larger than the significantly decreased regions (3.79%) (Table 1).
The significantly changed regions also had distinct spatial heterogeneity (Figure 3b). Among the significantly increased region, the WP in Loess Plateau ecoregions increased most (39.27%); the Northeast ecoregions come second, 29.27%; the other nine ecoregions with slightly increase. Among the significantly decreased regions, the WP in Yunnan-Guizhou Plateau ecoregion decreased the most (25.01% regions decreased) (Table 1). The significantly increased regions centered in the west part of the Northeast and the northern of Loess Plateau ecoregions, the significantly decreased regions gathered in the center of the Yunnan-Guizhou Plateau ecoregion, while the other significantly changed regions scattered across the China mainland.
3.3. Key Influence Factors of the Variations in WP
The amount of WP is limited by the precipitation in time and space and the spatial patterns of WP ecosystem are highly related to the spatial distributions of precipitation, vegetation, landforms, human-induced changes in land use and consuming activities [23,35,36,37]. The annual variations of WP service were primarily influenced by land use changing and climatic variations [23,35]. To investigate the quantitative relationship between WP and climate change (precipitation and temperature), we performed a spatial correlation between the time-series maps (Figure 4). The spatial heterogeneity of the linear trend of temperature is very high. The significantly decreased region of temperature is more located at the Northwest arid area while the significantly increased area is more located at the Qinghai-Tibet Plateau and the Yunan-Guizhou Plateau. The linear correlation between annual temperature and WP is significantly negative in Northeast China and the Yunan-Guizhou Plateau. The significantly increased regions of precipitation are more located in Northeast China while the significantly decrease regions is more located at the Qinghai-Tibet Plateau and the Yunan-Guizhou Plateau. Nearly all of the area of precipitation has a positive correlation with WP (Figure 4).
Besides, the transformation of ecosystems from 2000 to 2010 was also used to reveal the effects of land use on WP (Table 2). From the whole China scale, the area of farmland and grassland increased while the critical transformation characteristics of the ecosystem are the convert of farmland into the settlement ecosystem. In the significantly increase region of WP, the area of farmland and forest is increased that is because of the convert of grassland, wetland, and desert into farmland and forest ecosystem. In the Qinghai-Tibet Plateau, the typical feature of ecosystem variation is the grassland convert into dessert and settlement while the dessert converts into the wetland. In the Loess Plateau, the main transformation characteristics are the convert of farmland into forest and grassland ecosystems. In Northeast China, the increasing of forest and farmland are caused by the convert of grassland and wetland ecosystem. In the in Yunan-Guizhou Plateau, the decreasing farmland is because of the convert of farmland into the settlement ecosystem. The coastal significantly decreasing areas of the Middle and lower reaches of the Yangtze River and South China are located in the giant city of Shanghai and Guangzhou. In the process of rapid urbanization in these two cities, farmland and forestland are gradually eroded by urban land, resulting in a significant decrease of WP (Figure 1 and Figure 3b).
In sum, the significant decrease of the WP in the north of the Qinghai-Tibet Plateau was due to the grassland convert into dessert and the dessert convert into wetland, and the significant decrease of precipitation; the decreasing of the WP in Yunan-Guizhou Plateau are because the farmland convert into settlement ecosystem, the significant decrease of precipitation and significantly increase in temperature; the significant increase of the WP in Northeast China are because the increasing of forest and farmland, the grassland and wetland convert into farmland and forest, the significantly decrease of temperature and increase of precipitation; Although the increase of precipitation has played an important role in promoting WP, the significant increase of WP in the Loess Plateau was mainly due to the farmland convert into forest and grassland ecosystem types. The significant decreasing of WP in coastal areas of the Middle and lower reaches of the Yangtze River and South China are because of the farmland and forestland gradually eroded by urban land during the urbanization process of Shanghai and Guangzhou (Figure 3b and Figure 4, Table 2).
3.4. Limitations and Usefulness in Future Studies
Some limitations and usefulness can be concluded when using this method in further studies. Firstly, because the main indicator of this composite indicator method is NPP data, which contributes around 80% of the WP value [23]. Therefore, the spatial distribution of the hotspots for conserving WP will mostly be concentrated in forestland [23,25,26]. However, from the perspective of ecosystem diversity protection, the other types of ecosystem types also make important contributions to sustain WP services in given spatial scales. Therefore, in the specific designation of WP protection areas, diversity factors of different ecosystem types should be included in a conservation program at the specific ecological regions. For example, both incorporate the total amount of WP and the area proportions of each ecosystem types in the prioritization processes of WP conserving locations. Secondly, although the NPP-based composite indicator for mapping WP can reveal the relative rankings of WP in a specific region rather than the specific amounts of WP modeled by using process-based approaches, they are sufficient to meet the requirements of priority setting for conservation or land-use management [22,23,24,25,26]. Finally, as discussed in the above sections, many scholars believe that it is difficult to spatial explicitly accurately assess and verify the amount of water provide in each component of a hydrological process due to the complexity of the process, the scarcity of data, and the uncertain impact of numerous natural and human factors [10,12,23,34]. So the shortcoming of this easy to use NPP-based model was the validation of the results. Generally, the precipitation over land is divided into the green water and blue water resources [36,37]. The blue water is the runoff via groundwater and surface water, and the green water is the rainfall that intercepted by vegetation and eventually returns to the atmosphere as evapotranspiration or infiltrates into the soil [36,37]. The amount of blue water is usually less than green water and both are limited by the precipitation in time and space [37]. The patterns of WP in the landscape is highly affected by the spatial distributions of rainfall, vegetation, human-induced changes in land use and consuming activities [35,36,37,38]. The NPP-based composite indicator model of this article without dividend the WP into the green and blue water, which simulates WP by multiplying NPP and its variations with the soil infiltration capacity factor, annual precipitation and the slope of the land surface [23,24,25,26]. These parameters are chosen to map WP because they are closely related to hydrological processes and both integrate the green water-related parameter and blue water-related variables [23,36,37]. Through the coupling analysis of the spatial-temporal change pattern of WP services on a national scale and its driving factors with climate change and land-use change, it can be seen that the composite indicator method based on NPP can not only meet these requirements but also effectively reveal the driving factors of WP service changes. The results show that the NPP-based method for mapping WP is sensitive to runoff, precipitation, and land-use change. Although there is room for future improvement the NPP-based model to build composite indicators for assessing multiple ES, the opportunities of this method are the convenience of using it in multi-scales, such as local, regional and national policy decision making processes or in the data-scarce regions [10,26]. Furthermore, the sustainable use of WP for different purposes will not only need to consider the demand in water quantity, but also for water temperature and salinity, nutrient levels and other pollutants [39].The presented analysis only focuses on water quantity, but water quality is also an important factor affecting available freshwater resources to ecosystems and human use. Globally, there is a growing concern that water quality degradation, such as non-point source pollution from agricultural production [40], should be considered when evaluating WP capabilities [39]. It is possible to extend the NPP-based model to consider the impacts of different land-use types on nutrient loading and therefore WP capabilities. The environmental degradation resulting from socio-economic development is prevalent in many developing countries, this approach can be used for informing ecological conservation decisions in countries or regions facing similar problems.
4. Summary and Conclusions
The consistent and rapid growth of population and economic development in recent decades poses increasing environmental challenges, especially the water crisis [41,42]. To restore and sustain the fragile ecosystems, the Chinese government has proposed several ecological protection measures to curb the trend of environmental degradation [6,7,43]. These ecological protection measures have delineated key areas for water conservation services. However, due to the different starting times of these protected areas and the absence of strict legal protection, these protected areas have essentially faced or suffered serious environmental damage over time [6,43,44]. Therefore, both from the perspective of decision-making departments and scientific research, it is necessary to put forward practical and effective evaluation methods for the effect of rapid ecological protection areas suitable for large-scale applications and to formulate effective ecological compensation plans and ecological restoration and protection measures [45]. Among the existing evaluation methods, the ecological process-based method is the preferred long-term evaluation and detection method because it is easy to be accepted by experts and scholars. However, this method simplifies the application of model parameters established based on long-term data observation on a small scale to a large scale, and the results will inevitably bring some uncertainty at large scale, for example, the results usually lack spatial location information. Therefore, it is urgent to propose a simple, effective and relatively accurate evaluation methods to monitor changes in WP services in key ecoregions. The NPP-based composite indicator model of this article may meet these policy gaps.
In sum, the WP service is critical for economic development and environmental sustainability. In this study, an NPP-based composite indicator approach was proposed to map the WP on a broad scale, with China as a case study. The sensitive revelation of the model result of spatial patterns changing of WP service and its driving factors on a large scale indicates the practicability and reliability of the method proposed. The results show that the average value of WP was lowest in the Northwest Arid Area ecoregions while the highest value of WP was in the South China ecoregion. The linear trend of WP in the Loess Plateau and Hengduan Mountains ecoregions were increased while decreased in the other nine ecoregions. The significant variations of WP in the north of the Qinghai-Tibet Plateau, Yunan-Guizhou Plateau, Northeast China, and the Loess Plateau was mainly due to land use and climate-changing. The significant decreasing of WP in coastal areas of the Middle and lower reaches of the Yangtze River and South China are because of the urbanization process of Shanghai and Guangzhou. In brief, the indicator explored by this research is affecting and benefiting for revealing the variations of WP under different land use changing and climate scenario backgrounds, these findings can help inform national water conservation planning or swift assessing and longtime surveillance of WP variations in conservational areas.
Author Contributions
Conceptualization, methodology, H.Z., L.Z.; data analyzing, writing, H.Z., L.Z. and P.W.; language editing and review, L.Z., Y.L.
Funding
This research was jointly supported by the National Key Research and Development Plan of China (2016YFC0501601) and the National Natural Science Foundation of China (41871187, 41601182).
Acknowledgments
The authors are very grateful to the editor and the anonymous three reviewers for their valuable comments, which have greatly improved the paper.
Conflicts of Interest
The authors declare no conflict of interest.
References
- Yang, L.; Zhang, L.; Li, Y.; Wu, S. Water-related ecosystem services provided by urban green space: A case study in Yixing City (China). Landsc. Urban Plan. 2015, 136, 40–51. [Google Scholar] [CrossRef]
- Wang, P.; Zhang, L.; Li, Y.; Jiao, L.; Wang, H.; Yan, J.; Lü, Y.; Fu, B. Spatio-temporal variations of the flood mitigation service of ecosystem under different climate scenarios in the Upper Reaches of Hanjiang River Basin, China. J. Geogr. Sci. 2018, 28, 1385–1398. [Google Scholar] [CrossRef] [Green Version]
- Rodell, M.; Famiglietti, J.S.; Wiese, D.N.; Reager, J.T.; Beaudoing, H.K.; Landerer, F.W.; Lo, M.H. Emerging trends in global freshwater availability. Nature 2018, 557, 651–659. [Google Scholar] [CrossRef] [PubMed]
- Xiao, Y.; Ouyang, Z. Spatial-temporal Patterns and Driving Forces of Water Retention Service in China. Chin. Geogr. Sci. 2019, 29, 100–111. [Google Scholar] [CrossRef]
- Hasan, E.; Tarhule, A.; Kirstetter, P.-E.; Clark, R.; Hong, Y. Runoff sensitivity to climate change in the Nile River Basin. J. Hydrol. 2019, 561, 312–321. [Google Scholar] [CrossRef]
- Lü, Y.; Ma, Z.; Zhang, L.; Fu, B.; Gao, G. Redlines for the greening of China. Environ. Sci. Policy 2013, 33, 346–353. [Google Scholar] [CrossRef]
- Bryan, B.A.; Gao, L.; Ye, Y.; Sun, X.; Connor, J.D.; Crossman, N.D.; Stafford-Smith, M.; Wu, J.; He, C.; Yu, D.; et al. China’s response to a national land-system sustainability emergency. Nature 2018, 559, 193–204. [Google Scholar] [CrossRef] [PubMed]
- Jiang, B.; Bai, Y.; Wong, C.P.; Xu, X.; Alatalo, J.M. China’s ecological civilization program-Implementing ecological redline policy. Landsc. Ecol. 2019, 81, 111–114. [Google Scholar] [CrossRef]
- Xu, W.; Pimm, S.; Du, A.; Su, Y.; Fan, X.; An, L.; Liu, J.; Ouyang, Z. Transforming Protected Area Management in China. Trends Ecol. Evol. 2019, 2554, 4. [Google Scholar] [CrossRef]
- Alam, M.; Dupras, J.; Messier, C. A framework towards a composite indicator for urban ecosystem services. Ecol. Indic. 2016, 60, 38–44. [Google Scholar] [CrossRef]
- Mattos, J.B.; Santos, D.A.; Falcão-Filho, C.A.T.; Santos, T.J.; Santos, M.G.; De Paula, F.C.F. Water production in a Brazilian montane rainforest: Implications for water resources management. Environ. Sci. Policy 2018, 84, 52–59. [Google Scholar] [CrossRef]
- Bormann, H.; Diekkrüger, B. Possibilities and limitations of regional hydrological models applied within an environmental change study in Benin (West Africa). Phys. Chem. Earth 2003, 28, 33–36. [Google Scholar] [CrossRef]
- Ma, S.; Zhou, Y.; Gowda, P.H.; Dong, J.; Zhang, G.; Kakani, V.G.; Wagle, P.; Chen, L.; Flynn, K.C.; Jiang, W. Application of the water-related spectral reflectance indices: A review. Ecol. Indic. 2019, 98, 68–79. [Google Scholar] [CrossRef]
- Awange, J.; Forootan, E.; Kusche, J.; Kiema, J.; Omondi, P.; Heck, B.; Fleming, K.; Ohanya, S.; Goncalves, R. Understanding the decline of water storage across the Ramser-Lake Naivasha using satellite-based methods. Adv. Water Resour. 2013, 60, 7–23. [Google Scholar] [CrossRef]
- Yuan, Q.; Wu, S.; Zhao, D.; Dai, E.; Chen, L.; Zhang, L. Modeling net primary productivity of the terrestrial ecosystem in China from 1961 to 2005. J. Geogr. Sci. 2014, 24, 3–17. [Google Scholar] [CrossRef]
- Zhang, J.; Zhang, Q.; Bao, A.; Wang, Y. A New Remote Sensing Dryness Index Based on the Near-Infrared and Red Spectral Space. Remote Sens. 2019, 11, 456. [Google Scholar] [CrossRef]
- Vegas-Galdos, F.; Alvarez, C.; Garcia, A.; Revilla, J.A. Estimated distributed rainfall interception using a simple conceptual model and Moderate Resolution Imaging Spectroradiometer (MODIS). J. Hydrol. 2012, 468–498, 213–228. [Google Scholar] [CrossRef]
- Li, W.; Du, Z.; Ling, F.; Zhou, D.; Wang, H.; Gui, Y.; Sun, B.; Zhang, X. A Comparison of Land Surface Water Mapping Using the Normalized Difference Water Index from TM, ETM+ and ALI. Remote Sens. 2013, 5, 5530–5549. [Google Scholar] [CrossRef] [Green Version]
- Costanza, R.; d’Arge, R.; de Groot, R.; Farber, S.; Grasso, M.; Hannon, B.; Limburg, K.; Naeem, S.; O’Neill, R.V.; Paruelo, J.; et al. The value of ecosystem services: Putting the issues in perspective. Ecol. Econ. 1998, 25, 67–72. [Google Scholar] [CrossRef]
- Zurlini, G.; Petrosillo, I.; Aretano, R.; Castorini, I.; D’Arpa, S.; De Marco, A.; Pasimeni, M.R.; Semeraro, T.; Zaccarelli, N. Key fundamental aspects for mapping and assessing ecosystem services: Predictability of ecosystem service providers at scales from local to global. Ann. Bot. 2014, 4, 53–63. [Google Scholar]
- Churkina, G.; Running, S.W.; Schloss, A.L.; Intercomparison, T.P. Comparing global models of terrestrial net primary productivity (NPP): The importance of water availability. Glob. Chang. Biol. 1999, 5, 46–55. [Google Scholar] [CrossRef]
- Xu, Z.; Wei, H.; Fan, W.; Wang, X.; Zhang, P.; Ren, J.; Lu, N.; Gao, Z.; Dong, X.; Kong, W. Relationships between ecosystem services and human well-being changes based on carbon flow—A case study of the Manas River Basin, Xinjiang, China. Ecosyst. Serv. 2019, 37, 100934. [Google Scholar] [CrossRef]
- Carreño, L.; Frank, F.C.; Viglizzo, E.F. Tradeoffs between economic and ecosystem services in Argentina during 50 years of land-use change. Agric. Ecosyst. Environ. 2012, 154, 68–77. [Google Scholar] [CrossRef]
- Barral, M.P.; Oscar, M.N. Land-use planning based on ecosystem service assessment: A case study in the Southeast Pampas of Argentina. Agric. Ecosyst. Environ. 2012, 154, 34–43. [Google Scholar] [CrossRef]
- Lü, Y.; Zhang, L.; Zeng, Y.; Fu, B.; Whitham, C.; Liu, S.; Wu, B. Representation of critical natural capital in China. Conserv. Biol. 2017, 31, 894–902. [Google Scholar] [CrossRef]
- Zhang, L.W.; Lü, Y.H.; Fu, B.J.; Dong, Z.B.; Zeng, Y.; Wu, B.F. Mapping ecosystem services for China’s ecoregions with a biophysical surrogate approach. Landsc. Urban Plan. 2017, 161, 22–31. [Google Scholar] [CrossRef]
- Wu, S.; Yang, Q.; Zheng, D. Delineation of eco-geographic regional system of China. J. Geogr. Sci. 2003, 13, 309–315. [Google Scholar]
- Zheng, J.; Yin, Y.; Li, B. A new scheme for climate regionalization in China. Acta Geogr. Sin. 2010, 1, 3–12. (In Chinese) [Google Scholar]
- Xie, G.; Zhang, C.; Zhang, L.; Su, D.; Cao, S.; Leng, Y.; Xiao, Y. China’s county-scale ecological regionalization. J. Nat. Resour. 2012, 27, 154–162. (In Chinese) [Google Scholar]
- Potter, C.S.; Randerson, J.T.; Field, C.B.; Matson, P.A.; Vitousek, P.M.; Mooney, H.; Klooster, S.A. Terrestrial ecosystem production: A process model based on global satellite and surface data. Glob. Biogeochem. Cycles 1993, 7, 811–841. [Google Scholar] [CrossRef]
- FAO; IIASA. Harmonized World Soil Database (Version 1.1); FAO: Rome, Italy; IIASA: Laxenburg, Austria, 2009. [Google Scholar]
- Zhu, W.; Pan, Y.; He, H.; Yu, D.; Hu, H. Simulation of maximum light use efficiency for some typical vegetation types in China. Chin. Sci. Bull. 2006, 51, 457–463. [Google Scholar] [CrossRef]
- Lü, Y.; Zhang, L.; Feng, X.; Zeng, Y.; Fu, B.; Yao, X.; Li, J.; Wu, B. Recent ecological transitions in China: Greening, browning, and influential factors. Sci. Rep. 2015, 5, 8732. [Google Scholar] [CrossRef]
- Oreskes, N.; Shrader-Frechette, K.; Belitz, K. Verification, validation, and confirmation of numerical models in the Earth sciences. Science 1994, 263, 641–646. [Google Scholar] [CrossRef]
- Fan, M.; Shibata, H. Spatial and temporal analysis of hydrological provision ecosystem services for watershed conservation planning of water resources. Water Resour. Manag. 2014, 28, 292–293. [Google Scholar] [CrossRef]
- Xu, H.; Wu, M. A First Estimation of County-Based Green Water Availability and Its Implications for Agriculture and Bioenergy Production in the United States. Water 2018, 10, 148. [Google Scholar] [CrossRef]
- Schyns, J.F.; Hoekstra, A.Y.; Booij, M.J.; Hogeboom, H.J.; Mekonnen, M.M. Limits to the world’s green water resources for food, feed, fibre, timber and bio-energy. Proc. Natl. Acad. Sci. USA 2019, 116, 4893–4898. [Google Scholar] [CrossRef]
- Yang, D.; Liu, W.; Tang, L.; Chen, L.; Li, X.; Xu, X. Estimation of water provision service for monsoon catchments of South China: Applicability of the InVEST model. Landsc. Urban Plan. 2019, 182, 133–143. [Google Scholar] [CrossRef]
- Van Vliet, M.; Flörke, M.; Wada, Y. Quality matters for water scarcity. Nat. Geosci. 2017, 10, 800–802. [Google Scholar] [CrossRef]
- Xu, H.; Liu, Z.; Wang, L.; Wan, H.; Jing, C.; Jiang, J.; Wu, J.; Qi, J. Trade-offs and spatial dependency of rice production and environmental consequences at community level in Southeastern China. Environ. Res. Lett. 2018, 13, 024021. [Google Scholar] [CrossRef] [Green Version]
- Ren, H.; Shen, W.J.; Lu, H.F.; Wen, X.Y.; Jian, S.G. Degraded ecosystems in China: Status, causes, and restoration efforts. Landsc. Ecol. Eng. 2007, 3, 1–13. [Google Scholar] [CrossRef]
- Wang, Y.; Wan, T.; Tortajada, C. Water demand framework and water development—The case of China. Water 2018, 10, 1860. [Google Scholar] [CrossRef]
- Liu, S.; Dong, Y.; Cheng, F.; Coxixo, A.; Hou, X. Practices and opportunities of ecosystem service studies for ecological restoration in China. Sustain. Sci. 2016, 11, 935–944. [Google Scholar] [CrossRef]
- Cao, S. Impact of China’s Large-Scale Ecological Restoration Program on the Environment and Society in Arid and Semiarid Areas of China: Achievements, Problems, Synthesis, and Applications. Crit. Rev. Environ. Sci. Technol. 2011, 41, 317–335. [Google Scholar] [CrossRef]
- Huang, L.; Zheng, Y.; Xiao, T. Regional differentiation of ecological conservation and its zonal suitability at the county level in China. J. Geogr. Sci. 2018, 28, 46–58. [Google Scholar] [CrossRef]
Figure 1.
The distributions of ecoregions, meteorological stations and ecosystem types in China.

Figure 2.
Spatial distributions of the eleven sub-basins for validation. R represents the correlation coefficients between WP and runoff in each sub-basin. The double asterisk (**) indicates that the significance level of correlation coefficient (R) is less than 0.01 and the asterisk (*) represents the significance level of R is greater than 0.01 and less than 0.05.

Figure 3.
Spatial patterns of mean annual WP (a) and the linear trend of annual WP (b) from 2000 to 2013. In Figure 3b, the classification method of the linear trend is given in Section 2.3.
Figure 3.
Spatial patterns of mean annual WP (a) and the linear trend of annual WP (b) from 2000 to 2013. In Figure 3b, the classification method of the linear trend is given in Section 2.3.

Figure 4.
Linear trends (LT) and correlations of annual temperature (AT), precipitation (AP) and WP in China from 2000 to 2013. Methods for Classifying of the significance of linear trends of AT (a) and AP (b) are the same as in Figure 3. The significance of correlations between AT (c) or AP (d) and annual WP are classified into five categories, methods are given in the Section 2.3.


Table 1.
The area proportions (%) of the different classifications of the linear trend of WP in eleven ecoregions and the whole of China from 2000 to 2013.
Table 1.
The area proportions (%) of the different classifications of the linear trend of WP in eleven ecoregions and the whole of China from 2000 to 2013.
| Ecoregions ID | 1 | 2 | 3 | 4 | 5 | 6 | 7 | 8 | 9 | 10 | 11 | China |
|---|---|---|---|---|---|---|---|---|---|---|---|---|
| Decrease | 7.32 | 29.54 | 10.82 | 46.29 | 15.89 | 33.48 | 45.13 | 53.77 | 41.90 | 83.42 | 58.36 | 36.49 |
| Increase | 92.43 | 68.32 | 89.04 | 51.97 | 84.10 | 66.06 | 53.3 | 46.23 | 57.60 | 16.43 | 40.65 | 62.51 |
| Significantly Decrease | 0.34 | 1.20 | 0.17 | 3.64 | 1.07 | 2.21 | 6.80 | 3.37 | 4.75 | 25.01 | 5.04 | 3.79 |
| No Significant Decrease | 6.98 | 28.34 | 10.65 | 42.65 | 14.82 | 31.27 | 38.33 | 50.41 | 37.14 | 58.41 | 53.32 | 32.70 |
| No Changes | 0.25 | 2.14 | 0.14 | 1.74 | 0.01 | 0.45 | 1.57 | 0.00 | 0.51 | 0.14 | 0.99 | 1.01 |
| No Significant Increase | 63.22 | 61.19 | 74.32 | 44.57 | 44.83 | 52.36 | 44.91 | 41.22 | 54.7 | 15.5 | 39.01 | 51.08 |
| Significantly Increase | 29.21 | 7.13 | 14.72 | 7.40 | 39.27 | 13.71 | 8.38 | 5.00 | 2.9 | 0.93 | 1.64 | 11.43 |
Table 2.
The area of different typical variation regions of WP from 2010 to 2010 (km2).
| Ecosystem Types | Farmland | Forest | Grassland | Wetland | Settlement | Desert | Other |
|---|---|---|---|---|---|---|---|
| China | −9114 | 3073 | −11,294 | −242 | 21,881 | −4492 | 188 |
| Significant Increase region | 6136 | 1495 | −4170 | −1262 | 667 | −2610 | −256 |
| Significant Decrease region | −7406 | −674 | −590 | 1124 | 7935 | −411 | 22 |
| Northeast China(1) | 831 | 252 | −489 | −684 | 85 | 4 | 1 |
| Qinghai-Tibet Plateau(4) | 79 | −2 | −830 | 393 | 355 | −55 | 60 |
| Loess Plateau(5) | −1696 | 1353 | 366 | −34 | 77 | −80 | 14 |
| Yunan-Guizhou Plateau(10) | −255 | 7 | 13 | 49 | 186 | 0 | 0 |
© 2019 by the authors. Licensee MDPI, Basel, Switzerland. This article is an open access article distributed under the terms and conditions of the Creative Commons Attribution (CC BY) license (http://creativecommons.org/licenses/by/4.0/).
Share and Cite
MDPI and ACS Style
Zheng, H.; Zhang, L.; Wang, P.; Li, Y. The NPP-Based Composite Indicator for Assessing the Variations of Water Provision Services at the National Scale. Water 2019, 11, 1628. https://doi.org/10.3390/w11081628
AMA Style
Zheng H, Zhang L, Wang P, Li Y. The NPP-Based Composite Indicator for Assessing the Variations of Water Provision Services at the National Scale. Water. 2019; 11(8):1628. https://doi.org/10.3390/w11081628
Chicago/Turabian StyleZheng, Haibo, Liwei Zhang, Pengtao Wang, and Yingjie Li. 2019. "The NPP-Based Composite Indicator for Assessing the Variations of Water Provision Services at the National Scale" Water 11, no. 8: 1628. https://doi.org/10.3390/w11081628
Note that from the first issue of 2016, this journal uses article numbers instead of page numbers. See further details here.