Article

First Steps into an Integrated Karst Aquifer Vulnerability Approach (IKAV). Intrinsic Groundwater Vulnerability Analysis of the Yucatan Karst, Mexico

by
Miguel Moreno-Gómez
1,*,
Carolina Martínez-Salvador
2,
Ahmed-Walid Moulahoum
2,
Rudolf Liedl
3,
Catalin Stefan
1 and
Julia Pacheco
4
1
Research Group INOWAS, Department of Hydrosciences, Technische Universität Dresden, 01069 Dresden, Germany
2
Erasmus Mundus GroundwatCH Master Study Program, Technische Universität Dresden, 01069 Dresden, Germany
3
Institute for Groundwater Management, Department of Hydrosciences, Technische Universität Dresden, 01069 Dresden, Germany
4
Department of Environmental Engineering, Yucatan Autonomous University (Retired), 97203 Merida, Mexico
*
Author to whom correspondence should be addressed.
Water 2019, 11(8), 1610; https://doi.org/10.3390/w11081610
Submission received: 27 June 2019 / Revised: 1 August 2019 / Accepted: 1 August 2019 / Published: 2 August 2019
(This article belongs to the Special Issue Assessing Surface and Ground- Water Vulnerability and Pollution Risk)

Abstract

:
Karst groundwater vulnerability maps are important tools for the development of groundwater management and protection strategies. However, current methodologies do not always match regional characteristics and parameter adaptations are necessary. In addition, other important processes such as dilution and aquifer residence time are not included in vulnerability analysis for the complications of evaluating two or more criteria simultaneously. The integrated karst aquifer vulnerability approach (IKAV) project aims to develop an integrated approach to include these parameters and estimate global change implications in current and future scenarios. As a first step, intrinsic vulnerability methodologies are studied in order to highlight important parameters and the congruence with regional characteristics of the Yucatan karst. Results demonstrate agreement between methods for the evaluation of high and very high vulnerabilities and their relation with fissures and dolines. Moderate vulnerabilities are assigned to more than 50% of the area. However, moderate vulnerabilities, assigned to the coastal area and the Southern hill, are highly questionable. Intrinsic features affecting moderate classes vary according to the method. Parameter sensitivity analysis and overlap analysis demonstrate the influence of depth to the unsaturated zone, soils, precipitation, and slope on moderate values. Therefore, such parameters must be re-evaluated and discretized according to the characteristics of the study area to match Yucatan regional characteristics.

Graphical Abstract

1. Introduction

Karst groundwater resources are at constant pollution risk due to their own natural features like dolines, fissures, and conduits that can allow a fast infiltration of pollutants into the aquifer. These fast-flowing pathways increase groundwater exposure to pollution since a contaminant would reach groundwater faster, experiencing little to no degradation process in comparison with unconsolidated aquifers. As karst aquifers are the source of water supply for almost 25% of the world population, as estimated by Ford and Williams [1], their protection is urgent, principally in areas where groundwater is the only freshwater source. From the necessity to evaluate and characterize how endangered a given aquifer is, either consolidated or not, the vulnerability concept emerged as an essential part of groundwater management strategies. Vulnerability refers to the aquifer’s susceptibility to contamination by human activities [2].
To date, several methods to estimate either source (spring or well) or resource (groundwater) vulnerability in karst areas have been proposed and tested on different areas of the world. An accurate overview of karst vulnerability methods developed during the last three decades can be found in the work of Iván and Mádl-Szònyi [3]; nevertheless, more literature introducing regional adaptations or new methods have also been published, but in languages other than English [4,5].
The majority of current methodologies use a multi-parameter approach to represent the variables affecting a theoretical pollutant’s travel time, being discretized using score intervals according to a relative degree of protection [6]. In general, development of groundwater vulnerability maps can be seen as the evaluation of multiple layers representing geology, pedology, meteorology, hydrology, and others for their influence on the vertical travel time from surface to the water table. Nevertheless, among the proposed methodologies, parameters are categorized and evaluated with different scores and weights, displaying contrasting outcomes when several methods are applied over the same area [7,8,9,10].
To work out vulnerability maps, it is necessary to deal first with some factors that complicate the process, such as data availability and the determination of an adequate method to be used for a given karst area. Some vulnerability methods need specific data, which in some cases is sparse or even null; for example, Malík and Svasta propose point classifications based on spring discharge data to estimate the degree of karstification as part of the REKS method [11]. This data is not easy to obtain, such as in the case of coastal karst areas with underwater springs, like the Yucatan karst aquifer, thus not allowing the usage of such approach. Current methodologies have been validated via field tests, mostly tracer tests, on their respective areas of development; nevertheless, high subjectivity and personal interpretation regarding intrinsic features behavior also influence results. For example, the EPIK method [12] considers epikarst as a feature which increase vulnerability due to probable infiltration though vertical shafts; this interpretation is opposite to that presented in the PaPRIKa method, where epikarst behaves as a protective feature for its hydrogeological function as perched aquifer; therefore, delaying infiltration [13]. Despite the fact that vulnerability maps can be interpreted by stakeholders without a broad hydrogeological knowledge, outcomes must be taken as theoretical approximations and further analysis is always encouraged.
Global change elements (anthropogenic practices, extreme events) are important factors to be included into a vulnerability analysis. If we consider precipitation as an external stressor, tropical areas benefit from excessive rainfall events since substantial water volumes, infiltrating the subsurface, would promote dilution [14]. Methodologies like the Slovene approach take into account precipitation analyzed in terms of volume, intensity and extreme events [15]. Other methodologies like KARSTIC and DRISTPi consider recharge as a parameter derived from precipitation regimes [16,17]. Nevertheless, vulnerability assessment in tropical areas, with pronounced seasonal precipitation patterns, can be over/under estimated since precipitation ratings from the before mentioned methods are based on year averages. Additionally, dilution potential will depend on pollutant volumes which can be estimated in current scenarios (untreated wastewater, landfills leaching, etc.), while its residence time in the aquifer would be shorter depending on the degree of karstification. Despite effects of global change and its influence on real vulnerability scenarios, there is no method which evaluates such influence together in a vulnerability analysis. Inclusion of dilution and pollutant residence time must be considered carefully in a vulnerability analysis, as the evaluation of two or more independent criteria can lead to ambiguous situations [18].
Combination of travel time, aquifer residence time, and pollutant concentration would resolve into a new, integrated groundwater vulnerability model, increasing the confidence when considering influence of global change factors on regional vulnerability. The IKAV project, affiliated to the INOWAS group (research unit under the Department of Hydrosciences of the Faculty of Environmental Sciences at Technische Universität Dresden, Germany), aims to develop such an integrated methodology to deal with and evaluate current and future vulnerability scenarios.
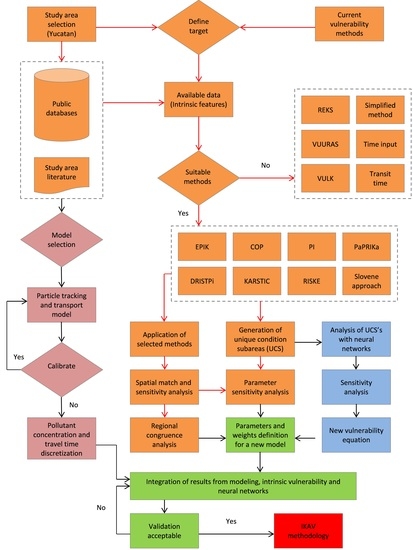
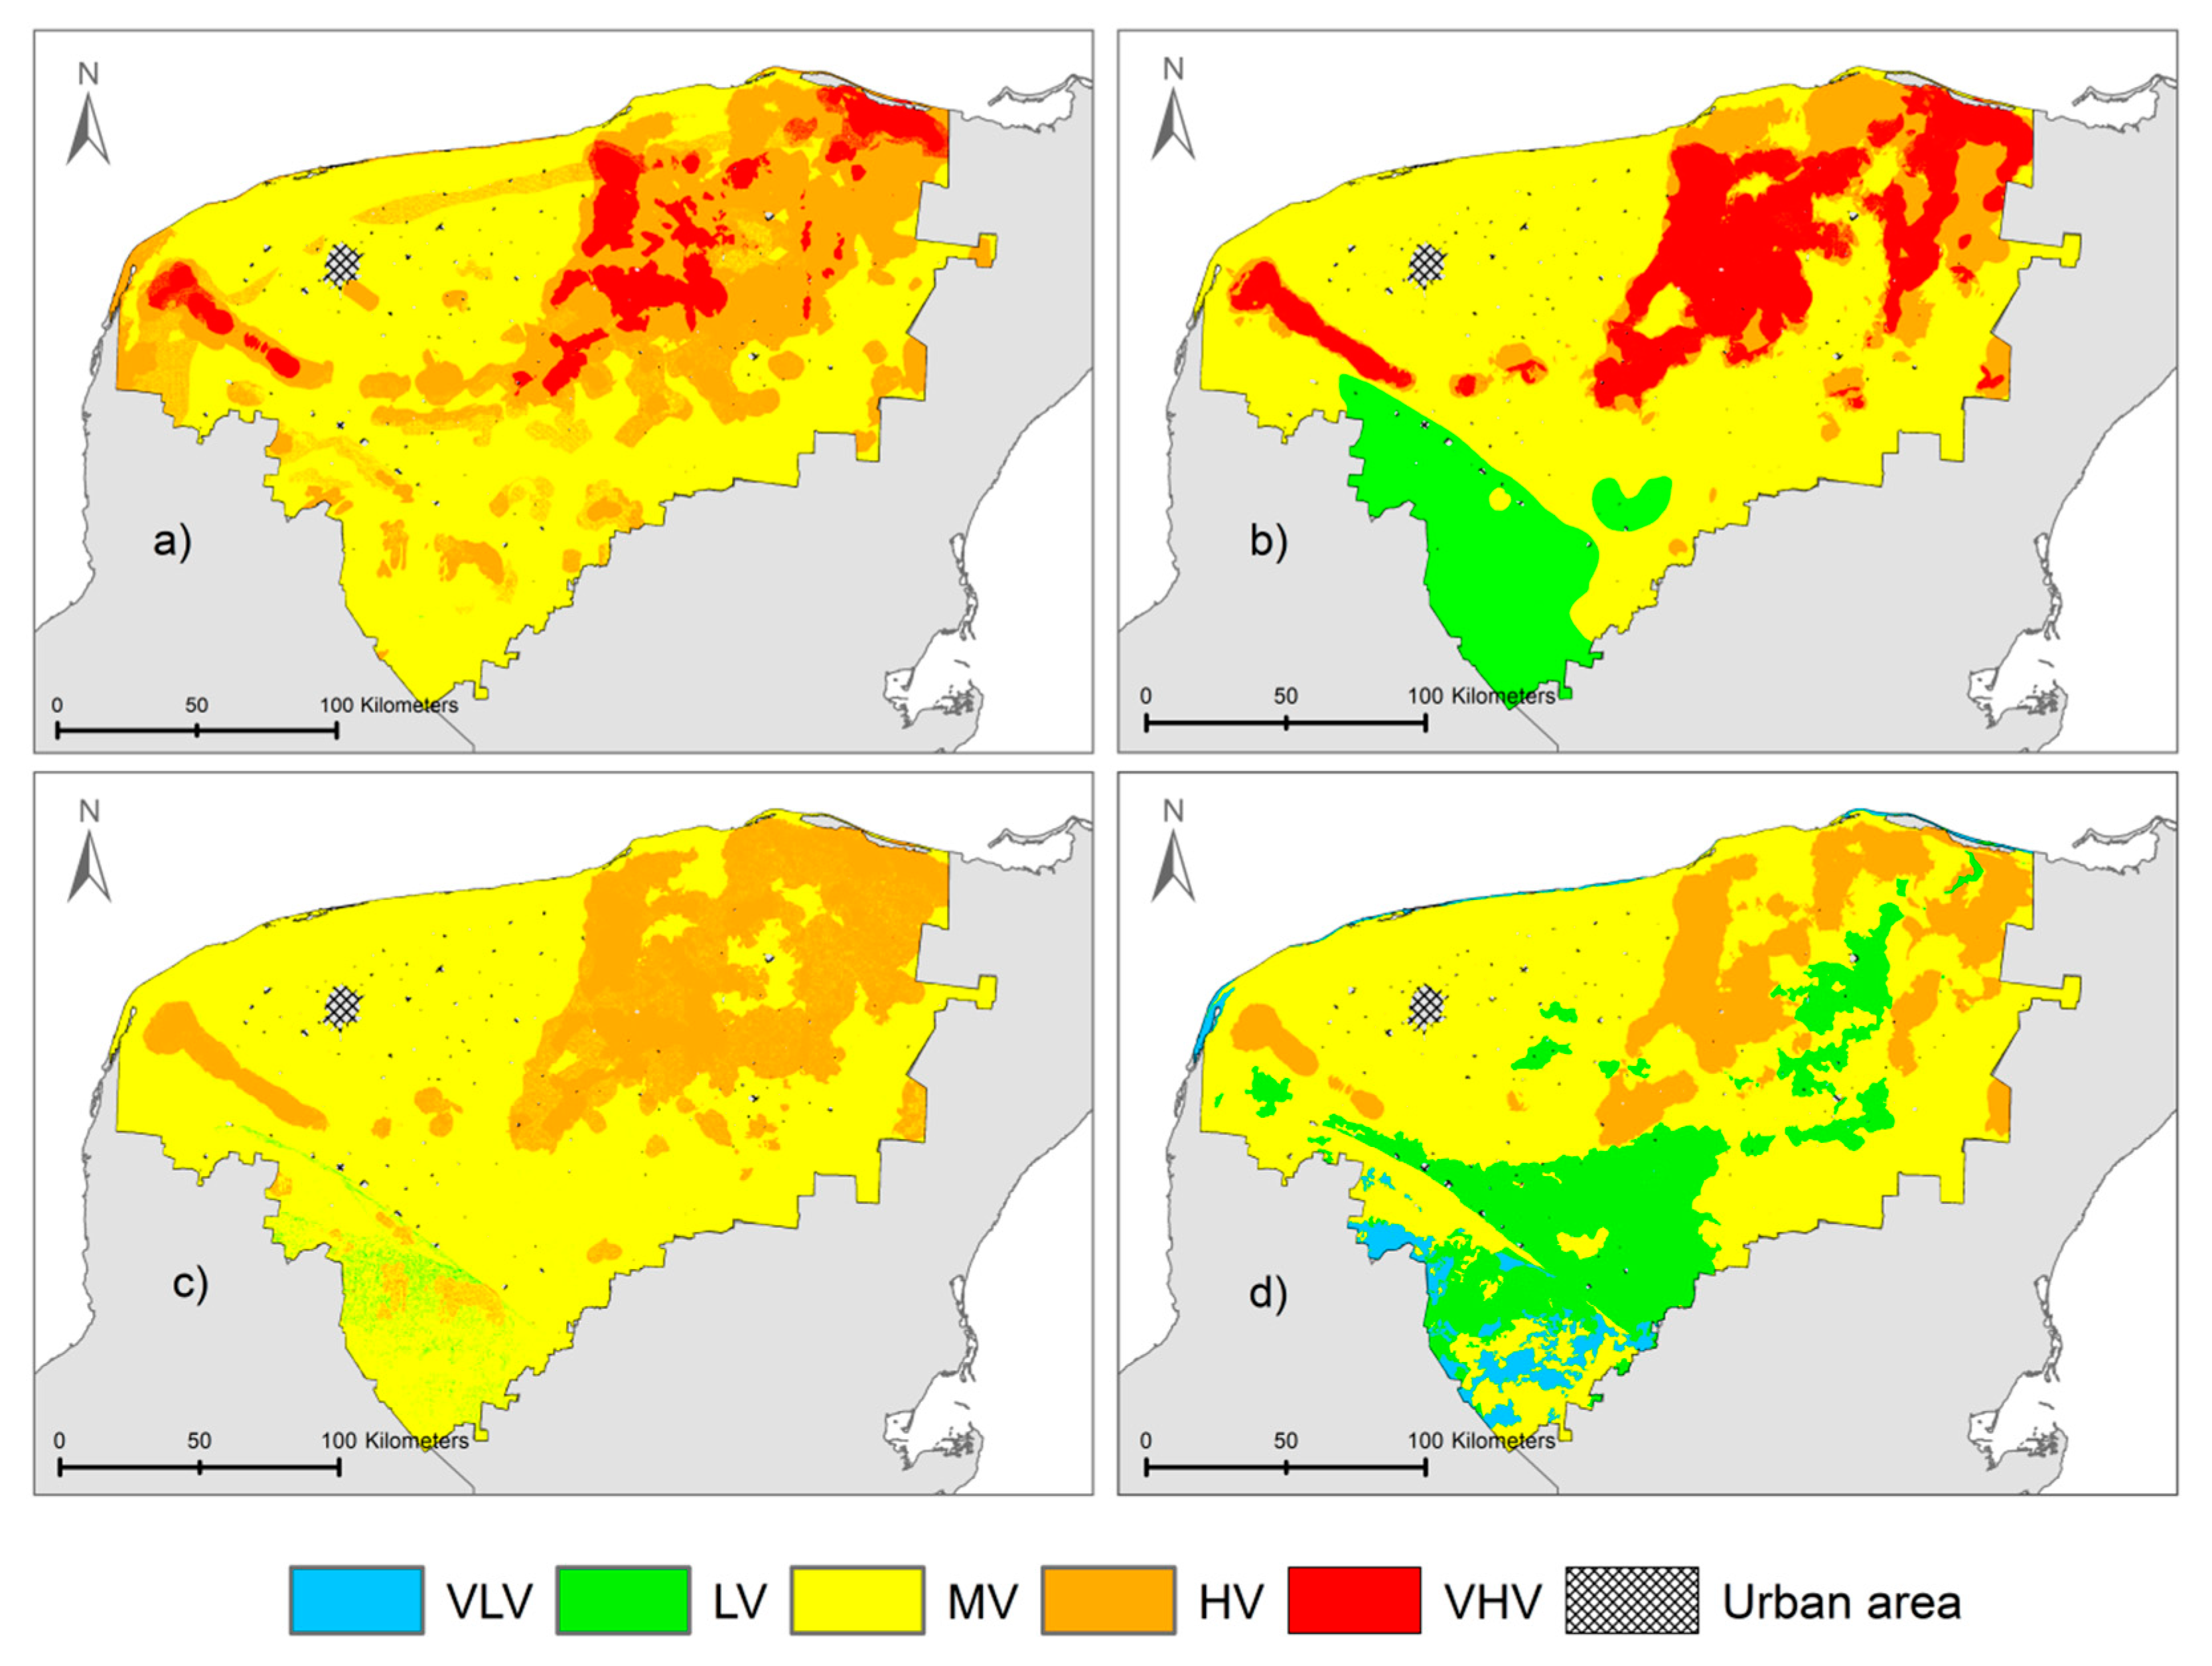
As a first step, analysis of selected intrinsic vulnerability methodologies, their congruence with regional features, and parameter sensitivity analysis are contemplated to reach an adaptive karst groundwater vulnerability methodology (Figure 1). According to data availability, a total of eight methodologies were chosen and applied on the Yucatan State, Mexico. This paper presents the analysis of four of them (DRISTPi, KARSTIC, RISKE and the Slovene approach), the other being presented in a previous work [10].
Outcomes from this work will serve as a basis to highlight critical parameters, weights adaption, and further considerations to be implemented in an adaptive karst vulnerability approach. Due to its unique characteristics and the increasing aquifer contamination, the chosen study area is Yucatan, Mexico. This work aims to highlight advantages, disadvantages, and the relationship between regional features and vulnerability rates from the four methods here applied. Additionally, this work extends the study and analyzes the outcomes and spatial match of vulnerability classes between the four methods, including a map layer-removal sensitivity analysis with “final vulnerability class” sensitivity, based on vulnerability class changes.

2. Materials and Methods

2.1. Study Area

The Yucatan Peninsula is a trans-boundary limestone platform which embraces areas of Mexico, Belize, and Guatemala (Figure 2). In general, the aquifer is considered as a well-developed karst with large conduit systems at variable scale ranges [19]. The study area, the Yucatan State (39,524 km2), is settled north of the Peninsula; some of the main features in the area are the nearly flat topography in most of the region, lack of surface flow, and “Cenotes” alignment (dolines exposing water).
Dolines are dispersed in the area and show a characteristic semi-circular alignment of about 180 km of diameter at northwest [21]; this alignment, named the “Cenote ring”, is considered as the surface expression of an asteroid impact at the end of the Cretaceous [21,22,23]. The northeastern Yucatan also displays a high doline density [22,24,25]; nonetheless current doline maps, based on contours maps at 1:50,000 scale, underestimate a high percentage of such features (Figure 3a). This underestimation was demonstrated by the application of a new methodology to estimate dolines from digital elevation models [26].
In the southern Yucatan, terrain elevates up to 204 masl in a hilly area named “Sierrita de Ticul”; nevertheless, most of the area is considered flat with elevation gradually increasing from 0 at the coastline to approximately 30 m along the base of the hill [27]. Combination of flatness and karstic development do not allow surface streams to generate, infiltration is; therefore, diffuse at regional scale [28]. The flat topography is reflected on slope, which demonstrates a very low change in elevation for most of the area with exception of the Sierrita de Ticul hill (Figure 3b). Yucatan experiences wet (May–October) and dry seasons (November–April) with a yearly average precipitation fluctuating from 550 mm/y northwest to 1500 mm/y southeast [29]. Recharge has been estimated between 14% and 20% of the mean annual precipitation, meaning high evapotranspiration rates [30,31]. For this study, precipitation values were obtained from 62 stations and records covering a 25-year period were used (from 1990 to 2015) to estimate mean annual precipitation volumes (Figure 3c) [32]. Yucatan also experiences natural phenomena like tropical storms and hurricanes, events that generate extreme precipitation and increase the recharge [33].
Hydraulic gradients are low ranging from 7 to 10 mm/km, suggesting high hydraulic conductivity [34]; this is also reflected on water table depth, where the hill area reflects the deeper aquifer in comparison with the flat plain (Figure 3d). Groundwater flows in a northwest direction [30,35], discharging via submarine springs located in coastal zones [23], with an estimated higher discharge during the wet season [22]. Hydraulic conductivities have been estimated for the Sierrita de Ticul upland and the rest of the area, with values of 5.5 × 10⁻³ and 1.11 m/s, respectively [36,37]. However, since this study focuses on intrinsic resource vulnerability, the hydraulic conductivity parameter was not utilized.
Soils distribution is displayed in terms of Edaphology classification. Rendzinas, Lithosols, and chromic Luvisols predominate in approximately 46%, 29%, and 10% of the area according to public datasets [38]. Point sampling data from INEGI (National Institute of Statistics and Geography) shows agreement regarding Lithosols and Luvisols, with less than 7 cm of depth [39,40]. Medium soil textures seem to predominate in central areas, while coarser soils are found in the coastal rim (Figure 3e).
Due to regional anthropogenic practices, mostly related with untreated wastewater disposal, and groundwater as the only source of water supply on the region, aquifer protection becomes critical with an urgent establishment of protection strategies to maintain water quality, making Yucatan an important area for aquifer vulnerability studies. Currently there are no protection strategies in Yucatan to deal with groundwater contamination; however, some areas of Yucatan have been declared as protected under the title of “hydrogeological reserve” [41,42].

2.2. Methods and Data

Four rating methods to estimate water resource vulnerability were applied in Yucatan. Outcomes from DRISTPi, KARSTIC, RISKE, and the Slovene approach are analyzed to highlight intrinsic features leading to different vulnerability classes and to study the congruence of results with regional characteristics of the Yucatan karst. High subjectivity; however, is expected from the assignation of some features not clearly defined by some methods.
Datasets to develop the necessary map layers were gathered from different public sources and literature review (Table 1). Some parameters were neglected (see KARSTIC and RISKE methods section) since they are directly related to aquifer lateral flow, hence source vulnerability.

2.2.1. DRISTPi Method

This method is based on the well-known DRASTIC method [43] with addition of one scenario to evaluate effects of non-karstic areas. This method also includes a new parameter to evaluate preferential infiltration (Pi), which can be specific for each scenario. This multi-parameter model defines vulnerability rates from given values and weights according to:
VI = D(2) + R(4) + I(5) + S(2) + T + PI(5),
where VI—vulnerability index; D—depth to water table; R—recharge; I—lithology of the vadose zone; S—soil; T—topography (slope); Pi—preferential infiltration. The numbers in brackets represent the assigned weights. DRISTPi allows the re-assignment and modification of weights. More detailed information about this method can be found in the work of Jiménez-Madrid et al. [17].

2.2.2. KARSTIC Method (KRSTI)

KARSTIC is also an adaptation for karst of the DRASTIC method; it is an extensive vulnerability index since it evaluates nine parameters, four of them combined to create a complex variable (K and I).
VI = K × F(10) + A(3) + R(4) + S(2) + T + I × D(20) + C(3),
where VI—vulnerability index; K—karst development; F—fracturing degree; A—aquifer medium; R—recharge; S—soil; T—topography (slope); I—lithology of the unsaturated zone; D—depth to water table; C—hydraulic conductivity of the aquifer. For the purposes of this research, A and C parameters (aquifer media and aquifer hydraulic conductivity) where neglected since they aim to estimate source vulnerability; this modification was followed by the percentage redistribution of the original weights from the original formula to obtain:
VI = K × F(11) + R(5) + S(3) + T(2) + I × D(22).
Applications and study cases related with this method can be consulted in the work of Davis et al. [16].

2.2.3. RISKE Method (ISKE)

RISKE is also an index-based vulnerability mapping method inspired by the Swiss EPIK method. It aims at characterizing the intrinsic vulnerability of the karstic system to vertical infiltration on a catchment scale. The method considers the most prominent intrinsic characteristics of karstic aquifers that condition the behavior of any pollutant entering the system by considering five criteria that describe both the structure of the aquifer and its functionality. Vulnerability rate is assessed by:
VI = R(0.1) + I(0.4) + S(0.1) + K(0.2) + E(0.2),
where VI—vulnerability index; R—aquifer rock; I—infiltration conditions (slope); S—soil; K—degree of karstification; E—epikarst. In (4), the R parameter is related to water circulation in the phreatic zone; therefore, it was excluded and weights were distributed in percentage to finally get:
VI = I(0.45) + S(0.11) + K(0.22) + E(0.22).
A precise summary of this method and its development is found in the work of Petelet-Giraud et al. [44].

2.2.4. The Slovene Approach

The Slovene Approach (SA) is based on the Spanish COP method, in accordance with the COST Action 620 conceptual framework for assessment of vulnerability. This methodology comprises three elements; in addition to intrinsic vulnerability, hazards and contamination risk maps are also evaluated. In this study, just the intrinsic vulnerability section is applied. The SA encompasses three basic factors (and sub-factors) that condition water infiltration and the possible transport of contaminants from the surface to the saturated zone. Another particularity of the method is the consideration of the temporal hydrologic variability which is prominent in contaminant transport processes. Calculation of vulnerability rates follows:
VI = (os + ol × cn) × (sv × sf) × (rd × se),
where VI—vulnerability index; os—soil texture and thickness; ol—lithology and fracturing; cn—confinement; sv—slope and vegetation; sf—surface features; rd—rainy days; se—extreme events. This is the equation for areas which do not generate surface flow towards a swallow hole. Parameters inside brackets correspond to overlying layers, concentration of flow, and precipitation factors, respectively, (O, C, P). A detailed description about the parameters and assigned rates are presented by Ravbar and Goldscheider [15].
The methods presented here were applied and validated in karst areas with distinctive characteristics. Final vulnerability ranges vary according to the method, while vulnerability classes are related to specific ranges. Notice the inverse range of the SA method since it evaluates the protection degree, an antonym for vulnerability (Table 2).
For dataset analysis, management, and development of the necessary layers to obtain vulnerability maps, Arc Catalogue and Arc Map version 10.5 were used. Vector data was transformed into raster with a resolution of 900 m2 in agreement with the digital elevation model (DEM) used in this study; maps were projected with the World Geodetic System 1984. Aiming to evaluate the influence of single features (e.g., soil texture, karst features, etc.) on final vulnerability classes, vulnerability maps were overlapped against each feature (I, S, K, and E, as in the RISKE case) using the tabulate function of ArcGIS. Hereinafter, vulnerability will be described as VLV for very low; LV for low; MV for moderate; HV for high; and VHV for very high.

2.3. Sensitivity Analysis

The sensitivity analysis was carried out by computing Yucatan unique condition sub-areas to avoid processing large numbers of map grids. A unique condition sub-area (UCS) represents a unique combination of parameters having an extension from one to several map grids. For comparison, theoretical UCSs were also developed for each one of the methods using all rates from each parameter obtaining all possible combinations. Map or parameter sensitivity is obtained from the removal of one layer at time [45], which determines how each parameter affects the vulnerability index without the influence of the weighting factor [46]; It is expressed as:
Sxi = |VI/N − Vxi/N − 1|,
where Sxi is the sensitivity associated with the removal of parameter X; VI the original vulnerability index corresponding to the ith UCS; Vxi the vulnerability index of the ith UCS computed after removing parameter X; N correspond to the number of maps used to estimate vulnerability.
The variation index (effective weight) is also used to estimate index change in terms of percentage of the original index; this is calculated for each grid map (or UCS) by:
Vxi = ((VI − Vxi)/VI) × 100
where Vxi is the variation index of parameter X for a given UCS; VI and Vxi are the original and perturbed vulnerability index, respectively, of the ith UCS. The variation index will explain the effective relative importance of each parameter in the study area. The equation is presented according to Marín [9] and is identical to the effective weight presented by Napolitano [47]. The previous equations assist in analyzing the index change after removal of one layer; however, a high sensitivity does not always reflect a change of vulnerability class which is dependent on index ranges. In order to estimate the effect of each parameter on final vulnerability classes two equations based on areas are introduced as:
ΔC = Cl − Clxi,
and
CS = Ʃ ((AΔC)/AT) × 100   if ΔC > 0,
where ΔC is the vulnerability class change for a given UCS after removal of one map layer; Cl is the original vulnerability class and Clxi is the class assigned after removal of one map; Cs represents the area, in percentage, experiencing a vulnerability class change; AΔC is the area of grids which experiences a change in vulnerability class and AT is the summed area of all UCSs.

3. Results

Vulnerability and Parameter Sensitivity

The DRISTPi method (Figure 4a) displays MV covering 59% of the study area followed by HV and VHV at 33% and 8%, respectively. VHV is associated with areas of high sinkhole density where infiltration is expected to be high, while HV covers the area of considerable fracturing; the rest of the area is denoted with MV without further discretization. From visualization, it seems that no other features but those representing preferential infiltration conditions are leading to high vulnerability outcomes. This is not reflected from sensitivity analysis since, for the Yucatan case, Pi display lower values in comparison with the all possible UCS scenarios. According to Table 3, the most influential layer in Yucatan is related lithology (I). Removal of this layer affects the most final outcomes according to Sxi, Vxi and Cs. Lithology in the area, being characterized solely as limestone, explains the influence on MV for most of the area without further discretization.
The KRSTI method displays vulnerabilities ranging from VHV to LV. As shown in Figure 4b, MV is assigned to 57% of the area while VHV, HV, and LV cover 18%, 12%, and 14%, respectively. LV is displayed on the hill area were depth of the unsaturated zone is above 40 m. This reflects the impact of the unsaturated zone (lithology and thickness) due to a high weight assigned to this parameter. Being the area characterized solely as limestone, depth to groundwater is significant for this method. Sensitivity analysis in Table 4 supports the outcomes, since removal of I map demonstrates the highest influence of this layer for both the Yucatan case and all possible combination scenarios, with exception of the UCS Sxi.
The ISKE method displays four vulnerability classes. VHV are not visible in Figure 4c due to a low 4% of coverage. Areas with high sinkhole and fracturing density are denoted as HV, covering 31%. This method presents the highest MV area covering 63% of Yucatan. Just 1% of LV is displayed in the hill area, matching grids of high slope where vertical infiltration could be diminished. The I parameter, or infiltration (for this method it refers to slope percentage), is the most influential according sensitivity (Table 5). The fact that Yucatan is mostly a flat plain explains the area percentage being characterized with MV. Table 5 shows also a high variation index derived from the removal of the soil layer (S); however, the final map does not reflect such influence.
The SA is the only method displaying VLV areas; however, in a low percentage. Since Yucatan is not being analyzed as swallow hole catchment area, locations with a considerable density of karst surface features (dolines, fissures) are categorized as HV, covering 16% of the area. This method also displays a high percentage of MV with 62%, including areas with both shallow water tables at the coast and deeper saturated zones at the Sierrita de Ticul uplands. The 19% classified as LV correspond to fine texture soils with thickness above 30 cm. The influence of the Os parameter is clear from visualization as a consequence of the homogeneity displayed by the Rd and Se parameters (P factor). Average sensitivity for the Yucatan case supports the analysis previously mentioned. Yucatan Sxi, Vxi, and Cs demonstrate the high influence of the Os layer. Nevertheless, comparison of sensitivity from the Yucatan case against all the possible UCSs does not show correspondence as presented by previous methods (Table 6).
A resume of vulnerability percentages is displayed in Figure 5. Despite MV is the most remarkable class, covering most of the area, it does not match the Yucatan regional characteristics. Display of MV on coastal areas, with shallow water tables (less than 1 m of depth) and sands as soil cover, can be considered inaccurate from a theoretical basis. Results for MV are triggered by the approaches themselves on how to define HV and VHV classes, making swallow holes catchment areas the most vulnerable to pollution, automatically decreasing the vulnerability for the rest of the area. This leads to a clear misclassification, making necessary the adjustment of parameters, index ranges, and weights to deal with areas where solely diffuse infiltration conditions exist. In order to establish a regionalization, it is necessary to highlight the parameters affecting MV by each method and to define further classifications.
To go further into the analysis, overlap between final vulnerability maps and single features was carried out in order to estimate the spatial match with vulnerability classes (Table 7). Results from the overlap analyses reiterate outcomes from sensitivity analysis, giving a base to develop a new or adapted intrinsic vulnerability method to match the characteristics of Yucatan.
The influence of sinkholes, in terms of karst feature density, and fissuring leading VHV and HV is clear. However, MV can be further discretized to match the regional characteristics. Having multiple factors affecting MV, considerations to match regional features are further evaluated.

4. Discussion

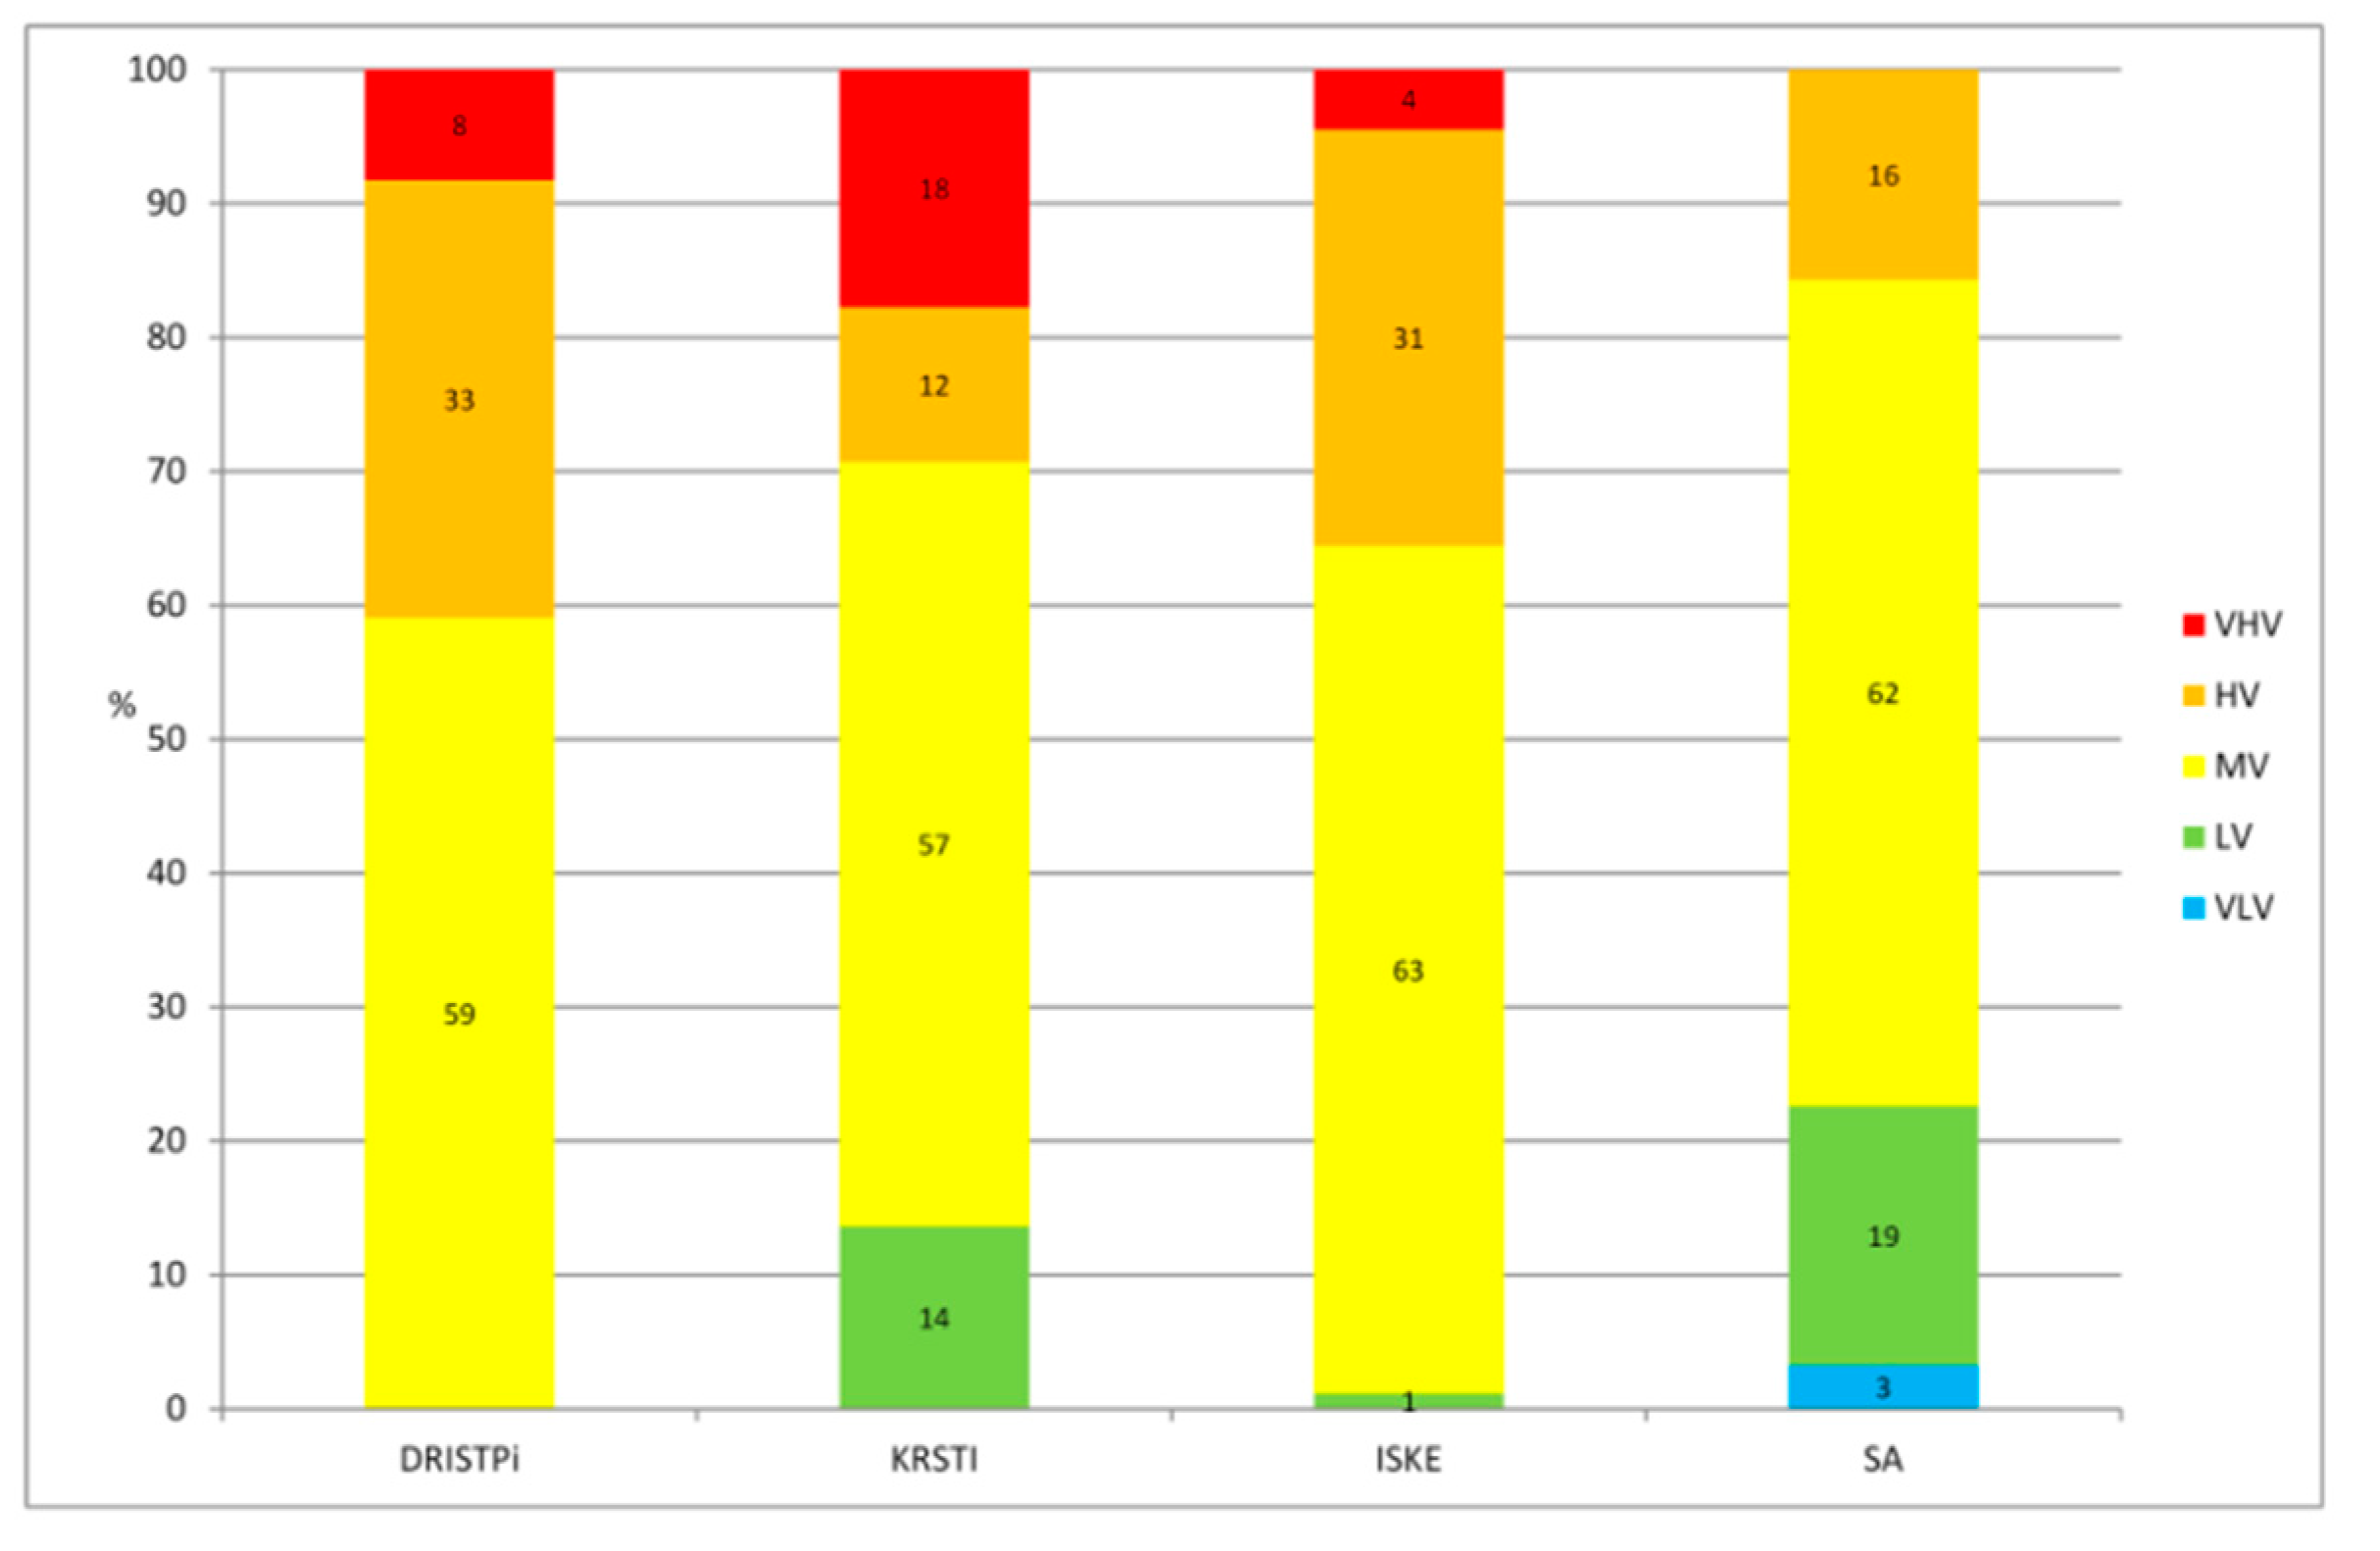
Each methodology evaluated here display, to some extent, agreement with Yucatan characteristics (low slopes, shallow water table, and a regional diffuse infiltration). Nevertheless, they also show areas where the assigned vulnerability can be arguable. This questionable regional classification depends on the method and the values given to specific parameters, which are also dependent on the characteristic of the area where the original methods were developed and tested. The most significant vulnerability class in Yucatan according to this study is MV; this shows agreement with results obtained in previous studies for the EPIK, PI, and COP methods [10]. Moderate values in the area could be explained by different factors, like a regional diffuse infiltration, lithology mostly composed by limestone, low slopes, and a shallow water table in most of the region. These intrinsic features are the most important according to sensitivity analysis and the overlap of final maps with individual parameters. The four methods agree that high sinkhole density areas and extensive fissuring indicate either VHV or HV, of course varying depending on the vulnerability rates given for each one of them. Having this as a base to adapt or generate a new intrinsic vulnerability map, analysis of MV and their relation with regional characteristics is necessary to further classify the area. To adapt or create a new intrinsic groundwater vulnerability approach, considerations presented further could help to develop a new adaptive methodology.
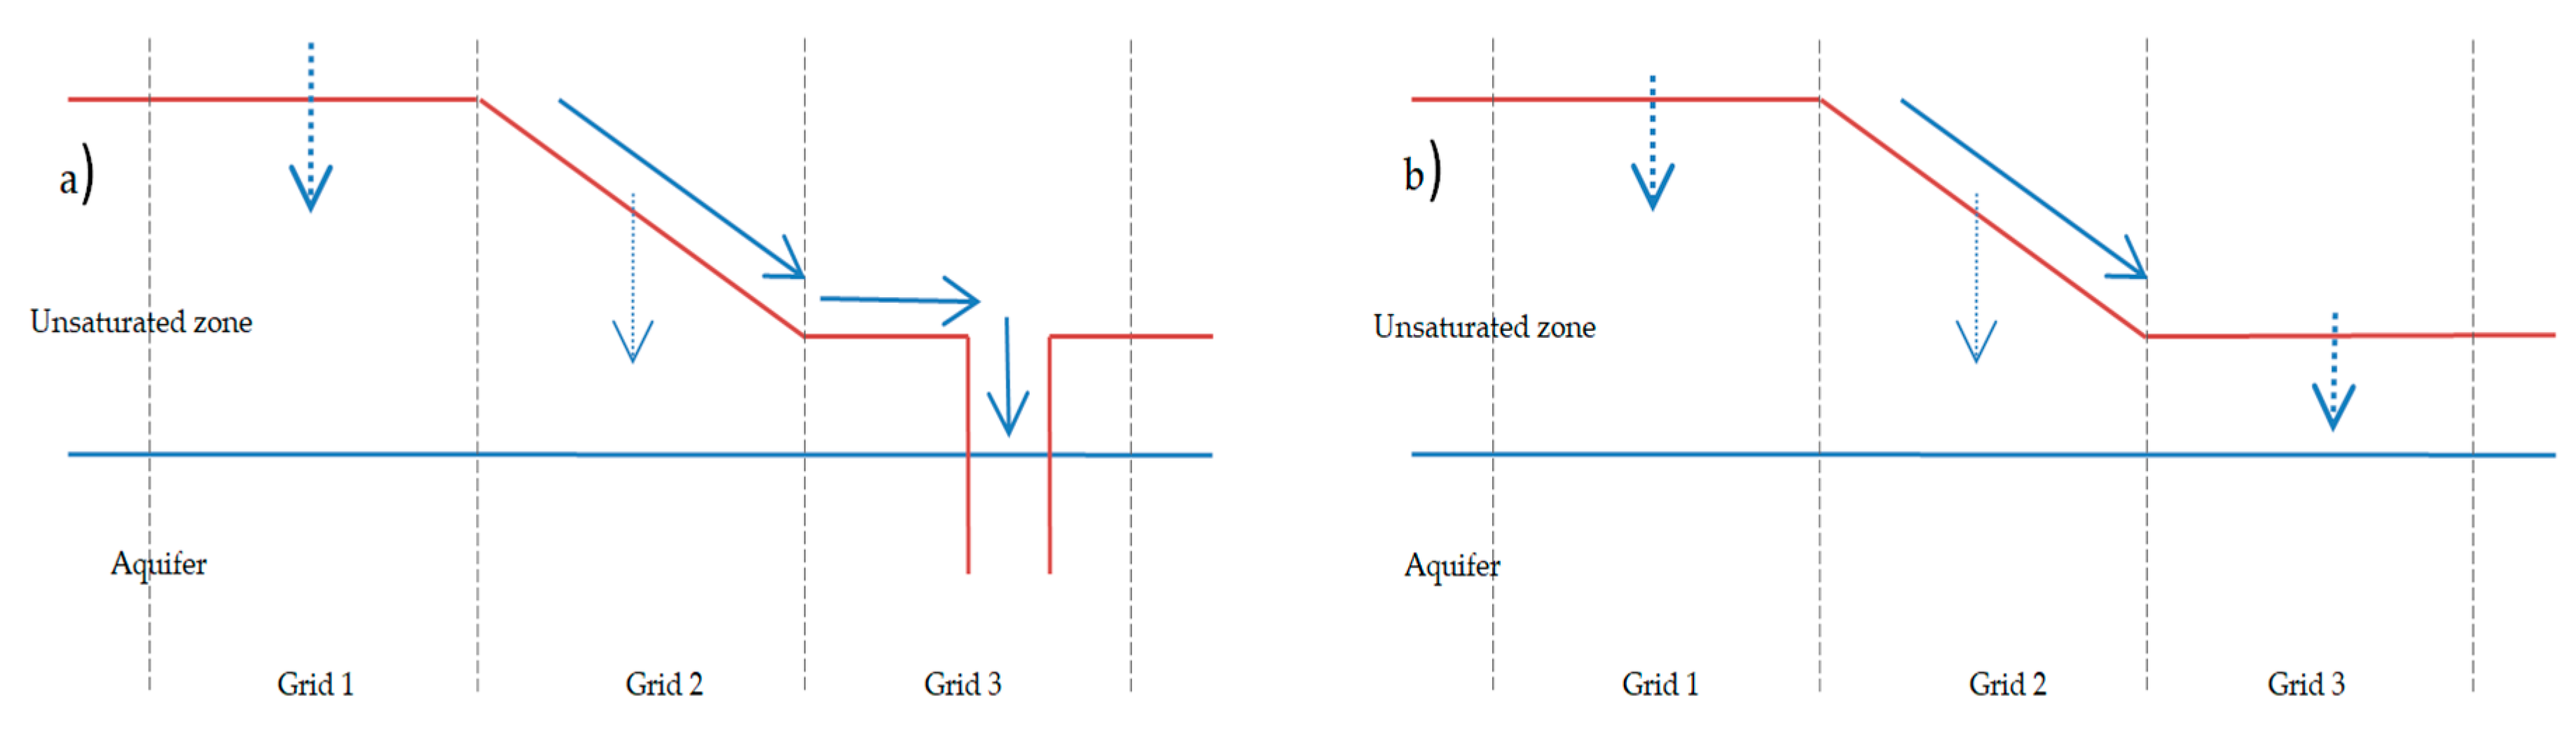
The first process for karst groundwater vulnerability evaluation must be the separation between areas promoting point infiltration at the surface (swallow holes and the catchment feeding it) and the areas with diffuse surface infiltration. This is highly recommended since categorizing diffuse areas as “rest of the area” will inherently decrease vulnerability classes for those areas without surface point infiltration. This will lead to a different evaluation of soils, slope, and other features affecting runoff generation (vegetation, precipitation intensity). For example, a clay-rich soil and high slopes are more likely to promote runoff, hence will increase vulnerability towards a swallow hole if this condition exists (Figure 6a). However, having the same intrinsic characteristics in a diffuse infiltration area leads to an inverse analysis, since the scenario will theoretically minimize the possibility of vertical infiltration; therefore, vulnerability would decrease for the given grid map (Figure 6b). This evaluation is not considered by multiple methodologies since they mostly focus on slope as the sole feature promoting surface runoff.
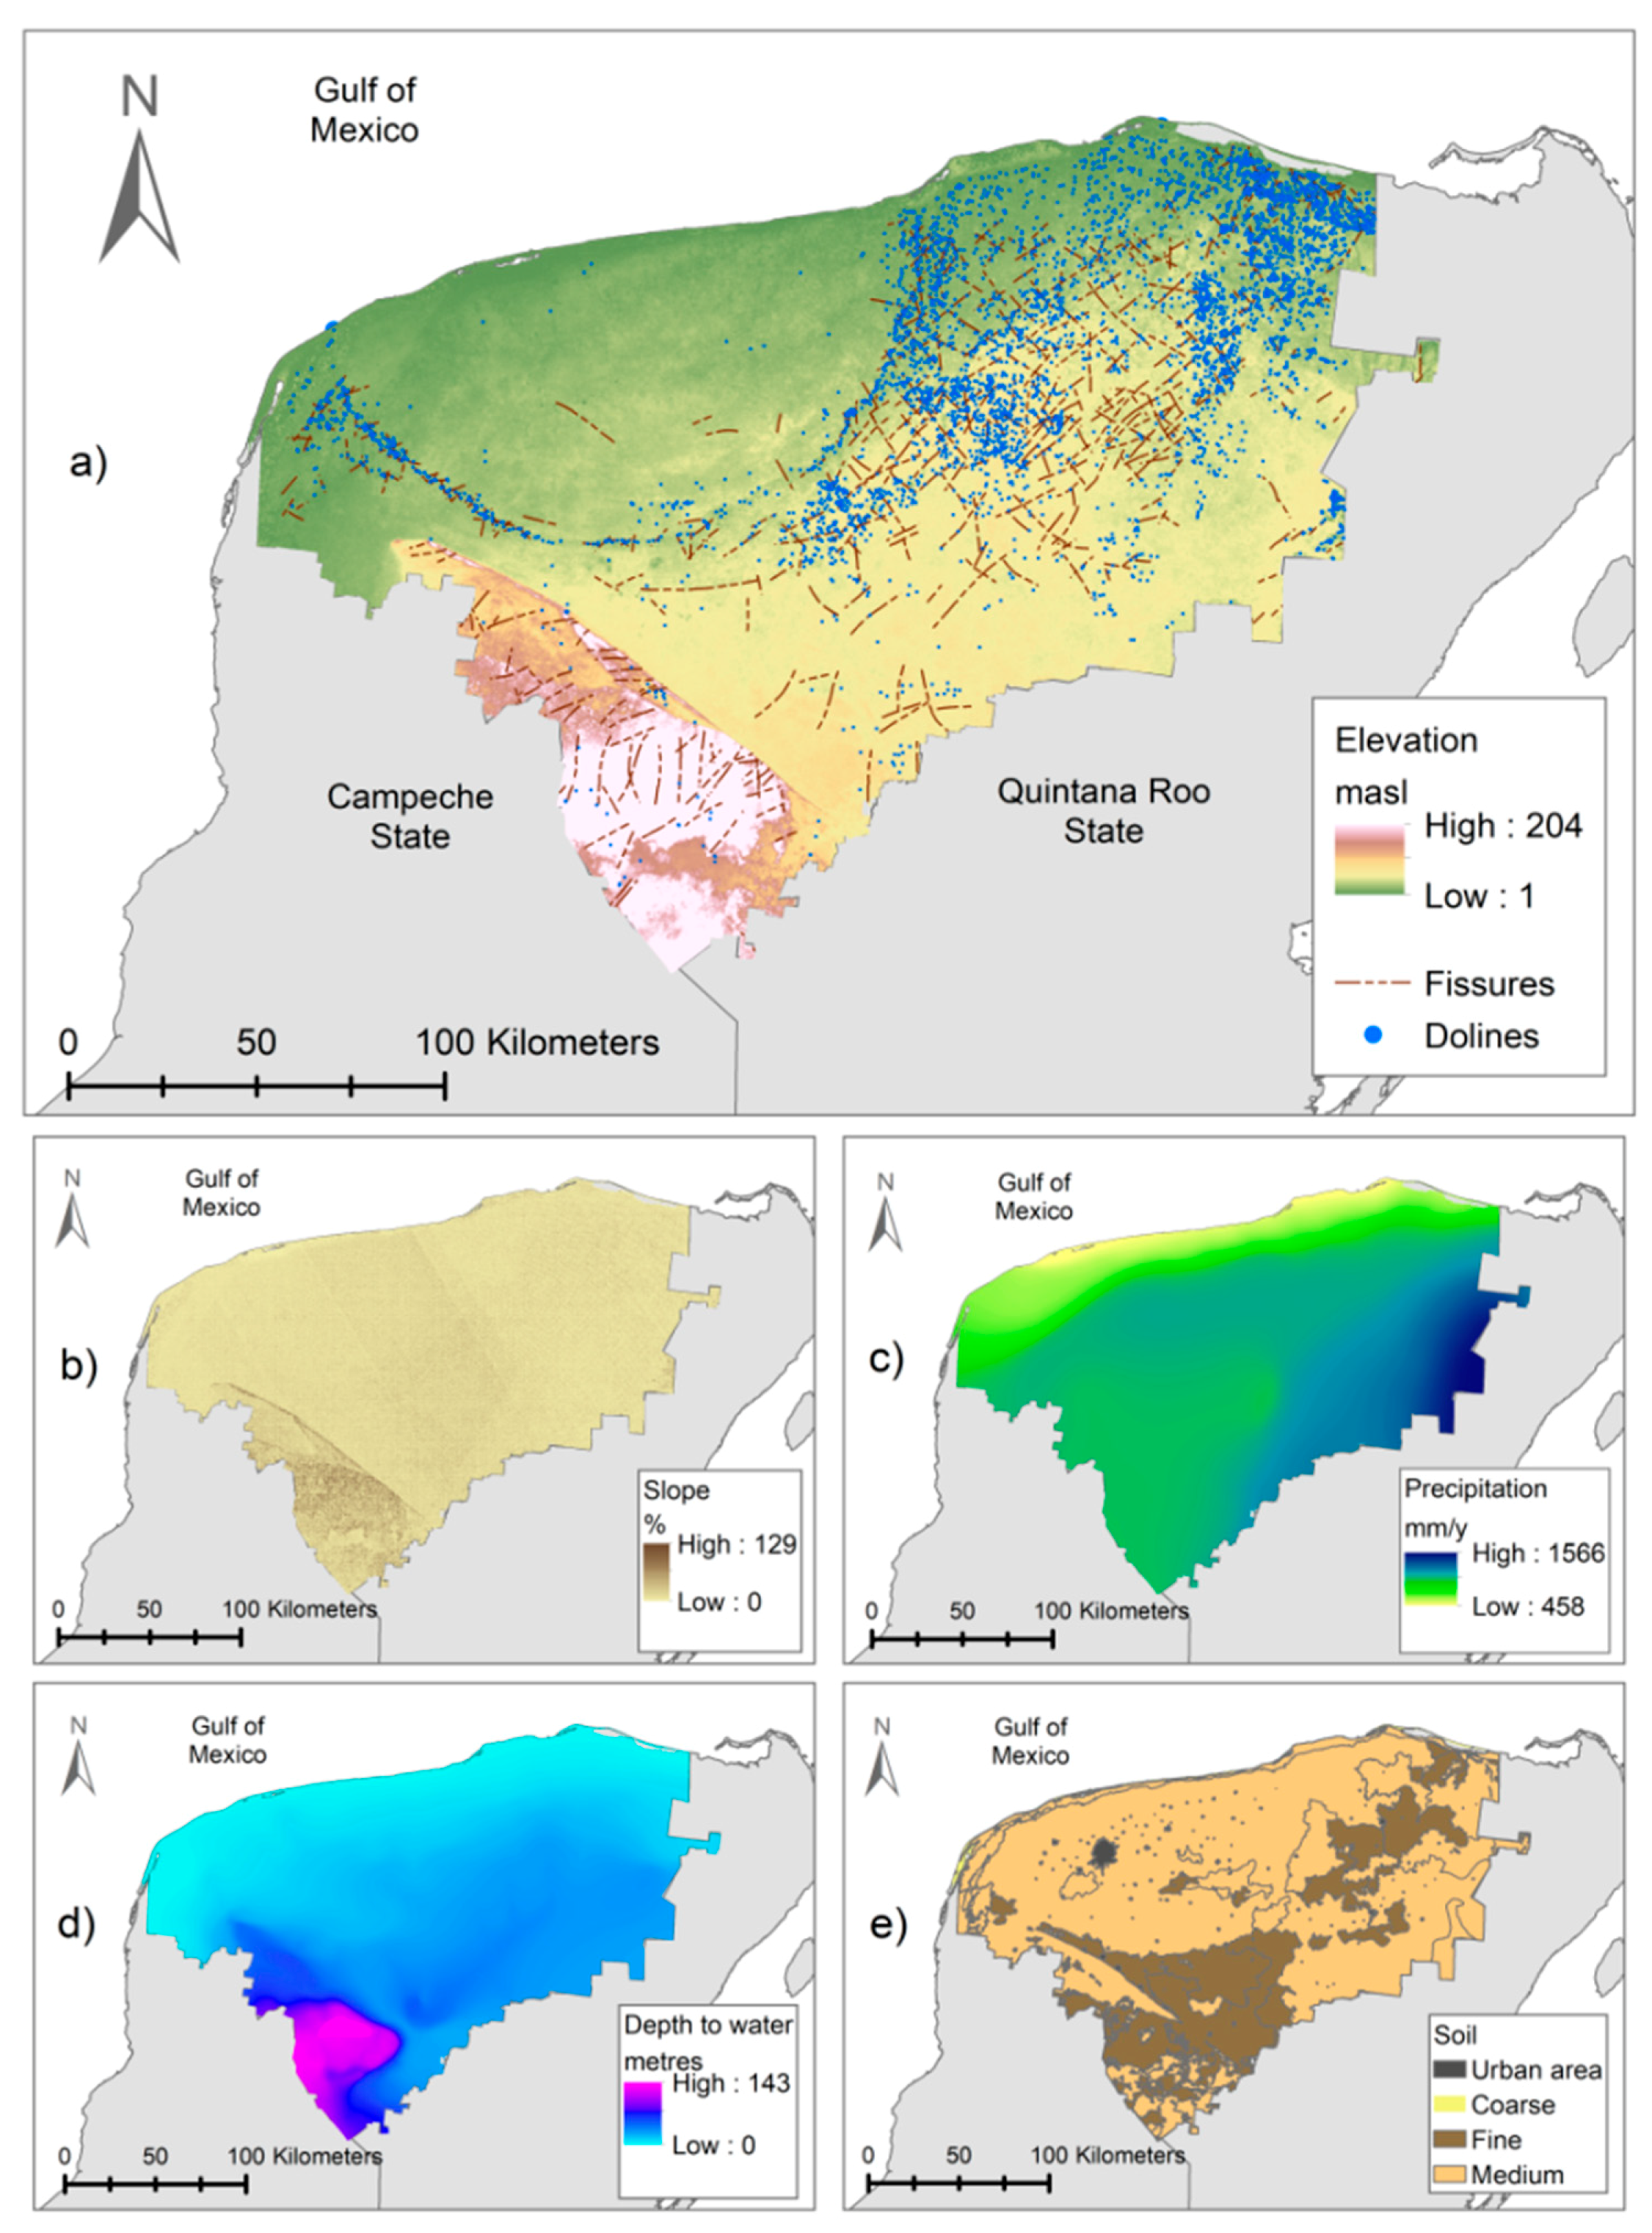
Estimation of MV in coastal areas, as shown by the four final maps, could be considered inaccurate. Despite considering a regional diffuse infiltration, which is clearly less vulnerable than surface-focused infiltration, the shallow water table in the coastal rim could be reached by pollution faster in comparison with southern areas, such as the Sierrita de Ticul hill. Therefore, a method must contemplate differences in unsaturated zone thickness based on these ranges. To achieve this classification, it is necessary to increase the importance (or weight) of the unsaturated zone thickness and re-classify rates according to regional groundwater table intervals. For example, a Jenks classification could be used to reduce the variance between values contained in a given interval and to increase the variance between different intervals, hence defining regional ranges statistically. The KARSTIC method presents a high weight for this parameter, classifying the hill area as LV; however, shallow water table regions remain with MV.
The area being mostly a flat terrain, categorized with a regional diffuse infiltration, an approach to classify topography (slope) must consider solely the influence on vertical infiltration. For example, the SA is the only method presented here where a high slope means an increase in vulnerability contemplating its influence on runoff generation. Not having significant surface streams and without surface point infiltration in Yucatan, high slopes must be considered as promoting low vulnerability, since vertical infiltration, at those given map grids, would be decreased. For this case, the RISKE method represents such behavior since areas with a strong change in elevation display LV, mainly in the hill area at South of Yucatan.
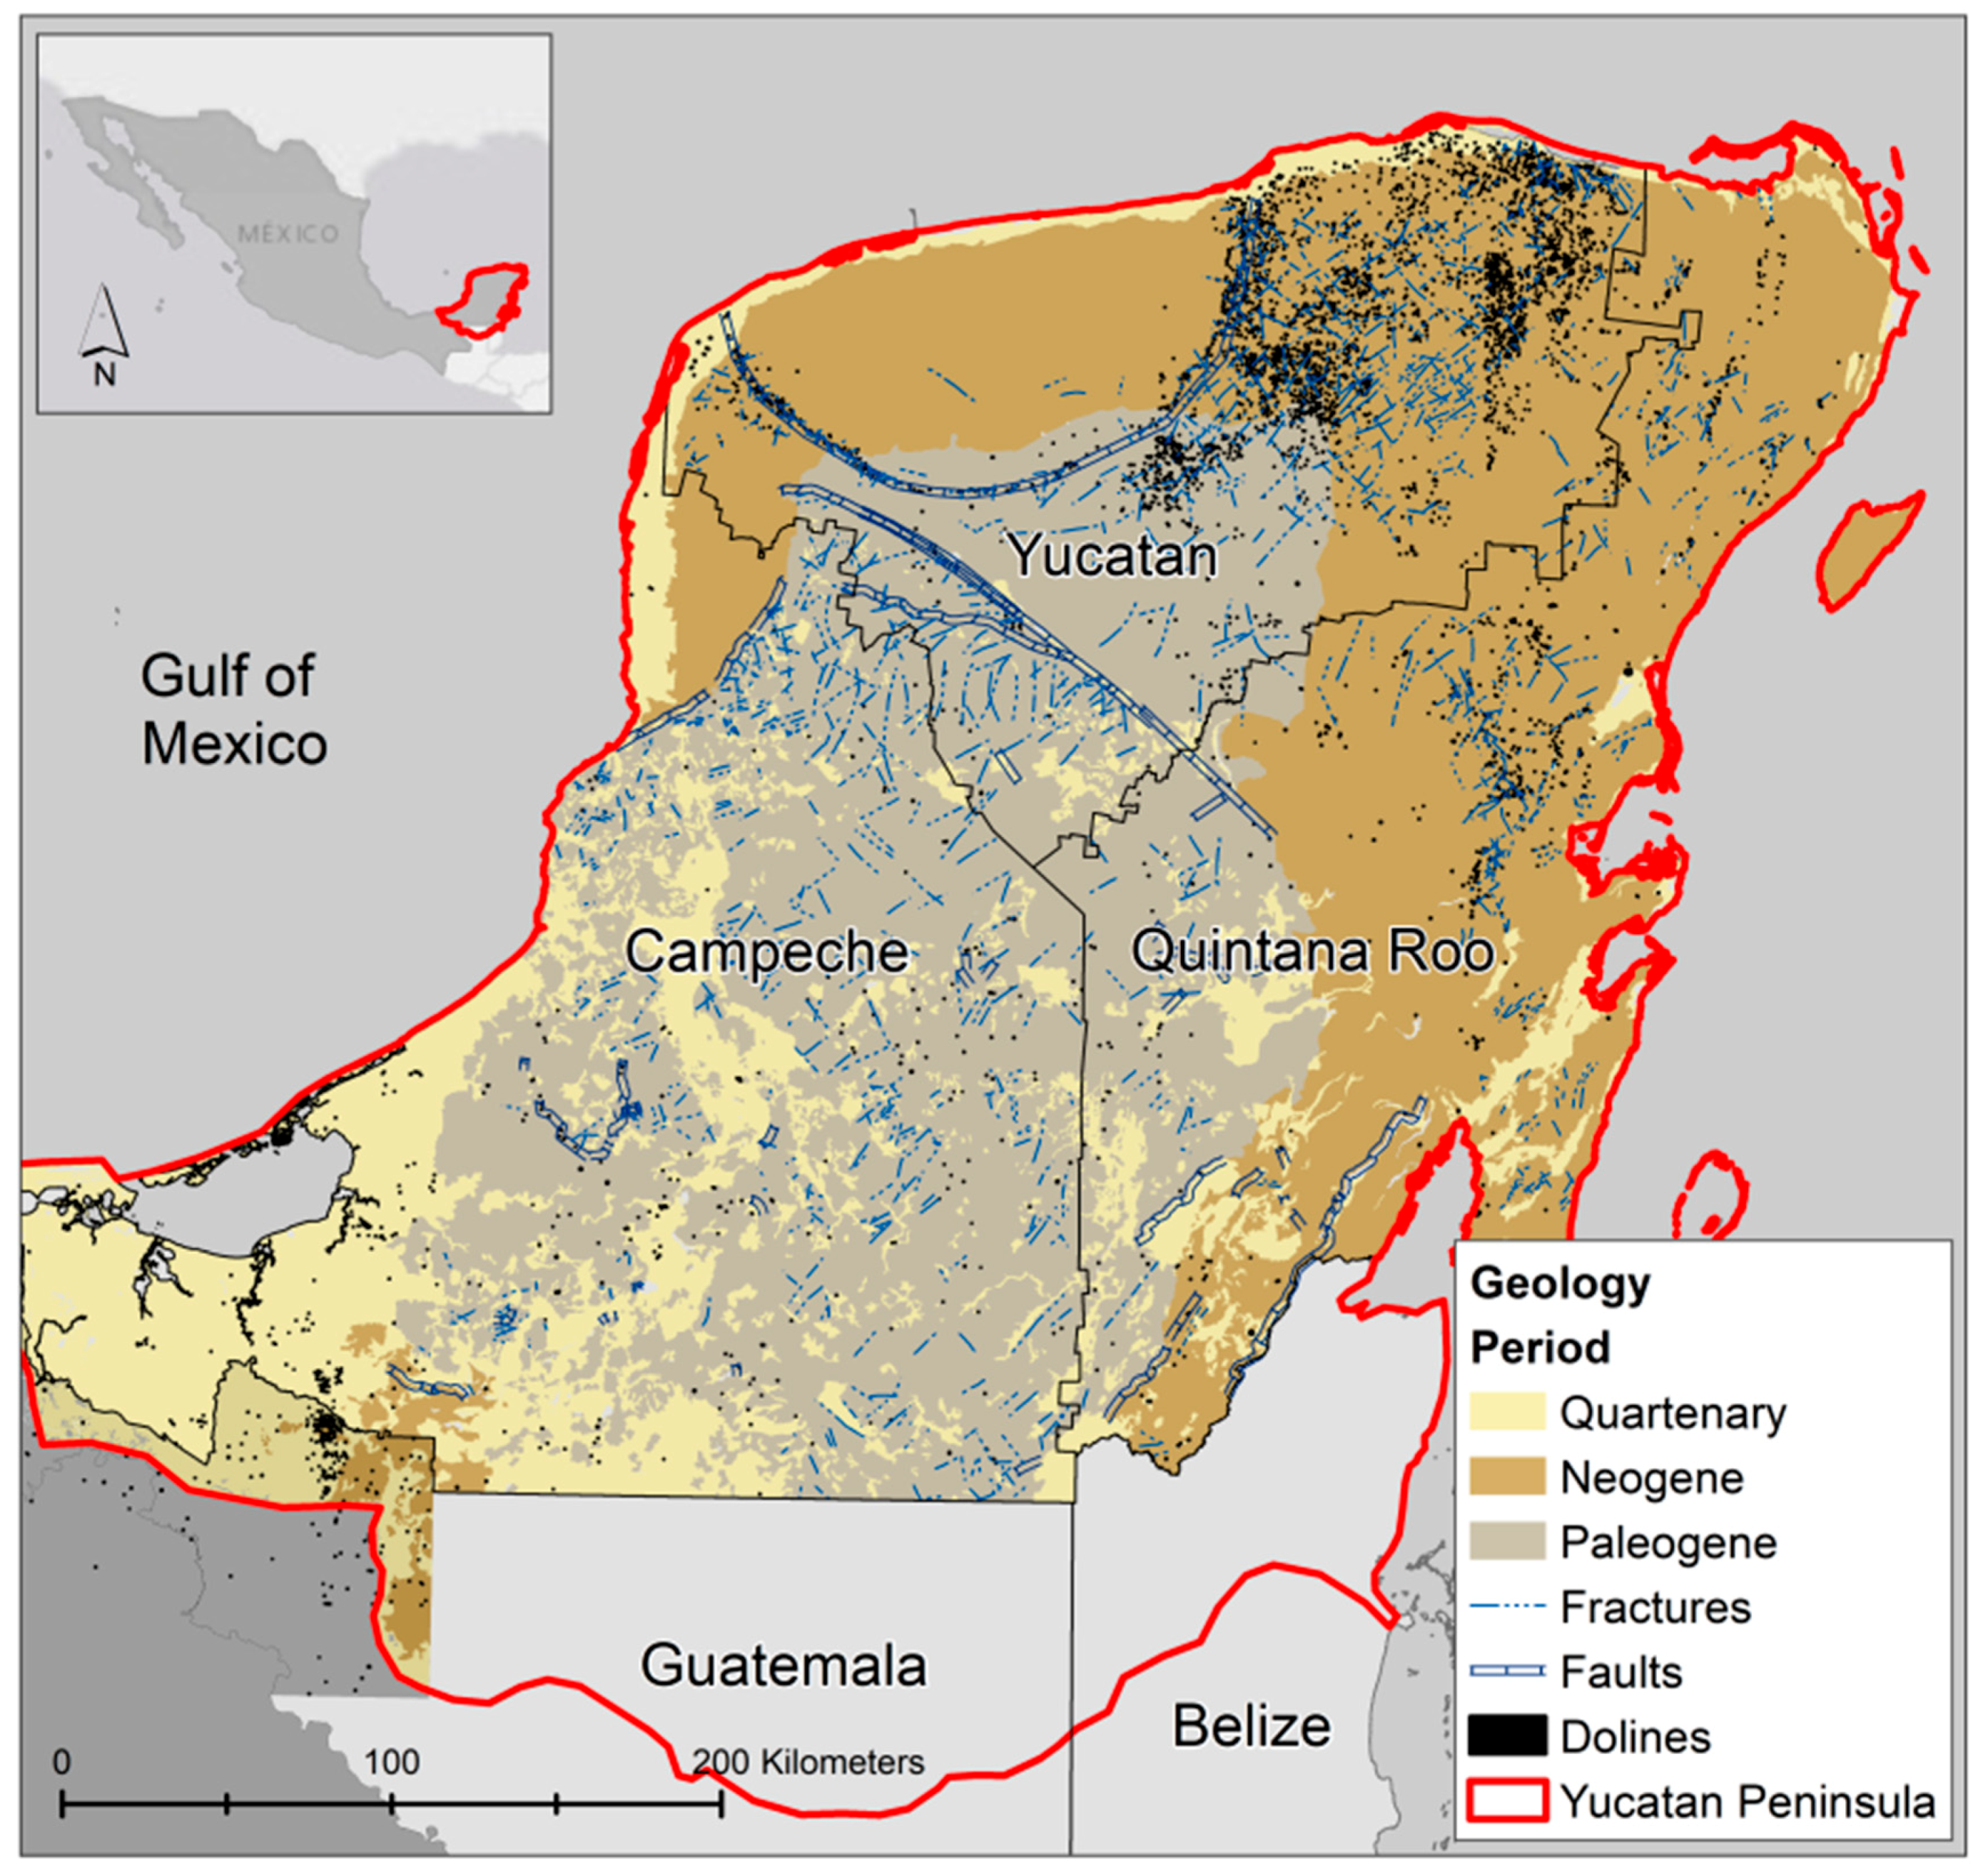
The Yucatan lithology is characterized as limestone without further discretization. Despite the Yucatan limestone corresponding to different ages, as displayed in Figure 2, the majority of vulnerability methodologies consider solely the lithological material and its karstic development for a vulnerability evaluation. Most of the methods analyzed in this work consider several lithological materials (marls, breccia, shale, sandstone, etc.) for their influence on infiltration capacities (see DRISTPi, KARSTIC, and SA methods). However, when applying these methodologies in Yucatan, lithological materials analyzed by the methods but inexistent in the study area are also evaluated, thus affecting the final outcomes. To better adapt lithology influence on regional vulnerability, this could be coupled with fissuring degree to discretize areas from low to high possible infiltration. This could be similar to the PI method evaluation, where lithology and fracturing are directly related.
When methodologies focus on point infiltration, the parameters affecting runoff towards a swallow hole, generally the slope, are the most influential. For diffuse infiltration areas, soils are the first layer affecting pollutant transport and must be evaluated accordingly. The influence of soils on vulnerability is generally analyzed according to its texture and thickness; however, low weights are assigned to this parameter in most of the methods. Despite soils in Yucatan being considered as absent or for general purposes, due to their shallowness and karst outcrops, they must be given a more important role when diffuse infiltration areas are being studied. For example, the SA method displays the importance of soils since they are the most influential parameter to define MV and LV areas. This is supported by the sensitivity analysis as a consequence of the regional homogeneity of the P and C layers in the Yucatan case. If we analyze the hill area in Figure 4d, we notice that LV and VLV match fine texture soils with a considerable thickness.
Regarding precipitation as an external stressor, or medium for pollutant transport, it is important to consider the fact of Yucatan being a tropical area. Either as recharge or precipitation volumes, this parameter must be also re-classified according to regional precipitation quantities. In this case, effect of precipitation on vulnerability must be contemplated regarding its seasonal influence due to the well-defined precipitation regimes and extreme events period. Additionally, this parameter must focus solely on terms of pollutant travel time and not for dilution potential (see COP method).

5. Conclusions

In this work four methodologies for intrinsic groundwater resources vulnerability mapping where applied in the Yucatan state, northern part of the Yucatan Peninsula, as a first step in the development of an integrated karst groundwater vulnerability method. Results show a predominance of MV for more than 50% of the study area according to the four methods. After overlap of final vulnerability maps with single parameters and performance of parameter removal sensitivity analysis, important considerations were highlighted to develop an adaptive methodology to match regional hydrogeological characteristics. The four methods showed agreement classifying areas as VHV and HV in correspondence to high dolines density areas and strong fissuring. However, coastal areas with shallow water tables (less than 1 m) and sands as soil cover were classified as MV. This classification is considered inaccurate for the region. Similarly, the hill area in the south was also considered as MV despite having an unsaturated zone reaching more than 140 m depth. Regional classification and re-assignment of weights for parameters like depth to ground water, slope, precipitation, and soils are suggested to improve the vulnerability mapping of the region. However, the process to reach this goal requires the development of an adaptive methodology to asses a general scheme based on data availability, regional features classification, and parameters weight adjustment.

Author Contributions

Conceptualization, M.M.-G., R.L. and C.S.; methodology, M.M.-G.; formal analysis, M.M.-G., C.M.-S. and A.-W.M.; investigation, M.M.-G.; data curation, M.M.-G.; writing—original draft preparation, C.M.-S. and A.-W.M.; writing—review and editing, M.M.-G., R.L., C.S. and J.P.; visualization, M.M.-G; supervision, R.L, C.S. and J.P.

Funding

This work was funded by the Mexican National Council for Science and Technology (CONACYT) scholarship: 466945; the German Federal Ministry of Education and Research (BMBF) within Junior Research Group INOWAS under reference [01LN1311A].

Acknowledgments

We acknowledge support by the Open Access Publishing Funds of the SLUB/TU Dresden.

Conflicts of Interest

The authors declare no conflict of interest.

References

  1. Ford, D.; Williams, P.D. Karst Hydrogeology and Geomorphology; Unwin Hyman: Boston, MA, USA, 1989. [Google Scholar]
  2. Foster, S. Fundamental Concepts in Aquifer Vulnerability, Pollution Risk and Protection Strategy. In Vulnerability of Soil and Groundwater to Pollutants. Proc. Inf. TNO Comm. Hydrol. Res. 1987, 38, 69–86. [Google Scholar]
  3. Iván, V.; Mádl-Szònyi, J. State of the art of karst vulnerability assessment: Overview, evaluation and outlook. Environ. Earth Sci. 2017, 76, 112. [Google Scholar] [CrossRef]
  4. Albornoz, I.; González, R.; Pacheco, J.; Zetina, C. Revista Latinoamericana el Ambiente y las Ciencias; Benemérita Universidad Autónoma de Puebla: Puebla, Mexico, 2007; pp. 132–136. [Google Scholar]
  5. Milanović, S.; Stevanović, Z.; Đudrić, D.; Petrović, T.; Milanović, M. Regionalni Pristup Izradi Karte Ugroženosti Podzemnih Voda Srbije–Nova Metoda “IZDAN”, (The New Regional Method for Creation of Groundwater Vulnerability Maps IZDAN—Application on the Republic of Serbia). In Proceedings of the 15th Congress of the Geologists of Serbia with International Participation, Belgrade, Serbia, 26–29 May 2010; pp. 585–590. [Google Scholar]
  6. Marín, A.I.; Andreo, B. Vulnerability to contamination of Karst Aquifers. In Karst Aquifers—Characterization and Engineering; Springer: Berlin/Heidelberg, Germany, 2015; pp. 251–266. [Google Scholar]
  7. Andreo, B.; Goldscheider, N.; Vadillo, I.; Vías, J.M.; Neukum, C.; Sinreich, M.; Jiménez, P.; Brechenmacher, J.; Carrasco, F.; Hötzl, H. Karst groundwater protection: First application of a Pan-European Approach to vulnerability, hazard and risk mapping in the Sierra de Líbar (Southern Spain). Sci. Total Environ. 2006, 357, 54–73. [Google Scholar] [CrossRef] [PubMed]
  8. Ravbar, N.; Goldscheider, N. Comparative application of four methods of groundwater vulnerability mapping in a Slovene karst catchment. Hydrogeol. J. 2009, 17, 725–733. [Google Scholar] [CrossRef]
  9. Marín, A.; Dörfliger, N.; Andreo, B. Comparative application of two methods (COP and PaPRIKa) for groundwater vulnerability mapping in Mediterranean karst aquifers (France and Spain). Environ. Earth Sci. 2012, 65, 2407–2421. [Google Scholar] [CrossRef]
  10. Moreno-Gómez, M.; Pacheco, J.; Liedl, R.; Stefan, C. Evaluating the applicability of European karst vulnerability assessment methods to the Yucatan karst, Mexico. Environ. Earth Sci. 2018, 77, 682. [Google Scholar] [CrossRef]
  11. Malík, P.; Svasta, J. REKS—An Alternative Method of Karst Groundwater Vulnerability Estimation. Hydrogeology and Land Use Management. In Proceedings of the XXIX Congress of the International Association of Hydrogeologist, Bratislava, Slovakia, 6–10 September 1999; pp. 79–85. [Google Scholar]
  12. Doerfliger, N.; Jeannin, P.Y.; Zwahlen, F. Water vulnerability assessment in karst environments: A new method of defining protection areas using a multi-attribute approach and GIS tools (EPIK method). Environ. Geol. 1999, 39, 165–176. [Google Scholar] [CrossRef]
  13. Kavouri, K.; Plagnes, V.; Tremoulet, J.; Dörfliger, N.; Rejiba, F.; Marchet, P. PaPRIKa: A method for estimating karst resource and source vulnerability—Application to the Ouysse karst system (In southwest France). Hydrogeol. J. 2011, 19, 339–353. [Google Scholar] [CrossRef]
  14. Vías, J.; Andreo, B.; Perles, M.; Carrasco, F.; Vadillo, I.; Jiménez, P. Proposed method for groundwater vulnerability mapping in carbonate (karstic) aquifers: The COP method. Hydrogeol. J. 2006, 14, 912–925. [Google Scholar] [CrossRef]
  15. Ravbar, N.; Goldscheider, N. Proposed methodology of vulnerability and contamination risk mapping for the protection of karst aquifers in Slovenia. Acta Carsologica 2007, 36, 397–411. [Google Scholar] [CrossRef]
  16. Davis, A.; Long, A.; Nazir, M.; Xiaodan, T. Groundwater Vulnerability in the Rapid Creek Basin Above Rapid City, South Dakota; Department of Geology and Geological Engineering South Dakota School of Mines and Technology: Rapid City, SD, USA, 1994; p. 70. [Google Scholar]
  17. Jiménez-Madrid, A.; Carrasco, F.; Martínez, C.; Gogu, R. DRISTPI, a new groundwater vulnerability mapping method for use in karstic and non-karstic aquifers. Q. J. Eng. Geol. Hydrogeol. 2013, 46, 245–255. [Google Scholar] [CrossRef]
  18. Zwahlen, F. Vulnerability and Risk Mapping for the Protection of Carbonate (Karst) Aquifers; Final Report (COST Action 620); European Commission, Directorate-General XII Science: Brussels, Belgium, 2004; p. 297. [Google Scholar]
  19. Bauer-Gottwein, P.; Gondwe, B.R.; Charvet, G.; Marín, L.E.; Rebolledo-Vieyra, M.; Merediz-Alonso, G. Review: The Yucatán Peninsula karst aquifer, México. Hydrogeol. J. 2011, 19, 507–524. [Google Scholar] [CrossRef]
  20. Weidie, A. Geology of Yucatan Platform. In Geology and Hydrogeology of the Yucatan and Quaternary Geology of Northeastern Yucatan Peninsula; New Orleans Geological Society: New Orleans, Louisiana, 1985. [Google Scholar]
  21. Hildebrand, A.R.; Pilkington, M.; Connors, M.; Ortiz-Aleman, C.; Chavez, R.E. Size and structure of the Chicxulub crater revealed by horizontal gravity gradients and cenotes. Nature 1995, 376, 415. [Google Scholar] [CrossRef]
  22. Pope, K.O.; Ocampo, A.C.; Duller, C.E. Surficial geology of the Chicxulub impact crater, Yucatan, Mexico. Earth Moon Planets 1993, 63, 93–104. [Google Scholar] [CrossRef] [PubMed] [Green Version]
  23. Perry, E.; Marin, L.; McClain, J.; Velazquez, G. Ring of cenotes (sinkholes), northwest Yucatan, Mexico: Its hydrogeologic characteristics and possible association with the Chicxulub impact crater. Geology 1995, 23, 17–20. [Google Scholar] [CrossRef]
  24. Pope, K.; Duller, C. Satellite Observations of Ancient and Modern Water Resources in the Yucatan Peninsula. In Memoria, Simposio Latin Americano Sobre Sensores Remotos: Sociedad de Especialistas Latin Americano en Percepción Remoto y Instituto de Geografıa; Universidad Autónoma de México: Mexico City, Mexico, 1989; pp. 91–98. [Google Scholar]
  25. Connors, M.; Hildebrand, A.R.; Pilkington, M.; Ortiz-Aleman, C.; Chavez, R.E.; Urrutia-Fucugauchi, J.; Graniel-Castro, E.; Camara-Zi, A.; Vasquez, J.; Halpenny, J.F. Yucatan karst features and the size of Chicxulub crater. Geophys. J. Int. 1996, 127, F11–F14. [Google Scholar] [CrossRef]
  26. Moreno-Gómez, M.; Liedl, R.; Stefan, C. A new GIS-Based model for karst dolines mapping using LiDAR. Application of a multidepth threshold approach in the Yucatan karst, Mexico. Remote Sens. 2019, 11, 1147. [Google Scholar] [CrossRef]
  27. Doehring, D.O.; Butler, J.H. Hydrogeologic constraints on Yucatán’s development. Science 1974, 186, 591–595. [Google Scholar] [CrossRef]
  28. Lesser, I.; Weidie, A. Region 25, Yucatán Peninsula. In Hydrogeology: The geology of North America; Geological Society of America: Boulder, CO, USA, 1988; Volumes 0–2, pp. 237–242. [Google Scholar]
  29. CNA National Water Commission. Statistics on Water in México, 2015 Edition, National Water Commission: Coyoacan, México, 2015.
  30. Lesser, J.M. Estudio hidrogeologico e hidrogeoquimico de la Peninsula de Yucatan; Secretaría de Recursos Hidraulicos, Dirección de Geohidrología y de Zonas Aridas: Mérida, Mexico, 1976. [Google Scholar]
  31. Gondwe, B.R.; Lerer, S.; Stisen, S.; Marín, L.; Rebolledo-Vieyra, M.; Merediz-Alonso, G.; Bauer-Gottwein, P. Hydrogeology of the south-eastern Yucatan Peninsula: New insights from water level measurements, geochemistry, geophysics and remote sensing. J. Hydrol. 2010, 389, 1–17. [Google Scholar] [CrossRef]
  32. SMN Datos Climáticos Diarios del CLICOM del SMN a Través de su Plataforma web del CICESE. Available online: http://clicom-mex.cicese.mx (accessed on 6 October 2018).
  33. Escolero, O.; Marin, L.E.; Torres-Onofre, S. Dynamic of the freshwater–saltwater interface in a karstic aquifer under extraordinary recharge action: The Merida Yucatan case study. Environ. Geol. 2007, 51, 719–723. [Google Scholar] [CrossRef]
  34. Marin, L.E. Field Investigations and Numerical Simulation of Groundwater Flow in the Karstic Aquifer of Northwestern Yucatan; Northern Illinois University: DeKalb, IL, USA, 1990. [Google Scholar]
  35. Perry, E.; Velazquez-Oliman, G.; Marin, L. The hydrogeochemistry of the karst aquifer system of the northern Yucatan Peninsula, Mexico. Int. Geol. Rev. 2002, 44, 191–221. [Google Scholar] [CrossRef]
  36. Gonzalez-Herrera, R. Evolution of Groundwater Contamination in the Yucatan Karstic Aquifer. Master’s Thesis, University of Waterloo, Waterloo, ON, Canada, 1992. Unpublished. [Google Scholar]
  37. González-Herrera, R.; Sánchez-y-Pinto, I.; Gamboa-Vargas, J. Groundwater-flow modeling in the Yucatan karstic aquifer, Mexico. Hydrogeol. J. 2002, 10, 539–552. [Google Scholar] [CrossRef]
  38. SEMARNAP Mapa de Suelos Dominantes de la República Mexicana. Obtenidos a Través de la Plataforma CONABIO. Available online: http://www.conabio.gob.mx (accessed on 18 May 2018).
  39. Sánchez, O.S.; Islebe, G.A.; Hernández, M.V. Flora arbórea y caracterización de gremios ecológicos en distintos estados sucesionales de la selva mediana de Quintana Roo. For. Veracruzana 2007, 9, 17–26. [Google Scholar]
  40. Zamora Crescencio, P.; García Gil, G.; Flores Guido, J.S.; Ortiz, J.J. Estructura y composición florística de la selva mediana subcaducifolia en el sur del estado de Yucatán, México. Polibotánica 2008, 26, 39–66. [Google Scholar]
  41. Ávila, J.P.; Rocher, L.C.; Sansores, A.C. Delineación de la zona de protección hidrogeológica para el campo de pozos de la planta Mérida I, en la ciudad de Mérida, Yucatán, México. Ingeniería 2004, 8, 7–16. [Google Scholar]
  42. Escolero, O.A.; Marin, L.E.; Steinich, B.; Pacheco, J. Delimitation of a hydrogeological reserve for a city within a karstic aquifer: The Merida, Yucatan example. Landsc. Urban Plan. 2000, 51, 53–62. [Google Scholar] [CrossRef]
  43. Aller, L.; Lehr, J.H.; Petty, R.; Bennett, T. DRASTIC: A Standardized System to Evaluate Groundwater Pollution Potential Using Hydrogeologic Settings; National Water Well Association: Worthington, OH, USA, 1987. [Google Scholar]
  44. Petelet-Giraud, E.; Doerfliger, N.; Crochet, P. RISKE: Methode d’evaluation multicritere de la cartographie de la vulnerabilite des aquiferes karstiques. Application aux systemes des Fontanilles et Cent-Fonts (Herault, Sud de la France). Hydrogeologie 2000, 4, 71–88. [Google Scholar]
  45. Lodwick, W.; Monson, W.; Svoboda, L. Attribute error and sensitivity analysis of map operations in geographical information systems. Int. J. Geogr. Inf. Sci. 1990, 4, 413–428. [Google Scholar] [CrossRef]
  46. Gogu, R.C.; Dassargues, A. Sensitivity analysis for the EPIK method of vulnerability assessment in a small karstic aquifer, southern Belgium. Hydrogeol. J. 2000, 8, 337–345. [Google Scholar] [CrossRef]
  47. Napolitano, P.; Fabbri, A. Single-Parameter Sensitivity Analysis for Aquifer Vulnerability Assessment Using DRASTIC and SINTACS. In Series of Proceedings and Reports-Intern Assoc Hydrological Sciences; IAHS Publications: Oxfordshire, UK, 1996; Volume 235, pp. 559–566. [Google Scholar]
Figure 1. Workflow for the development of a new integrated approach; red arrows follow the scope of this work. Unsuitable methods are those demanding data not available for the study area.
Water 11 01610 g001
Figure 2. The Yucatan Peninsula geology according to Weidie [20].
Water 11 01610 g002
Figure 3. Maps representing the most characteristic features in Yucatan. (a) Elevation and karst features; (b) Slope; (c) Precipitation; (d) Depth to the water table and (e) Soil texture distribution.
Water 11 01610 g003
Figure 4. Final vulnerability maps from (a) DRISTPI; (b) KRSTI; (c) ISKE; and (d) SA.
Water 11 01610 g004
Figure 5. Percentage comparison of vulnerability classes displayed in Yucatan from four vulnerability methods.
Water 11 01610 g005
Figure 6. Influence of slope and soil texture in two scenarios: (a) Point infiltration; (b) diffuse infiltration. In (a), Grid 2 influences high vulnerability since it promotes a surface stream towards a swallow hole. In (b), the same grid would promote low vulnerability since vertical infiltration, at this grid, is minimized.
Water 11 01610 g006
Table 1. Data utilized to create map layers for the four methods presented here and those presented previously by Moreno-Gómez [10].
Map LayersDRISTPiKARSTICRISKESAPaPRIKaCOPPiEPIKData
Soil thickness XXXXXXBorehole data a
Soil textureXXXXXXX Borehole data a
LithologyXXXXXXX Lithology map a
FracturingXXXXXXX Fracturing maps a
Unsaturated zone (Depth)XX X XX Digital elevation model b/groundwater levels a
Epikarst X X XXSinkholes density map
Confined conditions X X Literature review
SlopeXXXXXXXXDEM b
Vegetation X XXXVegetation maps a
Karstification XXXXXXXSinkhole/fissure density maps
Rainfall volume X X 25 years historic data c
Rainfall intensity X X 25 years historic data c
RechargeXX X Precipitation c, APLIS d method
Surface features X Sinkholes and fracturing maps a
Effective field capacity X Settled with minimum values
Hydraulic conductivity (soil) X Soil maps a, Saxton equations
Hydraulic conductivity (aquifer) X Na
Rock reservoir XX X Na
Note: a Data publicly available at http://www.beta.inegi.org.mx (Vector maps at 1:50,000 scale); b digital elevation model (ASTER GDEM, 30 m resolution) from https://www.earthexplorer.usgs.gov; c data publicly available at http://clicom-mex.cicese.mx/; d multi-parameter method to estimate recharge based on altitude (A), precipitation (P), lithology (L), infiltration (I) and soil (S).
Table 2. Vulnerability classes and index variation according different methods.
Vulnerability DescriptionVulnerability
Class
Original Test Site
Sierra de Cañete, Spain and Neblón River Basin, BelgiumRapid Creek Basin, South Dakota, USAFontanilles and Cent-Fonts Karstic Aquifers, FrancePodstenjšek Springs Catchment, Slovenia
DRISTPi IndexKARSTIC IndexRISKE IndexSA Index
Very low117–500–2000–0.84–15
Low250–80200–350>0.8–1.62–4
Moderate380–110350–600>1.6–2.41–2
High4110–140600–800>2.4–3.20.5–1
Very high5>140>800>3.2–40–0.5
Table 3. Average sensitivity values for the Yucatan case and all possible UCS scenarios for the DRISTPi method.
SensitivityDRISTPi
Yucatan Sxi1.12.73.82.62.41.6
All UCS Sxi1.62.12.81.42.42.6
Yucatan Vxi12.129.734.05.05.613.6
All UCS Vxi10.322.128.011.65.522.5
Yucatan Cs45.272.5100.09.319.224.9
All UCS Cs34.770.783.238.818.466.2
Note: Yucatan UCSs = 920; all UCSs = 123,200.
Table 4. Parameters sensitivity of the KARSTIC method without the A and C layers.
SensitivityKRSTI
Yucatan Sxi4.12.16.25.514.0
UCS Sxi28.713.515.416.925.7
Yucatan Vxi12.322.15.77.352.6
UCS Vxi37.19.46.34.040.1
Yucatan Cs23.024.60.00.125.0
UCS Cs55.912.37.74.557.7
Note: Yucatan UCSs = 444; all UCSs = 118,800.
Table 5. Average sensitivity values for the Yucatan case and all possible combination scenarios for the ISKE method without the R parameter.
SensitivityISKE
Yucatan Sxi0.170.100.080.08
UCS Sxi0.120.080.050.05
Yucatan Vxi39.637.623.324.1
UCS Vxi37.135.126.223.2
Yucatan Cs68.025.345.044.8
UCS Cs98.814.615.714.4
Note: Yucatan UCSs = 62; all UCSs = 625.
Table 6. Average sensitivity values for the SA.
SensitivityOsOlSvSfRdSe
Yucatan Sxi0.290.080.120.230.150.09
UCS Sxi0.130.180.170.190.160.17
Yucatan Vxi65.9834.025.5638.1011.110.00
UCS Vxi31.8668.1430.4752.7825.6930.56
Yucatan Cs10097.7048.73.010
UCS Cs99.999.999.696.591.366.7
Note: Yucatan UCSs = 30; all UCSs = 207,346.
Table 7. Important parameters leading specific vulnerability classes derived from spatial match with final maps.
MethodVulnerability Class
VHVHVMVLVVLV
DRISTPiFissuringFissuringLithologyNot displayedNot displayed
KRSTISinkhole density and fissuresSinkhole density and fissuresShallow water tableDeep water tableNot displayed
ISKENegligibleSinkhole density and fissuresLow slope percentageHigh slope percentageNot displayed
SANot displayedSinkhole density and fissuresSoil thickness and textureSoil thickness and textureSoil thickness and texture

