LUCC and Ecosystem Service Value Assessment for Wetlands: A Case Study in Nansi Lake, China


1
School of Environment Science and Spatial Informatics, China University of Mining and Technology, Xuzhou 221116, China
2
Jiangsu Key Laboratory of Resources and Environmental Information Engineering, Xuzhou 221116, China
*
Author to whom correspondence should be addressed.
Water 2019, 11(8), 1597; https://doi.org/10.3390/w11081597
Submission received: 3 June 2019
/
Revised: 13 July 2019
/
Accepted: 30 July 2019
/
Published: 31 July 2019
(This article belongs to the Section Water Quality and Contamination)
Abstract
:Wetland is one of the most important ecosystems in the world. A healthy wetland ecosystem is important to the development of a regional and even global economy, and it is also beneficial to the human living conditions. In this paper, remote sensing (RS), landscape metrics were used to analyze the land use/land cover change (LUCC), landscape pattern change and the ecosystem services value (ESV) from 1987 to 2017 in Nansi Lake wetland of China. The results showed: 54.4% of the natural wetlands in Nansi Lake were replaced by constructed wetlands in the past 30 years, the ecosystem was degraded and the landscape structure was fragmented due to the severe drought in 2002 and the development of aquaculture and tourism in recent years. The ESV of Nansi Lake wetland fluctuated from 1987 to 2017, and the average annual ESV ($8134/hm2) was much lower than that of global and China’s wetlands, the LUCC driven by human production and economic development leads to the reduction of ESV, especially the rapid increase of constructed wetlands. Finally, the implications of wetland laws and policies, wetland monitoring, assessment and database construction, and wetland regional development strategies were discussed for wetland protection and management.

1. Introduction
Ecosystem services (ES) are the flow of natural capital to society, such as wood, fiber, food and drinking water [1]. Human activities interact with the surrounding environment and form a complex social-ecological system, which affects and directs the flow of ES. As one of the three most significant ecosystems, the wetland ecosystem is known as the “kidney” [2] of the earth because of its ecological regulating functions and valuable natural resources. The ecosystem services value (ESV) of wetland is among the highest of any ecosystem assessed [1,3]. Wetlands supply a variety of resources for human’s production and life, and provide via ecological services either directly or indirectly including climate regulation, water conservation, purification, soil conservation and biodiversity protection [4,5,6,7], which have played an important role throughout history to secure human well-being, as well as the social and cultural evolution of humankind [3,8,9]. However, with the rapid population growth and excessive resource consumption, the stability and biodiversity of wetland ecosystem were seriously damaged [6,10,11]. Increasing environmental and resource problems resulted in the degradation of wetlands, restricting the sustainable development of regional economy and society [2,12]. In China, the wetland area has been reduced by approximately 33% in the past 30 years, and 40% of the key protected wetlands are facing severe threat of degradation [13,14]. Wetland research and protection has become the consensus of governments, the public and the international academic community in the 21st century [15].
The valuation of ES has proliferated since the early 1990s [16]. In 2001, the Millennium Ecosystem Assessment (MEA) proposed a framework to assess the relationship between ecosystems and human well-being, and established a multi-scale and comprehensive method for assessing the relationships among components. The research of ES was gradually improved with the aggravation of environmental problems [17]. The early studies on ES mainly focused on the ecosystem components, evaluating indicators, impacts and different evaluation methods; they placed emphasis more on the assessment of natural ES [18,19,20]. Recently, the influences of ES have received increasing attention, models and frameworks of ESV have been constantly proposed, such as Integrated Valuation of Environmental Services and Tradeoffs (InVEST), Artificial Intelligence for Ecosystem Services (ARIES), Social Values for Ecosystem Services (So1VES) and Economics of Ecosystems and Biodiversity (IEEB) comprehensive assessment framework [21,22,23]. The studies of multi-scale, multi-component comprehensive evaluation in typical regions with specific natural, social and economic conditions are more extensive, covering farmland, grassland, wetland, forest, urban and rural ecosystems [16,24,25,26]. Attempts have been made to estimate the value of constructed ES to make up for the inadequacy of previous studies of natural ES, and the valuation methods such as contingent valuation method (CVM), meta-analytical regression model, market value method, shadow engineering method and travel cost method have been widely used [27,28,29,30]. However, debate persists over the applicability and reliability of the ESV assessment frameworks and methodologies.
Wetlands have been estimated to cover some 6% of the world’s land surface, which is probably about half of the extent that existed before human modifications during historical times [8]. In recent years, a series of studies have been conducted on global wetland degradation and loss, water (pollution and purification), soils (organic carbon, N, P, K, etc.), communities (biological and microbiological) and landscape pattern to reveal the degradation process and mechanism of wetland ecosystems and its relationship with global climate change [31,32,33,34]. Some international organizations such as Wetlands International (WIUN), The Wetlands Alliance Programme (WAP) are founded and committed to the work of wetland LUCC, ES and biodiversity around the world. Original research of wetland LUCC is mainly estimated through investigation and mapping. More recently, remote sensing (RS) and geographic information system (GIS) techniques have been widely used in land change monitoring, habitat mapping, species mapping and biodiversity assessment by providing and processing large-scale basic information [35,36,37]. Besides, remote sensing also offers an efficient means for mapping wetlands over a specific area at different periods in time and provides reliable information on wetland characteristics [38,39]. However, despite the acknowledged importance of wetlands, their values are routinely overlooked or underestimated [40]. A vast array of frameworks and approaches are available to identify, characterize and value ecosystem services, but most of them are different in their application and scope, with many tools being limited in their utility as a result of high time, cost or data requirements [6]. While some generalized approaches may be highly effective for European and American developed countries, they may be ineffective for China wetlands with more severe human disturbances, especially at the local level and serious degradation areas. Assessment of ESV under the background of micro scale and multi-temporal land use change is a topic worthy of in-depth study.
As a natural reserve of China, Nansi Lake wetland is characterized by abundant biological diversity and high productivity. However, with the disturbance of human activities and climate change, the ecosystem of Nansi Lake wetland continued to degenerate in recent decades. In this paper, taking Nansi Lake wetland as the study area, we aim to evaluate the ESV of Nansi Lake wetland based on land use and landscape pattern changes over the past three decades, the specific objectives include: Quantify and characterize the LUCC and landscape pattern change from 1987 to 2017 based on six sets of Landsat TM images; Assess and analyze the ESV of Nansi Lake wetland in the past 30 years; Discuss the driving factors of LUCC and landscape pattern change and the impact of landscape change on the ESV, and propose the implications for wetland protection and management.
2. Materials and Methods
2.1. Study Area
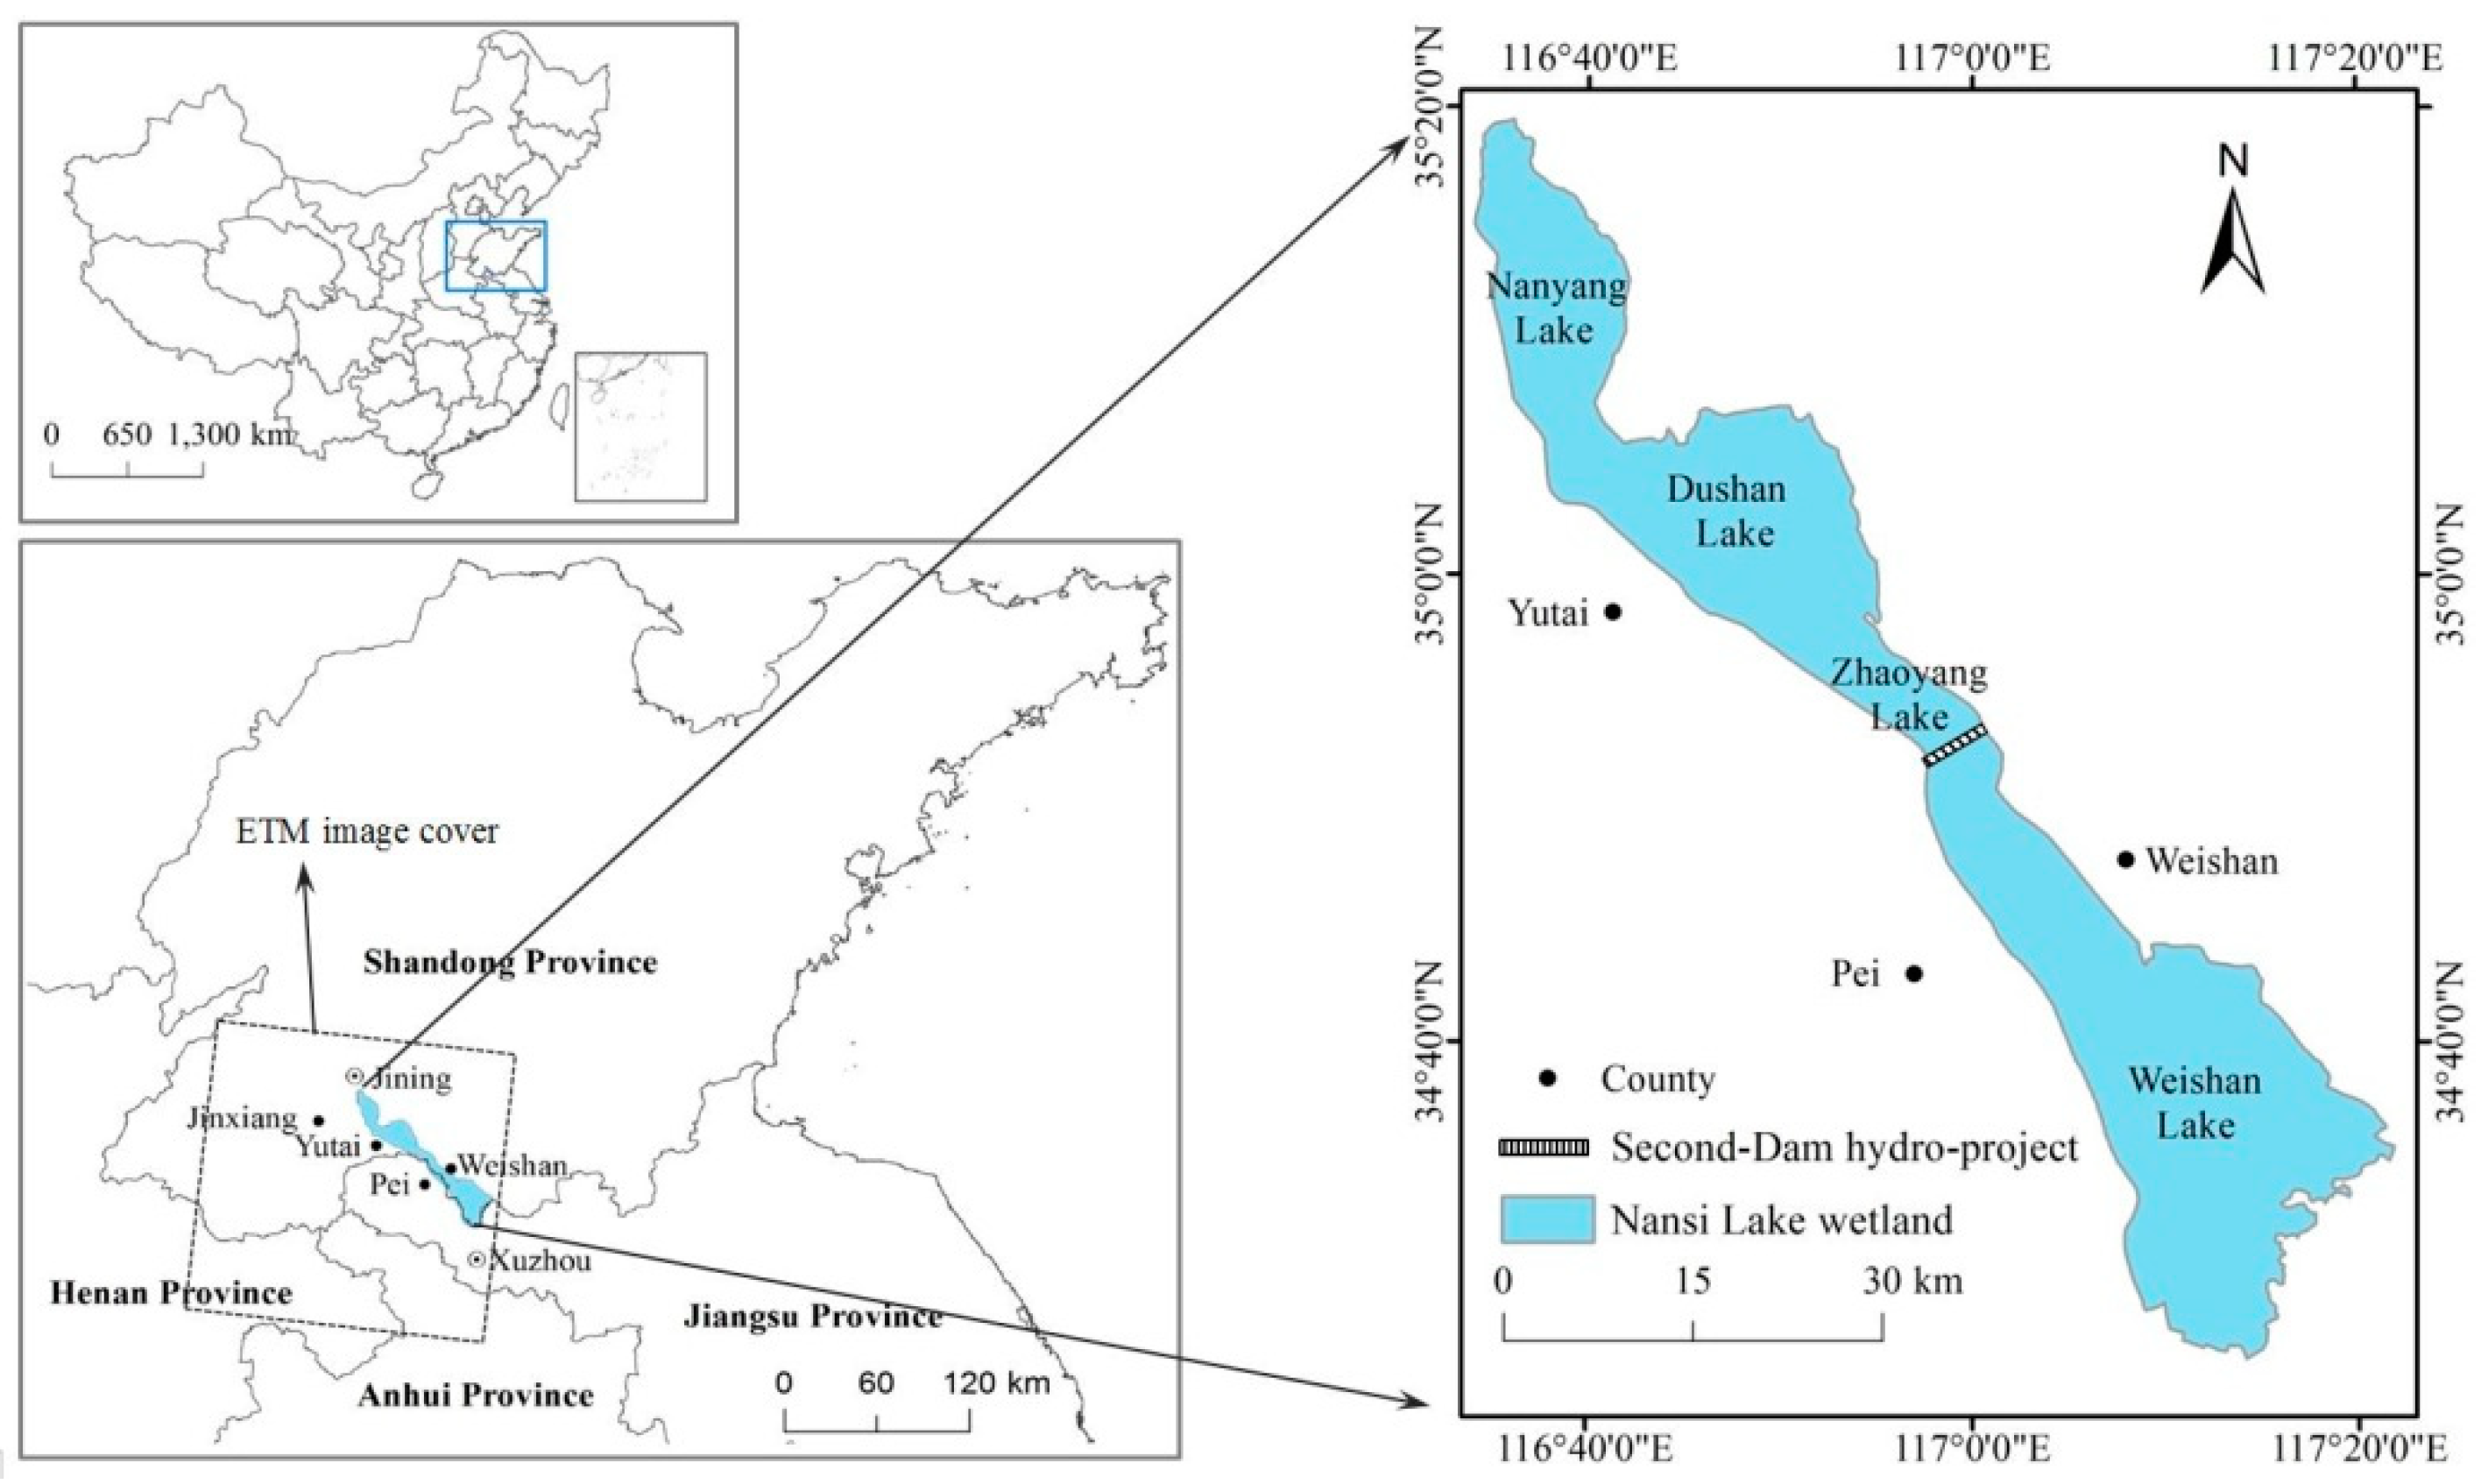
Nansi Lake (or Weishan Lake), administrated by Weishan County of Jining and located in the southwest of Shandong Province (34°27′–35°20′N, 116°34′–117°21′E), is the largest freshwater lake in north China [41]. It is composed of four connected lakes including Nanyang Lake, Dushan Lake, Zhaoyang Lake and Weishan Lake, covering an area of 1266 km2 with 125 km in length from south to north and 5–25 km in width from east to west. The Second-Dam hydro-project which is located in the middle of Zhaoyang Lake divides the Nansi Lake into the Upper Lake (northern part, 602 km2) and the Lower Lake (southern part, 664 km2) [42]. The east, west and north sides of Nansi Lake undertake 53 rivers’ entries from 32 cities and districts of four provinces: Jiangsu, Shandong, Henan and Anhui (Figure 1). Nansi Lake is a warm temperate semi humid monsoon climate zone characterized by hot and rainy summers, cold and dry winters, and distinct seasons, it shapes its biodiversity and wetland ecosystem features include fragility in the living environment, diversity in species and singularity in biology [42]. Nansi Lake wetland is a typical lake wetland composed of natural wetland, constructed wetland and a tiny proportion of non-wetland. The scope of the study area includes the lake with perennial water, the transition areas of lake and dry land according to the principles of integrity of wetland habitat, rationality of administrative units and natural geographic boundaries [43].Currently, as an international importance wetland of Ramsar convention, Nansi Lake has become one of the most important reservoir lakes for the east route of the South-to-North Water Diversion Project of China, and also a national water source and biodiversity conservation area.
2.2. Data Sources and Processing
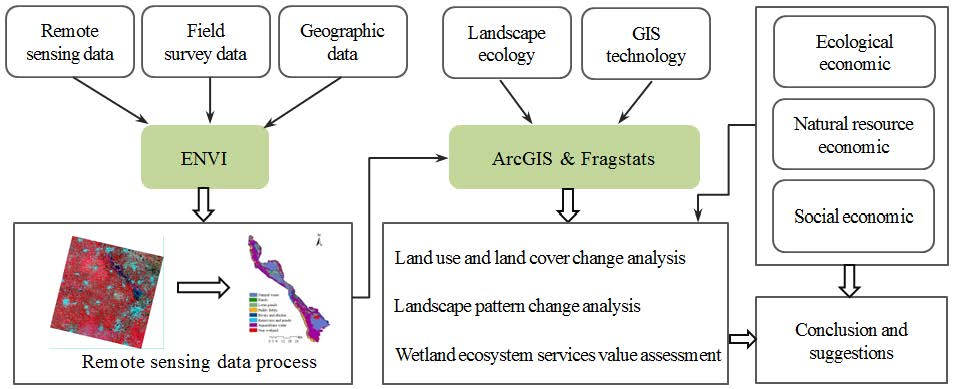
The data include multi-source remote sensing data, fundamental geographic data and socio-economic statistics. Considering the availability of a long-term data, the characteristics and separability of land use types in Nansi Lake wetland, the remote sensing data used in the study were Landsat 5 TM images (30 m × 30 m) on 19th September 1987, 12th November 1995, 31st May 2002, 11th June 2006, 18th September 2010 and Landsat 8 OLI image (15 m × 15 m) on 17th June 2017 (data sources: http://earthexplorer.usgs.gov/), and all images were corrected and fused to improve the resolution of images with the support of ENVI 5.1 software (ITT Visual Information Solutions, New York, NY, USA). The fundamental geographic data include topographic map, administrative boundaries and Nansi Lake boundaries (data sources: Geospatial Data Cloud, Computer Network Information Center, Chinese Academy of Sciences, http://www.gscloud.cn). The socio-economic data are mainly from Jining statistical yearbook (2012–2016) [44] and Weishan statistical bulletin (2012–2016, http://www.weishan.gov.cn). Furthermore, we also collected the hydrology, meteorology and soil data of Nansi Lake from Jining Land and Resources Bureau, Jining Meteorological Bureau to serve as the ancillary information.
2.3. Research Methods
2.3.1. Classification of Land Use Types
Nansi Lake is rich in natural resources and diverse in landscape types. Lotus and reeds are the dominant aquatic species of wetland, aquaculture and paddy are concentrated in the surrounding areas, Weishan Island located in the middle of the lake, which is a National 4A Grade Scenic Spot. For lake wetlands, the land use types of the Nansi Lake wetland have more clear boundaries and are easier to classify. According to the actuality of Nansi Lake wetland and the “Standard of the China wetland resources survey and monitoring techniques” (2009), the object-oriented supervised classification method was used to classify the land use types of Nansi Lake wetland. Firstly, as the phenomenon of “the same spectrum with different objects” existed in natural water, rivers, reservoirs and lakes pond in Nansi Lake wetland, the attributes of spectral, shape, color, size, texture, and adjacent relation were chosen to segment and merge the images to extract the training samples of different objects with the support of the Feature Extraction module [45]. Then, the Compute ROI (region of interest) Separability tool was used for class detection and sample adjustment, and the supervised classification was implemented by K-Nearest-Neighbor method. Finally, the sampling points were selected by stratified sampling method (the method can insure adequate samples even in the smallest land class) and compared with the present land use data obtained from field survey and the high-resolution surface image to verify the accuracy and Kappa Coefficients of the classification results.
2.3.2. Analysis of Landscape Pattern Change
Landscape metrics are one of the key factors of modern landscape ecological research to describe landscape patterns and structures, which can be defined as quantitative and aggregate measurements showing spatial heterogeneity at a specific scale and resolution [46]. In this study, the Fragstats 3.3 software (Oregon State University, Corvallis, OR, USA) was used and six widely used landscape metrics at landscape level were selected to quantitatively analyze the landscape patterns of Nansi Lake wetland: Number of patches (NP); Patch density (PD) equals the number of patches of the corresponding patch type divided by total landscape area; Landscape shape index (LSI) measures the perimeter-to-area ratio for the landscape as a whole, it can be interpreted as a measure of the overall geometric complexity of the landscape; Contagion Index (CONTAG) refers to the degree to which mapped attributes are clumped into patches of the same attribute class in the landscape; Shannon diversity index (SHDI) is a popular measure of diversity in community ecology applied to landscape, it equals minus the sum, across all patch types, of the proportional abundance of each patch type multiplied by that proportion; Shannon evenness index (SHEI) is expressed such that an even distribution of area among patch types results in maximum evenness, it reflects the evenness of patch types present in the landscape.
2.3.3. Assessment of the ESV
Combined with the characteristics of Nansi Lake wetland ecosystem and previously published methods for estimating categories of ecosystem services values as described in the literature [47,48,49], the ES of Nansi Lake wetland were classified into 4 categories: provisioning services (material production), regulating services (climate regulation, water conservation, flood reservation, purification), supporting services (soil conservation) and cultural services (recreation). To make the results more reasonable and comparable, we selected the average price of the last five years (2012–2016) as the benchmark price for the assessment. The quantity and current price data of Nansi Lake aquatic products were obtained from Jining statistical yearbook [44], local market survey prices and local government annual statistics bulletin on national economic and social development (2012–2016). All monetary estimates were inflation-adjusted to 2012 USD based on the regional average agricultural producer price indices, and the average exchange rate was 6.304 yuan per dollar.
(1) Material production
The material production of Nansi Lake wetland mainly includes two aspects: food and raw materials. Food including carp, crucian, mandarin fish, turtle, paddy, gorgon fruit, and reed is the main raw material. So we classified the material production into three categories: fish, paddy and reed. The value of material production was estimated by market value approach (MV), an objective method of valuation through the market price of material products. Besides, in order to make the results more accurate and reasonable, the input value of food production (such as money and labor force) is also an important factor that needs to be estimated, mainly including the values of paddy and the fish in aquaculture area. Fish in natural water mainly feed on plankton, so the input value can be neglected. Referring to Jining statistical yearbook [44] and a survey of local market prices, the average price of fish was $1.745 × 10³/t and the input value of paddy was $1.762 × 10⁵/km2 (Table 1), the average unit area yield were 31.5 t/km2 in natural water and 225 t/km2 in aquaculture area. Similarly, the average price of paddy and reed were $460/t and $79.4/t, and the average unit area yields were 860.1 t/km2 and 400 t/km2 respectively [48]. The intermediate input value of fish in aquaculture area was calculated according to the average proportion of fishery added value to total output value (54.742%) in Nansi Lake in the most recent five years, which was $2.149 × 10⁵ km2. The formula is:
where Vm is the total value of material production; Vi and Vj are the input value and output value of production type i; Si is the production area of type i; Yi is unit area yield of type i; Pi is the price of type i; Qi is the unit area input value of type i.
(2) Climate regulation
The wetland can affect the regional climate both positively and negatively. The positive side was the phytoplankton and aquatic plants (reeds and lotus) in natural wetland and the paddy field in constructed wetland can absorb CO2 and released O2 by photosynthesis (CO2 + H2O → C6H12O2 + O2, the plants produce 1 unit of biomass that can absorb 1.63 units of CO2 and release 1.191 units of O2). Conversely, CH4 released from the hydrophyte and CO2 released from aquaculture had a negative effect on the regional climate environment of wetland. We utilized the industrial oxygen/carbon tax method (IO/CT) [50] and afforestation cost method (AC) [51] to transform the ecological indicators into economic indicators and evaluate the climate regulation services value of Nansi Lake wetland (Table 2). According to the latest results of “Country-level social cost of carbon”, the cost of CO2 in China was $24/t [52], and the costs of O2 and CH4 were obtained from China’s industrial oxygen production cost and average cost proposed by Mitsch et al. [53] in OECD, which were $63.5/t and $110/t respectively. The formula is:
where Vc is the value of the regional climate regulation function, VCO2 is the value of the absorbed CO2, VO2 is the value of the released O2 and the VCH4 is the value of the released CH4.
(3) Water regulation
Nansi Lake is a main reservoir lake for the east route of the South-to-North Water Diversion Project, as the largest freshwater lake and water source area in North China, it has important water regulation value. The value of water regulation was appraised by shadow engineering method (SE). A shadow price is commonly referred to as a monetary value assigned to currently unknowable or difficult-to-calculate costs. The measure of the value of a good or service can be calculated by the engineering cost of alternative projects with the same environmental functions [56]. In Nansi Lake wetland, the average depth of surface runoff was 750 mm, and the maximum surface area was 1266 km2 in history. The cost of building a reservoir published by the administration of East route of the South-to-North Water Diversion Project was $0.21/m3. The formula is:
where Vw is the value of water regulation, and the Si is the lake surface area of i year.
(4) Flood reservation
Flood reservation is one of the most important ES in Nansi Lake wetland. In 1960, China’s Ministry of Water Resources approved the construction of a Second-Dam hydro-project in the middle of Nansi Lake for flood storage, and divided the Nansi Lake into two parts: the upper lake and the lower lake. The value of the flood reservation service can be estimated by shadow engineering method (SE) based on the flood storage capacity in Nansi Lake wetland from 1987 to 2017 (Table 3) and the engineering cost ($0.21/m3) of unit storage capacity. In particular, serious drought disasters occurred in China in 2002, with the most serious regions in Shandong and Hebei provinces. According to the data of Jining statistical yearbook (2002) and Jining Hydrology Bureau, the drought disasters in Jining mainly occurred from June to December, the precipitation was 224.5 mm, which was only 30% of the average level in previous years, and the highest temperature reached 40.8 °C on July 15. The upper lake of Nansi Lake has dried up, and the water storage capacity of the lower lake was 6.1 × 10⁷ m³, which was only 3.6% of the average water storage capacity in previous years. In addition, all 53 rivers entering the lake have been cut off.
(5) Purification
Wetlands have the function of adsorbing, degrading and transforming pollutants, suspended solids and nutrients in water, and transforming potential pollutants into available resources, such as nitrogen, phosphorus and heavy metals. In Nansi Lake wetland, reed provides most of the purification function, the value of purification estimated by the “Ecosystem service equivalent value per unit area of ecosystem in China” proposed by Xie et al [57]. The unit average ecosystem service value per square kilometer was calculated by the grain crops planted in Weishan County in 2012. Furthermore, the value of purification in Nansi Lake wetland was $1.526 × 10⁵/km2. The formulas are:
where Ea is the ecosystem service value per square kilometer; 3.60 is the ecosystem services equivalent value of purification in wetland; m is the type of grain crops planted in Weishan County, m = 6; Pf, Qf and Af are the price, yield and planting area of the fth grain crop respectively; Am is the total planting area of crops; Ea = $4.239 × 10⁴/km2.
(6) Soil conservation
Soil conservation is the protection of the soil against sediment loss by erosion or fertility loss due to degradation. The value of the soil conservation service in Nansi Lake wetland includes the nutrient loss value and nutrient cycle value. The surrogate market method was used to calculate the values of them. The formulas are:
where S is the area of wetland except islands, S1 = 1208.2 km2; h is the soil erosion depth without vegetation, h = 2.5 × 10⁻² m; R1 is the soil volume weight of Nansi Lake wetland, R1 = 1.3 g/cm3; R2 is the average content of soil nutrient, R1 = 1.96%; P is the average price of chemical fertilizer in China, P = $398.2/t; Fi are the unit area fixation of N, P and K in high-flow period and mean-flow period, which are 290.0 kg/km2 and 216.0 kg/km2; Si are the area of high-flow period and mean-flow period of Nansi Lake wetland. The mean-flow period area includes shoals and islands, which can be obtained through the area of paddy fields, reservoirs and ponds, and non-wetland. The high-flow period area is the lake surface area of Nansi Lake wetland beside shoals and islands.
(7) Recreation
Cultural services relate to the non-material world, as they benefit the benefit recreational, aesthetic, cognitive and spiritual activities, which are not easily quantifiable in monetary terms [58]. The Nansi Lake wetland has many popular tourist attractions e.g., Weishan Lake national wetland park, Weishan Island, Nanyang ancient town, Honghe wetland and Qiandao wetland. The travel cost method was used to calculate the total cost of tourists as the recreation service value. The formula is:
where Vr is the recreation service value; Ti is the total number of tourists; C is the average travel costs for those attractions. According to Weishan statistical bulletin and the administration of Nansi Lake natural reserve, the tourist’s number of Nansi Lake wetland in 2002, 2006, 2010 and 2017 were 4.0 × 10⁵, 5.0 × 10⁵, 1.55 × 10⁶ and 5.3 × 10⁶ respectively. Referring to the average annual growth rate (12%) of Nansi Lake tourists during the national “Ninth Five-Year Plan” period from 1996 to 2000 [59], the estimated tourist numbers in 1987 and 1995 were 2.27 × 10⁴ and 9.17 × 10⁴. Furthermore, the average travel cost is $14.2/person.
3. Results
3.1. LUCC and Landscape Pattern Change in Nansi Lake Wetland
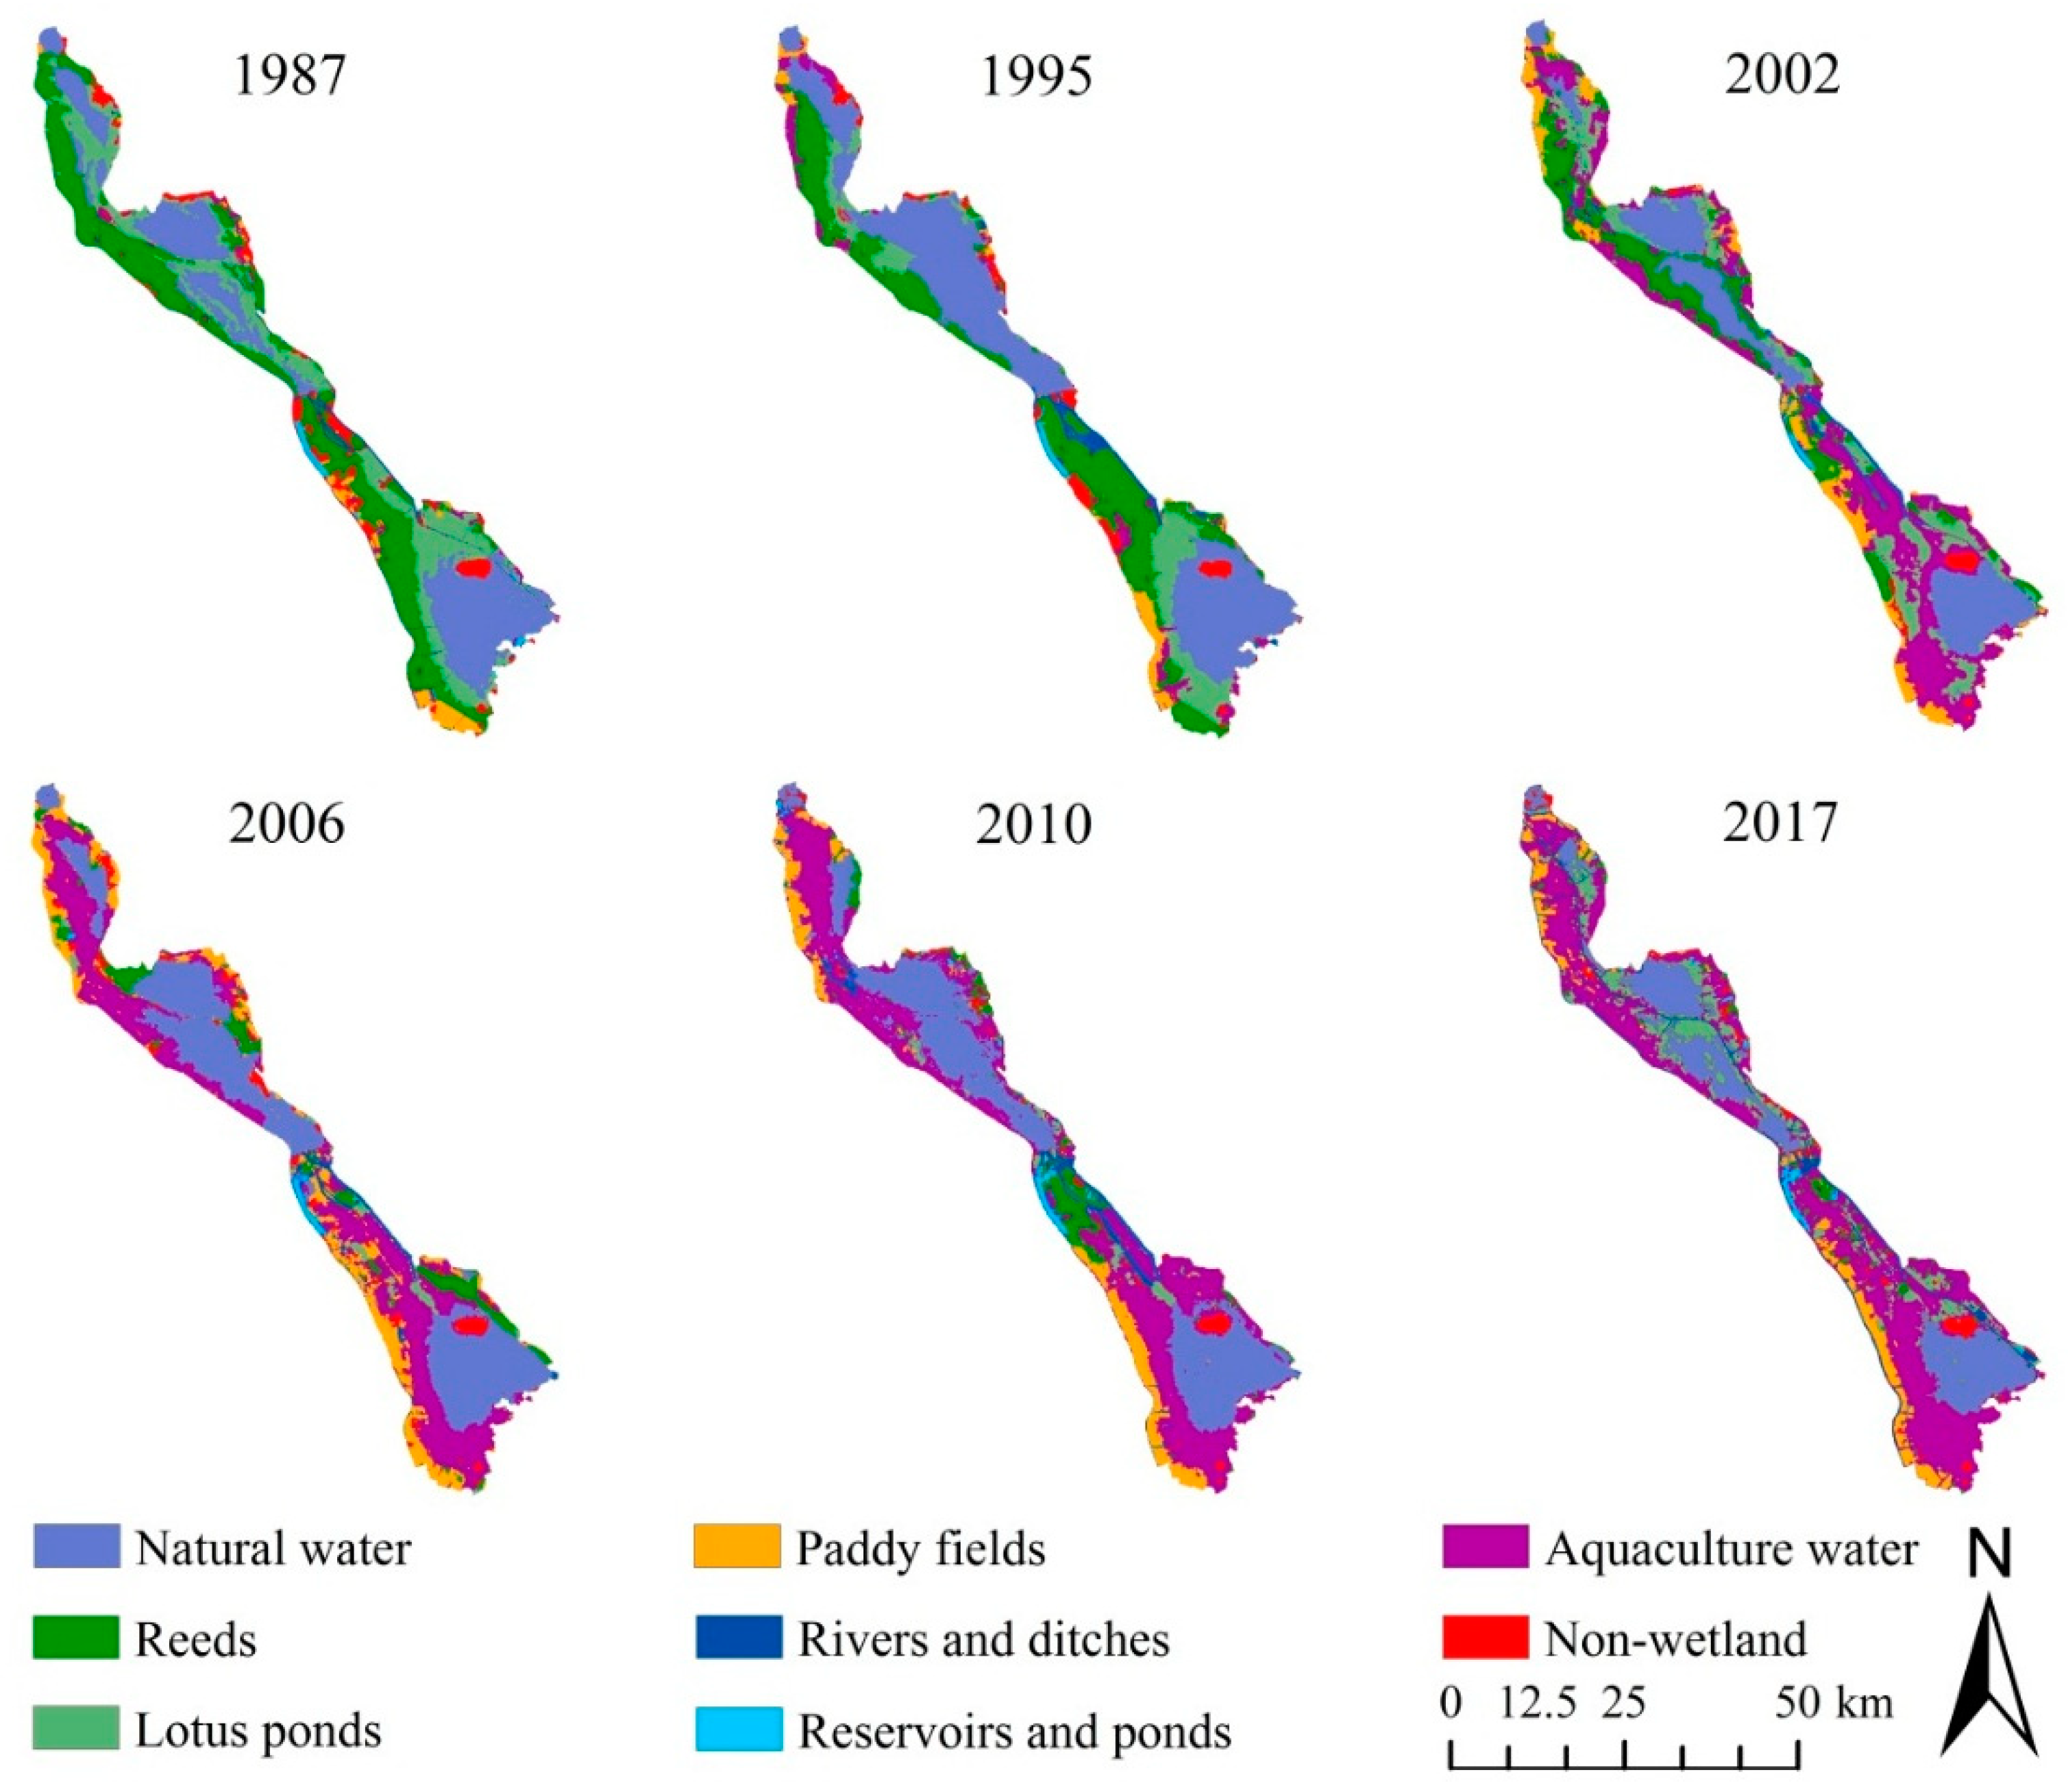
According to the land use characteristics and interpretation marks of remote sensing images, the land use types of Nansi Lake wetland were classified into three categories and eight subcategories: natural wetland (natural water, reeds, lotus ponds), constructed wetland (paddy fields, rivers and ditches, reservoirs and ponds, aquaculture water) and non-wetland (Table S1). The segment and merge thresholds were set to 36% and 94% for extracting the training samples of different land use types, and obtained 6 stage current land use maps of Nansi Lake wetland from 1987 to 2017 (Figure 2). The accuracy of the classification results showed that: except for the overall accuracy of 86.21% in 2002, the other years were above 94%, the accuracy of each type was mostly above 80%, and the Kappa Coefficients were all above 0.9 (Table S2), which meet the accuracy requirements of the research.
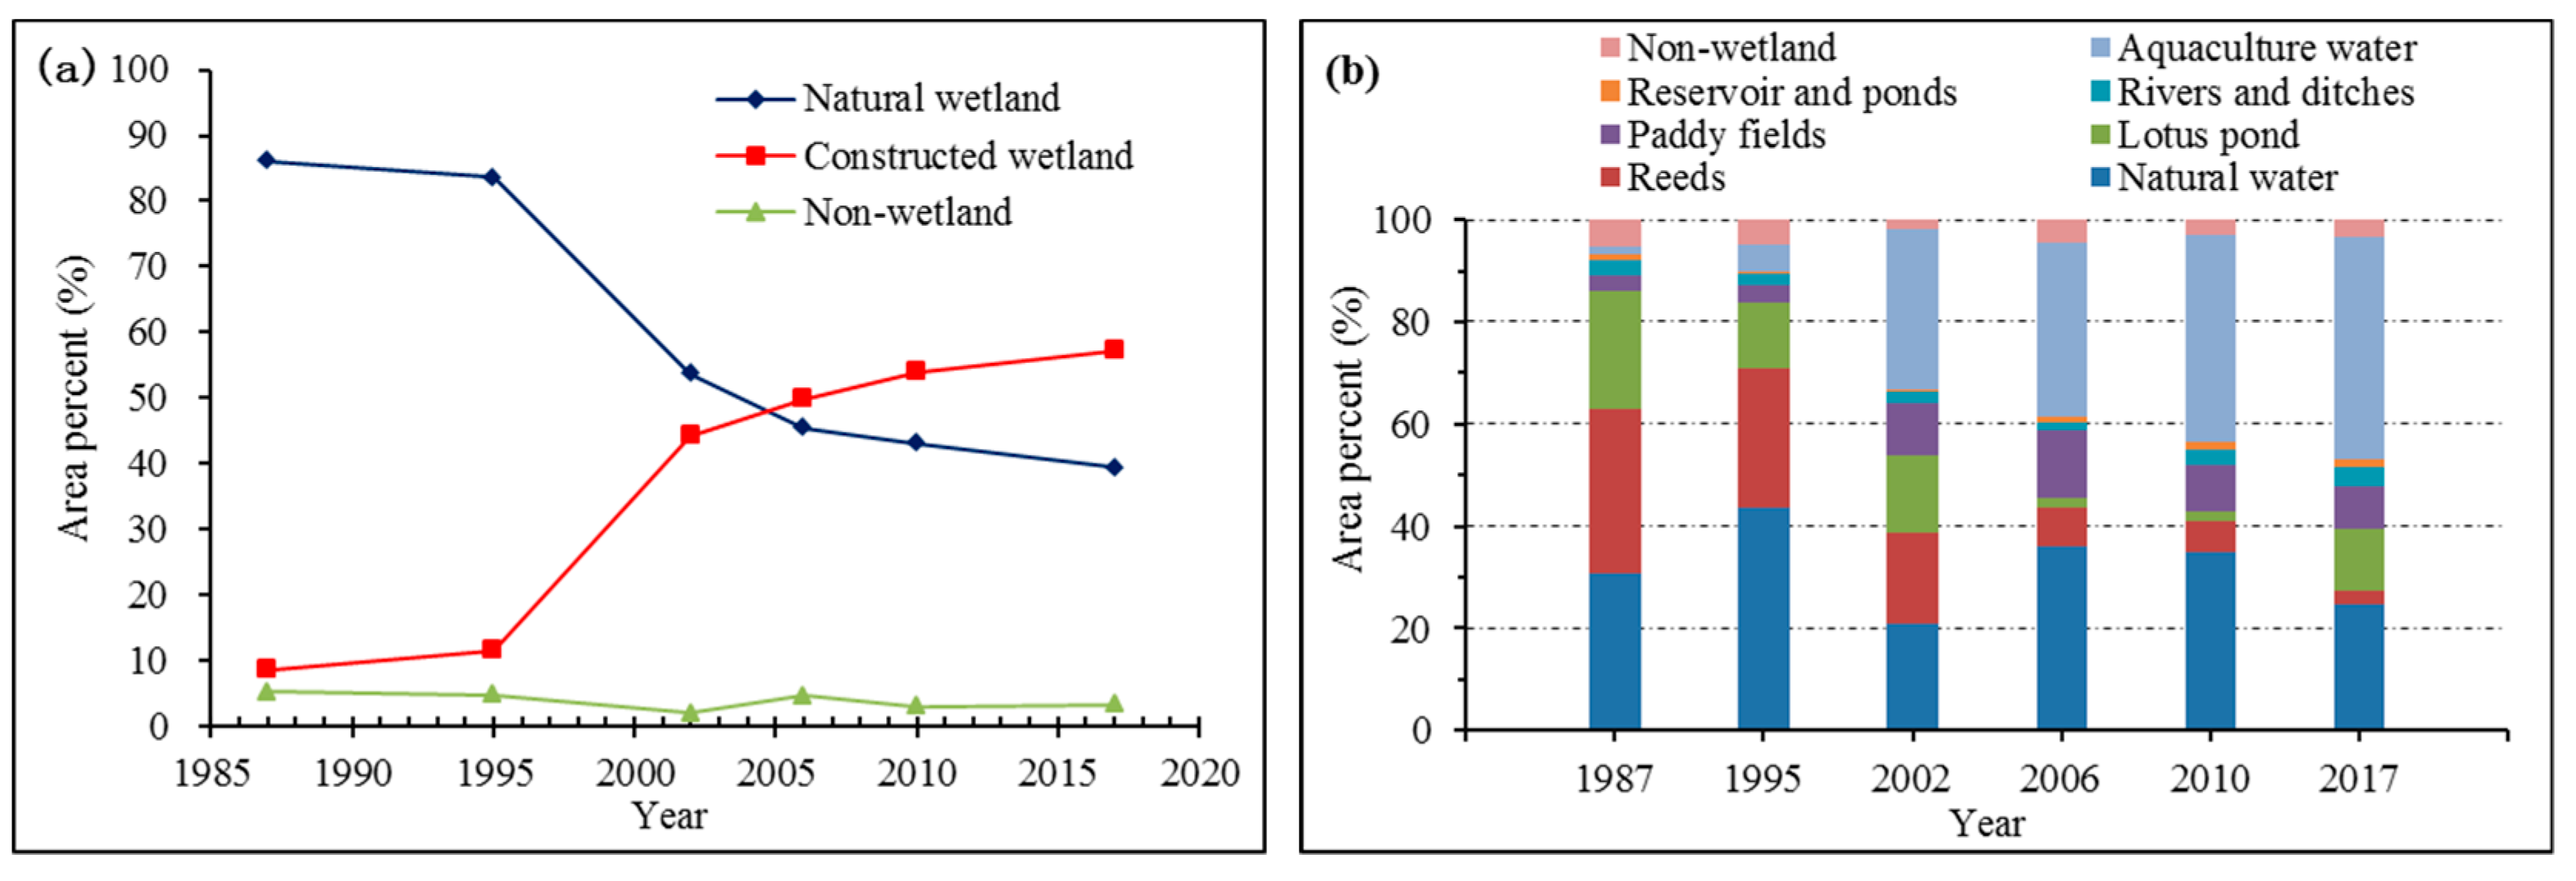
The area of different land use types and the area transfer matrix of them were calculated by ArcGIS 9.3 (Figure 3, Table 4) based on 6 stage current land use maps to analyze the LUCC of Nansi Lake wetland from 1987 to 2017, the results showed that: the area of natural wetland decreased year by year, and the area of constructed wetlands has continued to increase, especially in the 1990s, and the area of non-wetland has not changed significantly.
For natural wetland, the area of natural water fluctuated significantly from 1987 to 2017, and it was much lower than other years in 2002 for lack of rainfall. The area of reeds in Nansi Lake wetland decreased from 1987 to 2017, the cover fell from 32.38% to 2.83%, and the area decreased by nearly 91.3%. There were 232.2 km2 reeds changed to aquaculture water and 62.64 km2 to paddy fields, which accounted for 61.86% and 16.69% of the total reeds area respectively. The area of lotus ponds in Nansi Lake wetland decreased from 1987 to 2006, the cover fell from 23.08% to 1.94%, the area of lotus pond decreased nearly 91.57%, though there was a slight increase from 2006 to 2017. Furthermore, 144.05 km2 (52.33%) lotus ponds were changed to aquaculture water and 38.76 km2 (14.08%) of them changed to natural water.
For constructed wetland, the area of paddy fields in Nansi Lake wetland increased from 1987 to 2002 and decreased slightly from 2002 to 2017. The increased paddy fields were mainly changed by reeds (62.64 km2), and there were some paddy fields changed into aquaculture water (13.02 km2). The area of aquaculture water enlarged year by year from 1987 to 2017 and the area increased to 521.28 km2, which was 27 times the area in 1987 (19.23 km2). Most of aquaculture water was changed by reeds (232.20 km2), lotus ponds (144.05 km2) and natural lake water (79.40 km2). The increased area of rivers and ditches were mostly changed by reeds, probably due to the decrease of reed area—the rivers and ditches which were covered by reeds in the past can be classified more accurately. The area of the ponds and non-wetland was almost the same.
The results of landscape metrics (Table 5) calculated using Fragststs software from 1987 to 2017 showed that: the ever-increasing of patch number (NP) from 483 to 783 meant the ever-increasing spatial heterogeneity and fragmentation of Nansi Lake wetland landscape in the condition of perpetual researched area. The PD of Nansi Lake wetland increasing from 0.40/km2 to 0.65/km2 also can indicate the increased degree of fragmentation and heterogeneity of wetland. LSI reflects the complexity of patch shape in the landscape, the larger the LSI is, the more irregular the patch shows. The value of LSI in Nansi Lake wetland increasing from 11.19 to 14.33 showed that the landscape patches tended to be more irregular and broken. CONTAG is the index to describe the aggregation extent of different landscape types of value from 0 to 100, the less the values are, the more dispersed the landscape type shows. The value of CONTAG had been decreased from 50.81 to 43.63 indicating that the patch fragmentation increased and the connectivity decreased in Nansi Lake wetland. The value of SHDI had been increased from 1.48 to 1.64 and the value of SHEI had almost no change, which indicated that the land use types and landscape heterogeneity of Nansi Lake increased, but the dominant landscape type was not significant.
3.2. The ESV in Nansi Lake Wetland
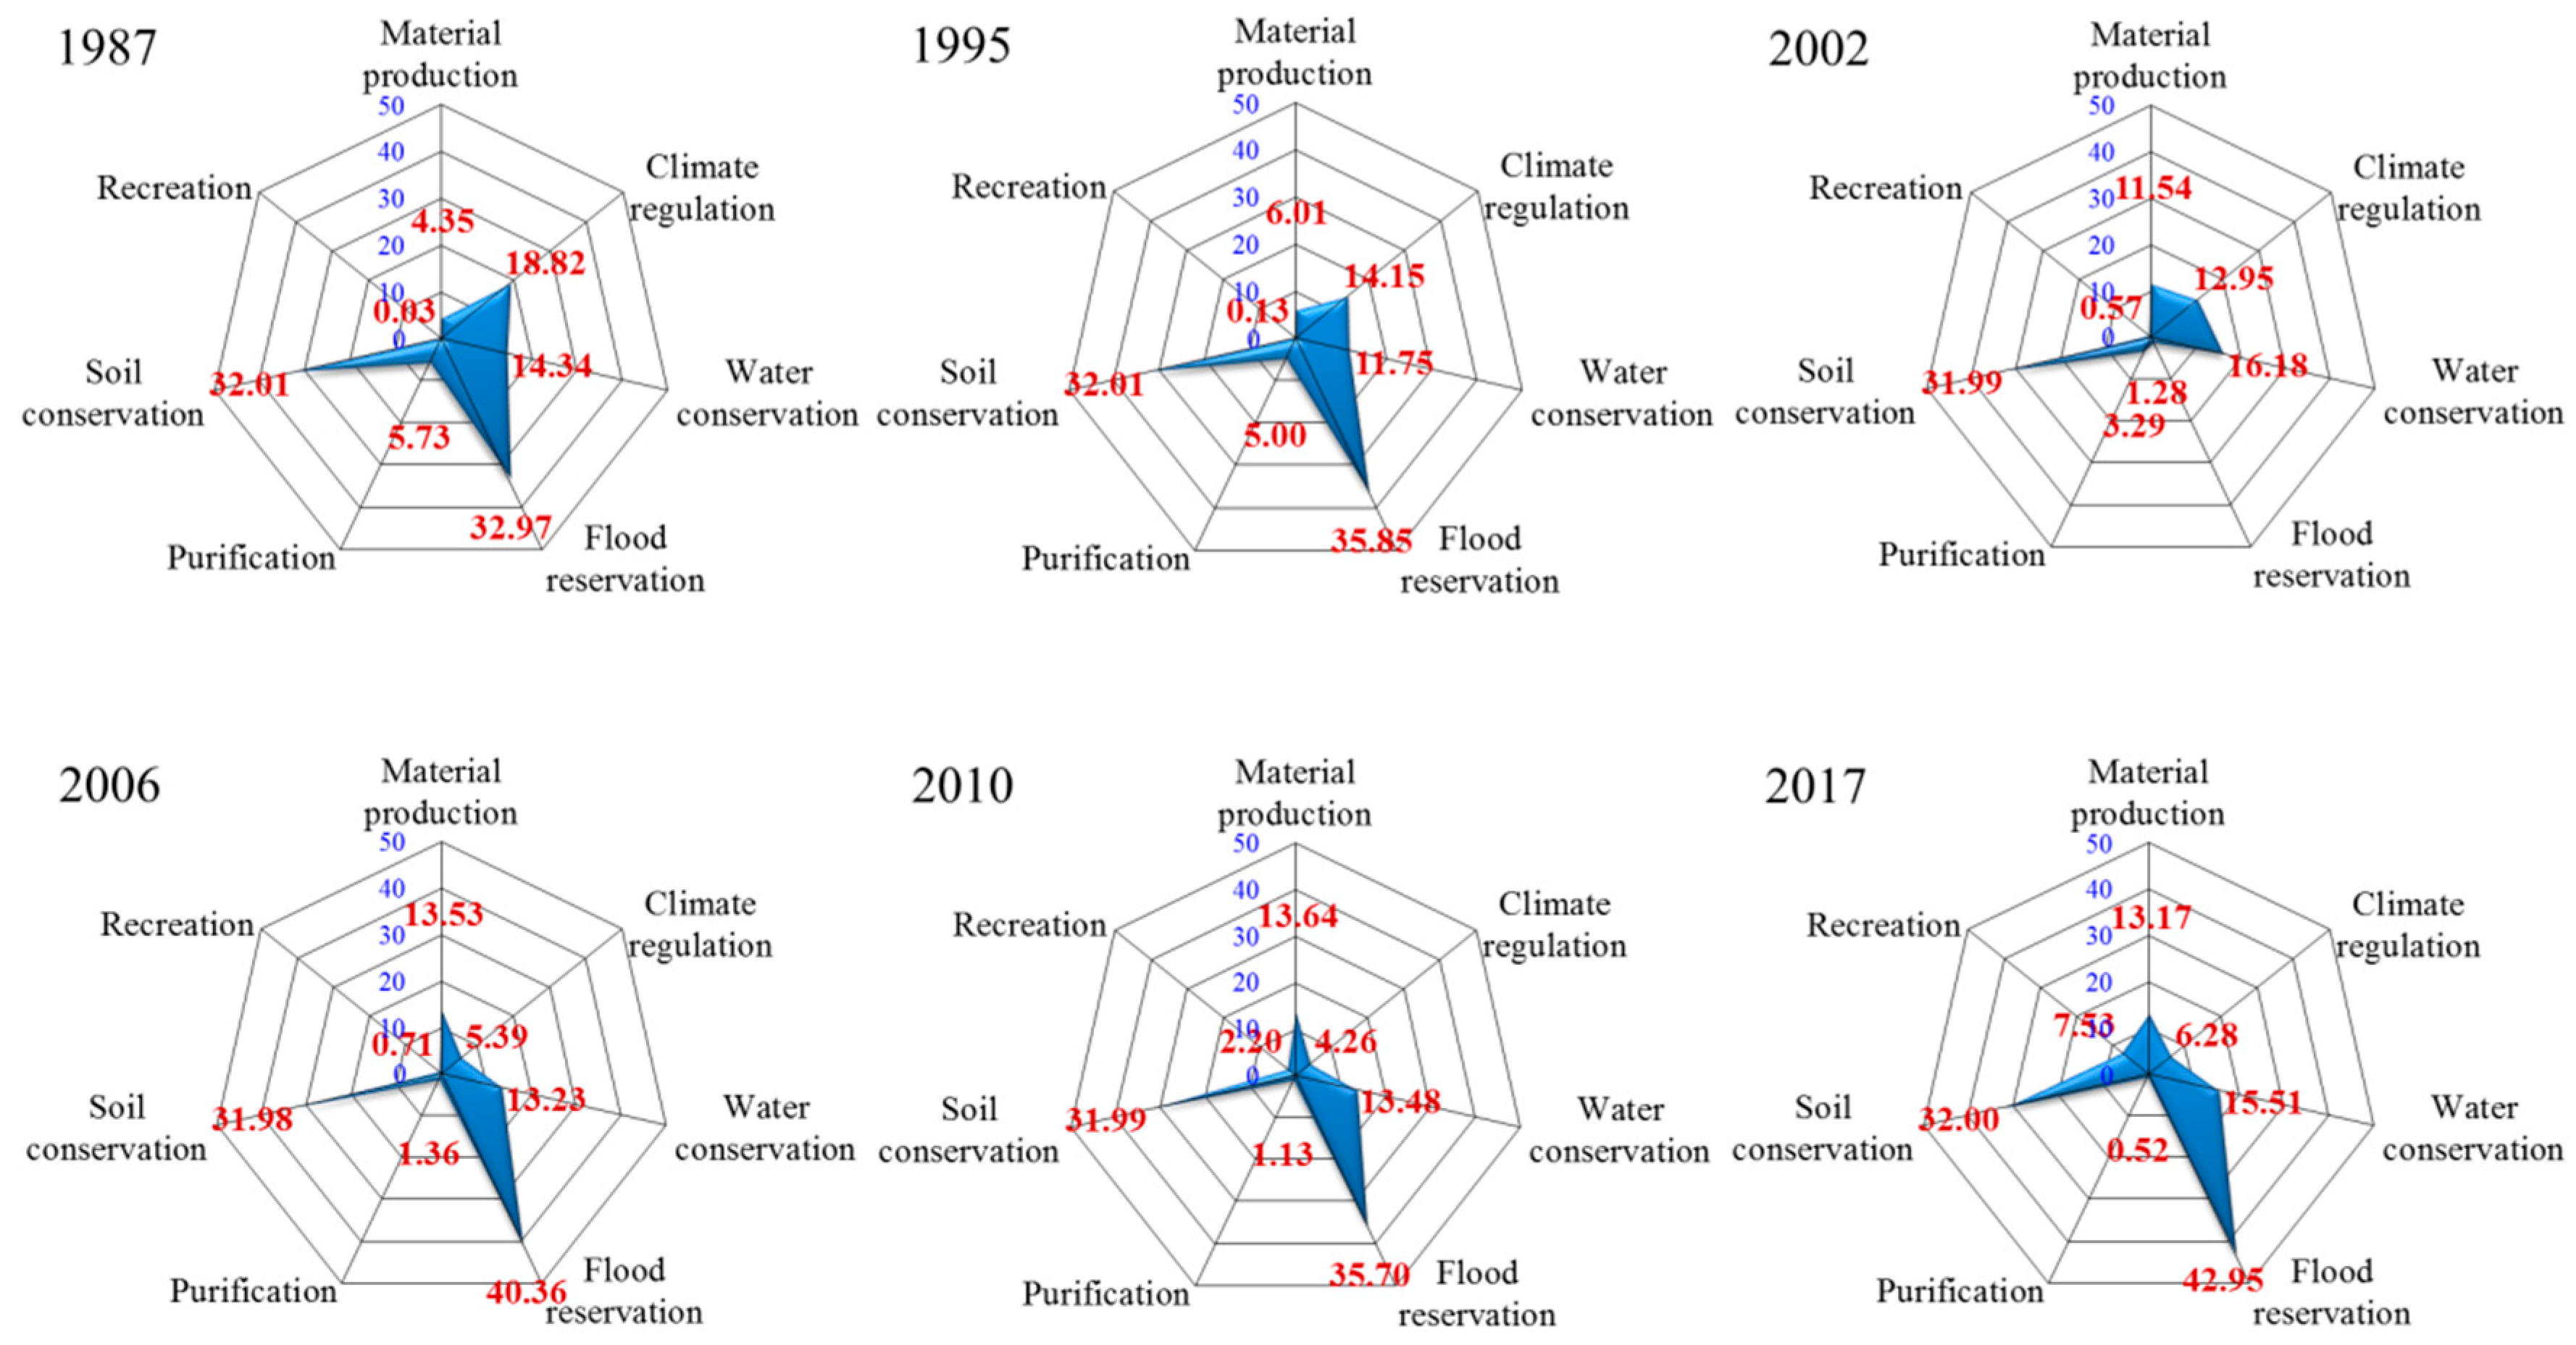
Based on the classification of ES in Nansi Lake wetland, referring to the international and Chinese valuation criteria and the global ESV proposed by experts, the unit values of each ES and total ESV from 1987 to 2017 were calculated (Table 6) by a series of methods (details in method section) such as market value approach, industrial oxygen/carbon tax method, afforestation cost method and shadow engineering method. The annual values of each ES from 1987 to 2017 were shown in Figure 4.
As shown in Table 6 and Figure 4, the ESV in Nansi Lake wetland fluctuated from 1987 to 2017, reached the minimum in 2002 and the maximum in 2017, which were $1.0825 billion, $1.0490 billion, $0.7780 billion, $1.0656 billion, $1.0240 billion and $1.1796 billion respectively. Analyzing annual values of each ES, the ESV of provisioning services tends to increase in the past 30 years, the value of material production increased from $43.5 million to $131.7 million, by 300%. For regulating services, the value of climate regulation decreased gradually from 1987 to 2010, which fell from $188.2 million to $42.6 million, and there was a slight increase from 2006 to 2017; The value of flood reservation decreased sharply in 2002, which was only $1.28 million; The value of purification continued to decline and almost disappeared, the ESV decreased from $57.3 billion to $5.2 billion, dropped by nearly 11 times. For supporting services and cultural services, the value of soil conservation was slightly fluctuated or remained unchanged, the value of recreation increased from $0.3 million to $75.3 million, increased by 251 times—tourism has become one of the main economic sources in Nansi Lake basin.
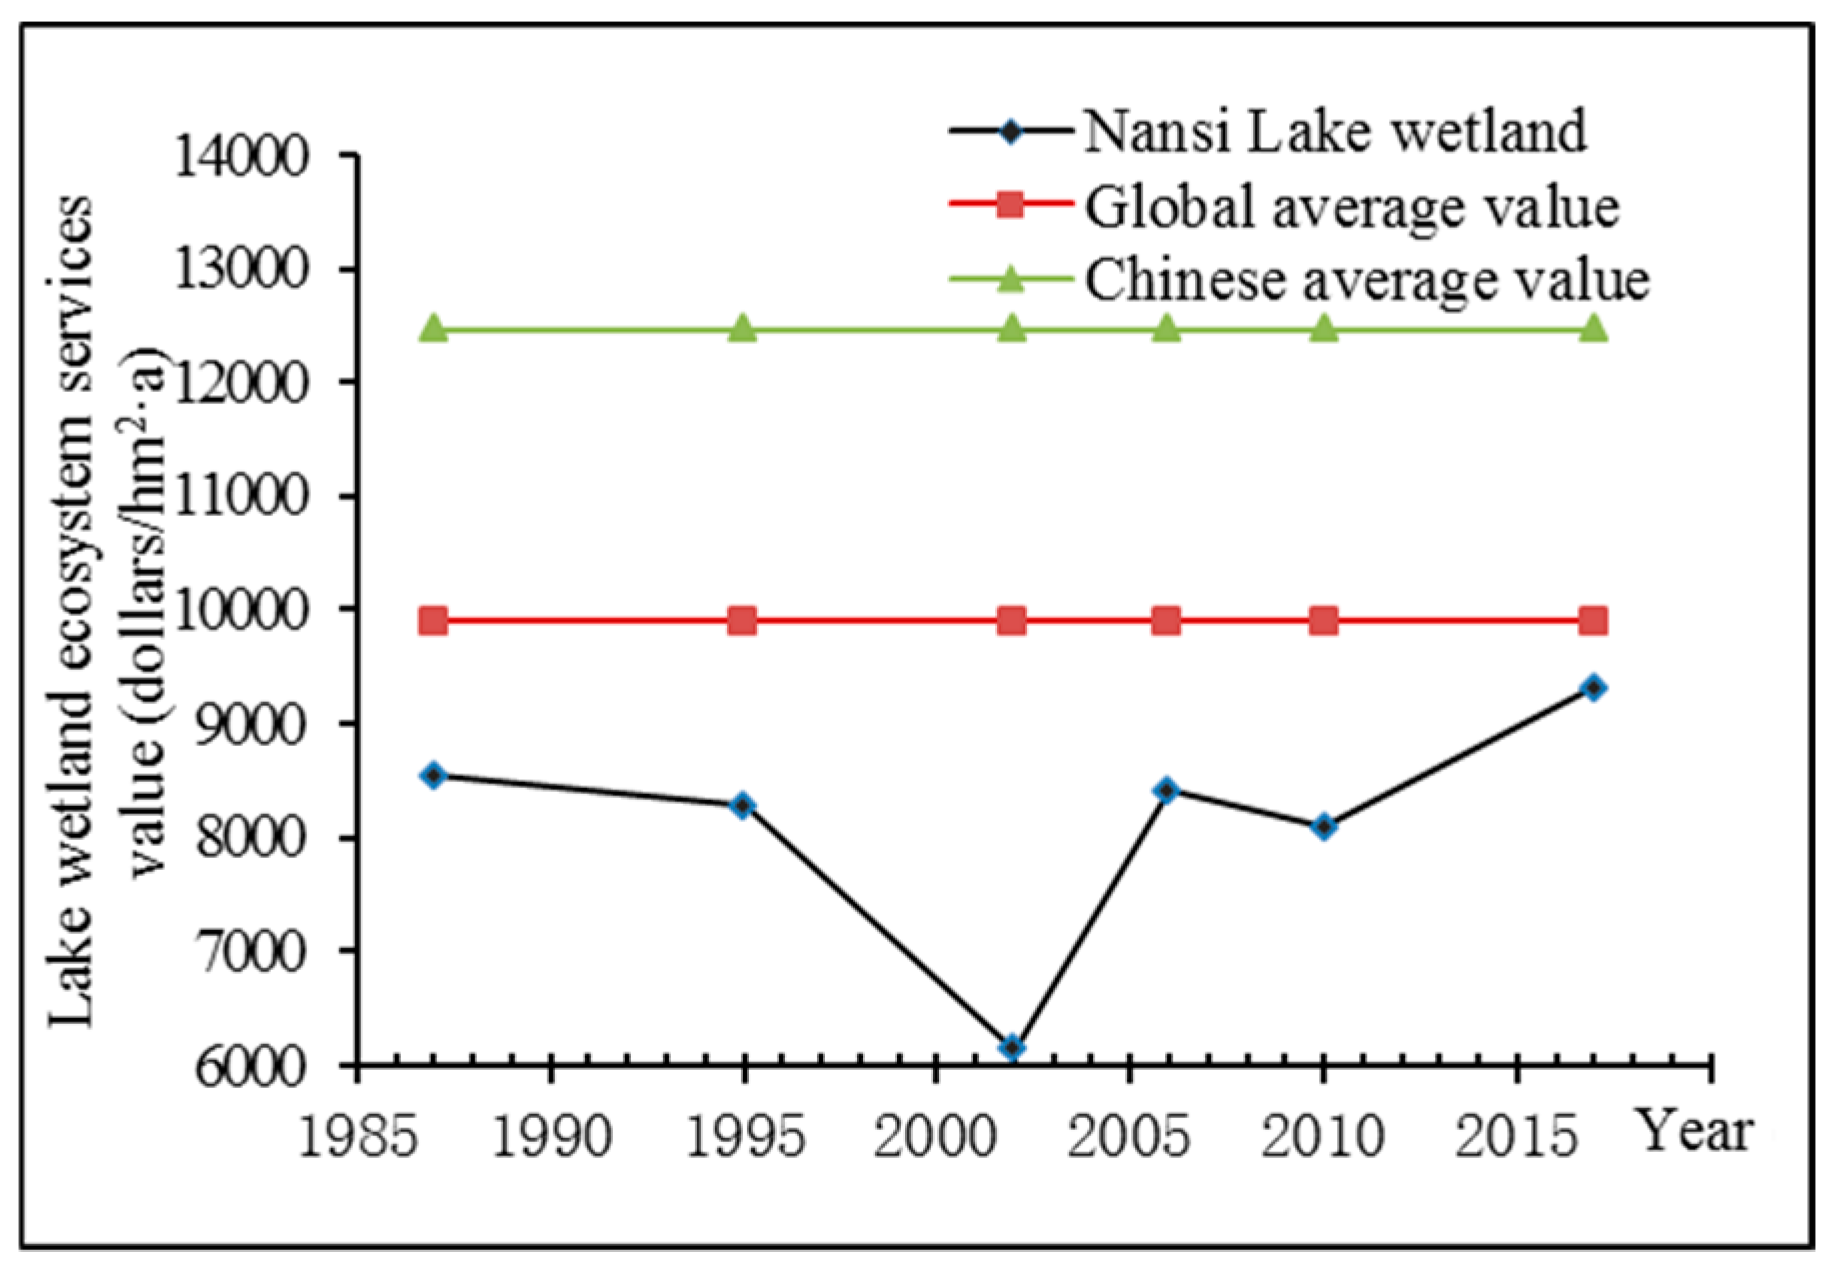
The average annual ESV estimated from 1987 to 2017 of Nansi Lake wetland was $1.0298 billion ($8134/hm2), which was more than one fifth of the GDP ($4.832 billion) of Weishan County in 2012. The annual ESV was $8551/hm2, $8286/hm2, $6145/hm2, $8417/hm2, $8088/hm2 and $9318/hm2 respectively, which was uneven due to a series of natural social factors. As shown in Figure 5, the annual ESV in the past 30 years was much lower than the global lake wetland average value ($9900/hm2) calculated by Costanza [47] and the average ESV of China’s wetlands ($12457/hm2) obtained by scholars [57,60,61], especially in 2002, the average annual ESV of Nansi Lake wetland was only half of the average ESV of China’s wetlands.
4. Discussion
4.1. Factors Driving LUCC and Landscape Pattern Change
The results showed that the land use of Nansi Lake wetland changed significantly from 1987 to 2017 (Figure 3), mainly due to the reduction of natural water, reed, lotus ponds and the increase of paddy fields and aquaculture area. The changes of landscape metrics (Table 5) showed that the overall landscape fragmentation and heterogeneity of Nansi Lake wetland increased, the shape was more complex, the landscape connectivity and diversity were lower, and the ability to resist external disturbances and maintain self-stability reduced. Nansi Lake wetland is a typical lake wetland composed of natural wetland and constructed wetland with specific climatic conditions and biodiversity, aquaculture and tourism services are the main sources of income for local residents. Compared with most natural lake wetlands, the land use, landscape and ecosystem services of Nansi Lake wetland have much stronger socio-economic attributes. Climate change and human activities are the most important factors driving the dramatic change in land use and landscape patterns of Nansi Lake wetland through the comprehensive analysis of the landscape, hydrology and meteorology evolution characteristics during the past three decades.
Climate change directly or indirectly affects the LUCC and landscape pattern change of Nansi Lake wetland. Nansi Lake is located in the warm temperate monsoon climate zone, the annual precipitation is uneven and seasonal, and it is prone to drought and flood disasters [42]. In the past 30 years, the severe drought period occurred from 1999 to 2002, especially in 2002, the large-scale dryness of Nansi Lake directly led to the rapid reduction of natural water and reeds. In addition, the landscape metrics of Nansi Lake wetland changed suddenly in 2002 (Table 5), the landscape fragmentation, heterogeneity and shape irregularity increased significantly. After that, with the increase of precipitation, the natural water area of Nansi Lake gradually recovered, and the change of landscape metrics became stable. In addition, with global warming, the annual average temperature of the Nansi Lake shows a significant upward trend (0.24 °C/year) [44], and the evaporation increases, which is also one of the factors leading to LUCC and landscape pattern change in Nansi Lake.
Human activities have the most significant impact on the LUCC and landscape pattern change in Nansi Lake wetland. First is the construction of water conservancy projects, the Second-Dam and the east route of the South-to-North Water Transfer Project have a great impact on the changes of the natural water in Nansi Lake, it is also one of the main reasons for the increase of the rivers and ditches in the past 10 years. Second is the establishment of nature reserves, which plays an important role in the protection of natural resources (e.g., natural water, reeds and lotus ponds) and the maintenance of ecosystem in Nansi Lake wetland. However, human economic activities have the biggest impact on the Nansi Lake wetland. The rapid development of agriculture and aquaculture in the past 20 years has prompted local residents to “reclaim land and ponds from lakes”, leading to the conversion of natural wetlands to constructed wetlands and the rapid increase of paddy fields and aquaculture area. On the other hand, the development of tourism has caused serious disturbances to Nansi Lake wetland ecosystem, the area of reeds has been sharply reduced in the past 30 years coupled with the excessive use of local residents. In addition, the development of the tourist attractions (Honghe Wetland, Qiandao Wetland) and the large-scale planting of the lotus have led to an increase of the lotus pond in recent years.
4.2. Impact of Landscape Change on the ESV
According to the results and evolution characteristics of LUCC, landscape pattern change and ESV in Nansi Lake wetland from 1987 to 2017 (Table 4, Table 5 and Table 6), land use change driven by human production and economic development is the fundamental reason for the change of wetland landscape pattern and ESV. The correlation between different land use types and each ES were as follows.
The provisioning services provided by Nansi Lake wetland mainly include food production (e.g., fish, paddy and lotus), raw materials production (reed), oxygen production and water supply. Compared with 1987, the aquaculture area increased to 502 km2 in 2017, the area of paddy fields increased by 63.26 km2 which were at the expense of 341.58 km2 reed and 131.84 km2 lotus ponds. The value of the provisioning services increased from $43.5 million to $131.7 million due to the translation of the land use type. Landscape types of natural water, reed, lotus ponds, paddy fields and aquaculture area are typically positively correlated with provisioning services.
The regulating services of Nansi Lake wetland mainly include regional climate regulation from the CO2 stored by photosynthesis of phytoplankton and aquatic plants (reeds and lotus) in the natural wetland and the paddy in the constructed wetland, the CH4 released by aquatic plants and the carbon gas emitted by aquaculture area, the flood reservation of natural water, reeds, rivers and ditches, reservoirs and ponds, the purification of reeds and lotus, and the water conservation of natural water. Due to the landscape change of natural water, aquaculture area, reeds, lotus ponds and paddy fields, the values of climate regulation decreased by $188.2 million and purification reduced by $62.8 million.
Nansi Lake wetland provided the supporting services and cultural services including soil conservation and recreation. Due to calculation methods and the limitations of data acquisition, the value of soil conservation changed slightly over the past 30 years. However, significantly different from other lakes is the development of tourism in Nansi Lake wetland. In recent years, the increase of recreation service value would inevitably lead to the destruction of the ecological environment, such as the reduction of natural wetlands and the increase of constructed wetlands. Similarly, the natural wetlands (natural water, reeds, lotus ponds) are the material basis for the development of tourism—the destruction of natural wetlands would also lead to a decrease in the value of recreation service.
4.3. Implications for Wetland Protection and Management
In this study, the results showed that climate change and human socio-economic activities have strongly changed the land use types and landscape structure of Nansi Lake wetland, and thus affected the ESV. In most developed countries and developing countries like China, economic development has led to major wetland loss and degradation, water shortage, habitat destruction and species extinction, which has an irreversible effect on regional ecosystem destruction and global warming. Wetland protection, management and restoration has become one of the key global issues to be solved.
Firstly, wetland protection laws and policies must be improved. Wetlands have played an important role in influencing government and international policy during the past 50 years [10]. The Ramsar Convention has been highly adaptive since its original adoption in 1971, and moved its origins in the bird conservation lobby to a much broader remit linked to the wider benefits of wetland conservation and management to people [10]. Currently, 170 countries worldwide have become member states of Ramsar Convention, 2341 sites covering 252.5 million hm2 wetlands are protected, accounting for about 49% of the total global wetland area (https://www.ramsar.org). In terms of laws and policies, the United States Federal Law, Canadian and European policies were given particular emphasis on wetlands. In China, the government promulgated the “Wetland Protection Management Regulations” and the “Wetland Protection and Restoration System Program” in 2013 and 2016 to strengthen the management of wetland protection and fulfill the Ramsar Convention [62]. However, there is still a shortage of wetland special laws and policies in many countries, especially those 31 non-member developing countries in Asia and Africa. The promulgation and implementation of wetland laws and policies is imminent, including wetland use control, ecological compensation system, environment evaluation and water consumption system, as well as degraded wetland restoration system.
Secondly, it is necessary to accelerate wetland monitoring, assessment and database construction. At present, the global typical wetland databases mainly include the database of Ramsar sites and Global Lakes and Wetlands Database (GLWD), which hold basic information on the wetland types, ecology, boundaries and land use of 2341 important sites (https://www.ramsar.org). However, the detailed dynamic monitoring information of most wetlands is missing, and the construction of wetland databases in most countries and regions is lagging behind. The protection and management of global wetlands need to accelerate the dynamic monitoring and assessment of wetlands to build a complete database, mainly including wetland resources survey, evaluation and database construction based on computer and 3S technology, wetland degradation monitoring and early warning platform, as well as the big data and smart data monitoring infrastructure for wetland pollution control and restoration, wetland landscape and climate change, biodiversity and water resources security.
Thirdly, it is necessary to adjust wetland regional social-economic development strategies. The exploitation and utilization of wetlands and the public support have a profound impact on wetlands protection and sustainable development, mainly in those wetlands like Nansi Lake that are seriously disturbed by human activities. The local government should explore and adjust the industrial structure to reduce the dependence on wetland resources, rationally develop and utilize wetland natural resources, and strictly control the disorderly development of aquaculture and tourism to reduce the damage caused by excessive development of natural wetlands. Besides, the local government should focus on the restoration and comprehensive remediation of degraded wetlands with serious fragmentation and pollution, and adopt measures such as returning farmland to lakes to ensure the area of natural wetlands, as well as the ecosystem functions and values. Meanwhile, the government should strengthen the propaganda and education of wetland protection, encourage public participation and improve local residents’ awareness of wetland protection.
In addition, as mentioned above, the LUCC, landscape pattern change of Nansi Lake wetland was analyzed by using RS and GIS technologies. Remote sensing techniques provide opportunities for environmental monitoring, surveying and land change detection, combined with GIS, which is the most economically feasible way to gather regular land cover information compared with traditional ground surveying and mapping methods [35,63]. The study shows that digital analysis of Landsat imagery is a useful and inexpensive way to classify the land use types for wetlands with significant geophysical characteristics. However, detailed LUCC analyses using sensors with higher resolution are necessary because of their better accuracy. On the other hand, the specific monetized valuation methods such as market value method, replacement cost method and travel cost method were used to estimate the value of each ES based on the land use change of Nansi Lake wetland. Compared with contingent valuation method (CVM) and meta-analytical regression model [29,30], the study avoids the debate over the reliability of CVM and the overall suitability of passive use values in economic policy analysis [64], as well as the limitations in data quality and quantity of primary valuation studies of meta-analytical regression model [30]. Inevitably, there are also some limitations in this study, the ESV of Nansi Lake wetland has been underestimated due to the lack of ample data and efficient methods. The resolution of remote sensing images, interpretation accuracy and seasonal variation of wetlands will also affect the accuracy of research results.
5. Conclusions
As the largest freshwater lake in northern China and one of the key storage hubs in east line of South-North Water Diversion Project, Nansi Lake plays an important role in the maintenance of ecological balance and regional economic development. In this paper, based on the combined use of remote sensing and a comprehensive analysis of various classifications of Nansi Lake wetland, the LUCC and landscape pattern change were analyzed, and various valuation methods were adopted to effectively obtain the relative values of different ES in the past three decades. The study provided a more specific method and framework for wetland research based on multi-source remote sensing data, discussed the driving factors of LUCC and landscape pattern change, the impacts of landscape change on the ESV, and proposed three implications from the perspective of global wetland protection and management, which can be more instructive and efficient for wetland conservation, protection or restoration in Nansi Lake wetland, as well as other lakes and wetlands in China and other countries.
As a typical wetland with a complex natural-economic-social ecosystem, the assessment in this study would lead people and governments to realize the importance of wetlands. Nowadays, the Nansi Lake wetland eco-environment degradation is under control but has not been fundamentally improved. Some measures such as the management of water resources, the optimization of industrial structure and the perfection of the system, policy and market mechanism should be taken to restore the ecosystem structure and function to ensure the stability and improvement of ecological services in Nansi Lake wetland, and provide more benefits for humans. Moreover, the results in this study further explained the hazards of wetland degradation and the urgency of conservation, although there are some limitations in the calculation of the average value of some services due to the difficulty of price conversion. Further studies are needed to fully evaluate the values of ES, as well as the influencing factors and management measures.
Supplementary Materials
The following are available online at https://www.mdpi.com/2073-4441/11/8/1597/s1, Table S1: The land use types, landscape image features and interpretation marks of Nansi Lake wetland, Table S2: Assessment of remote sensing image classification accuracy (%). Prod. Acc. = Producer Accuracy, User Acc. = User Accuracy.
Author Contributions
Conceptualization, L.M. and J.D.; methodology, L.M.; formal analysis, L.M.; investigation, L.M.; resources, L.M.; data curation, L.M.; writing—original draft preparation, L.M.; writing—review and editing, L.M.; visualization, L.M.; supervision, J.D.; project administration, J.D.; funding acquisition, L.M. and J.D.
Funding
This research was funded by the Fundamental Research Funds for the Central Universities (No. 2018BSCXC26) and the Postgraduate Research & Practice Innovation Program of Jiangsu Province (No. KYCX18_1953).
Conflicts of Interest
The authors declare no conflict of interest.
References
- Assessment, M.E. Millennium Ecosystem Assessment: Ecosystems and Human Well-Being: Wetlands and Water Synthesis; Island Press: Washington, DC, USA, 2005. [Google Scholar]
- Li, T.; Gao, X. Ecosystem Services Valuation of Lakeside Wetland Park beside Chaohu Lake in China. Water 2016, 8, 301. [Google Scholar] [CrossRef]
- Odgaard, M.V.; Turner, K.G.; Bocher, P.K.; Svenning, J.C.; Dalgaard, T. A multi-criteria, ecosystem-service value method used to assess catchment suitability for potential wetland reconstruction in Denmark. Ecol. Indic. 2017, 77, 151–165. [Google Scholar] [CrossRef]
- Zhang, D.Q.; Gersberg, R.M.; Tansoon, K. Constructed wetlands in China. Ecol. Eng. 2009, 35, 1367–1378. [Google Scholar] [CrossRef]
- Yu, K.; Hu, C.M. Changes in vegetative coverage of the Hongze Lake national wetland nature reserve: A decade-long assessment using MODIS medium-resolution data. J. Appl. Remote Sens. 2013, 7, 3589. [Google Scholar] [CrossRef]
- McInnes, R.J.; Everard, M. Rapid Assessment of Wetland Ecosystem Services (RAWES): An example from Colombo, Sri Lanka. Ecosyst. Serv. 2017, 25, 89–105. [Google Scholar] [CrossRef]
- Leon, A.S.; Tang, Y.; Chen, D.; Yolcu, A.; Glennie, C.; Pennings, S.C. Dynamic Management of Water Storage for Flood Control in a Wetland System: A Case Study in Texas. Water 2018, 10, 325. [Google Scholar] [CrossRef]
- Maltby, E.; Acreman, M.C. Ecosystem services of wetlands: Pathfinder for a new paradigm. Hydrol. Sci. J. 2011, 56, 1341–1359. [Google Scholar] [CrossRef]
- Russi, D.; Ten Brink, P.; Farmer, A.; Badura, T.; Coates, D.; Förster, J.; Kumar, R.; Davidson, N. The Economics of Ecosystems and Biodiversity for Water and Wetlands; IEEP: London, UK; Brussels, Belgium, 2013. [Google Scholar]
- Vitousek, P.M.; Mooney, H.A.; Lubchenco, J.; Melillo, J.M. Human Domination of Earth’s Ecosystems. In Urban Ecology: An International Perspective on the Interaction Between Humans and Nature; Marzluff, J.M., Shulenberger, E., Endlicher, W., Alberti, M., Bradley, G., Ryan, C., Simon, U., ZumBrunnen, C., Eds.; Springer US: Boston, MA, USA, 2008; pp. 3–13. [Google Scholar] [CrossRef]
- Bennett, E.M.; Peterson, G.D.; Levitt, E.A. Looking to the future of ecosystem services. Ecosystems 2005, 8, 125–132. [Google Scholar] [CrossRef]
- Imteaz, M.; Uddameri, V.; Ahsan, A. Numerical model for the transport and degradation of pollutants through wetlands. Int. J. Water 2016, 10, 1–12. [Google Scholar] [CrossRef]
- Jiang, W. Ecosystem services research in China: A critical review. Ecosyst. Serv. 2017, 26, 10–16. [Google Scholar] [CrossRef]
- Gong, N.; Niu, Z.; Wei, Q.; Zhang, H. Driving forces of wetland change in China. J. Remote Sens. 2016, 20, 172–183. [Google Scholar]
- Ignar, S.; Grygoruk, M. Wetlands and Water Framework Directive: Protection, Management and Climate Change. In Wetlands and Water Framework Directive: Protection, Management and Climate Change; Ignar, S., Grygoruk, M., Eds.; Springer International Publishing: Cham, Switzerland, 2015; pp. 1–7. [Google Scholar] [CrossRef] [Green Version]
- Kaczorowska, A.; Kain, J.-H.; Kronenberg, J.; Haase, D. Ecosystem services in urban land use planning: Integration challenges in complex urban settings—Case of Stockholm. Ecosyst. Serv. 2016, 22, 204–212. [Google Scholar] [CrossRef]
- Westman, W.E. How Much Are Nature’s Services Worth? Science 1977, 197, 960–964. [Google Scholar] [CrossRef] [PubMed]
- Heal, G. Valuing ecosystem services. Ecosystems 2000, 3, 24–30. [Google Scholar] [CrossRef]
- Schroter, D.; Cramer, W.; Leemans, R.; Prentice, I.C.; Araujo, M.B.; Arnell, N.W.; Bondeau, A.; Bugmann, H.; Carter, T.R.; Gracia, C.A.; et al. Ecosystem service supply and vulnerability to global change in Europe. Science 2005, 310, 1333–1337. [Google Scholar] [CrossRef] [PubMed]
- Balvanera, P.; Pfisterer, A.B.; Buchmann, N.; He, J.S.; Nakashizuka, T.; Raffaelli, D.; Schmid, B. Quantifying the evidence for biodiversity effects on ecosystem functioning and services. Ecol. Lett. 2006, 9, 1146–1156. [Google Scholar] [CrossRef] [Green Version]
- Tallis, H.; Taylor, H.R. Natural Capital: Theory and Practice of Mapping Ecosystem Services; Francis, R., Peter, M.K., Heather, T., Taylor, H.R., Gretchen, D., Stephen, P., Eds.; Oxford University Press: Oxford, UK, 2011; Volume 35, pp. 365, 701–704. ISBN 9780199588992. [Google Scholar]
- Sherrouse, B.C.; Clement, J.M.; Semmens, D.J. A GIS application for assessing, mapping, and quantifying the social values of ecosystem services. Appl. Geogr. 2011, 31, 748–760. [Google Scholar] [CrossRef]
- Villa, F.; Ceroni, M.; Bagstad, K.; Johnson, G.; Krivov, S. In ARIES (Artificial Intelligence for Ecosystem Services): A new tool for ecosystem services assessment, planning, and valuation. In Proceedings of the 11th International BioECON Conference on Economic Instruments to Enhance the Conservation and Sustainable Use of Biodiversity, Venice, Italy, 21 September 2009. [Google Scholar]
- Austin, Z.; McVittie, A.; McCracken, D.; Moxey, A.; Moran, D.; White, P.C.L. The co-benefits of biodiversity conservation programmes on wider ecosystem services. Ecosyst. Serv. 2016, 20, 37–43. [Google Scholar] [CrossRef] [Green Version]
- Firbank, L.; Bradbury, R.B.; McCracken, D.I.; Stoate, C. Delivering multiple ecosystem services from Enclosed Farmland in the UK. Agric. Ecosyst. Environ. 2013, 166, 65–75. [Google Scholar] [CrossRef]
- Meng, L.; Huang, J.; Dong, J. Assessment of rural ecosystem health and type classification in Jiangsu province, China. Sci. Total Environ. 2018, 615, 1218–1228. [Google Scholar] [CrossRef]
- Vymazal, J. Enhancing ecosystem services on the landscape with created, constructed and restored wetlands. Ecol. Eng. 2011, 37, 1–5. [Google Scholar] [CrossRef]
- Asah, S.; Blahna, D.; Ryan, C. Involving Forest Communities in Identifying and Constructing Ecosystem Services: Millennium Assessment and Place Specificity. J. For. 2012, 110, 149–156. [Google Scholar] [CrossRef]
- Venkatachalam, L. The contingent valuation method: A review. Environmental Impact Assessment Review 2004, 24, 89–124. [Google Scholar] [CrossRef]
- Camacho-Valdez, V.; Ruiz-Luna, A.; Ghermandi, A.; Berlanga-Robles, A.; Nunes, P. Effects of land use changes on the ecosystem service values of coastal wetlands. Environ. Manag. 2014, 54, 852–864. [Google Scholar] [CrossRef] [PubMed]
- Evenson, G.R.; Golden, H.E.; Lane, C.R.; McLaughlin, D.L.; D’Amico, E. Depressional wetlands affect watershed hydrological, biogeochemical, and ecological functions. Ecol. Appl. 2018, 28, 953–966. [Google Scholar] [CrossRef] [PubMed]
- Steen, V.A.; Skagen, S.K.; Melcher, C.P. Implications of Climate Change for Wetland-Dependent Birds in the Prairie Pothole Region. Wetlands 2016, 36, S445–S459. [Google Scholar] [CrossRef]
- Xiao, Y.; Huang, Z.; Lu, X. Changes of soil labile organic carbon fractions and their relation to soil microbial characteristics in four typical wetlands of Sanjiang Plain, Northeast China. Ecol. Eng. 2015, 82, 381–389. [Google Scholar] [CrossRef]
- Uuemaa, E.; Palliser, C.C.; Hughes, A.O.; Tanner, C.C. Effectiveness of a Natural Headwater Wetland for Reducing Agricultural Nitrogen Loads. Water 2018, 10, 287. [Google Scholar] [CrossRef]
- Muster, S.; Heim, B.; Abnizova, A.; Boike, J. Water Body Distributions Across Scales: A Remote Sensing Based Comparison of Three Arctic Tundra Wetlands. Remote Sens. 2013, 5, 1498–1523. [Google Scholar] [CrossRef] [Green Version]
- Ning, J.C.; Gao, Z.Q.; Xu, F.X. Effects of land cover change on evapotranspiration in the Yellow River Delta analyzed with the SEBAL model. J. Appl. Remote Sens. 2017, 11, 016009. [Google Scholar] [CrossRef] [Green Version]
- Liu, G.; Zhang, L.; Zhang, Q.; Musyimi, Z.; Jiang, Q. Spatio–Temporal Dynamics of Wetland Landscape Patterns Based on Remote Sensing in Yellow River Delta, China. Wetlands 2014, 34, 787–801. [Google Scholar] [CrossRef]
- Töyrä, J.; Pietroniro, A. Towards operational monitoring of a northern wetland using geomatics-based techniques. Remote Sens. Environ. 2005, 97, 174–191. [Google Scholar] [CrossRef]
- Melese, D.; Suryabhagavan, K.V.; Gelet, M.; Balakrishnan, M. Remote sensing and geographic information system-based African civet habitat mapping in Andracha, Ethiopia. J. Appl. Remote Sens. 2014, 8, 12. [Google Scholar] [CrossRef]
- McInnes, R.J.; Simpson, M.; Lopez, B.; Hawkins, R.; Shore, R. Wetland Ecosystem Services and the Ramsar Convention: An Assessment of Needs. Wetlands 2017, 37, 123–134. [Google Scholar] [CrossRef]
- Ramsar, I.S. RIS for Site No. 2346, Shandong Jining Nansi Lake, China; Ramsar Sites Information Service: Ramsar, Iran, 2018. [Google Scholar]
- Yu, H.; Wang, Y.; Wang, S.; Wu, J.; Xia, H.; Pan, C.; Shi, X.; Chang, J.; Wei, Z.; Feng, Z. Natural Resources Investigation and Exploitation of Nansi Lake; Shangdong Science and Technology Press: Jinan, China, 1987. [Google Scholar]
- Fang, J.; Zhao, S.; Tang, Z. Basis of Wetland Biodiversity Conservation Ecology of the Middle Reaches of the Yangtze River; Higher Education Press: Beijing, China, 2006. [Google Scholar]
- Bureau, J.S. Jining Statistical Yearbook; China Statistics Press: Beijing, China, 2012. [Google Scholar]
- Frohn, R.; Chaudhary, N. Multi-scale Image Segmentation and Object-Oriented Processing for Land Cover Classification. Gisci. Remote Sens. 2008, 45, 377–391. [Google Scholar] [CrossRef]
- Fichera, C.R.; Modica, G.; Pollino, M. Land Cover classification and change-detection analysis using multi-temporal remote sensed imagery and landscape metrics. Eur. J. Remote Sens. 2012, 45, 1–18. [Google Scholar] [CrossRef]
- Costanza, R.; de Groot, R.; Sutton, P.; van der Ploeg, S.; Anderson, S.J.; Kubiszewski, I.; Farber, S.; Turner, R.K. Changes in the global value of ecosystem services. Glob. Environ. Chang. 2014, 26, 152–158. [Google Scholar] [CrossRef]
- Xu, J.; Dong, J. Response of Ecosystem in Service Value to Changes in Landscape Pattern of the Nansi Lake Wetland. J. Ecol. Rural Environ. 2013, 29, 471–477. [Google Scholar]
- Li, W. Evaluation on Ecosystem Service Function Value of Theory, Methods and Applications; China Renmin University Press: Beijing, China, 2008. [Google Scholar]
- Li, S.; Xie, G.; Yu, G.; Zhang, C.; Ge, L. Seasonal dynamics of gas regulation service in forest ecosystem. J. For. Res. 2010, 21, 99–103. [Google Scholar] [CrossRef]
- Plantinga, A.J.; Mauldin, T. A Method for Estimating the Cost of CO2 Mitigation through Afforestation. Clim. Chang. 2001, 49, 21–40. [Google Scholar] [CrossRef]
- Ricke, K.; Drouet, L.; Caldeira, K.; Tavoni, M. Country-level social cost of carbon. Nat. Clim. Chang. 2018, 8, 895–900. [Google Scholar] [CrossRef]
- Mitsch, W.J.; Gosselink, J.G. The value of wetlands: Importance of scale and landscape setting. Ecol. Econ. 2000, 35, 25–33. [Google Scholar] [CrossRef]
- Xiao, Y.; Xie, G.D.; Chun-Xia, L.U.; Ding, X.Z.; Yao, L.U. The gas regulation function of rice paddy ecosystems and its value. J. Nat. Resour. 2004, 19, 617–623. [Google Scholar]
- Liu, H.; Xuan, C. Elementary study on evaluation of CO_2 emissions from aquaculture in China. South China Fish. Sci. 2010, 6, 77–80. [Google Scholar]
- Lee, S.-C.; Oh, D.-H.; Lee, J.-D. A new approach to measuring shadow price: Reconciling engineering and economic perspectives. Energy Econ. 2014, 46, 66–77. [Google Scholar] [CrossRef]
- Xie, G.; Zhang, C.; Zhang, C.; Xiao, Y.; Lu, C. The value of ecosystem services in China. Resour. Sci. 2015, 37, 1740–1746. [Google Scholar]
- Daniel, T.C.; Muhar, A.; Arnberger, A.; Aznar, O.; Boyd, J.W.; Chan, K.M.; Costanza, R.; Elmqvist, T.; Flint, C.G.; Gobster, P.H.; et al. Contributions of cultural services to the ecosystem services agenda. Proc. Natl. Acad. Sci. USA 2012, 109, 8812–8819. [Google Scholar] [CrossRef] [PubMed] [Green Version]
- Zhang, S. Research on the Tourism Development and Management Reform of Weishan Lake; Guizhou University: Guizhou, China, 2010. [Google Scholar]
- Cai, Z.; Wang, Q.; Liu, G. Value Re-Evaluation for Ecosystem Services of China. Ecol. Econ. 2014, 30, 16–23. [Google Scholar]
- Guo-Xia, M.A.; Fang, Y.U.; Wang, J.N.; Zhou, X.F.; Yuan, J.; Mou, X.H.; Zhou, Y.; Yang, W.S.; Peng, F. Measuring gross ecosystem product(GEP) of 2015 for terrestrial ecosystems in China. China Environ. Sci. 2017, 37, 1474–1482. [Google Scholar]
- Liu, Y.; Dong, X. Comparison and reference of Chinese and foreign wetland protection legal system. Environ. Prot. 2018, 46, 63–67. [Google Scholar]
- Verstraete, M.; Pinty, B.; Myneni, R. Potential and limitations of information extraction on the terrestrial biosphere from satellite remote sensing. Remote Sens. Environ. 1996, 58, 201–214. [Google Scholar] [CrossRef]
- Yang, W.; Chang, J.; Xu, B.; Peng, C.; Ge, Y. Ecosystem service value assessment for constructed wetlands: A case study in Hangzhou, China. Ecol. Econ. 2008, 68, 116–125. [Google Scholar] [CrossRef]
Figure 1.
Location and composition of Nansi Lake wetland.

Figure 2.
The current land use maps of Nansi Lake wetland from 1987 to 2017.

Figure 3.
The LUCC of Nansi Lake wetland from 1987 to 2017. (a) shows the area percent change of three categories and (b) shows the area percent change of eight subcategories of Nansi Lake wetland from 1987 to 2017.
Figure 3.
The LUCC of Nansi Lake wetland from 1987 to 2017. (a) shows the area percent change of three categories and (b) shows the area percent change of eight subcategories of Nansi Lake wetland from 1987 to 2017.

Figure 4.
The annual values of each ES from 1987 to 2017 (in red color, 10 million dollars).

Figure 5.
The comparison of the ESV in Nansi Lake wetland from 1987 to 2017.


Table 1.
Annual average output/ input value, unit price and total value of fish and paddy in Nansi Lake wetland (2012 USD).
Table 1.
Annual average output/ input value, unit price and total value of fish and paddy in Nansi Lake wetland (2012 USD).
| Type | Output/Input (t/year) | Unit Price ($/t) | Total Value ($) | |
|---|---|---|---|---|
| Fish | Carp | 1.3 × 10⁴ | 1.365 × 10³ | 1.774 × 10⁷ |
| Crucian | 1.6 × 10⁴ | 1.845 × 10³ | 2.952 × 10⁷ | |
| Mandarin fish | 500 | 7.774 × 10³ | 3.870 × 10⁶ | |
| Turtle | 40 | 1.063 × 10⁴ | 4.252 × 10⁵ | |
| Total | 2.954 × 10⁴ | - | 5.156 × 10⁷ | |
| Average price | - | 1.745×10³ | - | |
| Paddy | Seed | 45 | 396.574 | 1.785 × 10⁴ |
| Chemical fertilizer | 214.677 | 375.37 | 8.058 × 10⁴ | |
| Pesticide | 3.245 | 2.982 × 10³ | 9.677 × 10³ | |
| Diesel (farm machinery) | 35.926 | 841.648 | 3.024 × 10⁴ | |
| Electricity | 3.352 × 10⁴ | 0.082 | 2.749 × 10³ | |
| Labour force | 385.86 | 91.371 | 3.526 × 10⁴ | |
| Total | - | - | 1.762 × 10⁵ | |
Table 2.
The biomass, release of CO2 and CH4, service value per unit area of phytoplankton, hydrophyte (reeds and lotus ponds), paddy field and aquaculture area (fish) in Nansi Lake wetland.
Table 2.
The biomass, release of CO2 and CH4, service value per unit area of phytoplankton, hydrophyte (reeds and lotus ponds), paddy field and aquaculture area (fish) in Nansi Lake wetland.
| Type | Biomass (t·km−2) | Release of CO2 (t·km−2·a−1) | Release of CH4 (t·km−2·a−1) | Service Value ($·km2·a−1) | Data Source |
|---|---|---|---|---|---|
| Phytoplankton | 2.48 | - | - | 2.84 × 10² | CSIR, 2006 |
| Hydrophyte (reedsand lotus ponds) | 2.58 × 10³ | - | 1.37 × 10² | 2.81 × 10⁵ | CSIR, 2006; [49] |
| Paddy field | - | - | - | 1.45 × 10⁵ | [54] |
| Aquaculture area (fish) | - | 121.5 | - | −2.92 × 10³ | [55] |
*CSRI: Comprehensive scientific investigation report of Nansi Lake nature reserve in Shandong, 2006.
Table 3.
The flood storage capacity in Nansi Lake wetland from 1987 to 2017 (108 m3).
| Flood Storage Capacity | 1987 | 1995 | 2002 | 2006 | 2010 | 2017 |
|---|---|---|---|---|---|---|
| Upper lake | 10.02 | 9.29 | 0 | 10.85 | 10.2 | 10.98 |
| Lower lake | 5.68 | 7.78 | 0.61 | 8.37 | 6.8 | 9.47 |
| Total | 15.7 | 17.07 | 0.61 | 19.22 | 17 | 20.45 |
Data sources: 1987: Natural resources investigation and exploitation of Nansi Lake. Jining Municipal Science and Technology Commission; 1995, 2017: Jining Hydrology Bureau, http://jnswj.sdwr.gov.cn; 2002–2010: Huai river water resources bulletin (2002–2010), http://www.hrc.gov.cn.
Table 4.
The area transfer matrix of land use types in Nansi Lake wetland from 1987 to 2017 (km2). The numbers represent the area of land use change, positive and negative numbers in change statistics represent the increased and decreased areas of the corresponding land use types.
Table 4.
The area transfer matrix of land use types in Nansi Lake wetland from 1987 to 2017 (km2). The numbers represent the area of land use change, positive and negative numbers in change statistics represent the increased and decreased areas of the corresponding land use types.
| 1987 | Natural Water | Reed | Lotus Ponds | Paddy Fields | Rivers and Ditches | Reservoirs and Ponds | Aquacul-ture Area | Non-Wetland | |
|---|---|---|---|---|---|---|---|---|---|
| 2017 | |||||||||
| Natural Water | 239.41 | 13.29 | 38.76 | 1.97 | 9.52 | 1.96 | 0.87 | 4.09 | |
| Reed | 4.46 | 12.67 | 7.66 | 1.77 | 2.50 | 0.37 | 0.41 | 8.27 | |
| Lotus Ponds | 36.49 | 30.38 | 69.54 | 1.08 | 1.26 | 1.03 | 0.84 | 2.77 | |
| Paddy Fields | 0.48 | 62.64 | 2.23 | 18.06 | 0.57 | 0.87 | 1.63 | 13.14 | |
| Rivers and Ditches | 6.53 | 9.43 | 9.99 | 0.35 | 16.39 | 1.00 | 0.89 | 2.84 | |
| Reservoirs and Ponds | 0.91 | 5.22 | 0.56 | 0.58 | 0.06 | 5.15 | 0.08 | 2.31 | |
| Aquaculture Area | 79.40 | 232.20 | 144.05 | 13.02 | 10.45 | 4.46 | 11.23 | 26.25 | |
| Non- wetland | 3.28 | 9.19 | 2.38 | 1.21 | 0.92 | 0.67 | 3.83 | 18.16 | |
| Change Statistics | −73.76 | −341.58 | −131.84 | 63.26 | 13.99 | 1.43 | 502.05 | −35.02 | |
Table 5.
The landscape metrics in Nansi Lake wetland from 1987 to 2017.
| Index | NP | PD | LSI | SHDI | SHEI | CONTAG | |
|---|---|---|---|---|---|---|---|
| Year | |||||||
| 1987 | 483 | 0.40 | 11.19 | 1.48 | 0.71 | 50.81 | |
| 1995 | 413 | 0.34 | 9.56 | 1.51 | 0.73 | 51.60 | |
| 2002 | 640 | 0.53 | 14.26 | 1.70 | 0.82 | 40.82 | |
| 2006 | 621 | 0.52 | 12.18 | 1.52 | 0.73 | 47.93 | |
| 2010 | 719 | 0.60 | 12.82 | 1.48 | 0.71 | 48.31 | |
| 2017 | 783 | 0.65 | 14.33 | 1.64 | 0.72 | 43.63 | |
Table 6.
The unit values of ecosystem services (ES) and total ecosystem services value (ESV) in Nansi Lake wetland from 1987 to 2017 (10 million dollars, values in 2012 USD). MV = market value, IO/CT = industrial oxygen/carbon tax, AC = afforestation cost, SE = shadow engineering, RC = replacement cost, TC = travel cost.
| Ecosystem Service | Second Class | Unit Value/ Total Value | Valuation Method | ESV | ||||||
|---|---|---|---|---|---|---|---|---|---|---|
| 1987 | 1995 | 2002 | 2006 | 2010 | 2017 | |||||
| Provisioning services | ||||||||||
| Material production | Fish | $3.927 × 10⁵/km2 | MV | 4.35 | 6.01 | 11.54 | 13.53 | 13.64 | 13.17 | |
| Paddy | $2.194 × 10⁵/km2 | |||||||||
| Reed | $3.174 × 10⁴/km2 | |||||||||
| Regulating services | ||||||||||
| Climate regulation | Phytoplankton | $2.84 × 10²/km2 | IO/CT, AC | 18.82 | 14.15 | 12.95 | 5.39 | 4.26 | 6.28 | |
| Hydrophyte | $2.81 × 10⁵ /km2 | |||||||||
| Paddy fields | $1.45 × 10⁵/km2 | |||||||||
| Aquaculture area | $−2.92 × 10³/km2 | |||||||||
| Water regulation | - | $1.575 × 10⁵/km2 | SE | 14.34 | 11.75 | 16.18 | 13.23 | 13.48 | 15.51 | |
| Flood reservation | - | $0.21/m3 | SE | 32.97 | 35.85 | 1.28 | 40.36 | 35.70 | 42.95 | |
| Purification | - | $1.526 × 10⁵/km2 | RC | 5.73 | 5.00 | 3.29 | 1.36 | 1.13 | 0.52 | |
| Supporting services | ||||||||||
| Soil conservation | - | $3.06 × 10⁷/km2 | SE | 32.01 | 32.01 | 31.99 | 31.98 | 31.99 | 32.0 | |
| Cultural services | ||||||||||
| Recreation | - | $14.2 | TC | 0.03 | 0.13 | 0.57 | 0.71 | 2.20 | 7.53 | |
| Total | - | - | - | 108.25 | 104.90 | 77.80 | 106.56 | 102.40 | 117.96 | |
© 2019 by the authors. Licensee MDPI, Basel, Switzerland. This article is an open access article distributed under the terms and conditions of the Creative Commons Attribution (CC BY) license (http://creativecommons.org/licenses/by/4.0/).
Share and Cite
MDPI and ACS Style
Meng, L.; Dong, J. LUCC and Ecosystem Service Value Assessment for Wetlands: A Case Study in Nansi Lake, China. Water 2019, 11, 1597. https://doi.org/10.3390/w11081597
AMA Style
Meng L, Dong J. LUCC and Ecosystem Service Value Assessment for Wetlands: A Case Study in Nansi Lake, China. Water. 2019; 11(8):1597. https://doi.org/10.3390/w11081597
Chicago/Turabian StyleMeng, Lingran, and Jihong Dong. 2019. "LUCC and Ecosystem Service Value Assessment for Wetlands: A Case Study in Nansi Lake, China" Water 11, no. 8: 1597. https://doi.org/10.3390/w11081597
Note that from the first issue of 2016, this journal uses article numbers instead of page numbers. See further details here.