Article

Changes in Nutrient Concentrations of Two Streams in Western Lithuania with Focus on Shrinkage of Agriculture and Effect of Climate, Drainage Runoff and Soil Factors

1
Study Centre of Social Geography and Regional Sciences and Marine Research Institute, Klaipėda University, LT-92294 Klaipėda, Lithuania
2
Institute of Water Resources Engineering, Vytautas Magnus University, Akademija, LT-53361 Kaunas, Lithuania
*
Author to whom correspondence should be addressed.
Water 2019, 11(8), 1590; https://doi.org/10.3390/w11081590
Submission received: 15 May 2019 / Revised: 23 June 2019 / Accepted: 29 July 2019 / Published: 31 July 2019

Abstract

:
The causal relationship of changes in nitrogen and phosphorus concentrations in the Akmena-Danė River and its largest tributary, the Eketė River, was analysed for the period 1999–2014. Results showed that the annual concentrations of NH4-N and PO4-P significantly decreased in the Eketė River over the research period. NH4-N also significantly decreased in the Akmena-Danė River. This was mostly due to the shrinkage of agriculture, i.e., the reduction in agricultural land area, total farm and animal numbers and other agricultural activities. The effect of other factors such as air temperature, precipitation rate, shift of precipitation maximum from warm to cold season, drainage runoff from the large tile-drained areas, soil types and the slight increase in forested land was also examined.

1. Introduction

EU members states are required to assign all river basins/catchments within their territories to river basin districts and make necessary institutional provisions for the application of the EU Water Framework Directive (2000/60) [1]. It is equally important to share the scientific results obtained on the plot, field and catchment level between countries and river basins. Data on N (nitrogen) and P (phosphorus) migration within agro- and ecosystems, soil profiles, water bodies and the atmosphere are collected worldwide. Water monitoring results have not always satisfied the observers with logical explanations of different events due to the numerous interactions between components of the matter flow process. It has been widely recognized that in the Baltic Sea catchment area waterborne pollutants predominantly originate from diffuse sources. High inputs of N and P substances can stimulate eutrophication of the receiving water bodies [2,3,4]. Numerous studies have demonstrated that losses of N and P from agricultural land to surface waters can be substantial. As stated by HELCOM [5,6], agriculture contributes approximately 80% of the total nitrogen load entering the Baltic Sea. Long-term observations in the Baltic countries (Estonia, Latvia and Lithuania) indicate that average annual losses of total nitrogen and total phosphorus from agricultural catchments can vary from 5 to 40 kg N ha−1 [7,8,9,10] and from 0.120 to 0.421 kg P ha−1 [11], respectively. These amounts were highly affected by various factors. Other authors [12,13,14] found that hydrological flow processes play an important role in nutrient losses.
According to [10,15,16], nitrogen in precipitation is an important factor controlling its export from the catchments. The proportion of arable land and pasture in the catchment and soil conditions are also highly important factors [17,18]. The impacts of agricultural drainage on water and nutrient balance in the soil need to be considered as 86% of the agricultural land in Lithuania is tile-drained.
The investigations have shown that the typical concentrations of nitrate nitrogen in drainage water can vary from 3 to 20 mg L−1, and the total phosphorus levels vary from 0.1 to 0.15 mg L−1 [4,19]. The use of organic and mineral fertilizers in agricultural production can lead to increased concentrations of nutrients in drainage runoff [20,21]. There is still a lack of information regarding the dominant processes and factors governing nutrient loss from land to water in catchments with prevailing agricultural land area. Prior to this study, it was thought that reduced agricultural practices would impact the decrease in nutrients concentration of the selected rivers. The aim of this research was to determine the causal relationship of changes in concentrations of N and P compounds in the Akmena-Danė River and Eketė River from 1999 to 2014 focusing on climate, drainage runoff, soil factors, land use, and agricultural activities acting in the main catchment and sub-catchment. Data was obtained from water monitoring programmes, field studies, drainage plot research, modelling, social inquiry and survey and available statistical and spatial databases.

2. Materials and Methods

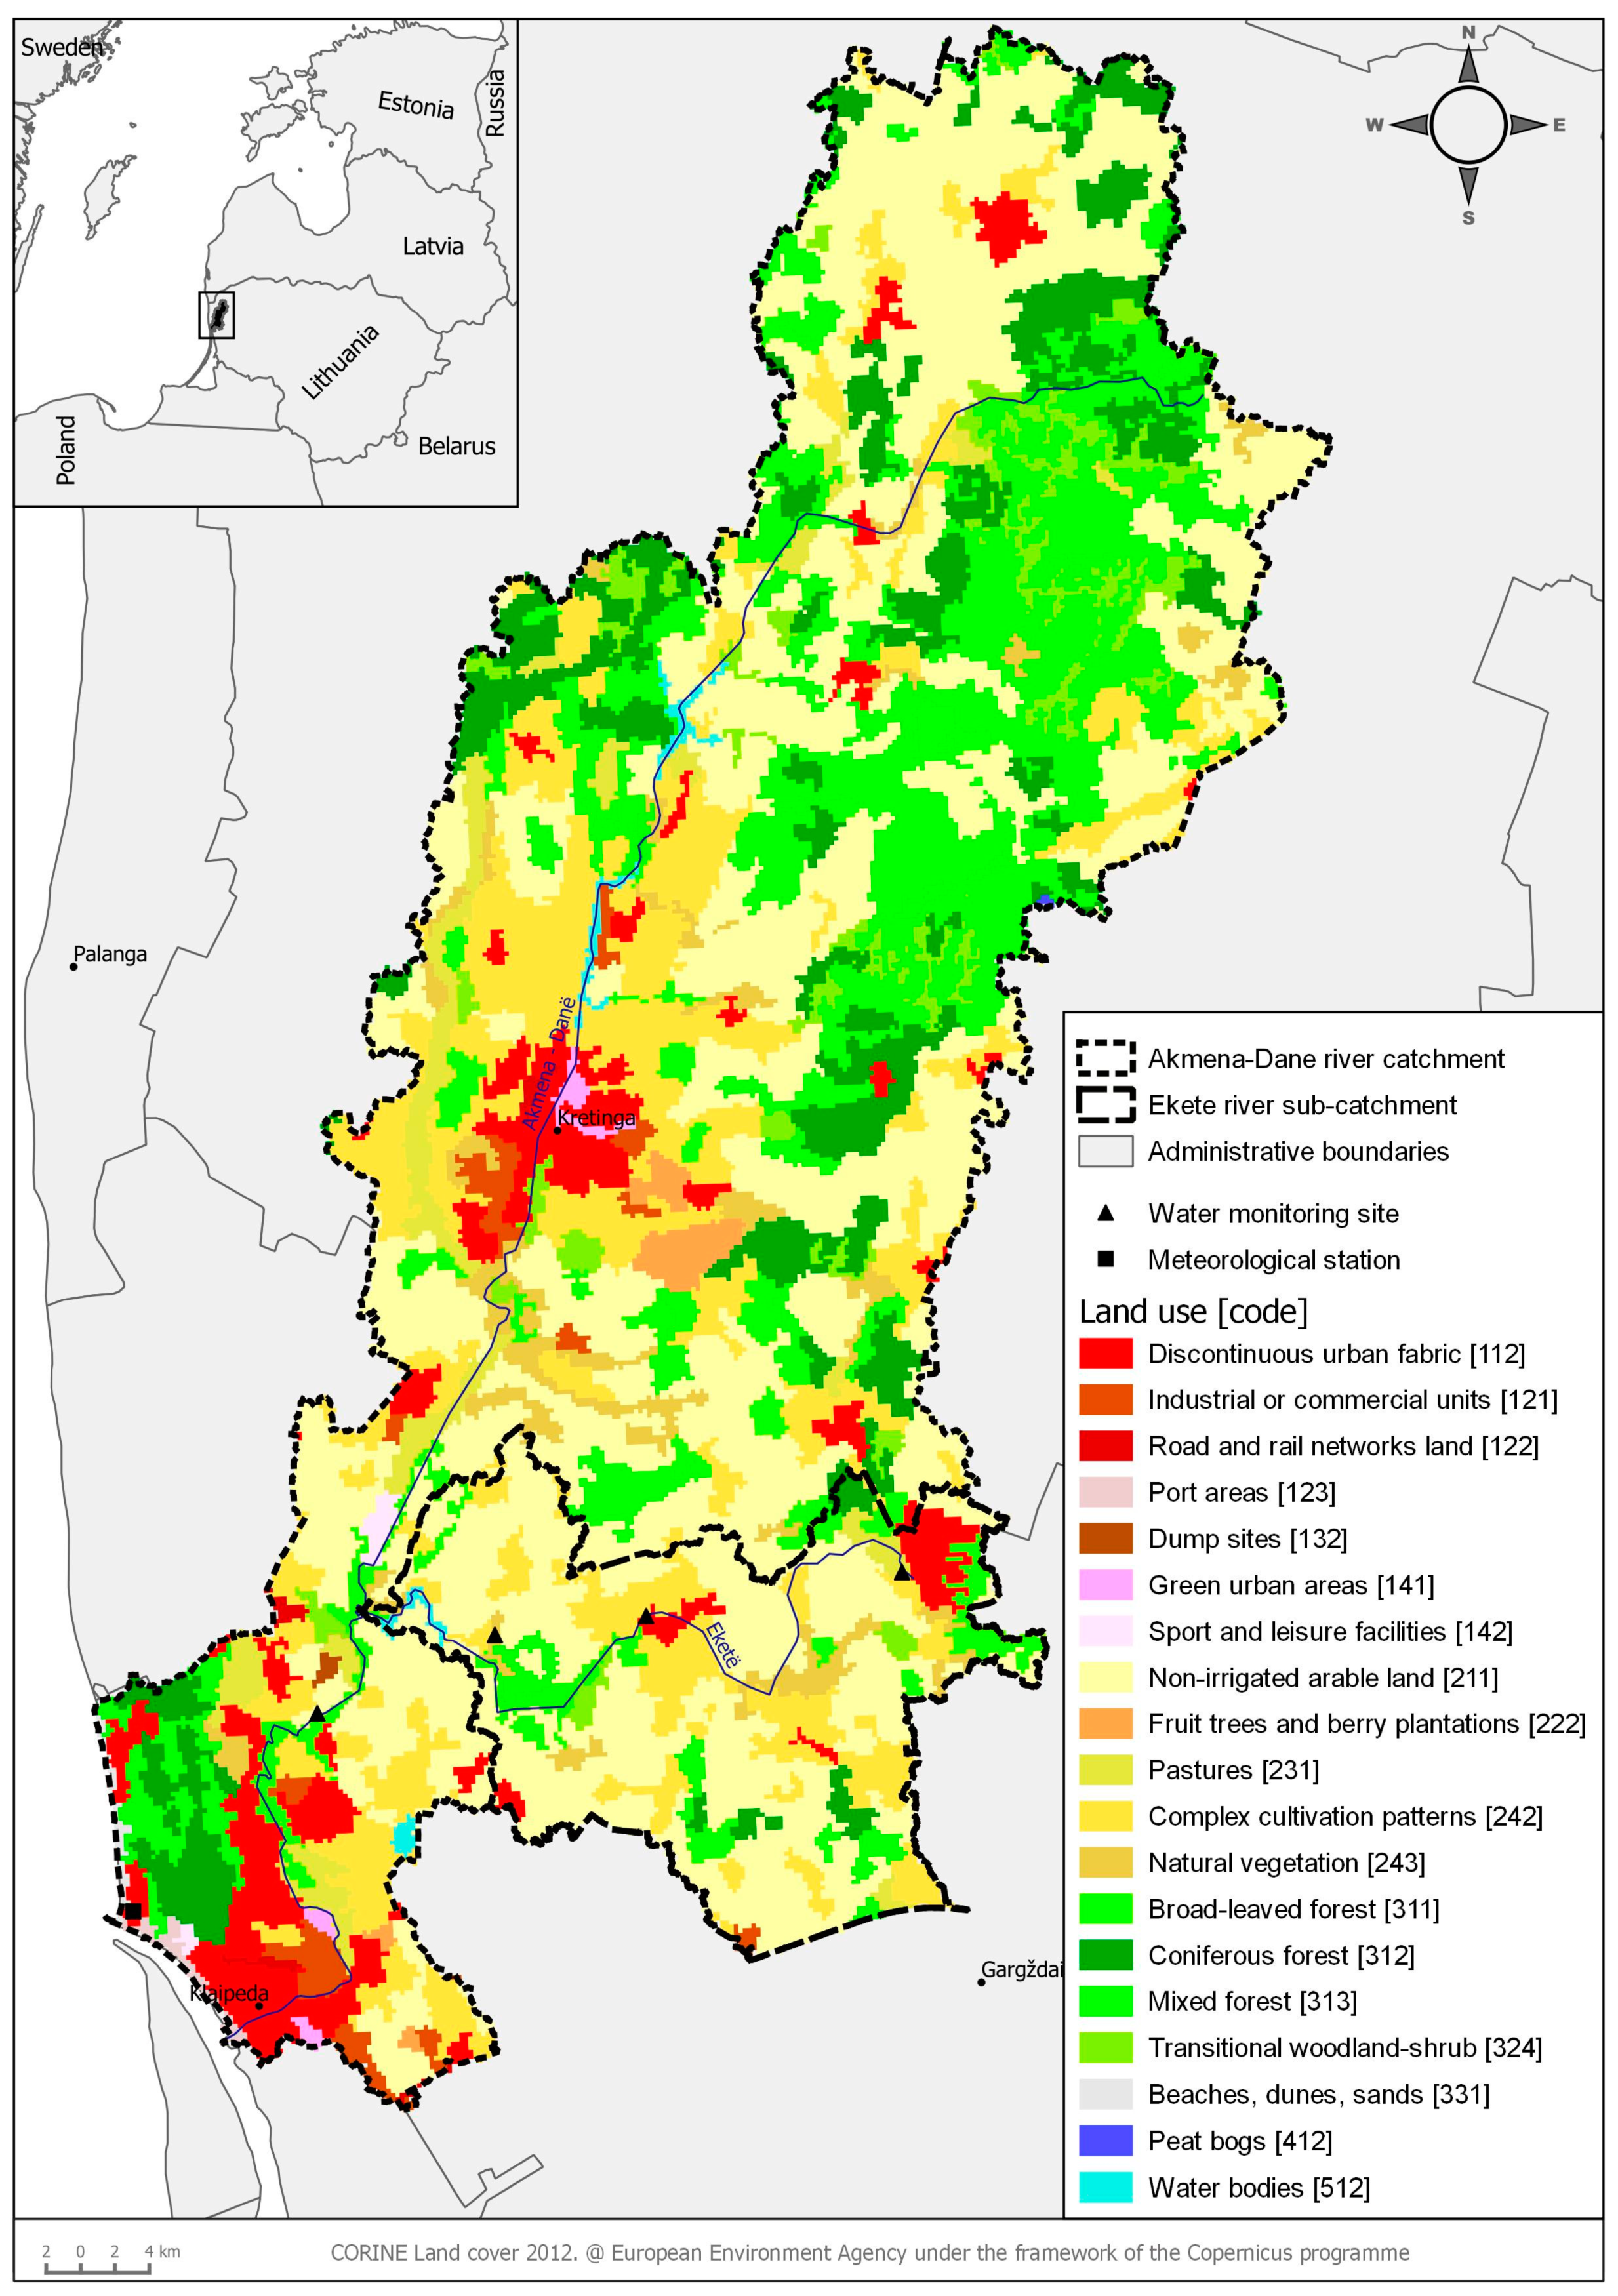
2.1. Study Area Description

The Akmena-Danė River catchment is located in western Lithuania and occupies 593.49 km2 of Pajūrio Lowland. The river is 62.5 km long and ends in the Klaipėda Strait within the city of Klaipėda (Figure 1). The average water budget of western Lithuanian streams comes primarily from precipitation (59% for rain, 29% for snow) and from underground sources (12%) [22].
The largest tributary of the Akmena-Danė is the Eketė River. It is 23 km long and its sub-catchment occupies 93.3 km2. Almost 5% of the Akmena-Danė catchment area was urban use and 1.4% was in industrial, commercial, roads, rails and ports in 2012 [25].

2.2. Data Collection

Chemical composition of the water of the Akmena-Danė and Eketė rivers was determined three times per year (March–April, June–July and October–November) in 1999–2001 and six times per year in 2014 (every second month). The Akmena-Danė water was tested once per season from 2006 to 2010, and in the Eketė in 2005 and 2008 according to the tasks of the international project “Moment” [25]. The Eketė water was sampled in the upper, middle and lower reaches. The Akmena-Danė water was sampled by the Tauralaukis bridge upstream of Klaipėda (Figure 1).
Water samples were filtered through 0.07 µm pore size glass fiber filters prior to analyzing aliquots for PO4-P, NO3-N, NO2-N and NH4-N. Unfiltered water samples were used for P-tot and N-tot analysis. NO2-N and NO3-N concentrations were analyzed by potentiometric method. NH4-N and N-tot were detected by photomethric method. P-tot was determined using the colorimetric method.
The chemical analyses were conducted at the Analytical Laboratory of the Centre of Agrarian and Forestry Sciences in Akademija (Kėdainiai district) and at Klaipėda University Chemical Laboratory. Soil N inorganic was tested using 4 replicate samples at 4 times per winter wheat vegetation season from the topsoil (0–30 cm) and subsoil (30–60, 60–90 cm) layers. Results were expressed as sum of NO3-N ascertained by the colorimetric method, using hydrazinesulfate and sulfanilamide, and NH4-N determined by the colorimetric method, using natrium phenolate and natrium hypochlorite. Plant available content of P2O5 was determined from topsoil samples by AL-method [26] extracted with ammonium lactate, and soil N inorganic by the colorimetric method in 4 replicates.
The research was focused on the diffuse pollution sources in the catchment and the sub-catchment. Since there were no equipped drainage runoff monitoring sites in the catchment area, data on drainage runoff and its chemical composition was obtained from other available research sites in Lithuania. The Vėžaičiai drainage plot site was chosen to test NO3-N and PO4-P leaching in 1995–1997 because it had characteristics that were typical in western Lithuania: Crop rotation (winter wheat, fodder beet, barley + ley, ley first year of use), farming intensity (organic, conventional) and soils (Albeluvisols, Luvisols and Gleysols with sandy loam and light loam). The Akademija drainage plot site (1995–1999) was on Cambisols with sandy loam and light loam. It was chosen to demonstrate soil N inorganic and NO3-N migration and leaching process during the extreme 1997–1998 hydrological year characterized by maximum precipitation during the cold (autumn–winter–early spring) season. The winter wheat following the early ley ploughing (in the first half of August) was growing in this site in 1997–1998. The drainage runoff measurements were taken at both sites using weekly self recorders.
In 1999–2001 and 2014, local farmers and other land users in the sub-catchment and in 2010 in the catchment were surveyed during visits to the area to collect information on soils, fertilization levels, animal numbers and farming intensity.
The data on land use, farm and animal numbers were obtained from the Census results in Lithuania made in 2003 and 2010 on the district and ward level [27,28] and from the CORINE Database [23,24,29].
Meteorological data (average air temperature and precipitation rate) were obtained from the Krantas Meteostation in Klaipėda. The studied years were grouped according to the annual precipitation amount to 3 classes: (1) wet—annual precipitation rate by 15+% above Many Years Mean Precipitation (MYMP); (2) normal—annual precipitation rate between wet and dry based on MYMP; (3) dry—annual precipitation rate by 15+% below MYMP.

2.3. Model Approach

In addition to the data mentioned above, annual amounts of nutrient losses in the Akmena-Danė River catchment were generated from SWAT2012 model simulations. The SWAT [30] is a continuous-time, semi-distributed, quasi process-based catchment model that requires a significant amount of data input. The main model inputs are topography, soil properties, hydrologic soil group, land use type, weather, river network and drainage data, atmospheric deposition and land management practices with detailed information on point source pollution, crop parameters and fertilization. The model has nutrient (N and P) process representations in which mineralization, decomposition and immobilization are represented. A detailed description of the processes that are incorporated in SWAT2012 model is provided in [31]. The automated system of Phyton (version 2.6) scripts was developed and employed for building the SWAT2012 as the water quality modelling system in Lithuania in each River Basin District in Lithuania according to the EU Water Framework Directive [32,33].
Various input data required by the model (including GIS-based information of different spatial resolution) were collected from various data sources for the period 1997–2012 to calibrate and validate the model. Daily discharge was provided by the Lithuanian State Hydrometeorological Service. Water quality data was obtained from Lithuanian Environmental Protection Agency. The model simulated time series of hydrological and nutrient variables for each sub-catchment using readily available appropriate data on soil and crop parameters, land use statistics and fertilization rates obtained from Lithuanian Ministry of Agriculture, State Statistics Department and data collected from various research studies.
Automatic calibration was done first by applying the SWAT CUP 2012 program. This software performed model validation and uncertainty analysis. This software was also enabled to perform model’s validation and uncertainty analyses. SWAT error checking and mass balance checking procedures were performed by SWAT-CHECK 2012. This was done for annual water yield, nitrogen and phosphorous cycles and crop growth components. For better calibration of groundwater parameters, the baseflow filtering tool was applied. The baseflow filter program in SWAT estimated baseflow and groundwater recharge from streamflow records using the methodology described by [34].
The model’s calibration was done using top-down approach. Water discharge, riverine NO3-N, N-tot, PO4-P, and P-tot concentrations were calibrated simultaneously. Daily water discharge in the Akmena-Danė River at Kretinga (number of observations n = 5477) and water quality data at Akmena-Danė upstream Klaipėda (n = 58), at Tūbausiai (n = 156) and at the outlet (n = 182) for the period 1997–2012 were used to calibrate and validate the model. Sensitivity analysis using the PSO SWAT CUP program and baseflow filtering were performed prior to calibration.
Three criteria were applied to assess the model’s performance—the Nash–Sutcliffe Efficiency (NSE), the R-squared coefficient and the Percent Bias (PBIAS). In high model performance the values of NSE and R-squared statistics should be equal to 1.0 and the PBIAS to 0.0. Based on [35] the target threshold values for hydrological observations vs. model outputs were chosen as follows: NSE > 0.5 and PBIAS < 20% for calibration and NSE > 0.4 and PBIAS < 25% for validation. For water quality assessment the target threshold values were R-squared > 0.5 and PBIAS < 40% (calibration) and R-squared > 0.4 and PBIAS < 70% (validation), respectively. Hydrological parameters for the Akmena-Danė River at Kretinga site were calibrated for two time periods: One from 1997 to 2003 and the other from 2008 to 2012. NSE = 0.51 and PBIAS = 11% were achieved by adjusting 16 appropriate values.
Model’s validation was performed using data from the period 2003–2008 and resulted in NSE = 0.60 and PBIAS = 0%. This demonstrated that calibration and validation targets for hydrology part of the model were successfully reached.
Twenty-one water quality parameters were calibrated using available data from 1997 to 2000 and from 2006 to 2009. The validation was done using available data from 2001 to 2005. The results showed acceptable model performance. The measured values compared reasonably well with the simulated ones. During the calibration the PBIAS and R-squared values for NO3-N, N-tot, PO4-P and P-tot outputs ranged from −3% to +37% and from 0.82 to 0.89, respectively. The agreement between modeled and measured values during the validation varied from −2% to +16% and from 0.90 to 0.92, respectively. These outcomes led to conclude that the model is applicable to study nutrient fluxes in the analyzed river basin. A more detailed description about the calibration and validations procedures is described in [36].

2.4. Statistical Data Analysis

The IBM SPSS Statistics Version 21 programme was used to make dispersion and correlation-regression analysis with obtained data. The data were tested for adherence to assumption of normality by using quantile plots [37]. The t-test with unequal variances (i.e., Welch two sample test) was used with R 3.4.4 [38] to compare two means of nutrient concentrations in 1999–2001 and 2014. The results of statistical tests were regarded significant with p ≤ 0.05. The relationships between concentration of nutrients in both streams and environmental factors (precipitation rate and mean air and monthly temperature) were analyzed by the Spearman rank correlation (rS) since most of the data was not normally distributed.

3. Results

3.1. Changes in Concentration of Nutrients in Two Streams

There were statistically significant decreases in mean concentrations of PO4-P and NH4-N (respectively, t = 4.01, df = 14.81, p < 0.01 and t = 2.29, df = 7.07, p < 0.05) over a 16-year period in the Eketė water. The mean concentration of PO4-P in 2014 was twice lower than in 1999–2001, whereas the mean concentration of NH4-N in 2014 was ca. 11 times lower than in 1999–2001 (Table 1). The mean concentration of P-tot also decreased in 2014, but not statistically significantly (p > 0.05). Other concentrations of nutrients were almost unchanged or slightly increased, like NO2-N (p > 0.05). This may have been caused by the increase in the decay of organic matter in the stream bottom that may have been stimulated by the increased air temperature and lower discharge during the warm seasons.
In the Akmena-Danė waters, the mean concentrations of nutrients decreased over 16-year period, only the mean concentration of NH4-N significantly decreased (t = 17.87, df = 3.53, p < 0.01); it was ca. 20 times lower in 2014 than in 1999–2001.
The concentrations of NO3-N and N-tot did not change in both streams.

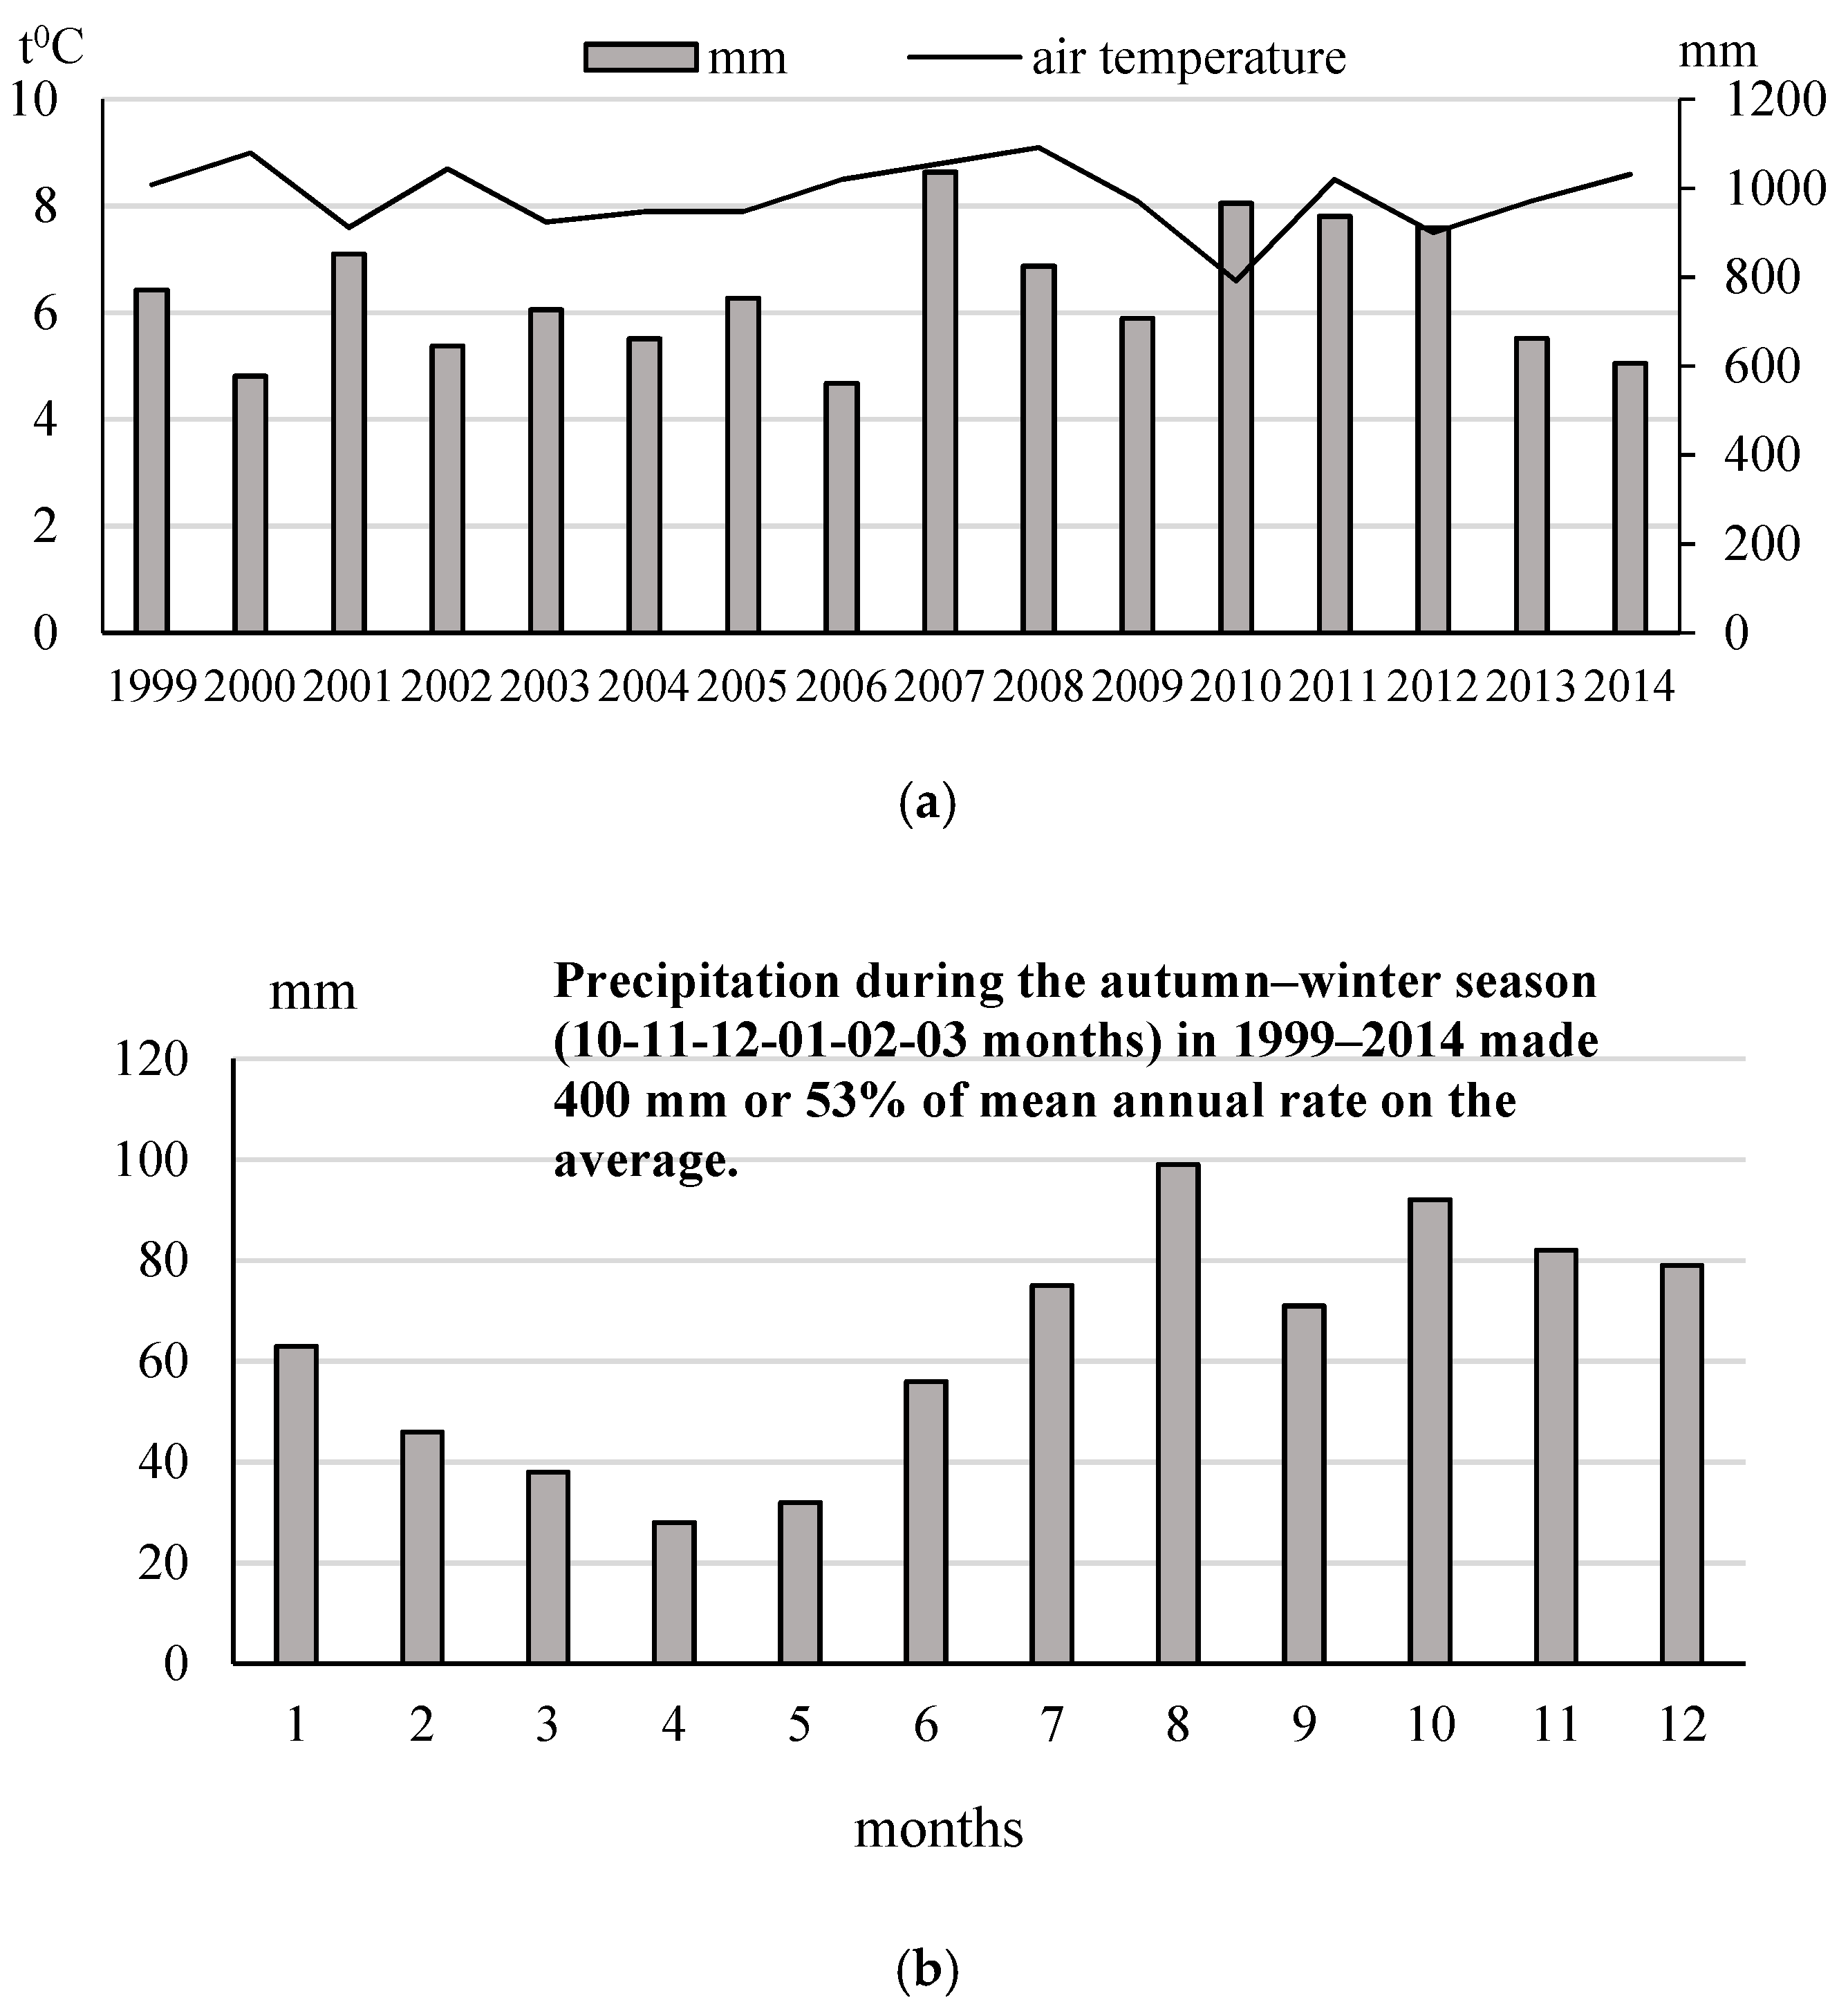
3.2. Climatic Conditions

Streams in Lithuania are evaporating and have become shallower over the last few decades. The research data showed that evaporation is currently higher by 18%, so runoff has also decreased. More precipitation during the cold weather season results in more discharge than during the warm season [39]. Floods now occur in the autumn (November 2007 and 2017) in addition to the more traditional spring floods. Since 1961, the dry season has moved from June to August, particularly in western Lithuania [22]. Average annual precipitation in Pajūrio Lowland is 750 mm, in the Akmena-Danė catchment is 775 mm. The warmest month is July (16.5–17.5 °C), and the coldest is January (−3.5 to −2.5 °C) [39]. Two main climatic parameters—annual average air temperature and precipitation rate from 1999 to 2014—are shown in the Figure 2a.
There were 6 wet, 6 dry, and 4 medium years according to the precipitation rate and MYMP during the 1999–2014 research period. The average annual air temperature was warmer for 7 years, cooler for 7 years, and average for 2 years. This research period was more humid than average and near average for air temperature. The data on mean precipitation rate by month has shown that the higher rates during period were characteristic for autumn–winter months as compared with the rest months (Figure 2b).
The concentration of N-tot in the Akmena-Danė stream significantly correlated with mean annual air temperature over the research period (rS = −0.807, p = 0.0086). With an increase of annual air temperature from 6.6 to 9.1 °C, N-tot decreased from 3.0 to 2.0 mg L−1. This might be related to the increase of denitrification in the warm seasons of years with higher than mean air temperature.
The correlation between NO3-N and annual precipitation rate in the Eketė stream was almost statistically significant (rS = −0.75, p = 0.066). With an increase of annual precipitation rate from 577 mm to 968 mm, NO3-N decreased from 2.0 to 1.0 mg L−1 and less.
The concentration of P-tot in Eketė stream water strongly correlated with the mean monthly air temperature (rS = 0.999, p = 0.0028): with increase of monthly air temperature from 3.8 to 13.3 °C, P-tot concentration increased from 0.040 to 0.107 mg L−1. This might be explained by the fact that higher temperatures accompanied with dryness can accelerate weathering and soil erodibility and reduce surface runoff.

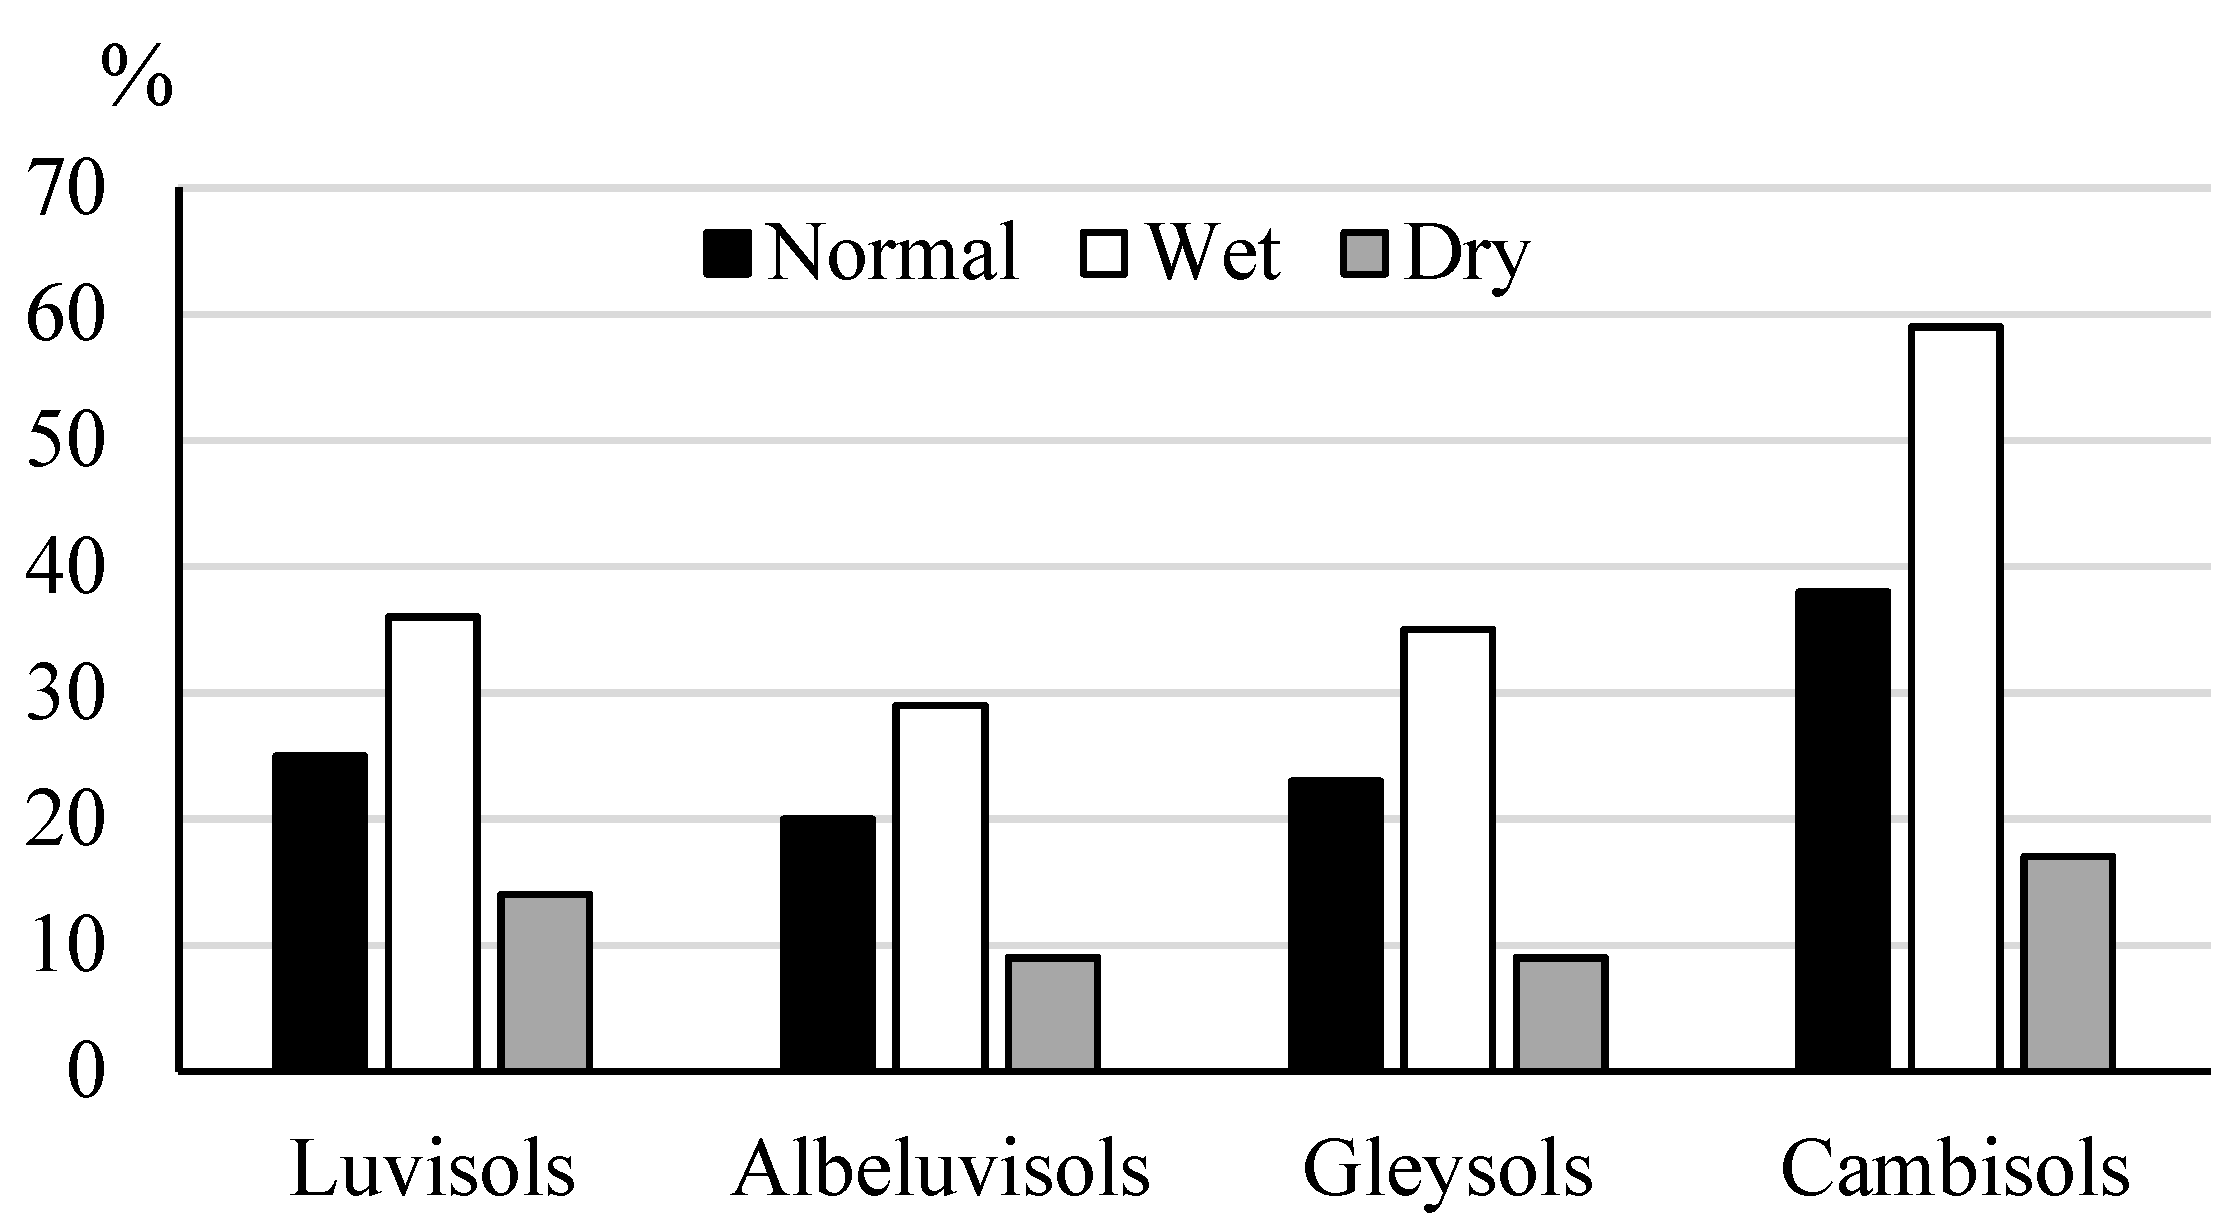
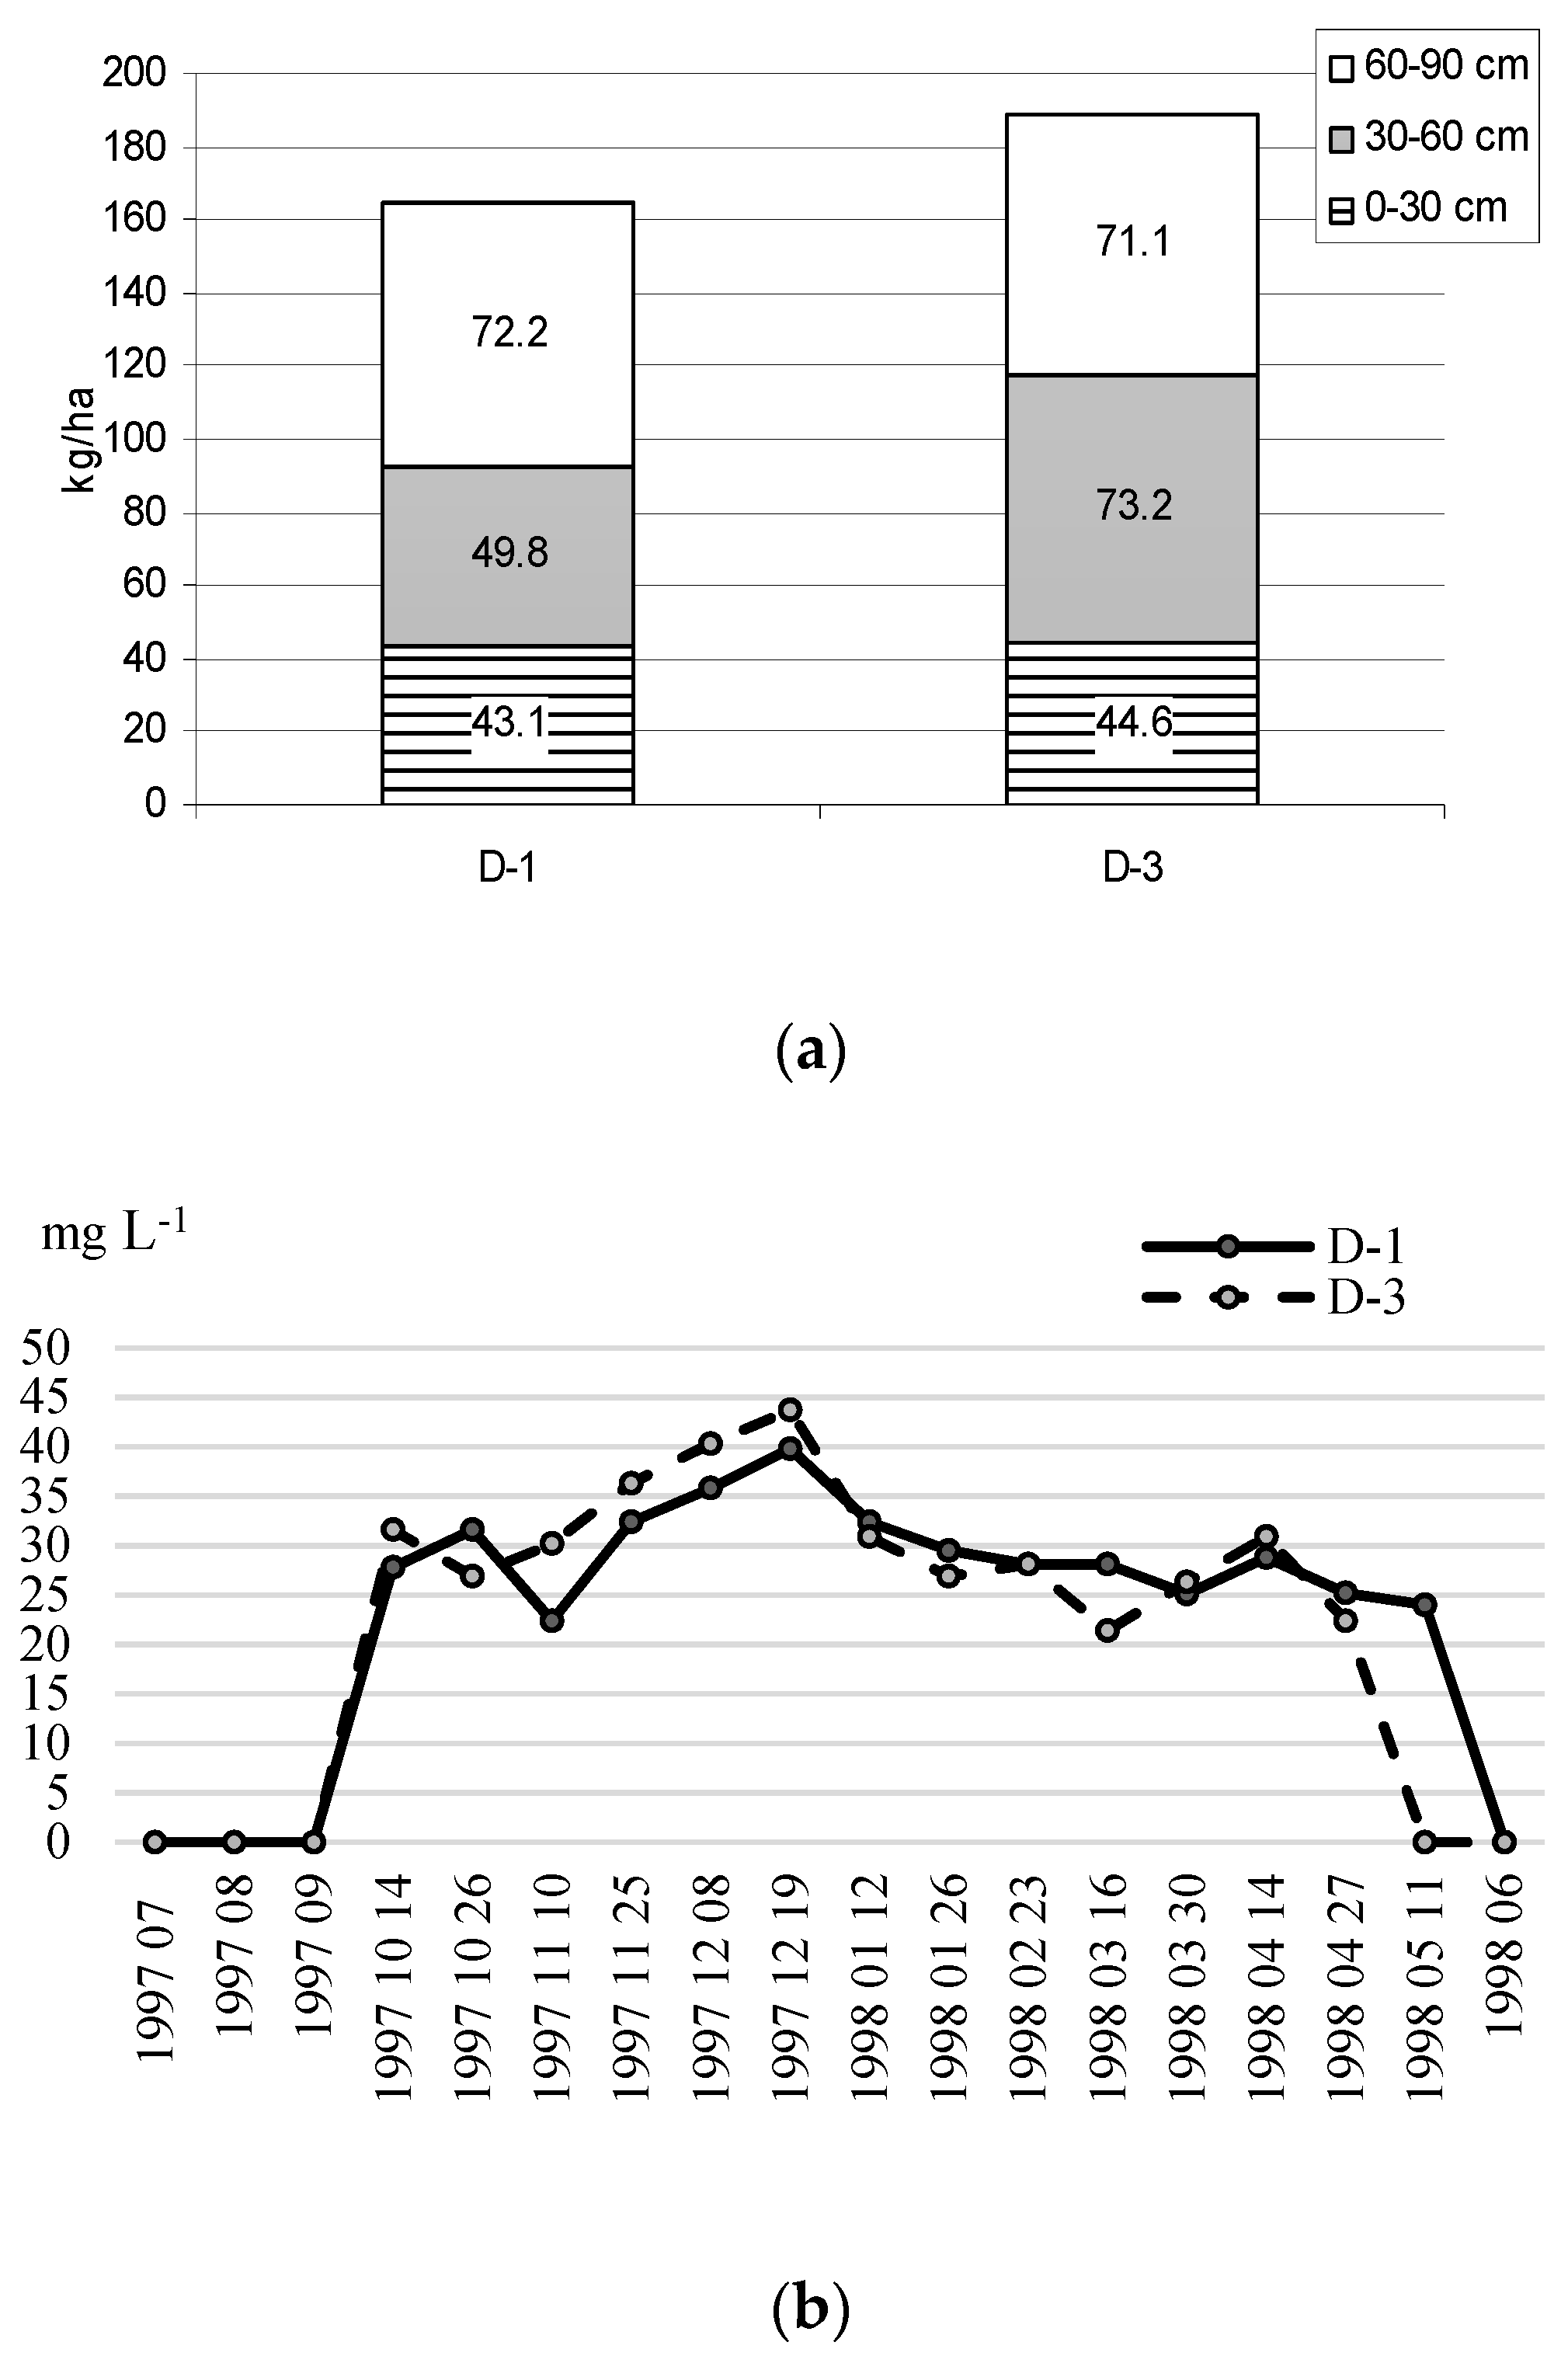
3.3. Measured Drainage Runoff and Leaching of N and P

Luvisols are the prevailing soil type in the Akmena-Danė catchment followed by Albeluvisols made of loam and sandy loam. The soils of agricultural land in the Eketė sub-catchment are mostly Albeluvisols, the second are Luvisols, the third are Gleysols, poor or with low amounts of plant available phosphorus, but medium rich in humus content. Light sandy loam textured soils are dominant in both the catchment and sub-catchment [25,40].
The measured drainage runoff data from two drainage plot sites taken in 1995–1997 and 1995–1999, respectively, has been varied in dependence of annual precipitation amount and soil type (Figure 3).
The Cambisols experienced the highest drainage runoff at all precipitation levels, second highest was the Luvisols, followed by Gleysols and Albeluvisols.
Table 2 shows the effect of soil type and cropping system on the average annual leaching of NO3-N and PO4-P in drainage runoff from the experimental drainage plot site in Vėžaičiai.
The concentration of NO3-N in drainage water was higher in the conventional cropping system than in organic on the average. Statistically significant difference was determined only on Luvisols. The concentration and leaching of phosphorus with drainage runoff in Vėžaičiai site did not depend on soil type, or on the cropping system.
Climate models forecast a shift of the maximum of spring runoff towards winter (from April to March/February) in the 21st century. The shift of spring and autumn runoff maximums towards the winter season and the respective runoff increase between these two maximum points will occur more frequently in the western part of Lithuania. Autumnal high water in some rivers located in this part of the country is forecasted to be almost merged with the spring flood at the end of the century [41]. Thus, more and more extreme years with high autumn-winter precipitation rate and consequently the high N leaching, particularly in NO3-N form, is forecasted for western Lithuania.
The drainage plot research in Akademija site has revealed, that in the years with extremely high autumn–winter precipitation, even with wintering crops, very high NO3-N losses occur with drainage runoff (Figure 4a,b).
The winter wheat was sown in September after early ploughing of 3-year-old ley rich with legumes (red clover). The crop stand was not dense, and the N uptake by the young plants was low. On 28 October, there was already a high content of N inorganic in the soil, particularly in the layers 30–60 and 60–90 cm in two drainage plots D-1 and D-3 with 0 fertilization (Figure 4a). The difference in the accumulated N inorganic in 30–60 cm layer of two plots can be explained by the initial soil density:In D-1 plot it ranged from 1.64 to 1.78 Mg/m3, and in D-3 between 1.65 and 1.92 Mg/m3. The precipitation level during the autumn and winter months was 1.6 times higher than mean and the average air temperature was close to 0 °C most of the winter. This resulted in almost no frozen soil and continuous organic matter mineralization and losses of nutrients with drainage runoff during the entire cold season. The concentrations of NO3-N in runoff of two drained plots have ranged between 25 and 44 mg L−1 (Figure 4b). Thus, the average leaching data from these drainage plots during the entire cold season (autumn, winter and early spring) have shown tremendous losses of N from the soil profile: 100.6 kg ha−1 NO3-N, 0.26 kg ha−1 NH4-N and in total 100.9 kg ha−1 N inorganic on the average. Unlike NO3-N, P-tot concentrations in drainage runoff during the same research period were much lower and ranged from 0.031 to 0.105 mg L−1 in D-1 plot, and from 0.032 to 0.102 in D-3 plot. It shows that mobility of soil phosphorus with drainage runoff was not accelerated by heavier precipitation.

3.4. Simulated by SWAT Model Drainage Runoff

Almost 60% (57.7%) of the Akmena-Danė catchment is tile-drained. The largest (by area) tile-drained agricultural fields are in the upper part of the Eketė (77.8%) and the Šlaveita sub-catchment (74.0%). Tile-drained agricultural areas in other sub-catchments make up from 44.1 to 66.4%. Such large drained land areas result in high drainage runoff which varied from 82.0 to 242.9 mm per year in different sub-catchments. This makes up from 25.3 to 51.2% of the total runoff volume (404 to 512 mm per year). The highest drainage runoff rate was observed in the Eketė sub-catchment (7.7 L/s km2), and the lowest in the upper reaches of the Tenžė sub-catchment (3.7 L/s km2).
High runoff resulted in comparatively large amounts of soluble N and P compounds. The results from the application of SWAT model for the period 1997–2012 have shown (Figure 5), that annual amount of NO3-N reaching the main stream in the sub-catchments ranges from 4.3 to 10.83 kg/ha on the average.
The amount of N-tot, reaching the streams from different sub-catchments by tile-drainage and surface runoff ranges from 7.9 to 16.30 kg/ha per year. Thus, the amount of NO3-N reaching the streams through tile-drainage runoff makes from 51.4 to 67.8% of N-tot loaded annually to the streams. The highest ratio of NO3-N is typical for the Eketė and the Tenžė sub-catchments (63.9–67.8%).
There was less leaching of phosphorus with drainage runoff (Figure 6). The total phosphorus amount reaching the streams by drainage and surface runoff from different sub-catchments ranged from 0.14 to 0.39 kg/ha annually, of that with drainage runoff can leach from 0.031 to 0.095 kg/ha. In total it made up from 18 to 36% of total phosphorus load to the stream runoff water.
The nitrate nitrogen losses were higher in sub-catchments with large areas of tile drainage. Phosphorus concentrations in drainage runoff were low compared with those in surface runoff of both streams. More research needs to be done in the main catchment to better understand how soil, climate, and landscape related factors change in-stream phosphorus concentrations.

3.5. Shrinkage of Agriculture

The forest cover in the Lithuania Pajūrio Lowland is 27%, wetlands and swamps occupy about 2.3% [22]. Agriculture is the primary land use in the Akmena-Danė catchment and especially in the Eketė sub-catchment. Changes in the agricultural and forested land area from 2000 to 2012 are shown in Table 3. The data show a decrease in agricultural land area by 3.2% in the Akmena-Danė catchment and by 6.7% in the Eketė sub-catchment. The forested area slightly increased in both catchment and sub-catchment during 2000–2012.
Farmers and representatives of agricultural companies were surveyed during visits to the area. Summarised results of surveys are shown in Table 4.
The total number of individual farms in the Eketė sub-catchment slightly decreased by two. In 1999–2001, there were 3 agricultural companies that specialised in crop production and animal husbandry. In 2014, there were no agricultural companies.
The animal number and farms with animal production decreased in 2014 as compared with 1999–2001. More than 80% of individual farms were in crop production and <20% of farms were in crop and animal production. The fertilization of crops with organic fertilizers was also higher in 1999–2001 than in 2014, application rate of mineral fertilizers remained unchanged.
Similar results were found in the Sendvaris ward located in the lower and middle reaches of the Eketė River. The total number of farms decreased by 37%. Those farms with animals decreased almost 5 times, and the total number of cattle decreased two times as compared 2010 with 2003 (Figure 7).
Since 2000, one organic farm has been registered in the ward and in the Eketė sub-catchment. This organic farm was still operating in 2014 and specialised in crop husbandry (vegetable growing).

4. Discussion

Certain decreases in nutrient concentrations of rivers flowing via agricultural landscapes have been found in recent years in other European countries: In Sweden [43,44], Latvia [45] and Slovakia [46]. These decreases are most evident in areas where agricultural activities and use of fertilizers have decreased [47]. The analogous situation was observed in different catchments of Lithuania over a decade ago [48,49]. In the Akmena-Danė catchment and the Eketė sub-catchment, we also determined a reduction in agricultural activities, causing the decrease in NH4-N, and partly PO4-P and P-tot concentrations. During 2000–2012, a decrease in agricultural land area in the Akmena-Danė catchment by 3.2%, and by 6.7% in the Eketė sub-catchment, took place. The total number of farms in the lower and middle reaches of Eketė sub-catchment decreased by 37%, these with animals decreased almost five times, and the total number of cattle decreased two times when comparing 2010 with 2003. The forested area during that period slightly increased in both catchment and sub-catchment (by 0.7 and 1.0% consequently) and also supported the decrease in these nutrient concentrations of both rivers.
Other authors [9,50,51,52] determined that with the increase in catchment area, the soluble nitrogen concentrations in the stream water runoff decreased. They explained the phenomenon by the higher impact of ground water discharge in the large catchments. The drainage water is diluted by the ground water, because this water is characterised by higher denitrification and N holding potential. Our research also confirmed this with the NO3-N concentration in the larger Akmena-Danė catchment and the smaller Eketė sub-catchment.
Some of the studies state that amount of nutrients transported via subsurface drainage systems are highly dependent on soil texture. According to [53], nitrogen losses from sandy soils are often twice as high as losses from loam soils. P leaching from the soils is also dependent on the soil type and soil P content [54,55]. Predominate soils on the agricultural land in the studied catchment and sub-catchment were not rich in plant available P2O5.
Still, some researchers consider that climatic factors affect nutrient leaching more than agricultural practices [56].
Researchers from different countries [57,58,59] determined that due to higher precipitation, soil water content and plant vegetation properties, the leaching of soluble mineral compounds with drainage runoff occur early in the spring, or in late autumn, and also during mild winters, when positive air temperatures prevail and soils are early ploughed. These are called “critical seasons” because the concentration of nutrient compounds can be 2–5 times higher than more normal seasons and the nutrient compounds are easily lost. Such a situation was observed in the drainage plot experiment in the Akademija site during the hydrological year of 1997–1998.
It was estimated that in the Graisupis River catchment (middle Lithuania) the drainage runoff during years with medium precipitation rate made up about 20% of all the precipitation, but during the wet and extremely wet years, it reached 40%, and during dry years only 7–10% of total runoff [60].
The correlation–regression analysis of data obtained at the Vėžaičiai drainage plot site showed a significant positive correlation between the leaching of nitrates and the initial soil humus content of the topsoil [40,61]. Other research at the Akademija drainage site also showed that nitrogen leaching depended mostly on the crop, drainage runoff magnitude, soil organic matter/humus, soil inorganic N and autumn ploughing time, and depended less on the amount of applied fertilizers [62].
Research on phosphorus leaching has showed that the concentration of P-tot in the drainage runoff was 3–12 times lower than the concentration of surface runoff water, and the same trend was observed with the transport of suspended particles [63,64]. However, the concentrations of PO4-P might be much higher in the drainage runoff water as compared with surface runoff. Unlike P-tot, N-tot and NO3-N concentrations were many time higher in the drainage runoff water compared to the concentrations in the surface runoff. Those differences might be explained by the different forms of nutrients transported (adsorbed or dissolved). Our research confirmed those findings (see Table 1 and Table 2).
The positive relationship between air and water temperature across both space and time and warmer periods are likely associated with greater concentrations of sediments and nutrients due to the enhancement of the source and mobilisation processes: (1) Soil desiccation and greater soil erodibility [65], (2) agricultural activities that can occur during warmer periods such as tillage, and (3) lower plant canopy cover in drier and warmer months [66,67]. Our research also has shown a tendency of increase in P-tot concentration in the Eketė stream under the higher monthly air temperatures.

5. Conclusions

During 1999–2014, the concentrations of NH4-N and PO4-P significantly decreased in the Eketė River water. The decrease of NH4-N in the Akmena-Danė River water was also significant, but P-tot and PO4-P decrease in this stream was not statistically reliable. The shrinkage of agriculture (decrease in farmland, cancelled activities, drastic reduction in animal number and mixed farming, decrease in organic fertilization and a slight increase in forested land) was the factor that had the most effect on the decrease in NH4-N and to a lesser degree in P-tot in both rivers, and in PO4-P in the Eketė River.
Other N compounds, such as N-tot and NO3-N in the two studied rivers did not change, or slightly increased as NO2-N did in the Eketė River waters. N-tot in the Akmena-Danė River had a significant negative correlation with mean annual air temperature which could be due to the increased denitrification rate.
The SWAT model and the drainage plot experiment results showed that NO3-N and N-tot concentrations in both streams’ water might be related to the drainage runoff from the cultivated fields of the catchment and sub-catchment during the wet and extremely wet years. This factor becomes more important with climate warming and shifting of maximum precipitation rate from warmer to colder season as observed in the studied area from 1999–2014.
The drainage runoff volume in wet years can make from 30 to almost 60% of total precipitation volume depending on the soil type. The soils with the highest drainage runoff as a percent of total precipitation were the Cambisols, second highest were the Luvisols, followed by the Gleysols and Albeluvisols.
The P-tot in Eketė stream water had a strong positive correlation with the mean monthly air temperature. This may be the result of accelerated weathering and soil erodibility with less surface runoff under the higher temperatures.
Additional research needs to be done to establish the effects of site, landscape, soil and climate factors on the fluxes of various P forms in the Akmena-Danė catchment and Eketė sub-catchment.

Author Contributions

A.B. conducted the research in drainage plot experiments in Akademija, supervised the monitoring in the Eketė river sub-catchment and wrote the first draft of the manuscript; A.P. made modelling, calibration and validation with SWAT, analysed obtained data, wrote the chapter on drainage runoff modelling and corrected the draft manuscript; V.L. supervised the monitoring in the main Akmena-Danė river catchment and farmers survey and analyzed the obtained data; M.B. made main mathematical-statistical analysis for this paper and wrote the comments to the summarized statistical data, obtained from the National Statistics, worked with CORINE databases and GIS maps, corrected the draft manuscript; J.P. and D.V. made water and soil samplings, were involved in field expeditions, farmers surveys and analysed obtained data and made tables and graphs for this paper; S.G. conducted research on drainage plots in Vėžaičiai and analysed data obtained including correlation analyses.

Funding

This research was financed by few projects: international “MOMENT” project Subsidy Contract No: WTPB.02.01.00-94-001/09-00 (Vladas Langas), the Research Council of Lithuania for preparation of monography (Angelija Bučienė), and Jolita Petkuvienė, Diana Vaičiūtė, Martynas Bučas are supported by the project PatCHY (No. S-MIP-17-11) funded by the Research Council of Lithuania.

Acknowledgments

We kindly acknowledge Irma Vybernaitė-Lubienė from Klaipėda University Chemical Laboratory and Alvyra Šlepetienė from Chemical Research Laboratory of Lithuanian Research Centre for Agriculture and Forestry for the nutrient analysis, and Angela Kazakevicius from Southern Illinois University College of Agricultural Sciences, for valuable advice and help with the manuscript.

Conflicts of Interest

The authors declare no conflict of interest.

References

  1. Jager, N.W.; Challies, E.; Kochskämper, E.; Newig, J.; Benson, D.; Blackstock, K.; Von Korff, Y. Transforming European Water Governance? Participation and River Basin Management under the EU Water Framework Directive in 13 Member States. Water 2016, 8, 156. [Google Scholar] [CrossRef]
  2. Hoorman, J.; Hone, T.; Sudman, T., Jr.; Dirksen, T.; Iles, J.; Islam, K.R. Agricultural impacts on Lake and stream water quality in Grand Lake St. Marys, Western Ohio. Water Air Soil Pollut. 2008, 193, 309–322. [Google Scholar] [CrossRef]
  3. Povilaitis, A. Phosphorus trends in Lithuanian rivers affected by agricultural non-point pollution. Environ. Res. Eng. Manag. 2004, 4, 17–27. [Google Scholar]
  4. Povilaitis, A.; Lamsodis, R.; Bastienė, N.; Rudzianskaitė, A. Agricultural drainage in Lithuania: A review of practices and environmental effects. Acta Agric. Scand. Sect. B Soil Plant Sci. 2015, 65, 14–29. [Google Scholar] [CrossRef]
  5. Helsinki Commission. Approaches and methods for eutrophication target setting in the Baltic Sea region. In Baltic Sea Environment Proceedings; Helsinki Commission Press: Helsinki, Finland, 2013; Volume 133. [Google Scholar]
  6. Helsinki Commission. Eutrophication in the Baltic Sea—An integrated thematic assessment of the effects of nutrient enrichment and eutrophication in the Baltic Sea region: Executive summary. In Baltic Sea Environment Proceedings; Helsinki Commission Press: Helsinki, Finland, 2009; Volume 115. [Google Scholar]
  7. Iital, A.; Pachel, K.; Deelstra, J. Monitoring of diffuse pollution from agriculture to support implementation of the WFD and the Nitrate Directive in Estonia. Environ. Sci. Policy 2008, 11, 185–193. [Google Scholar] [CrossRef]
  8. Jansons, V.; Busmanis, P.; Dzalbe, I.; Kirsteina, D. Catchment and drainage field Nitrogen balances and nitrogen loss in three agriculturally influenced Latvian watersheds. Eur. J. Agric. 2003, 20, 173–179. [Google Scholar] [CrossRef]
  9. Lagzdins, A.; Jansons, V.; Sudars, R.; Abramenko, K. Scale issues for assessment of nutrient loss from agricultural land in Latvia. Hydrol. Res. 2012, 43, 383–399. [Google Scholar] [CrossRef]
  10. Povilaitis, A.; Šileika, A.S.; Deelstra, J.; Gaigalis, K.; Baigys, G. Nitrogen losses from Small agricultural catchments in Lithuania. Agric. Ecosyst. Environ. 2014, 198, 54–64. [Google Scholar] [CrossRef]
  11. Pengerud, A.; Stålnacke, P.; Bechmann, M.; Blicher-Mathiesen, G.; Iital, A.; Koskiaho, J.; Povilaitis, A. Temporal trends in phosphorus concentrations and losses from agricultural catchments in the Nordic and Baltic countries. Acta Agric. Scand. Sect. B Soil Plant Sci. 2015, 65 (Suppl. 2), 173–185. [Google Scholar] [CrossRef]
  12. Pionke, H.B.; Gburek, W.J.; Sharpley, A.N. Critical source area controls on water quality in an agricultural watershed located in the Chesapeake Basin. Ecol. Eng. 2000, 14, 325–335. [Google Scholar] [CrossRef]
  13. Vagstad, N.; Jansons, V.; Loigu, E.; Deelstra, J. Nutrient losses from agricultural areas in the Gulf of Riga drainage basin. Ecol. Eng. 2000, 14, 435–441. [Google Scholar] [CrossRef]
  14. Vuorenmaa, S.; Rekolainen, S.; Lepistö, A.; Kenttamies, K.; Kauppila, P. Losses of nitrogen and phosphorus from agricultural and forest areas in Finland during the 1980 and 1990. Environ. Monit. Assess. 2002, 76, 213–248. [Google Scholar] [CrossRef] [PubMed]
  15. Anderson, K.A.; Downing, J.A. Dry and wet atmospheric deposition of nitrogen, phosphorus and silicon in an agricultural region. Water Air Soil Pollut. 2006, 176, 351–374. [Google Scholar] [CrossRef]
  16. Ulevičius, V.; Byčenkienė, S.; Senuta, K. Critical loads of sulphur and nitrogen for terrestrial ecosystems in Lithuania. Lith. J. Phys. 2009, 49, 21–28. [Google Scholar] [CrossRef]
  17. Gustafson, A. Simulation of nitrate leaching from arable land in Southern Sweden. Acta Agric. Scand. 1988, 38, 13–23. [Google Scholar] [CrossRef]
  18. Bergstrőm, L.; Jarvis, N.J. Prediction of nitrate leaching losses from arable land under different fertilization intensities using the SOIL-SOILN models. Soil Use Manag. 1991, 7, 79–85. [Google Scholar] [CrossRef]
  19. Povilaitis, A.; Rudzianskaitė, A.; Misevičienė, S.; Gasiūnas, V.; Miseckaitė, O.; Živatkauskienė, I. Efficiency of drainage practices for improving water quality in Lithuania. Trans. ASABE ST Joseph: Am. Soc. Agric. Biol. Eng. 2018, 61, 179–196. [Google Scholar] [CrossRef]
  20. Švedas, A.; Šleinys, R.; Ežerinskas, V. Plant nutrient leaching. In Soils of Lithuania; Eidukevičienė, M., Vasiliauskienė, V., Eds.; Lietuvos mokslas: Vilnius, Lithuania, 2011; pp. 750–762. [Google Scholar]
  21. Rudzianskaite, A.; Miseviciene, S. Nitrate nitrogen leaching in different agroecosystems (in karst zone and Middle Lithuania). J. Water Land Dev. 2005, 9, 123–133. [Google Scholar]
  22. Meilutytė-Barauskienė, D.; Kovalenkovienė, M.; Irbinskas, V. Water resources of Lithuania rivers and their relation to climate change. Geografija 2008, 44, 1–8. [Google Scholar]
  23. European Environmental Agency & Copernicus Land Monitoring Services. Validation of CORINE Land Cover Products–Summary of Preliminary Results. 2015. EEA/MDI/14/010. Available online: https://land.copernicus.eu/pan-european/corine-land-cover/clc-2012/view (accessed on 15 May 2018).
  24. QGIS Development Team. QGIS Geographic Information System, Open Source Geospatial Foundation. 2009. Available online: http://qgis.org (accessed on 6 June 2018).
  25. Näslund, C.; Langas, V.; Kinga Skuza, K. Water Management in Lithuania, Poland and Sweden—Comparisons of the EU Water Framework Directive in Practice; Report No 8; Web-based publication by Blekinge County Authority: Karlskrona, Sweden, 2012; ISSN 1651-8527. [Google Scholar]
  26. Egner, H.; Riehm, H.; Domingo, W.R. Untersuchungen über die chemische Bodenanalyse als Grundlage für die Beurteilung des Nährstoffzustandes der Boden, II Chemische Extractionsmethoden zur Phospor-und Kaliumbestimmung. Ann. R. Agric. Coll. 1960, 26, 199–215. [Google Scholar]
  27. Results of the Census of Agriculture 2003 in Lithuania; Department of Statistics to the Government of the Republic of Lithuania: Vilnius, Lithuania, 2005. Available online: https://osp.stat.gov.lt/documents/10180/204989/2003_ZUS_rezultatai.pdf/c895b871-20f9-435a-8b04-651d9fac1504 (accessed on 4 April 2018).
  28. Results of the Agricultural Census of the Republic of Lithuania 2010; Department of Statistics to the Government of the Republic of Lithuania: Vilnius, Lithuania, 2012. Available online: https://osp.stat.gov.lt/documents/10180/204989/2010_ZUS_rezultatai.pdf/47181188-ad5c-4c7c-9b4f-2cd542714007 (accessed on 4 April 2018).
  29. European Environmental Agency. CORINE Land Cover; European Environmental Agency: Luxembourg, 2000; Available online: https://land.copernicus.eu/pan-european/corine-land-cover/clc-2000/view (accessed on 11 May 2018).
  30. Arnold, J.G.; Kiniry, J.R.; Srinivasan, R.; Williams, J.R.; Haney, E.B.; Neitsch, S.L. SWAT—Soil and Water Assessment Tool; Input/Output Documentation Version; Texas Water Resources Institute TR-439: College Station, TX, USA, 2012. [Google Scholar]
  31. Arnold, J.G.; Kiniry, J.R.; Srinivasan, R.; Williams, J.R.; Haney, E.B.; Neitsch, S.L. SWAT—Soil and Water Assessment Tool. In U.S. Department of Agriculture, Agricultural Research Service; Documentation Version 2009, Technical report No. 406; Texas Water Resources Institute: College Station, TX, USA, 2011. [Google Scholar]
  32. PAIC. Renewal of SWAT Modelling System; Report No. 141278; SIA “Procesu analīzes un izpētes centrs”: Rīga, Latvia; Vilnius, Lithuania, 2014; 146p. [Google Scholar]
  33. Aplinkos Apsaugos Agentūra. Nemuno, Lielupės, Ventos ir Dauguvos Upių Baseinų Rajonų Valdymo Planų, Priemonių Programų ir kitų Reikiamų Dokumentų Vandensaugos Tikslams Nustatyti Parengimas ir Atnaujinimas; Protection Report No.4; Environment Protection Agency: Washington, DC, USA, 2015. [Google Scholar]
  34. Arnold, J.G.; Allen, P.M. Automated methods for estimating baseflow and groundwater recharge from streamflow records. J. Am. Water Resour. Assoc. 1999, 35, 411–424. [Google Scholar] [CrossRef]
  35. Moriasi, D.N.; Arnold, J.; Van Liew, M.W.; Bingner, R.; Harmel, R.D.; Veith, T.L. Model evaluation guidelines for systematic quantification of accuracy in watershed simulations. Trans. ASABE 2007, 50, 885–900. [Google Scholar] [CrossRef]
  36. PAIC. SWAT Calibration, Part 3; Report No. 141278; SIA “Procesu analīzes un izpētes centrs”: Rīga, Latvia; Vilnius, Lithuania, 2014; 168p. [Google Scholar]
  37. Zuur, A.F.; Ieno, E.N.; Smith, G.M. The Analysis of Ecological Data; Springer Science & Business Media LLC: New York, NY, USA, 2007; 672p. [Google Scholar]
  38. R Core Team. R: A Language and Environment for Statistical Computing; R Foundation for Statistical Computing: Vienna, Austria, 2018; Available online: https://www.R-project.org/ (accessed on 11 January 2019).
  39. Bukantis, A.; Rimkus, E. Climate variability and change in Lithuania. Acta Zool. Litu. 2005, 15, 100–104. [Google Scholar] [CrossRef]
  40. Gužys, S. The Analysis of Connection between Crop Yield and Cropping Systems as well as Soil and Water Properties; Summary of Doctoral Dissertation: Akademija, Lithuania, 1999. [Google Scholar]
  41. Kilkus, K.; Štaras, A.; Rimkus, E.; Valiuškevičius, G. Changes in Water Balance Structure of Lithuanian Rivers under Different Climate Change Scenarios. Environ. Res. Eng. Manag. 2006, 2, 3–10. [Google Scholar]
  42. Results of the Farmers’ Survey from the Expeditions in the Eketė Sub-Catchment and the Akmena-Danė Catchment in 1999–2001 and 2014; Klaipėda University, Department of Social geography: Klaipėda, Lithuania, 2015.
  43. Ulén, B.; Fölstrer, J. Recent trends in nutrient concentrations in Swedish agricultural rivers. Sci. Total Environ. 2007, 373, 473–487. [Google Scholar] [CrossRef] [PubMed]
  44. Andersson, I.; Petersson, M.; Jarsjö, J. Impact of the European Water Framework Directive on local-level water management: Case study Oxunda catchment, Sweden. Land Use Policy 2012, 29, 73–82. [Google Scholar] [CrossRef]
  45. Stålnacke, P.; Grimvall, A.; Libiseller, C.; Laznik, M.; Kokorite, I. Trends in nutrient concentration in Latvian rivers and response to the dramatic change in agriculture. J. Hydrol. 2003, 283, 184–205. [Google Scholar] [CrossRef]
  46. Zeleňáková, M.; Čarnogurská, M.; Šlezingr, M.; Słyś, D.; Purcz, P. A model based on dimensional analysis for prediction of nitrogen and phosphorus concentrations at the river station Ižkovce, Slovakia. Hydrol. Earth Syst. Sci. 2013, 17, 201–209. [Google Scholar] [CrossRef]
  47. Bendíková, M.; Švecová, A. Sources of Pollution in Watersheds and Environmental Risks. Zeszyty naukowe: Budownictvo i inžyniera šrodowiska 2004, 2, 41–46. [Google Scholar]
  48. Povilaitis, A. Impact of agriculture decline on nitrogen and phosphorus loads in Lithuanian rivers. Ekologija 2006, 1, 32–39. [Google Scholar]
  49. Šileika, A.S.; Gaigalis, K.; Kutra, G.; Šmitienė, A. Factors affecting N and P losses from small catchments (Lithuania). Environ. Monit. Assess. 2005, 102, 359–374. [Google Scholar] [CrossRef] [PubMed]
  50. Deelstra, J.; Iital, A.; Povilaitis, A.; Kyllmar, K.; Greipsland, I.; Blicher-Mathiesen, G.; Lagzdins, A. Hydrological pathways and nitrogen runoff in agricultural dominated catchments in Nordic and Baltic countries. Agric. Ecosyst. Environ. 2014, 195, 211–219. [Google Scholar] [CrossRef]
  51. Deelstra, J.; Kverno, S.H.; Granlund, K.; Šileika, A.S.; Gaigalis, K.; Kyllmar, K.; Vagstad, N. Runoff and nutrient losses during winter periods in cold climates—requirements to nutrient simulation models. J. Environ. Monit. 2009, 11, 602–609. [Google Scholar] [CrossRef] [PubMed]
  52. Šleinys, R.; Rimšelis, J. Cheminių medžiagų migracija įvairiuose daugiametėmis žolėmis užimtuose dirvožemiuose. Žemdirbystė Moksl. Darb. 1998, 61, 14–25. [Google Scholar]
  53. Djodjic, F.; Börling, K.; Bergström, L. Phosphorus leaching in relation to soil type and soil phosphorus content. J. Environ. Qual. 2004, 33, 678–684. [Google Scholar] [CrossRef] [PubMed]
  54. Stålnacke, P.; Bechmann, M. Trends in nutrient runoff from agricultural basins in Norway. Agricultural effects on ground and surface waters. Res. Sci. Soc. 2002, 273, 267–271. [Google Scholar]
  55. Bučienė, A.; Antanaitis, Š.; Mašauskienė, A.; Šimanskaitė, D. Nutrients N, P losses with drainage runoff and field balance as a result of crop management. Commun. Soil Sci. Plant Anal. 2007, 38, 2177–2195. [Google Scholar] [CrossRef]
  56. Burt, T.P.; Heathwaite, A.L.; Trudgill, S.T. Nitrate Processes, Patterns and Management; John Wiley and Sons Ltd.: Chichester, UK, 1993; 444p. [Google Scholar]
  57. Tunney, H.; Carton, O.T.; Brookes, P.C.; Johnson, A.E. Phosphorus Loss from Soil to Water; CAB International: Wallingford, UK, 1997; 467p. [Google Scholar]
  58. Francis, G.S.; Haynes, R.J.; Williams, P.H. Effects of the timing of ploughing-in temporary leguminous pastures and two winter cover crops on nitrogen mineralization, nitrate leaching and spring wheat growth. J. Agric. Sci. 1995, 124, 1–9. [Google Scholar] [CrossRef]
  59. Bučienė, A.; Gaigalis, K. Chemical composition of wet deposits and drainage runoff in the agroecosystems: A case of Middle Lithuania. Baltica 2012, 25, 153–162. [Google Scholar] [CrossRef]
  60. Juozapaitis, A. Nuotėkio metinio pasiskirstymo pakitimai drenažu nusausintuose upelių baseinuose. Mokslo ir technikos progresas melioracijoje. Liet. Hidrotech. Melior. Moksl. Tyrim. Inst. Darb. 1976, 10, 219–226. [Google Scholar]
  61. Gužys, S. Ecological estimation of cropping intensity. Ekologija 2002, 4, 39–48. [Google Scholar]
  62. Kvaerno, S.H. Pathways and nutrient loss in four field-scale catchments. In Agriculture and Environment—Long Term Monitoring in Norway; Bechmann, M., Deelstra, J., Eds.; Akademika Publishing: Trondheim, Norway, 2013; pp. 179–196. [Google Scholar]
  63. Bechmann, M. Long-term monitoring of nitrogen in surface and subsurface runoff from small agricultural dominated catchments in Norway. Agric. Ecosyst. Environ. 2014, 195, 220–232. [Google Scholar] [CrossRef]
  64. Bučienė, A. On the Sustainability of Different Farming Systems: Conventional, Organic and Integrated Systems. In Sustainable Agriculture; Jakobsson, C., Ed.; Baltic University Programms, Uppsala University: Uppsala, Sweden, 2012; pp. 17–26. [Google Scholar]
  65. Lintern, A.; Webb, J.A.; Ryu, D.; Liu, S.; Bende-Michl, U.; Waters, D.; Leahy, P.; Wilson, P.; Western, A.W. Key factors influencing differences in stream water quality across space. WIREs Water 2018, 5, e1260. [Google Scholar] [CrossRef]
  66. Wood, P.A. Controls of variation in suspended sediment concentration in the River Rother, West Sussex, England. Sedimentology 1977, 24, 437–445. [Google Scholar] [CrossRef]
  67. Guo, D.; Lintern, A.; Webb, J.A.; Ryu, D.; Liu, S.; Bende-Michl, U.; Western, A.W. Key Factors Affecting Temporal Variability in Stream Water Quality. Water Resour. Res. 2019, 55, 112–129. [Google Scholar] [CrossRef] [Green Version]
Figure 1. The catchment of the Akmena-Danė with the Eketė sub-catchment under the different land use in 2012. The land use from CORINE data was visualized using QGIS (3.4.1) software [23,24].
Water 11 01590 g001
Figure 2. Average annual air temperature and precipitation rate in mm according to the Krantas Meteorological station in Klaipėda 1999–2014 (a); monthly mean precipitation rate per 1999–2014 (b).
Water 11 01590 g002
Figure 3. The measured drainage runoff volume in % of annual precipitation amount in different years (estimated and adopted from 1995–1997 data obtained in Vėžaičiai drainage plot site and from 1995–1999 in Akademija site).
Water 11 01590 g003
Figure 4. Soil N inorganic in the topsoil and subsoil layers on 28 October 1997 after the 3rd year ley ploughing and winter wheat sowing, in kg ha−1 in two drainage plots D-1 and D-3 (a); measured values of NO3-N in mg L−1 in drainage runoff in the same plots with zero fertilization (b) in 1997–1998 hydrological year (data obtained in Akademija site previously not published).
Water 11 01590 g004
Figure 5. Average annual N-tot loss from each the Akmena-Danė River sub-catchment with corresponding loss of NO3-N via tile drainage systems (SWAT model simulations).
Water 11 01590 g005
Figure 6. The share of PO4-P coming via tile drainage systems (right image) to the average annual amount of P-tot entering the Akmena-Danė River (left image) from each sub-catchment (SWAT model simulations).
Water 11 01590 g006
Figure 7. Total number of farms, number of farms with animals and the total number of cattle in all farms of Sendvaris ward from 2003 to 2010. Made using sources [27,28].
Water 11 01590 g007
Table 1. The mean (±standard deviation) concentrations of nutrients in the waters of the Eketė River and the Akmena-Danė River in 1999–2001 and 2014 (statistically significant differences between the means are bolded).
Parameter, mg L−1EketėAkmena-Danė
1999–200120141999–20012014
P-tot0.093 ± 0.0250.078 ± 0.0430.192 ± 0.0390.123 ± 0.065
PO4-P0.047 ± 0.0130.022 ± 0.0130.096 ± 0.0200.064 ± 0.052
NO2-N0.028 ± 0.0130.037 ± 0.028not determined0.052 ± 0.039
NO3-N1.913 ± 0.8841.929 ± 1.8821.650 ± 0.2081.353 ± 0.660
NH4-N0.139 ± 0.1630.010 ± 0.0100.305 ± 0.0310.015 ± 0.008
N-tot2.389 ± 0.9932.333 ± 1.4952.550 ± 0.4042.511 ± 0.607
Table 2. Mean measured concentration of NO3-N and PO4-P in drainage runoff in mg L−1 per year from 1995 to 1997 in different soils and cropping intensity, Vėžaičiai site (statistically significant differences between the means are bolded).
AlbeluvisolsLuvisolsGleysols
OrgConOrgConCon
NO3-N10.5 ± 1.4212.4 ± 0.719.8 ± 2.1117.5 ± 2.909.8 ± 4.55
PO4-P0.020 ± 0.0090.020 ± 0.0060.020 ± 0.0050.016 ± 0.0080.020 ± 0.004
Note: org—organic cropping system; con—conventional (traditional intensive) cropping system. These results were estimated using initial data from the dissertation of S. Gužys [40].
Table 3. Land use data according to CORINE database in the Akmena-Danė catchment and the Eketė sub-catchment in 2000 and 2012.
ParameterEketė Sub-CatchmentAkmena-Danė Catchment
2000201220002012
Total area, ha9330933059,34959,349
Utilised agricultural land, h6245561927,53225,628
%66.960.246.443.2
Forested area, ha1263135718,44918,874
%13.514.531.131.8
Sources: [24,29].
Table 4. Farms and farming intensity in the Eketė sub-catchment according to the summarised results of Farm Surveys in 1999–2001 and 2014.
Situation in 1999–2001Situation in 2014Change
Number of individual farms (i.f.)22202 i.f. cancelled farming
Number of agricultural companies (a.c.)33 a.c. cancelled farmingNo a.c. functioning
Arable land, %In a.c. it ranged from 60 to 100% of total farmland; in i.f.—from 11 to 100%Increased in i.f.—from 50 to 100%;The total farmland area decreased, but % of arable land increased in the rest i.f.
Grown animalsCows and pigs in all a.c. and cows in 80% of i.f.No animals in a.c.; cows remained in 50% of i.f.The decrease in total animal number was somewhat >75%+
Mineral fertilizer rate, kg/ha60 (NPK)60 (NPK)Remained the same
Organic fertilizer rate, t/haRanged from 30 to 7030–40Decreased
Source: [42].

