Multiple Effects of Intense Meteorological Events in the Benevento Province, Southern Italy

 , , , and
Abstract
:
1. Introduction
2. Materials and Methods
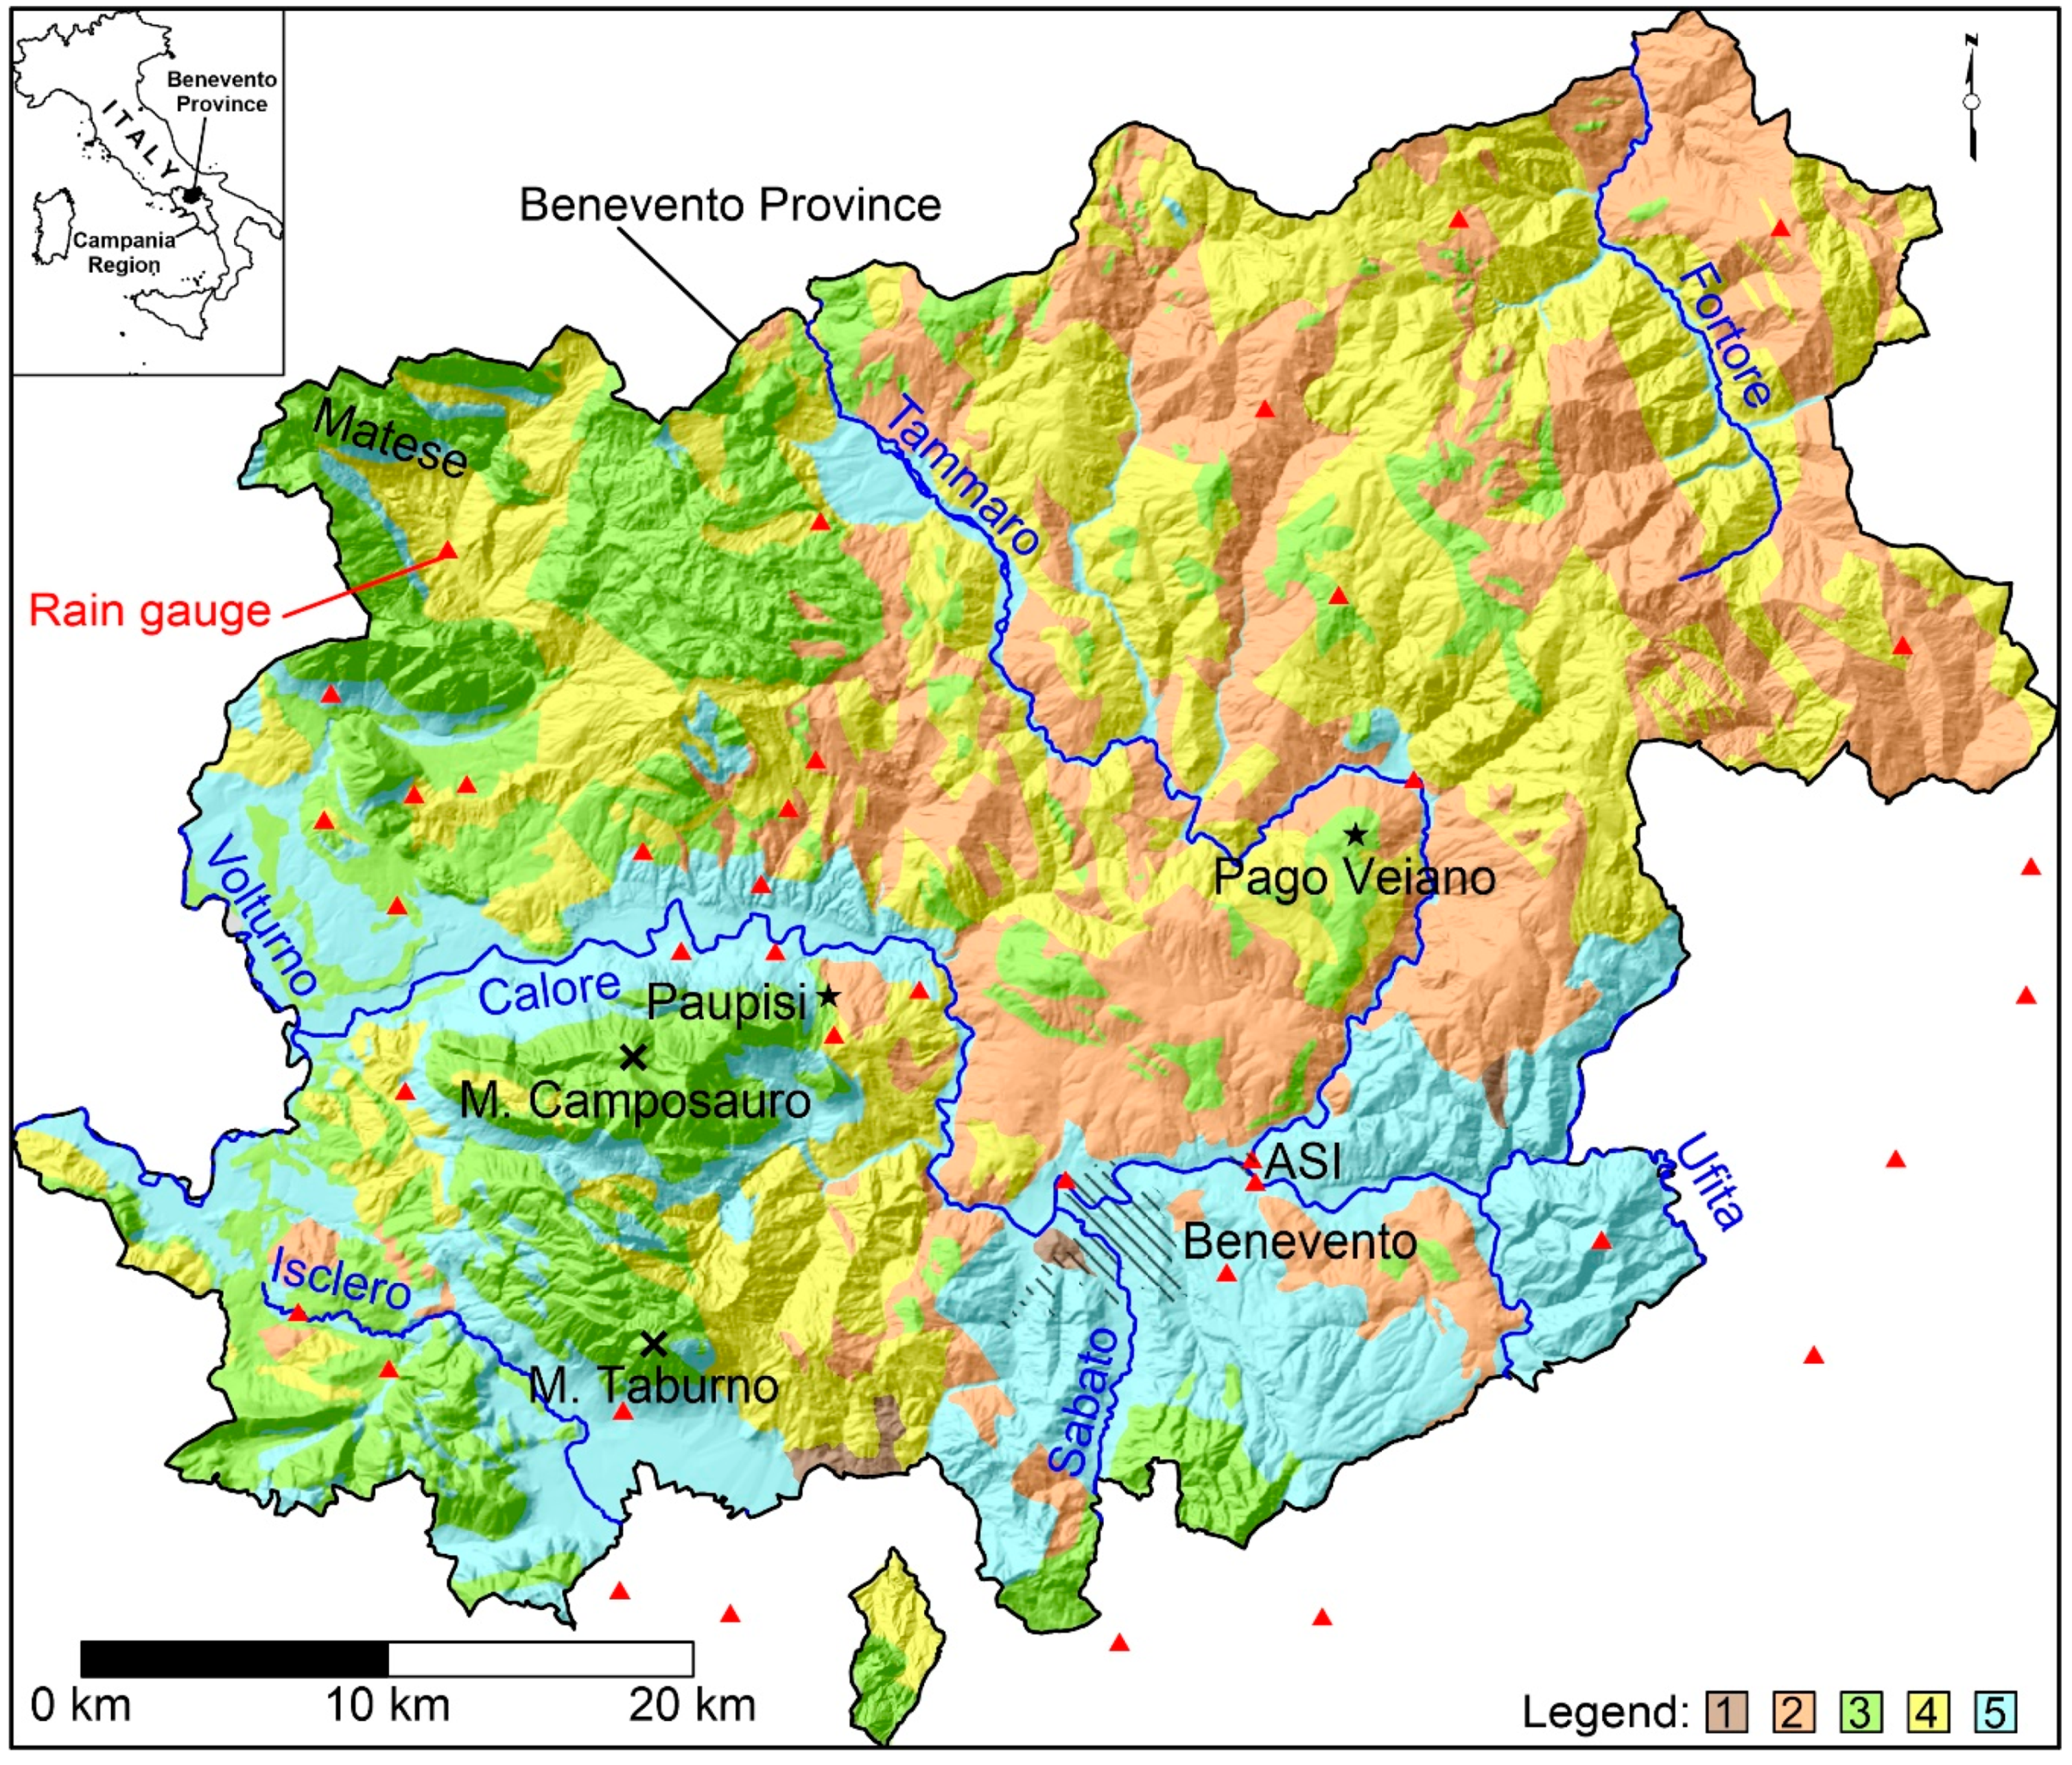
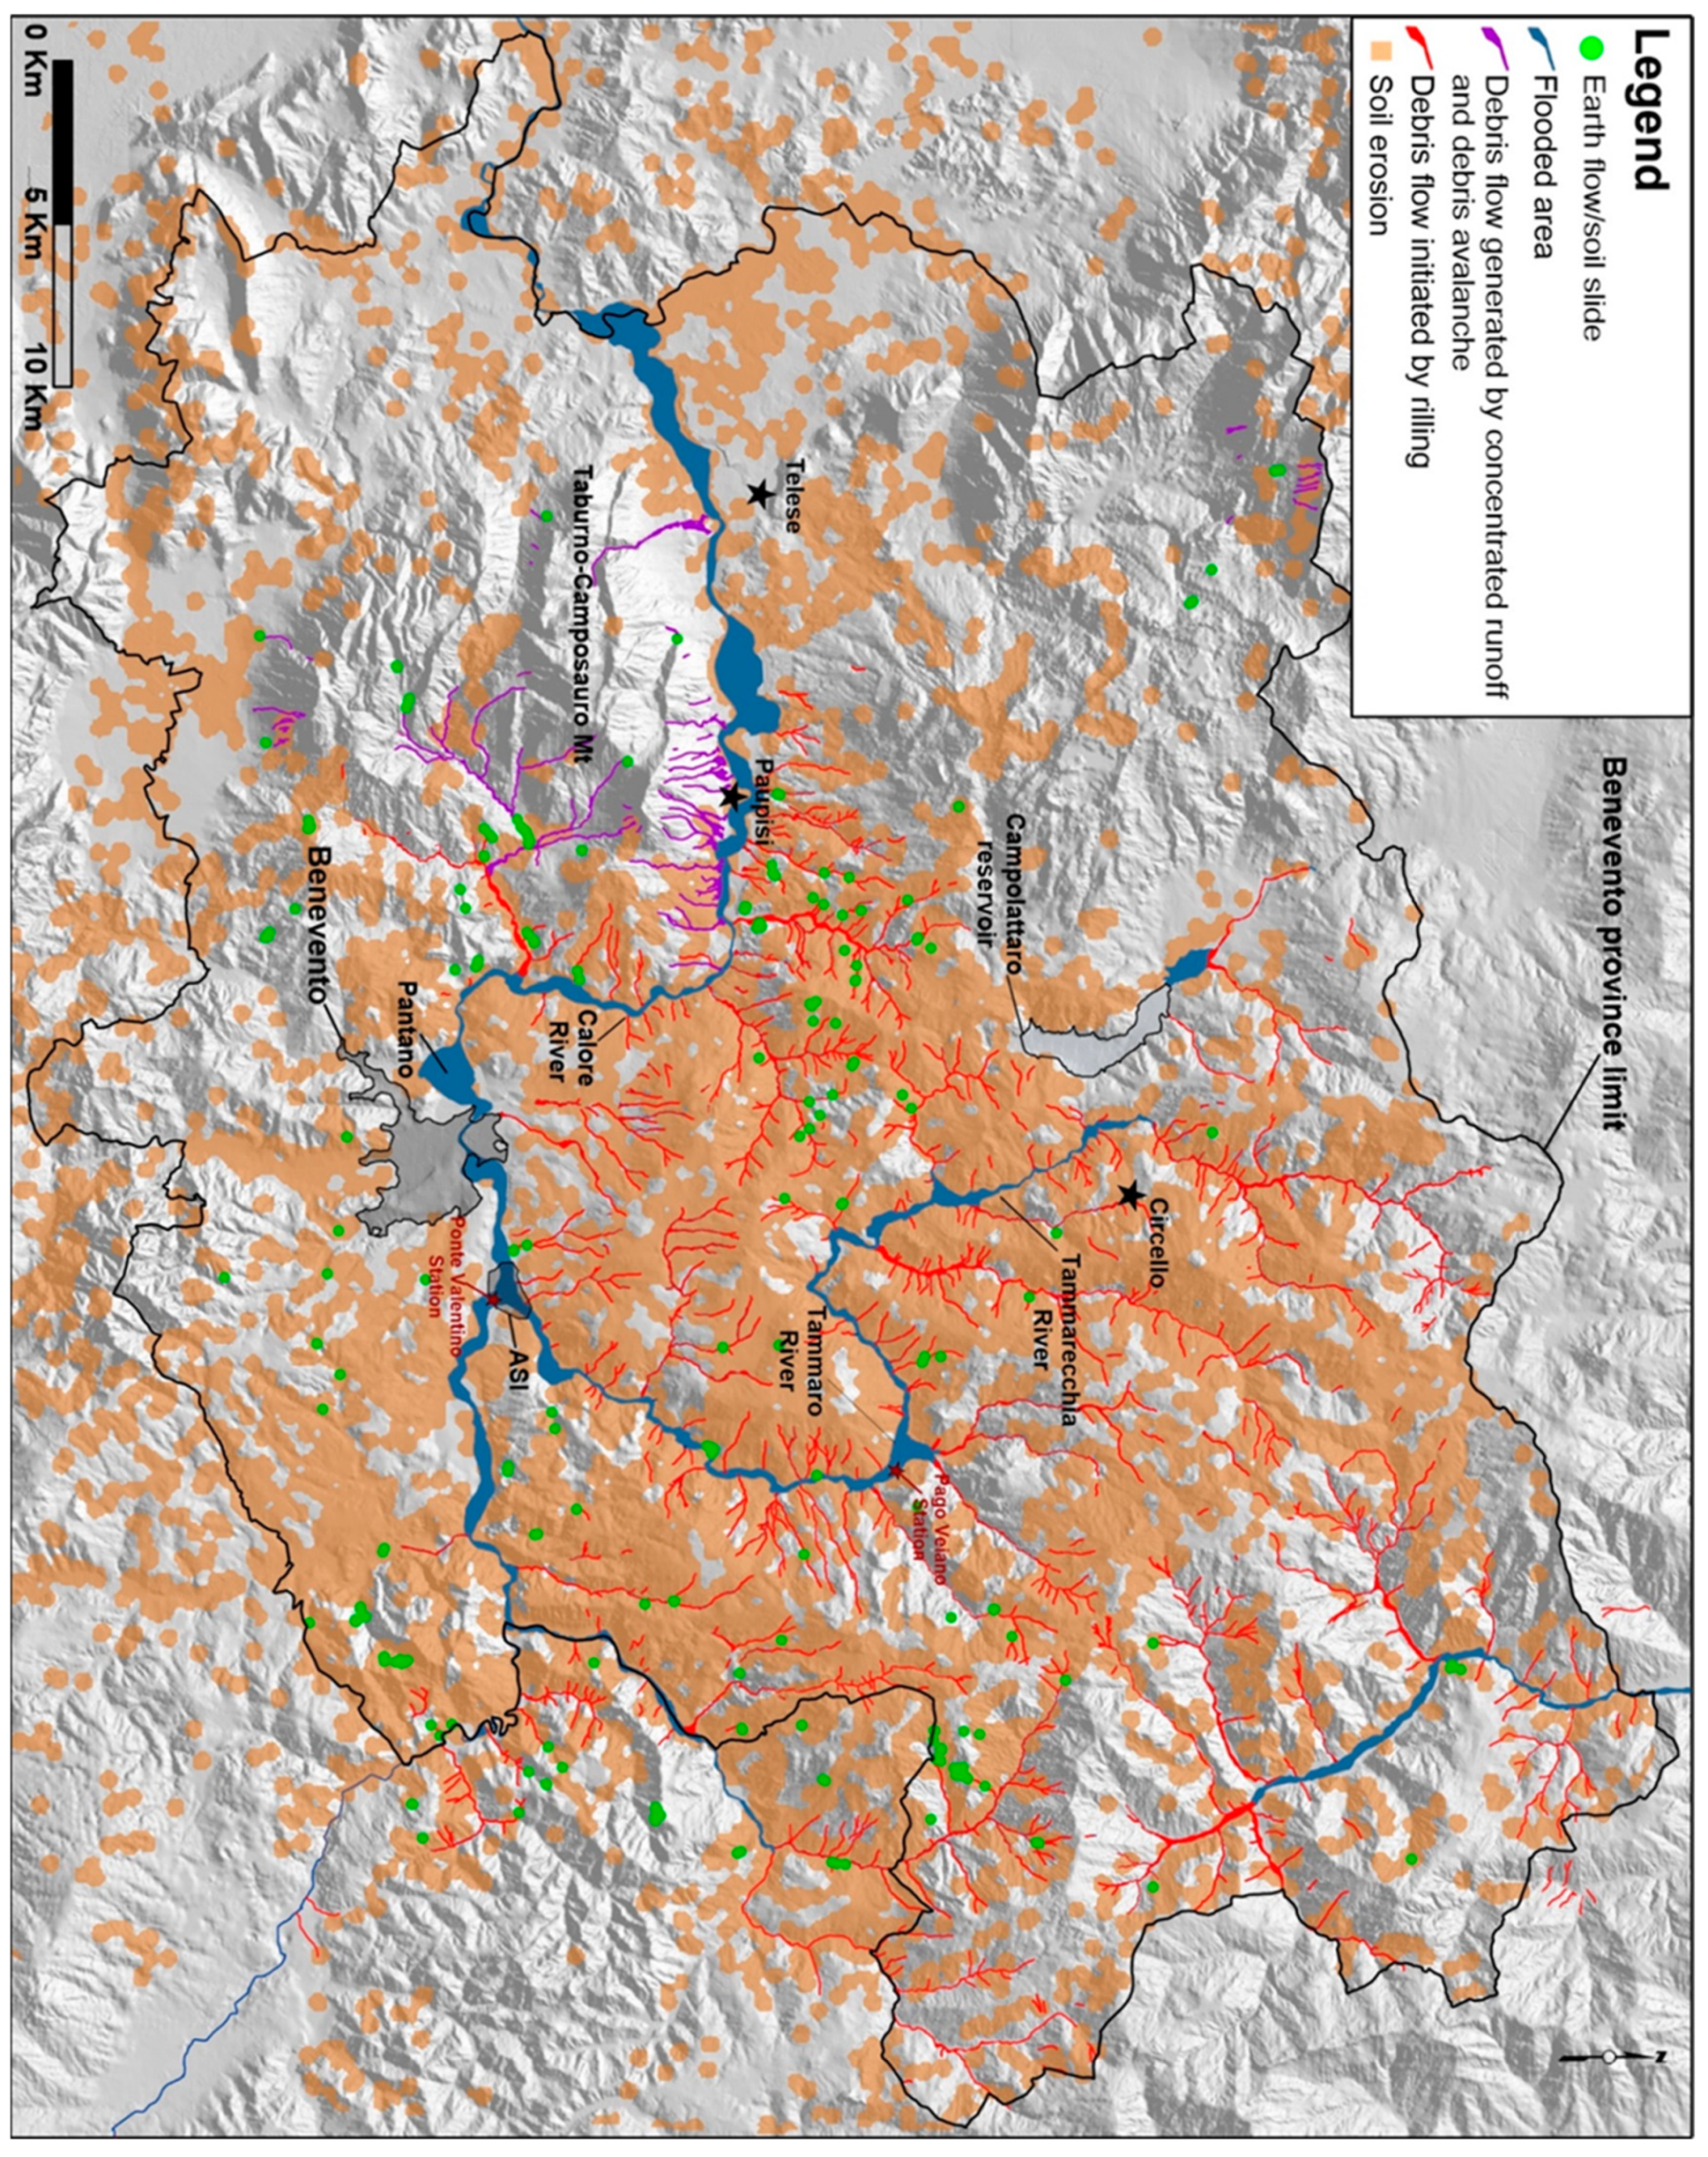
2.1. Study Area
- The western sector is dominated by high-energy calcareous–dolomitic mountain chains (e.g., the Taburno-Camposauro massif). This part of the province is characterized by steep slopes and sparse vegetation;
- The southeastern and central part is predominated by fluvial valleys in which the major rivers flow. This section is filled with terrigenous deposits that mainly consist of Plio-Pleistocene clay, sandstone, and conglomerate successions.
2.2. Hydrological Data and Statistical Analyses
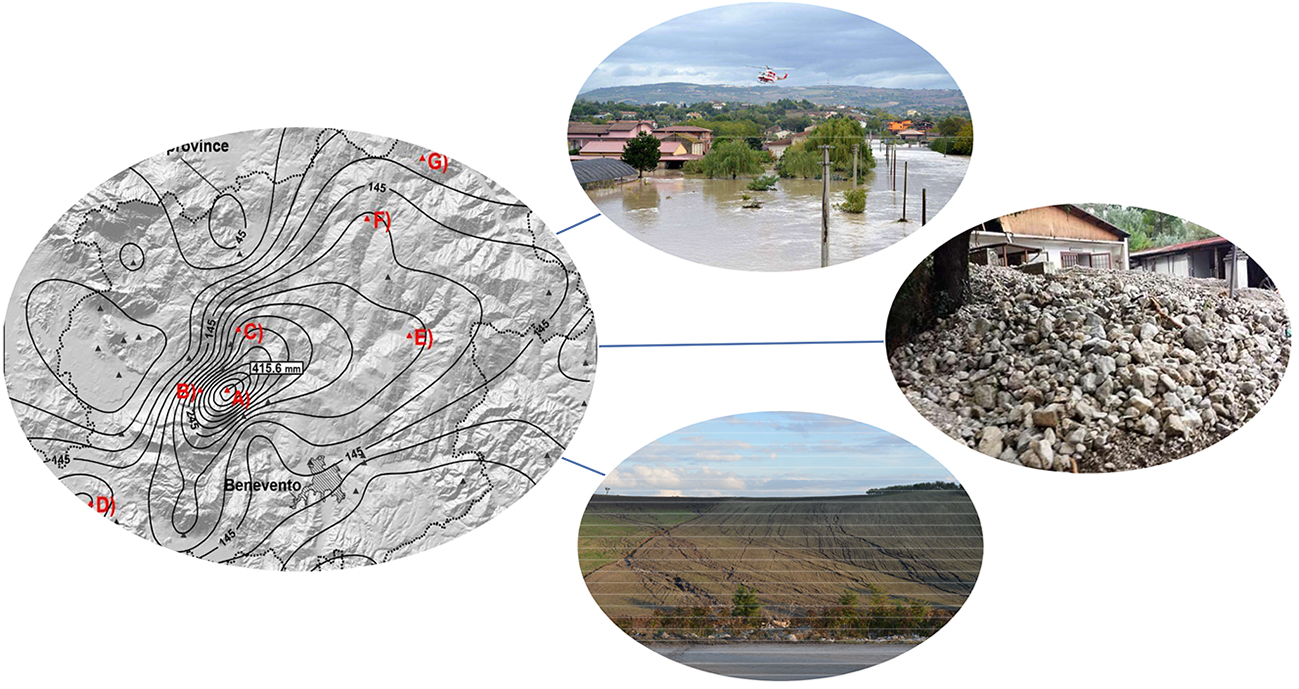
2.3. Effects of the Storms
3. Results
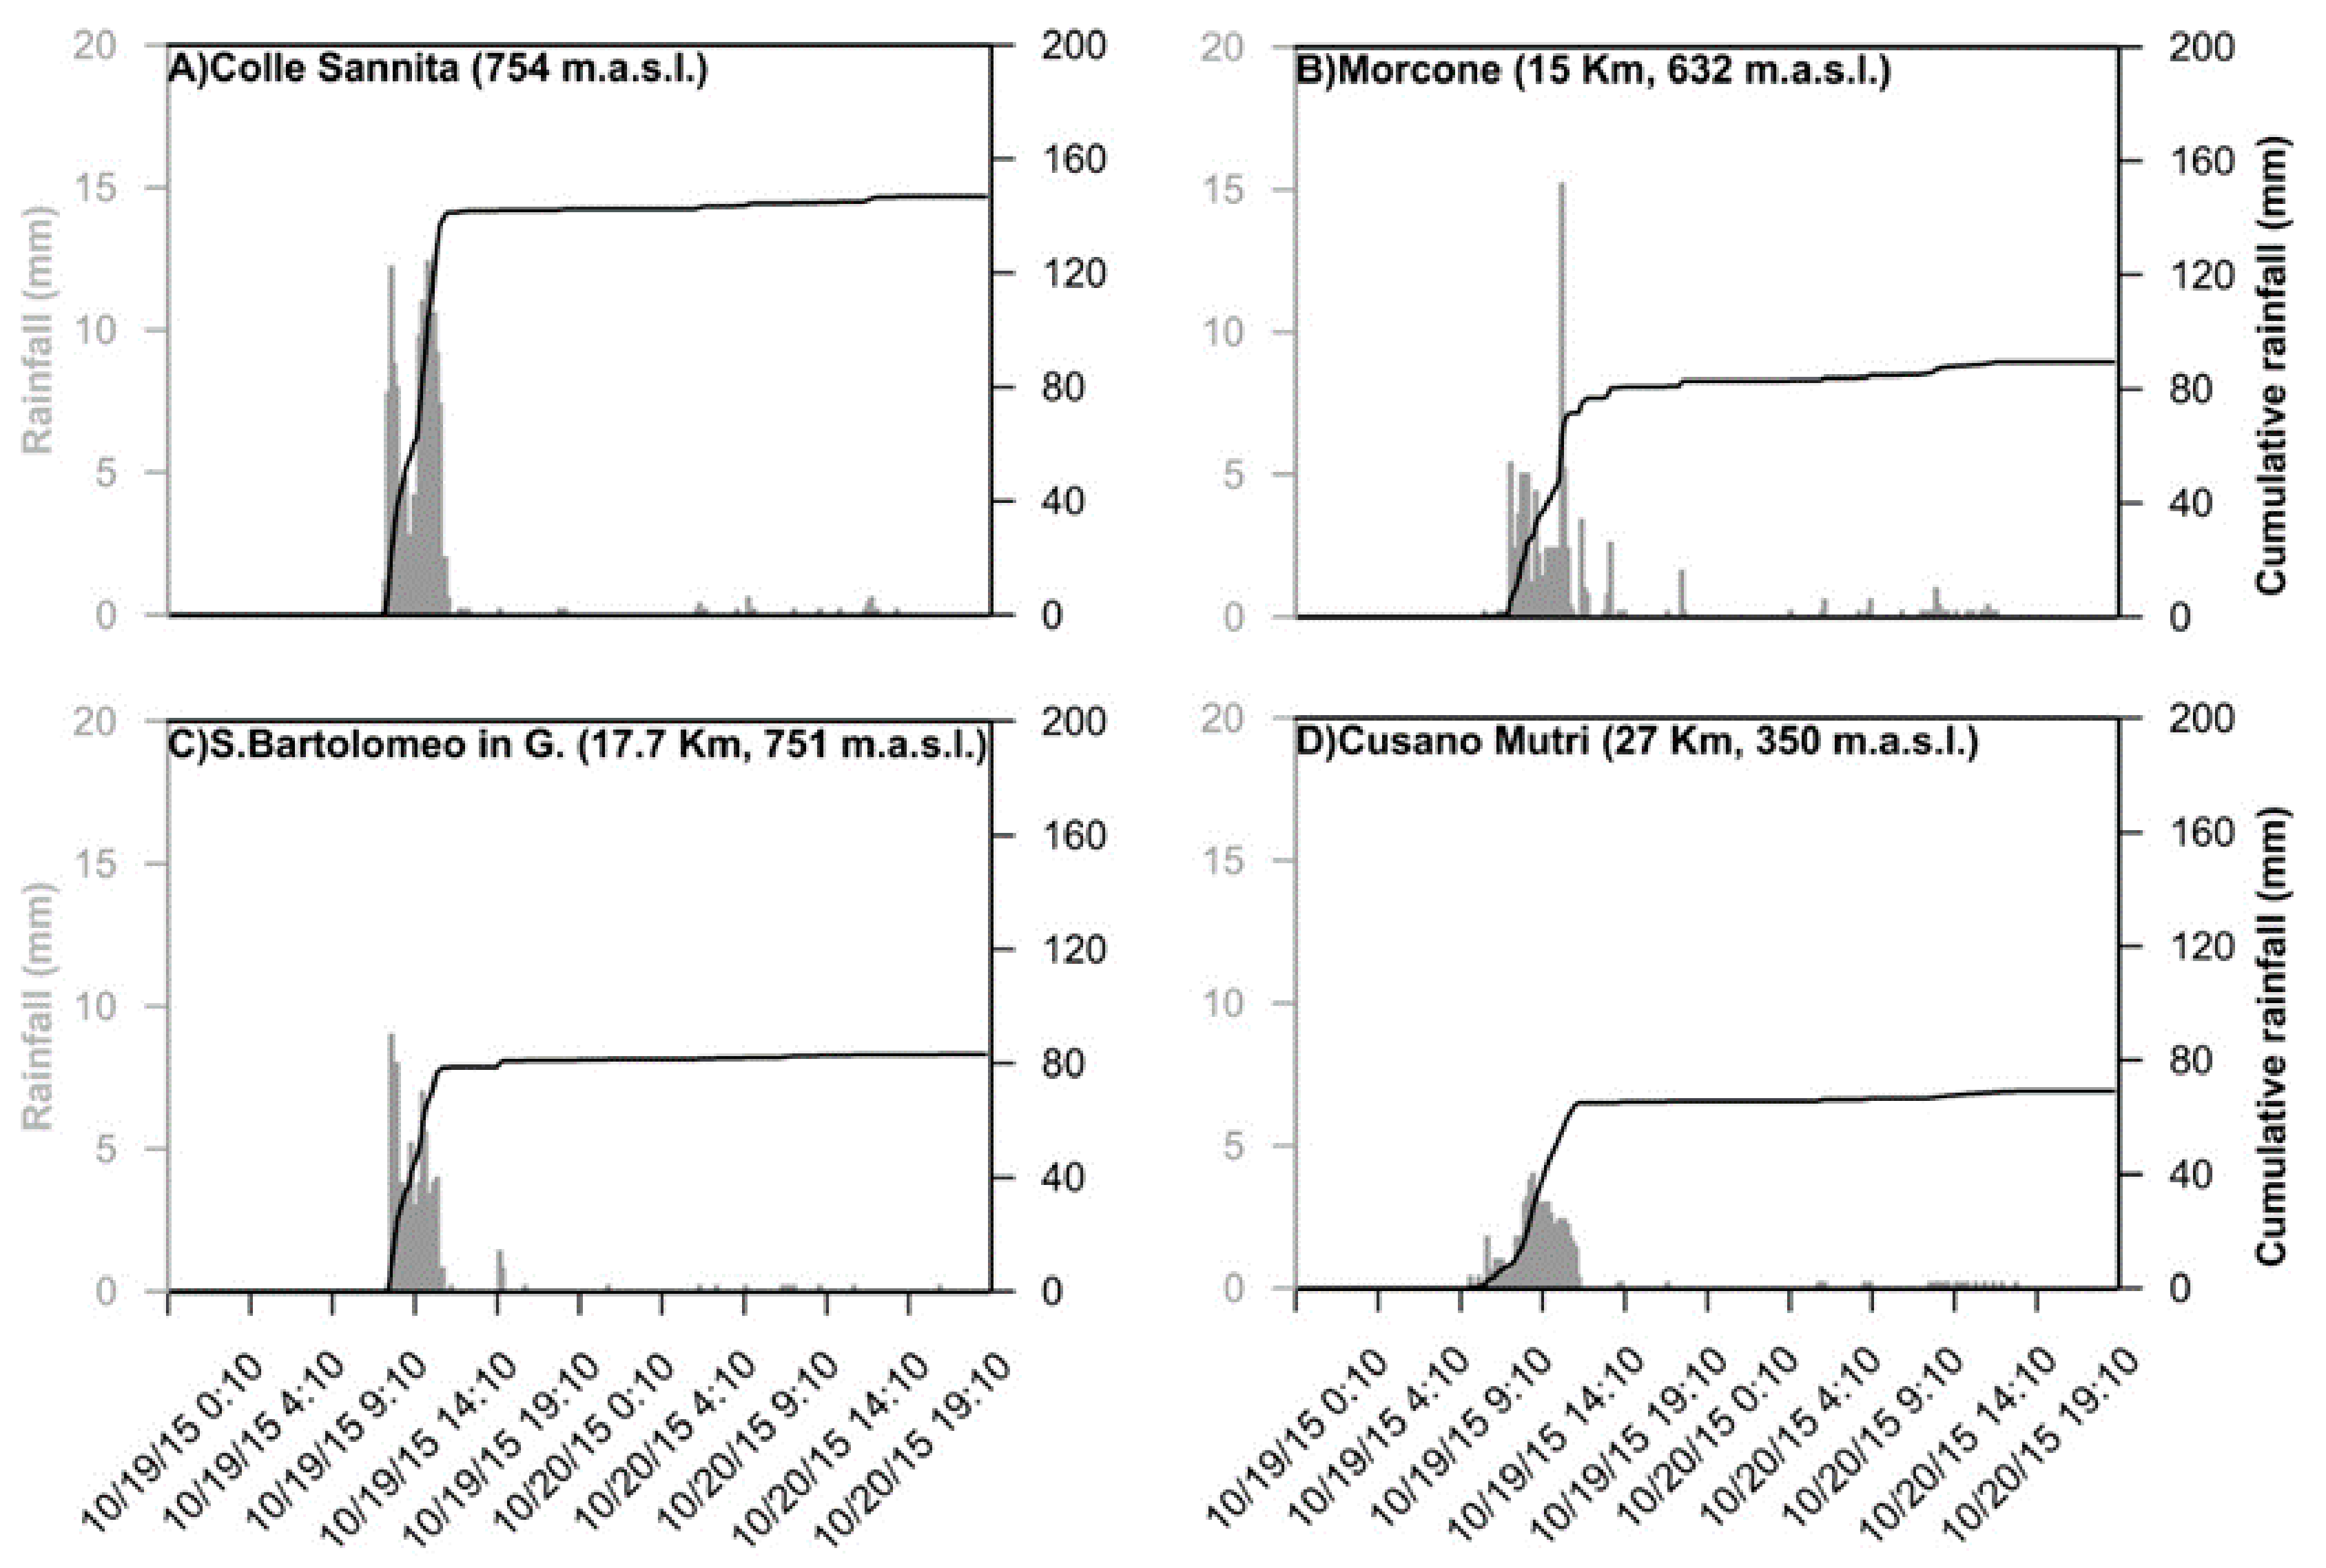
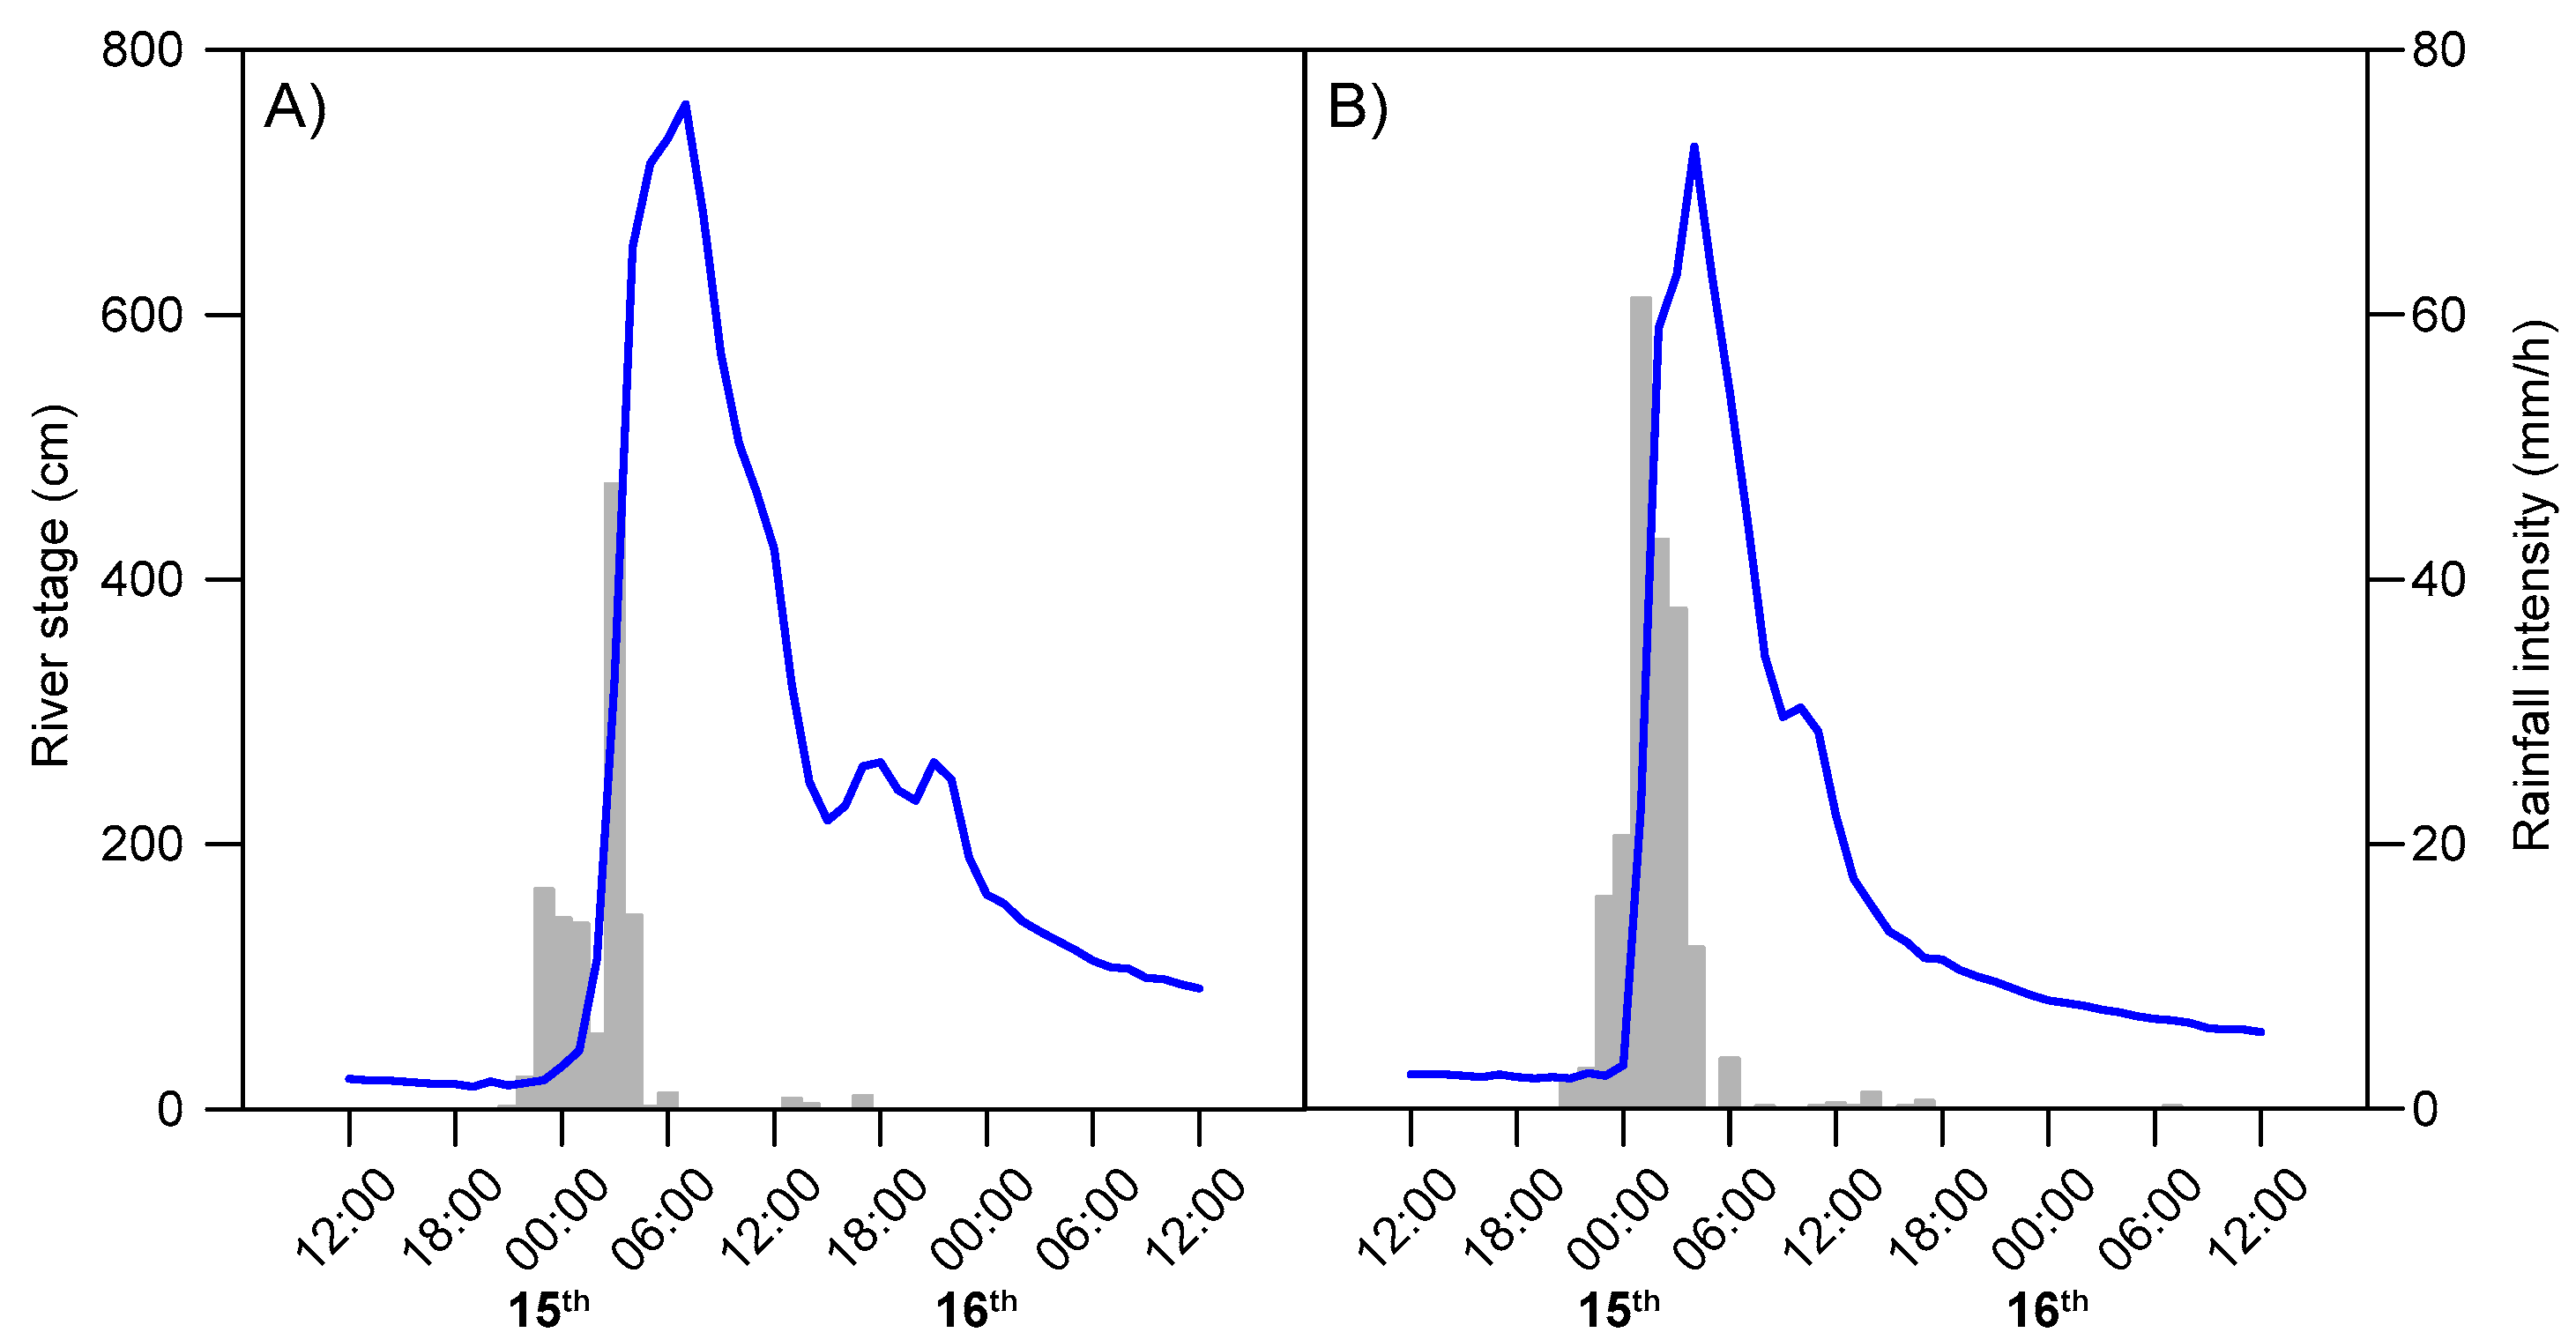
3.1. Spatial and Temporal Characteristics of the Storms
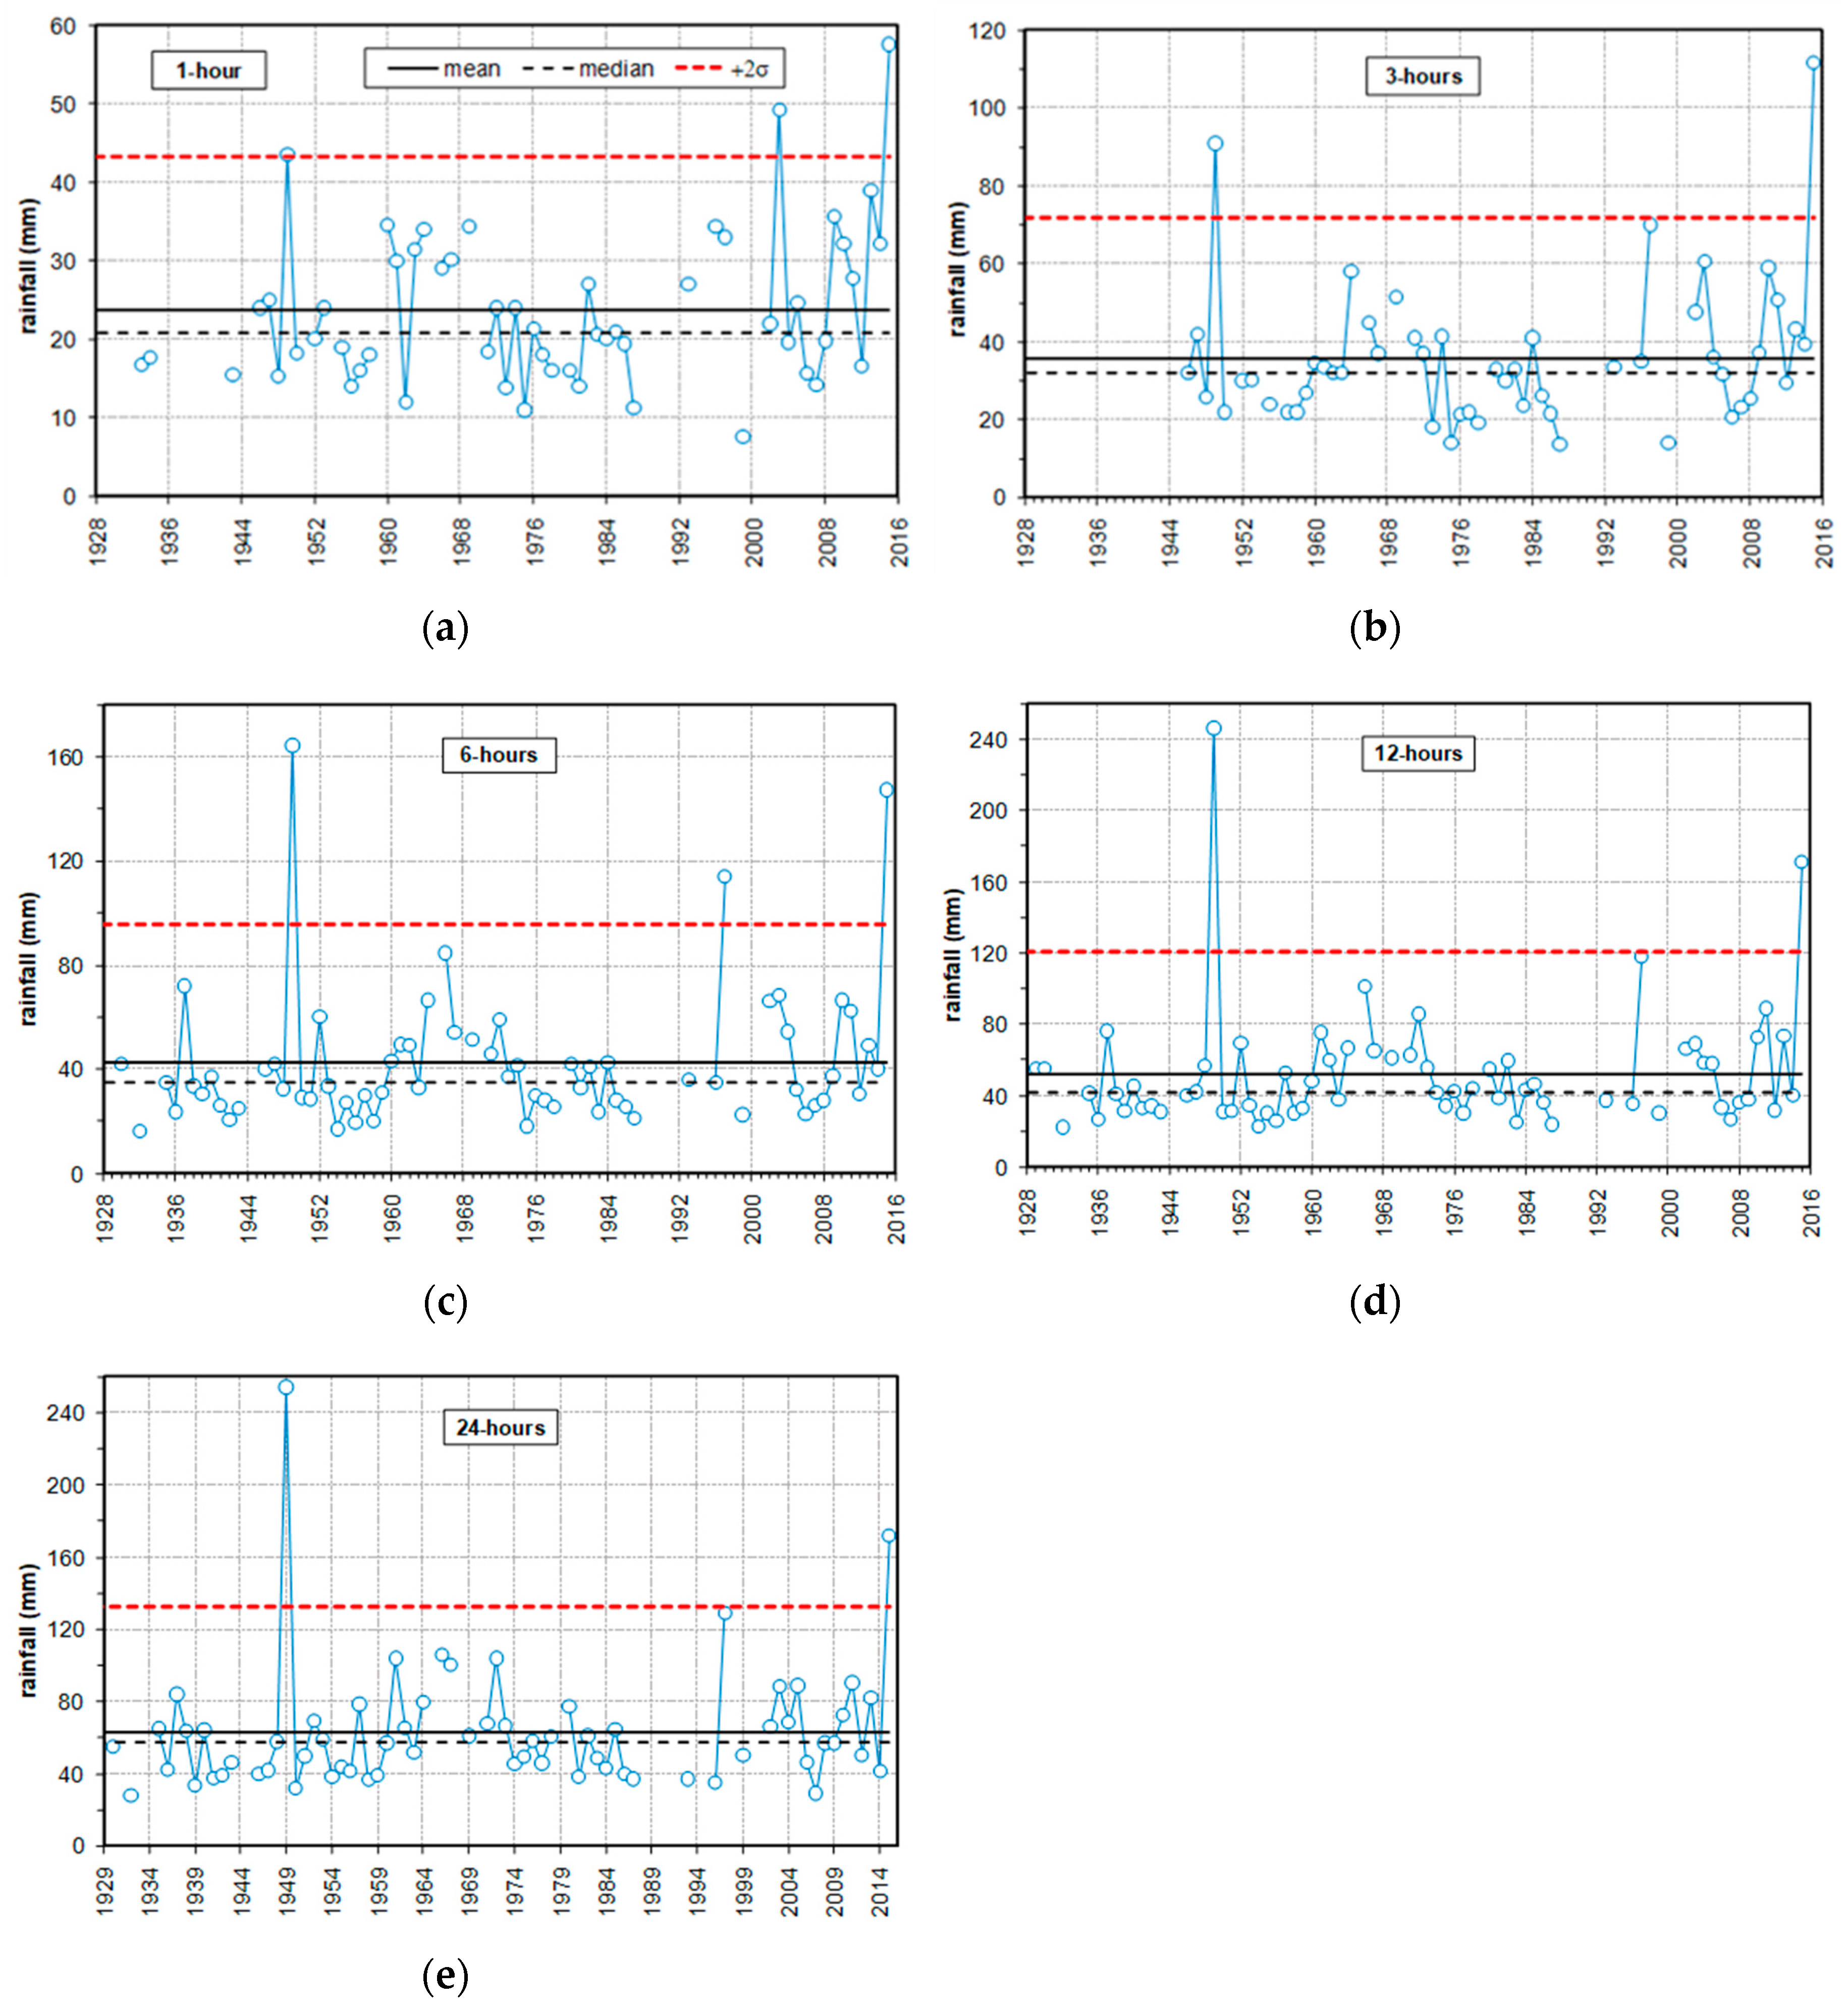
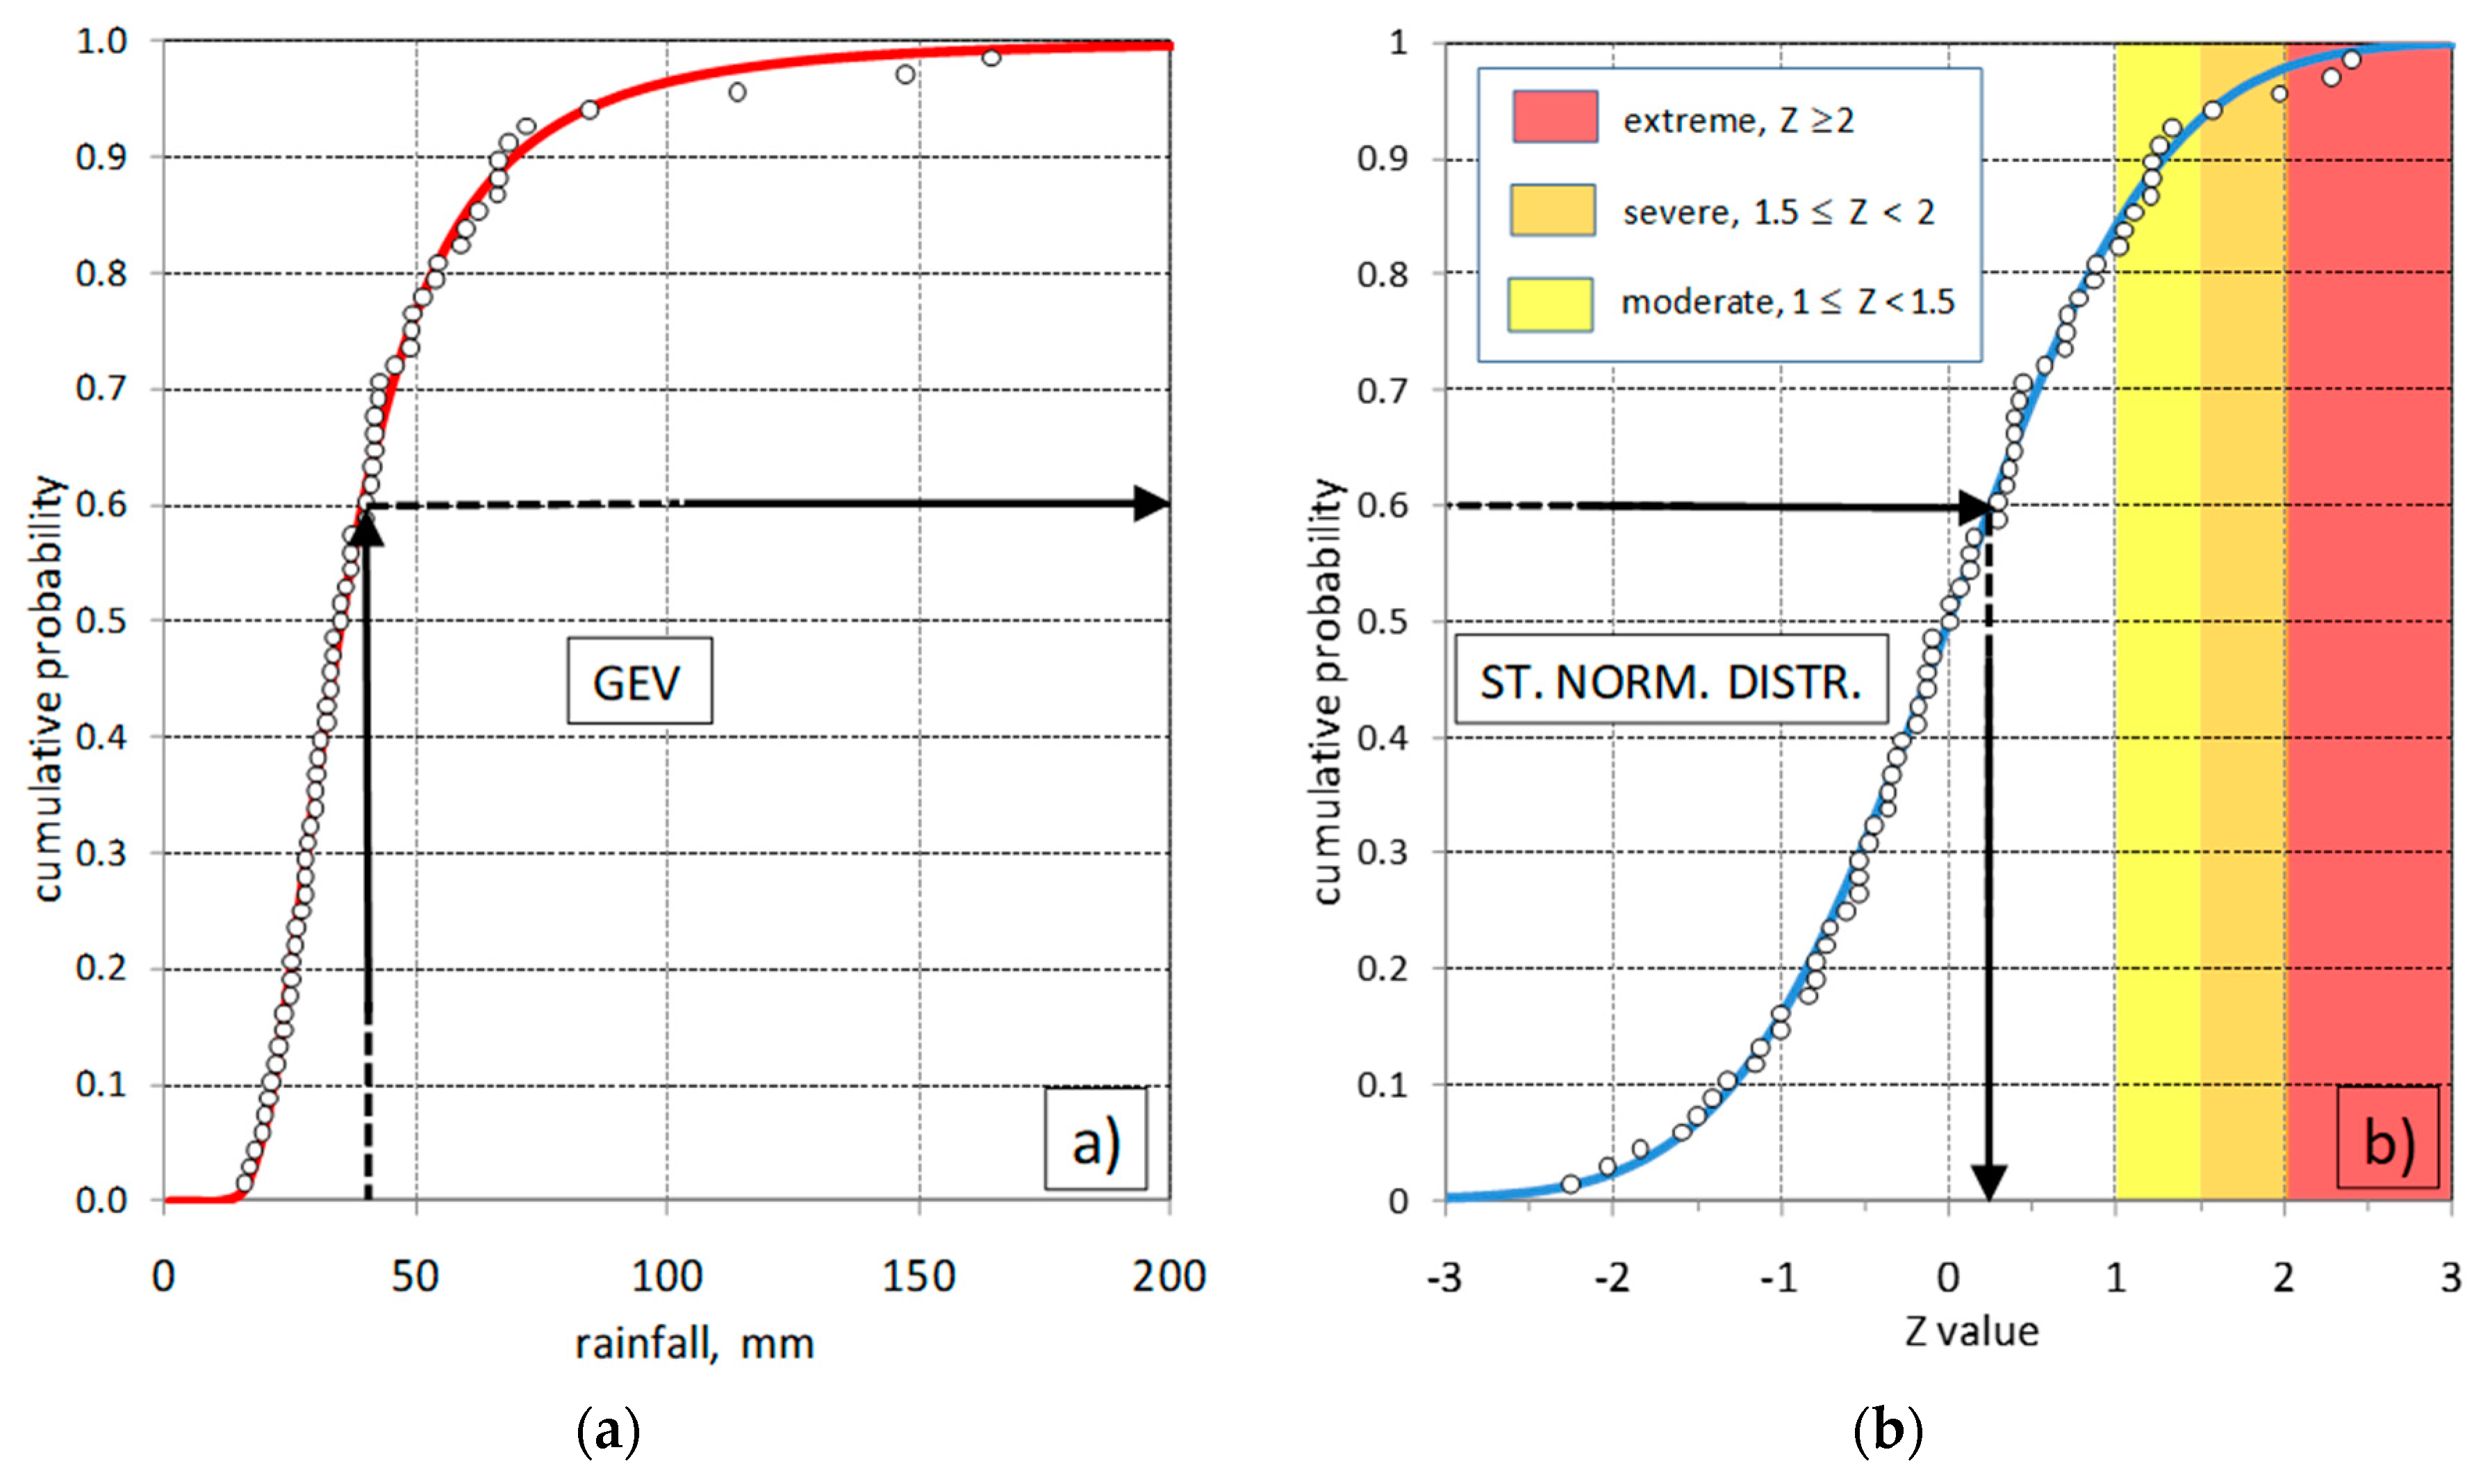
3.2. Statistical Characteristics of the Storms
3.3. Analysis of Flooding and Hillslope Processes
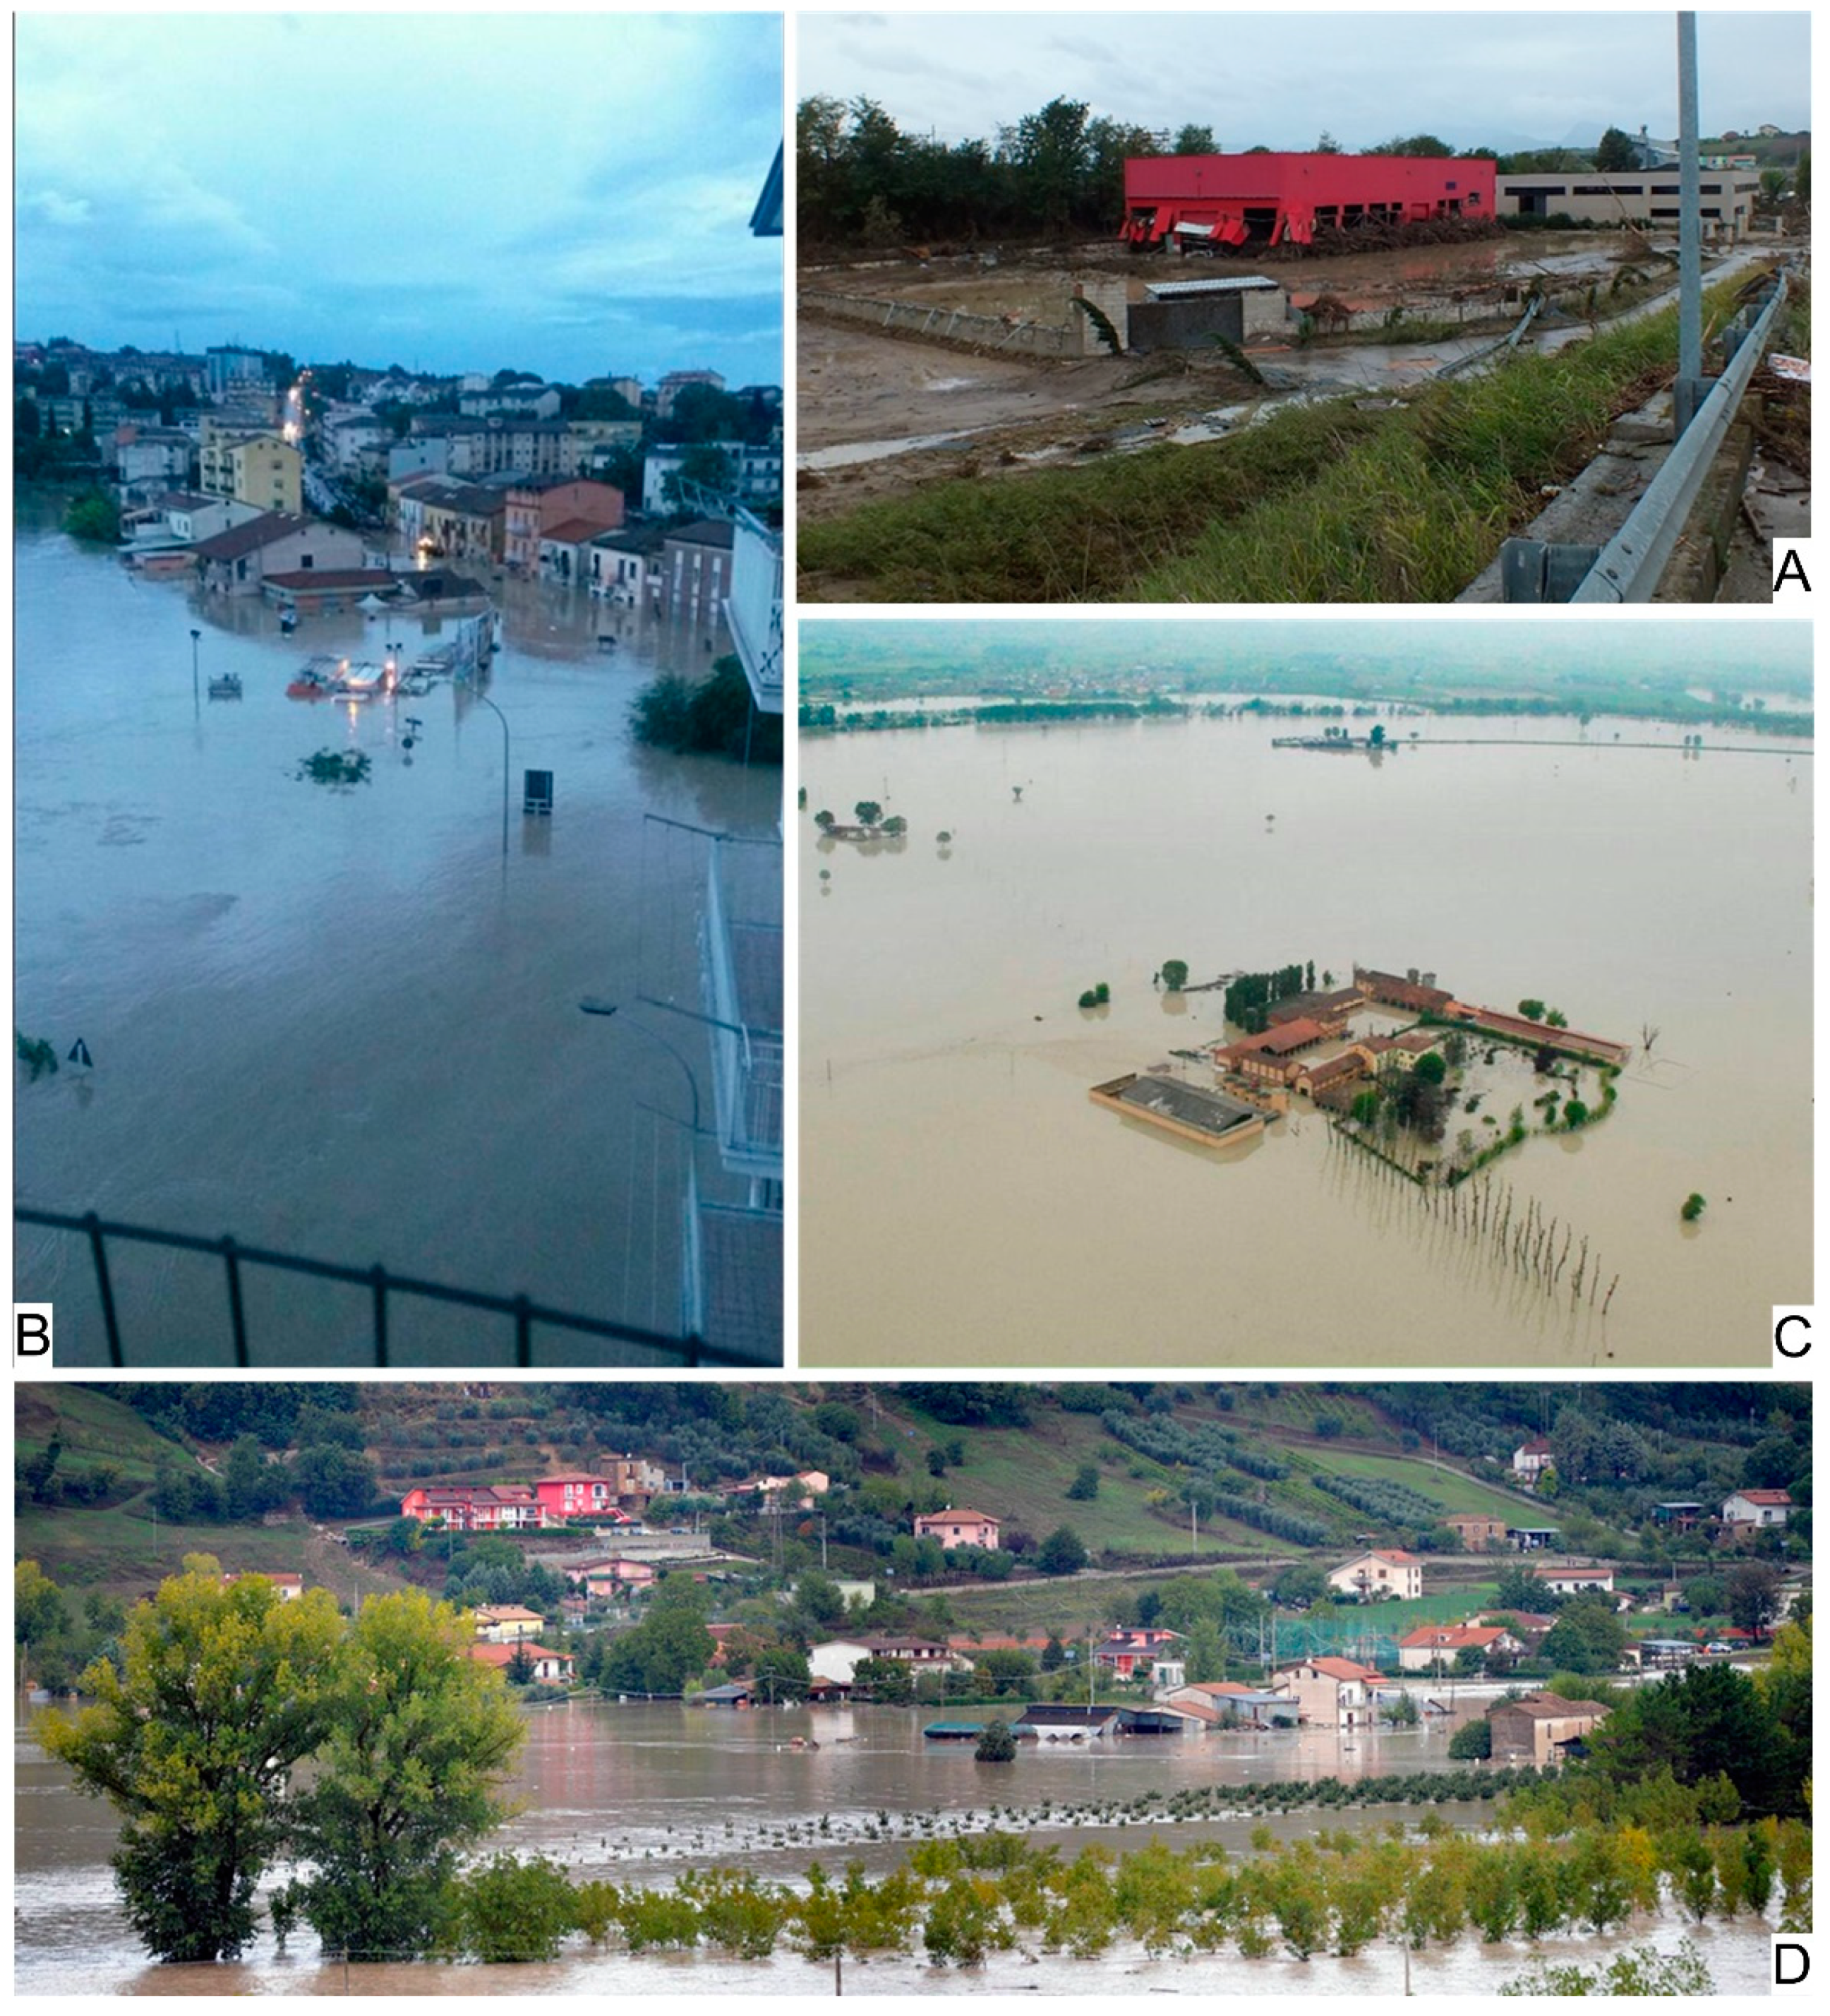
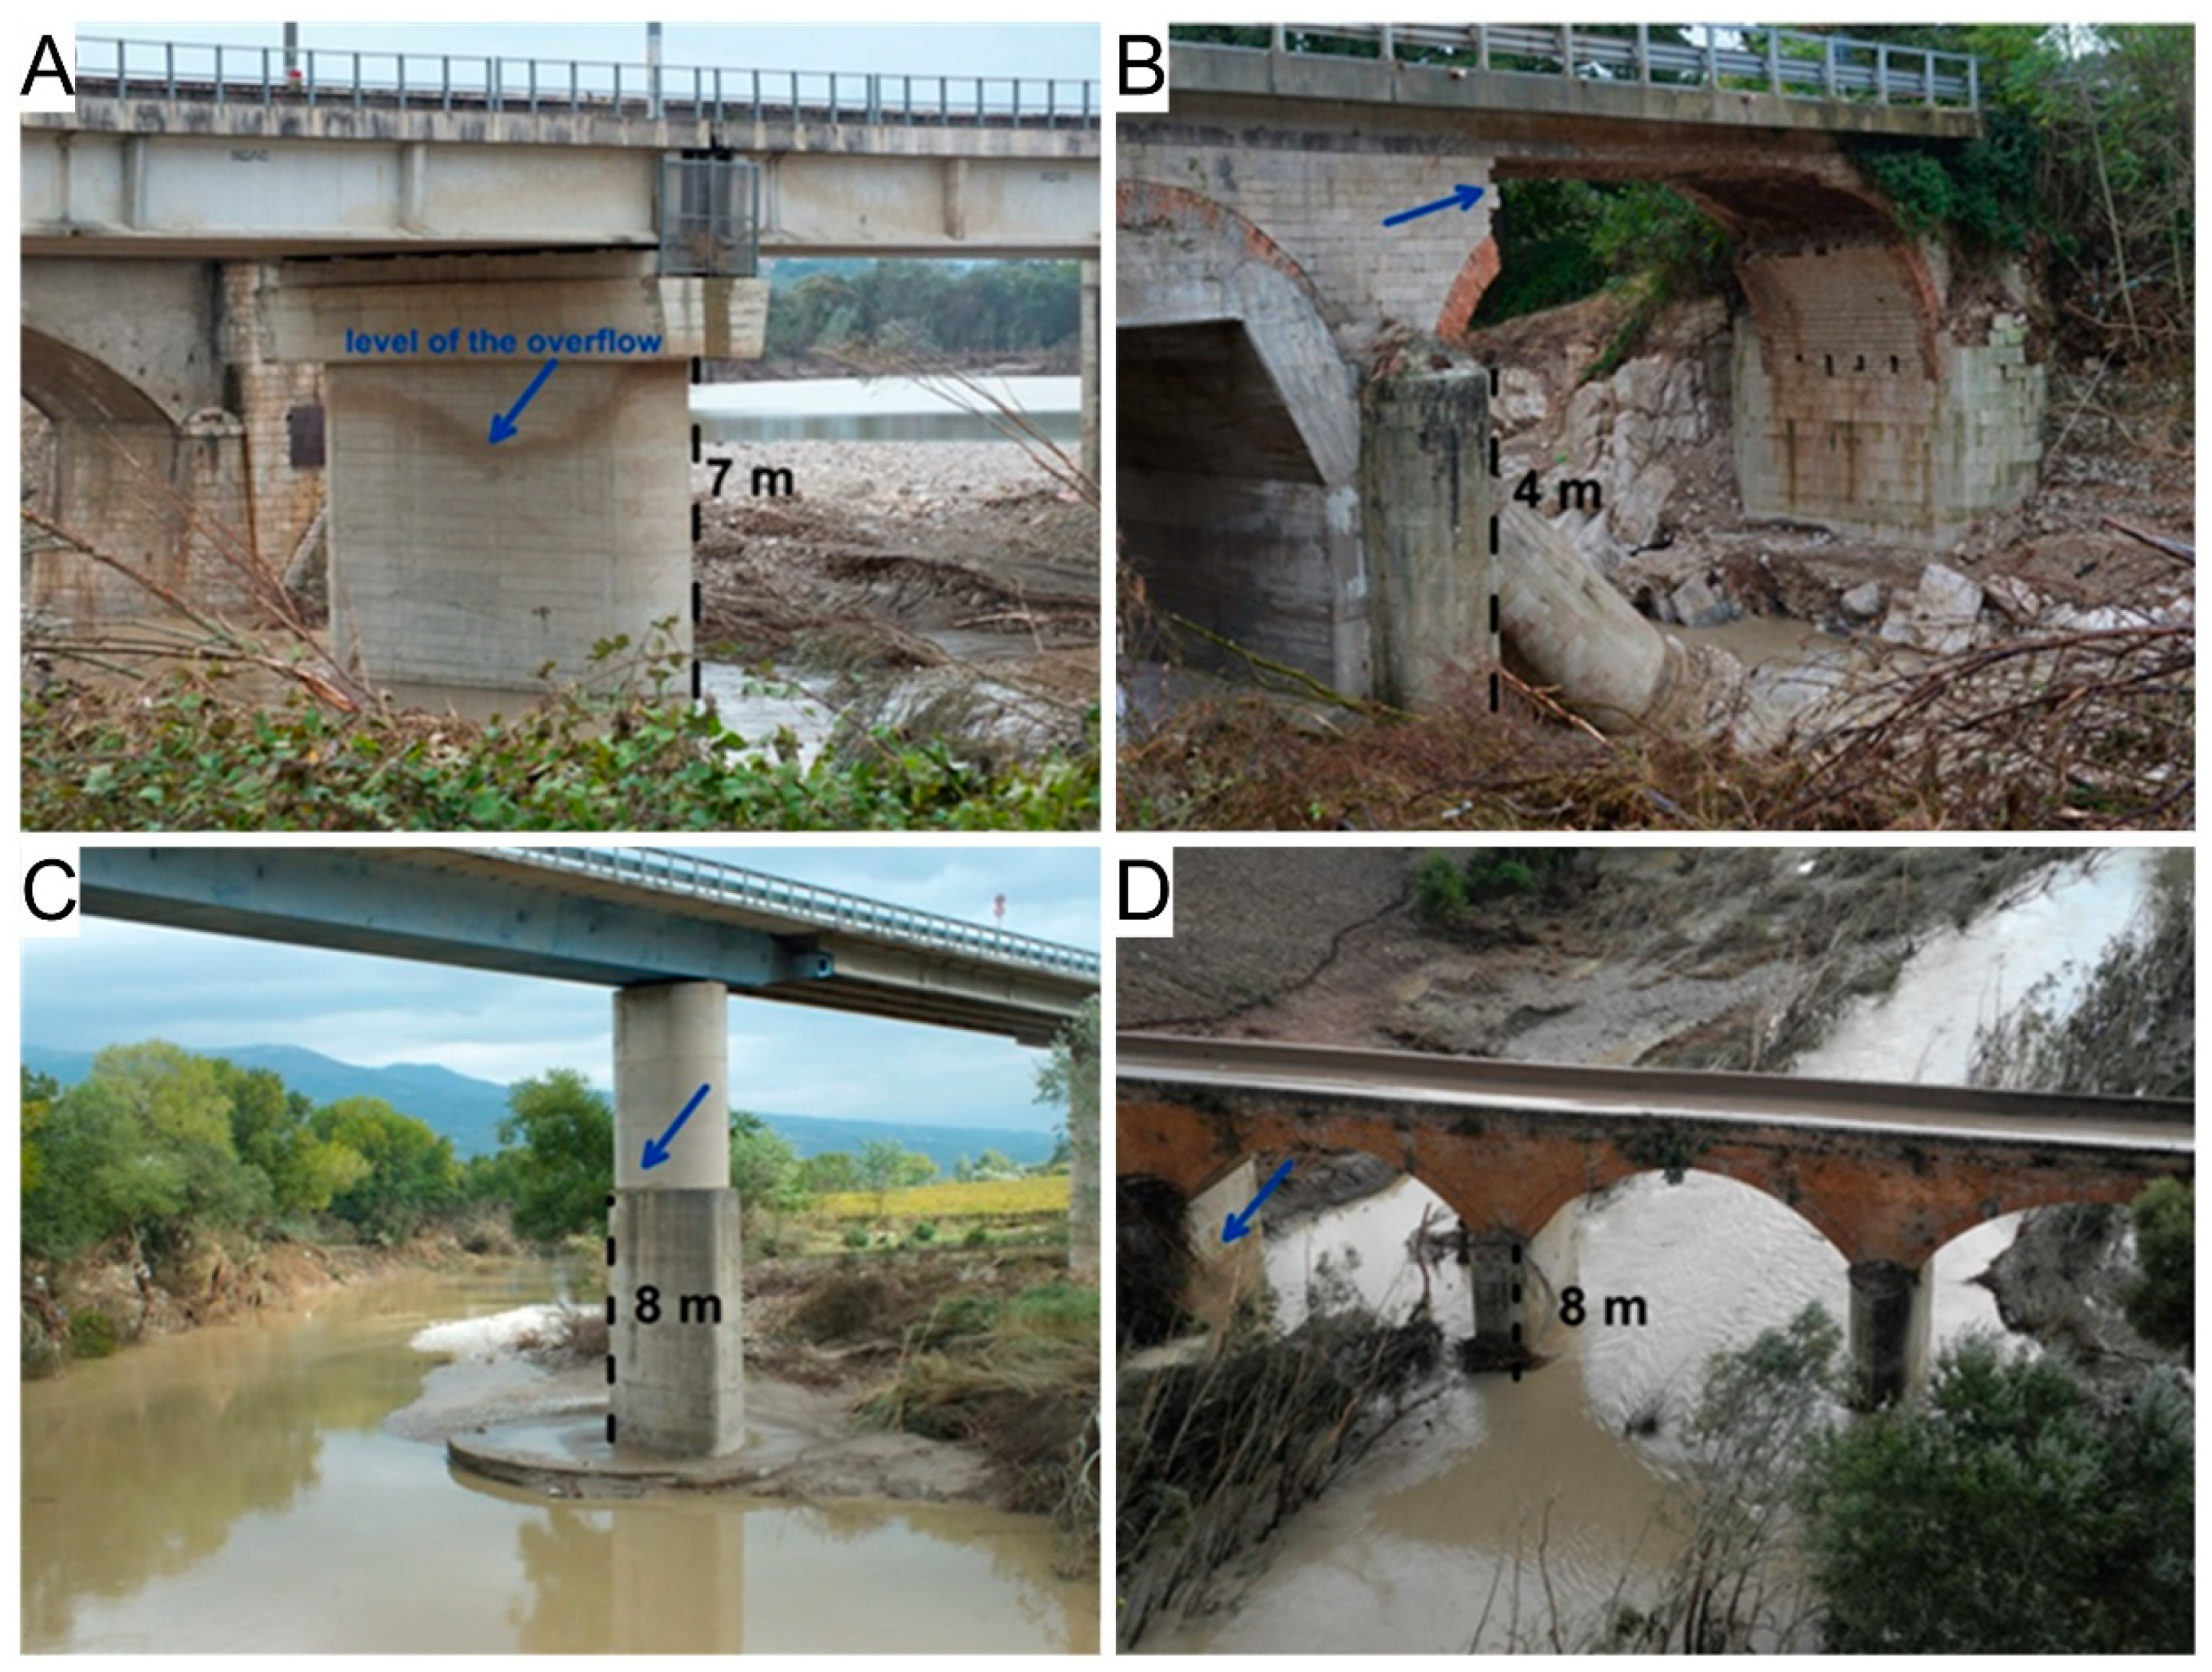
3.3.1. Flooding
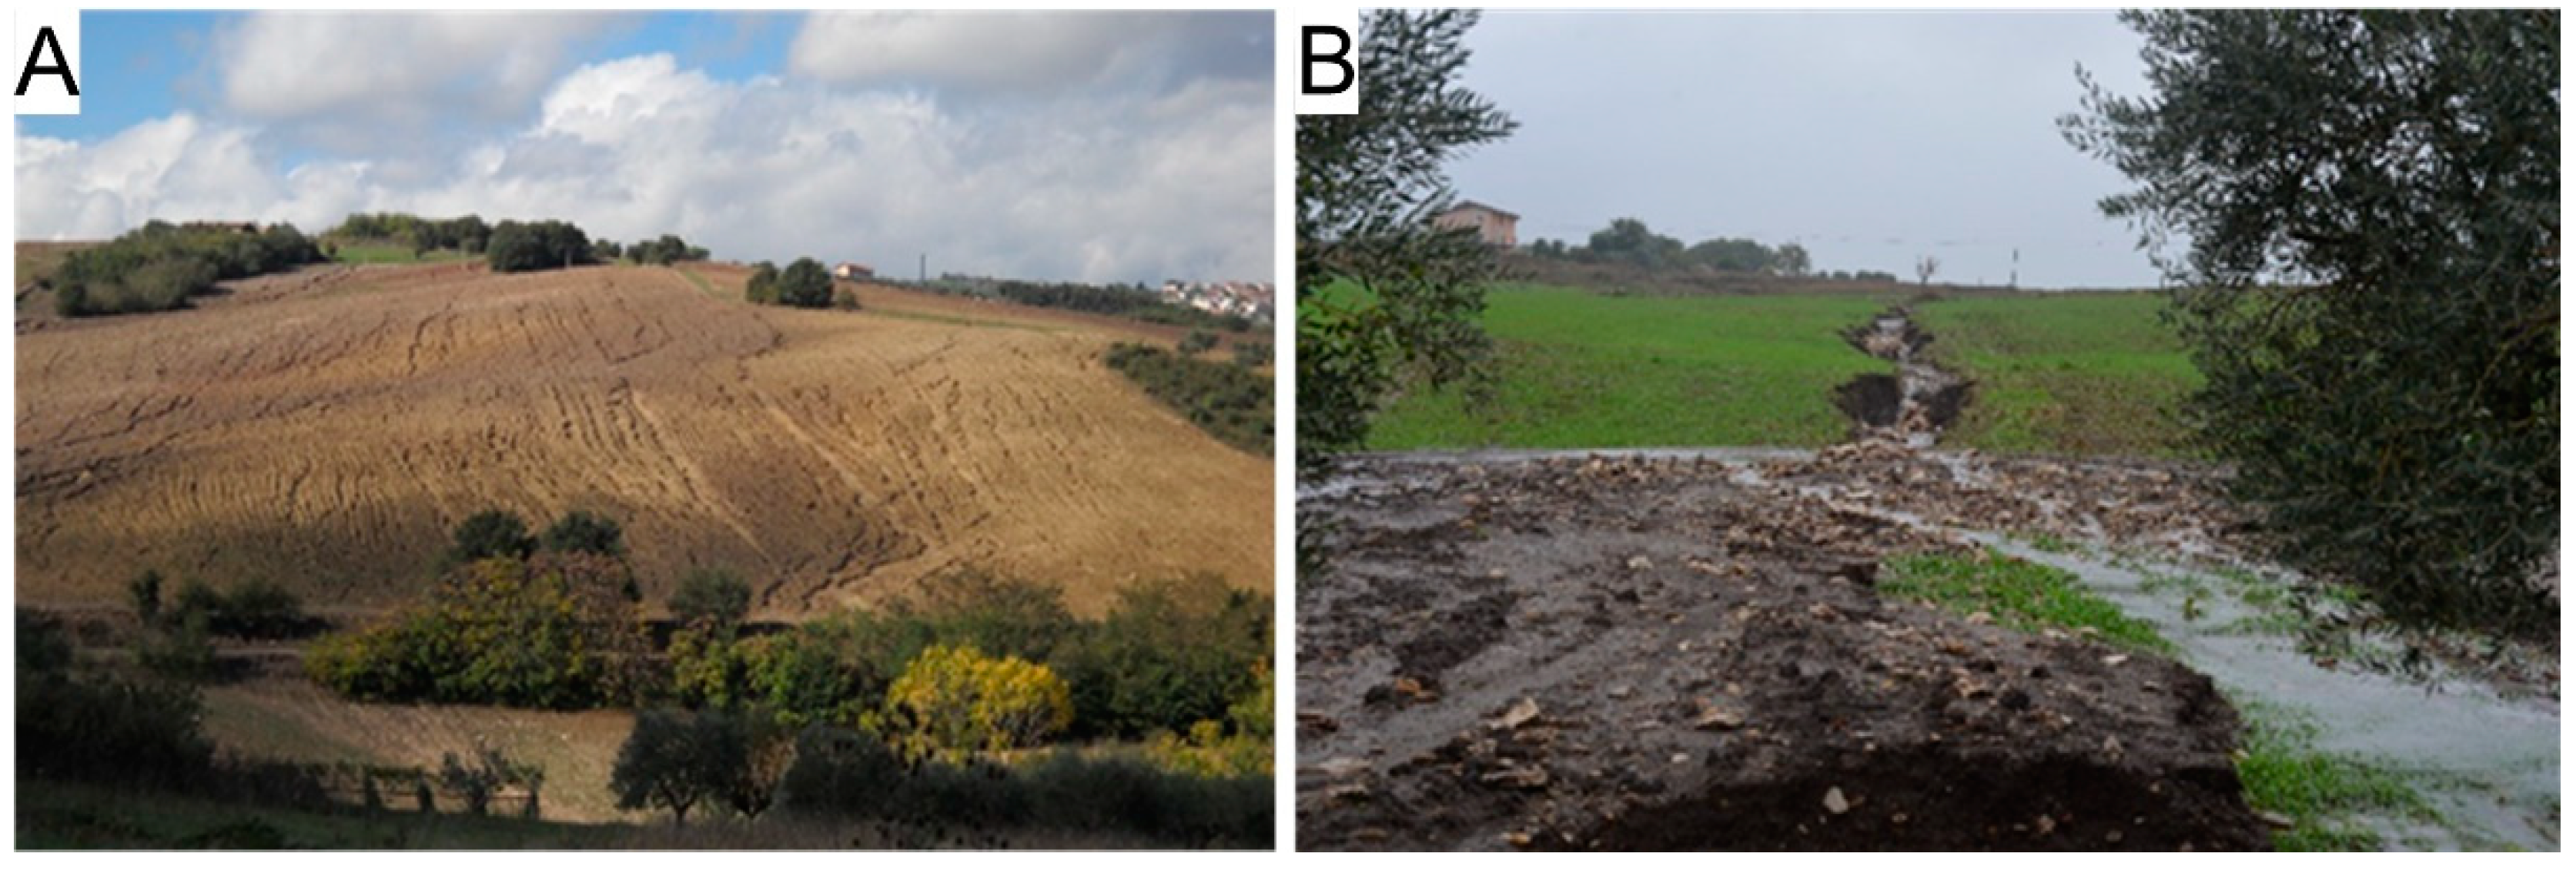
3.3.2. Soil Erosion
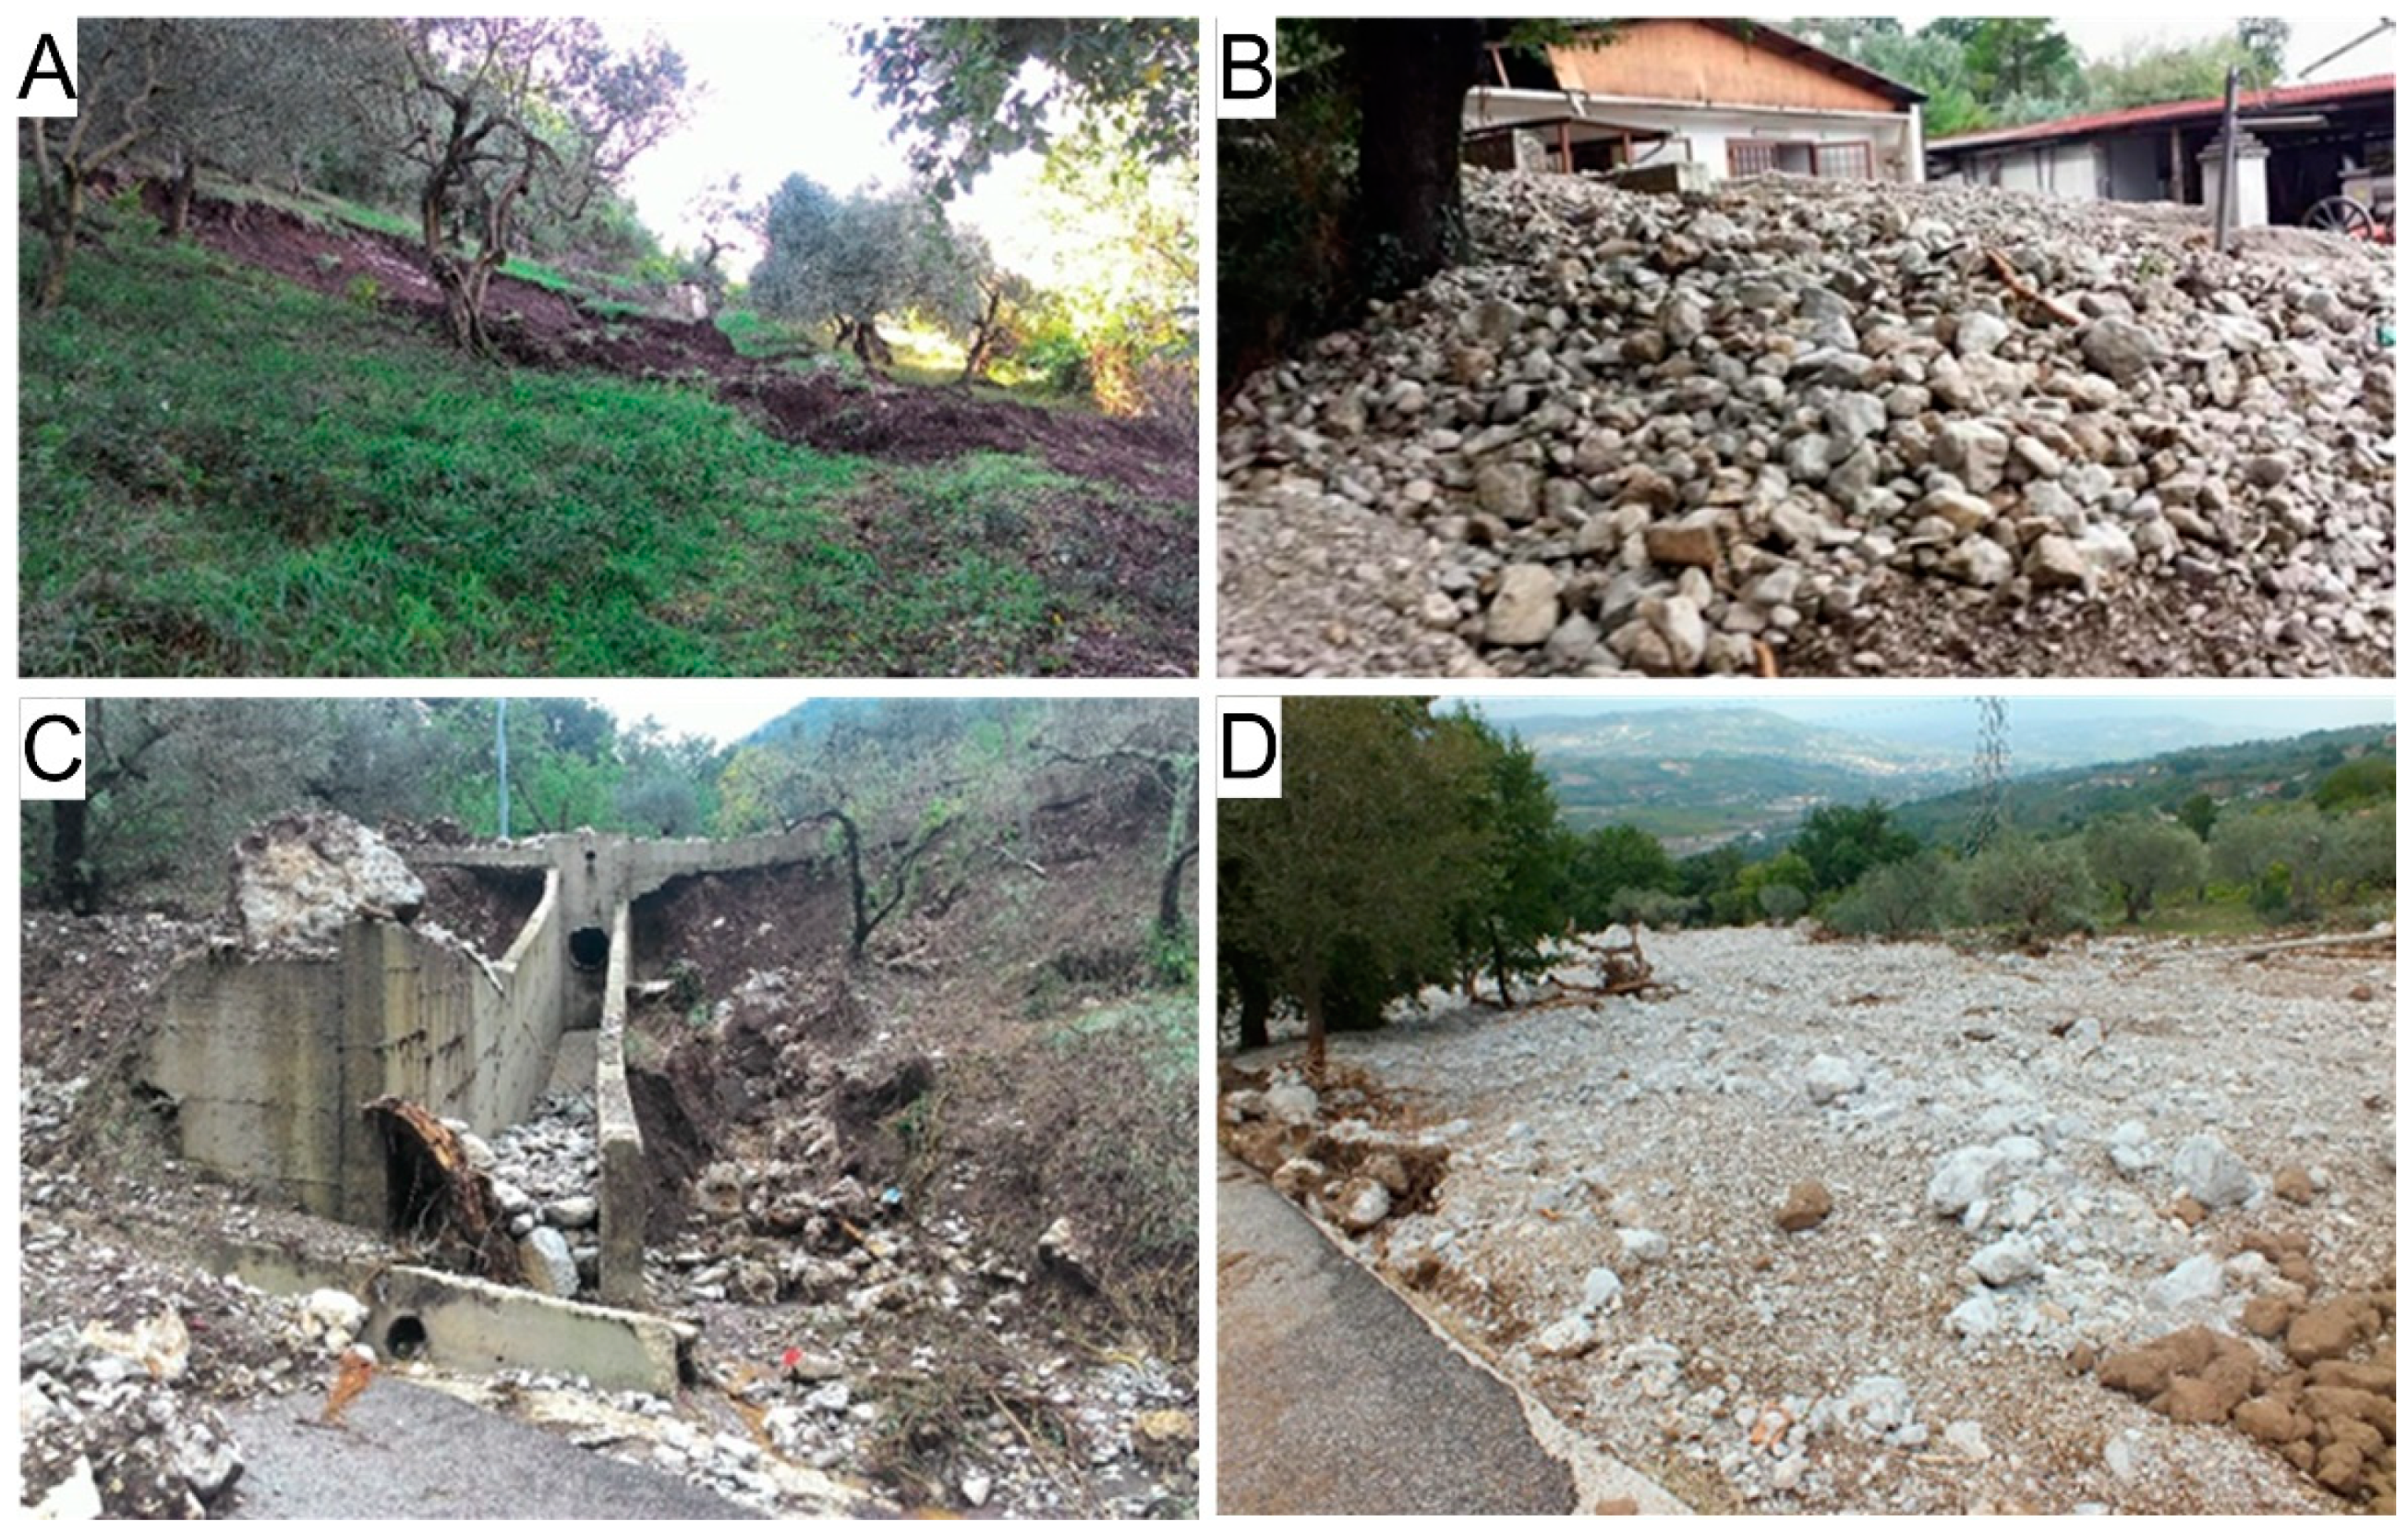
3.3.3. Slope Instabilities
4. Discussion
5. Conclusions
Author Contributions
Funding
Acknowledgments
Conflicts of Interest
References
- Knox, J.C. Large increase in flood magnitude in response to modest changes in climate. Nature 1993, 361, 430–432. [Google Scholar] [CrossRef]
- Diodato, N. Climatic fluctuations in southern Italy since the 17th century: Reconstruction with precipitation records at Benevento. Clim. Chang. 2006, 80, 411–431. [Google Scholar] [CrossRef]
- Coe, J.A.; Godt, J.W. Review of approaches for assessing the impact of climate change on landslide hazards. In Landslides and Engineered Slopes, Protecting Society Through Improved Understanding, Proceedings of the 11th International and 2nd North American Symposium on Landslides and Engineered Slopes, Banff, AB, Canada, 2–8 June 2012; Eberhardt, E., Froese, C., Turner, A.K., Leroueil, S., Eds.; Taylor & Francis Group: London, UK, 2012; Volume 1, pp. 371–377. [Google Scholar]
- Alvioli, M.; Melillo, M.; Guzzetti, F.; Rossi, M.; Palazzi, E.; von Hardenberg, J.; Brunetti, M.T.; Peruccacci, S. Implications of climate change on landslide hazard in central Italy. Sci. Total Environ. 2018, 630, 1528–1543. [Google Scholar] [CrossRef]
- Guzzetti, F.; Stark, C.P.; Salvati, P. Evaluation of flood and landslide risk to the population of Italy. Environ. Manag. 2005, 36, 15–36. [Google Scholar] [CrossRef] [PubMed]
- Petley, D. Global patterns of loss of life from landslides. Geology 2012, 40, 927–930. [Google Scholar] [CrossRef]
- Aronica, G.T.; Brigandí, G.; Morey, N. Flash floods and debris flow in the city area of Messina, north-east part of Sicily, Italy in October 2009: The case of the Giampilieri catchment. Nat. Hazards Earth Syst. Sci. 2012, 12, 1295–1309. [Google Scholar] [CrossRef]
- Fiorillo, F.; Diodato, N.; Meo, M.; Pagnozzi, M. Landslides and flash floods induced by the storm of 22nd November 2011 in northeastern Sicily. Environ. Earth Sci. 2018, 77, 602. [Google Scholar] [CrossRef]
- Cevasco, A.; Diodato, N.; Revellino, P.; Fiorillo, F.; Grelle, G.; Guadagno, F.M. Storminess and geo-hydrological events affecting small coastal basins in a terraced Mediterranean environment. Sci. Total Environ. 2015, 532, 208–219. [Google Scholar] [CrossRef]
- Del Prete, M.; Guadagno, F.M.; Hawkins, B. Preliminary report on the landslides of 5 May 1998, Campania, southern Italy. Bull. Eng. Geol. Environ. 1998, 57, 113–129. [Google Scholar] [CrossRef]
- Calcaterra, D.; Parise, M.; Palma, B. Combining historical and geological data for the assessment of the landslide hazard: A case study from Campania, Italy. Nat. Hazard Earth Syst. 2003, 3, 3–16. [Google Scholar] [CrossRef]
- Revellino, P.; Guerriero, L.; Grelle, G.; Esposito, L.; Guadagno, F.M. Initiation and propagation of the 2005 debris avalanche at Nocera Inferiore (Southern Italy). Ital. J. Geosci. 2013, 132, 366–379. [Google Scholar] [CrossRef]
- Napolitano, E.; Fusco, F.; Baum, R.L.; Godt, J.W.; De Vita, P. Effect of antecedent-hydrological conditions on rainfall triggering of debris flows in ash-fall pyroclastic mantled slopes of Campania (southern Italy). Landslides 2015, 13–15, 967–983. [Google Scholar] [CrossRef]
- Violante, C.; Branca, G.; Esposito, E.; Tranfaglia, G. The 9 September 2010 torrential rain and flash flood in the Dragone catchment, Atrani, Amalfi Coast (Southern Italy). Nat. Hazards Earth Syst. Sci. 2016, 16, 333–348. [Google Scholar] [CrossRef]
- Fiorillo, F.; Guerriero, L.; Capobianco, L.; Pagnozzi, M.; Revellino, P.; Russo, F.; Guadagno, F.M. Inventory of Vietri-Maiori landslides induced by the storm of October 1954 (Southern Italy). J. Maps 2019, 15. [Google Scholar] [CrossRef]
- Salvati, P.; Bianchi, C.; Rossi, M.; Guzzetti, F. Societal landslide and flood risk in Italy. Nat. Hazards Earth Syst. Sci. 2010, 10, 465–483. [Google Scholar] [CrossRef]
- Fiorillo, F.; Revellino, P. Le condizioni idrologiche che determinano lo sviluppo di frane superificiali nell’area sannita: Gli esempi del Gennaio 2003 e Marzo 2005. Giornale di Geologia Applicata 2006, 3, 129–136. [Google Scholar]
- Revellino, P.; Grelle, G.; Donnarumma, A.; Guadagno, F.M. Structurally controlled earth flows of the Benevento province (Southern Italy). Bull. Eng. Geol. Environ. 2010, 69, 487–500. [Google Scholar] [CrossRef]
- Diodato, N.; Soriano, M.; Bellocchi, G.; Fiorillo, F.; Cevasco, A.; Revellino, P.; Guadagno, F.M. Historical evolution of slope instability in the Calore River Basin, Southern Italy. Geomorphology 2017, 282, 74–84. [Google Scholar] [CrossRef]
- Guerriero, L.; Focareta, M.; Fusco, G.; Rabuano, R.; Guadagno, F.M.; Revellino, P. Flood hazard of major river segments, Benevento Province, Southern Italy. J. Maps 2018, 14, 597–606. [Google Scholar] [CrossRef] [Green Version]
- Valente, A.; Iscaro, C.; Magliulo, P.; Russo, F. The flood event in Benevento on 14th–15th October 2015: A short report. Rend. Online Soc. Geol. It. 2016, 38, 105–108. [Google Scholar]
- Santo, A.; Santangelo, N.; Forte, G.; De Falco, M. Post flash flood survey: The 14th and 15th October 2015 event in the Paupisi-Solopaca area (Southern Italy). J. Maps 2017, 13, 19–25. [Google Scholar] [CrossRef]
- Grelle, G.; Rossi, A.; Revellino, P.; Guerriero, L.; Guadagno, F.M.; Sappa, G. Assessment of debris-flow erosion and deposit areas by morphometric analysis and a GIS-based simplified procedure: A case study of Paupisi in the southern Apennines. Sustainability 2019, 11, 2382. [Google Scholar] [CrossRef]
- D’Argenio, B.; Pescatore, T.S.; Scandone, P. Schema geologico dell’Appennino Meridionale. Acc Naz Lincei Quad. 1973, 183, 49–72. [Google Scholar]
- Patacca, E.; Scandone, P. Geology of Southern Appennines. Boll. Soc. Geol. It. 2007, 7, 45–119. [Google Scholar]
- Vitale, S.; Ciarcia, S. Tectono-stratigraphic setting of the Campania region (Southern Italy). J. Maps 2018, 14, 9–21. [Google Scholar] [CrossRef]
- Donnarumma, A.; Revellino, P.; Grelle, G.; Guadagno, F.M. Slope Angle as Indicator Parameter of Landslide Susceptibility in a Geologically Complex Area. In Landslide Science and Practice. Volume 1: Landslide Inventory and Susceptibility and Hazard Zoning; Margottini, C., Canuti, C., Sassa, P., Eds.; Springer: Berlin/Heidelberg, Germany, 2013; Volume 2, pp. 425–433. [Google Scholar]
- Guerriero, L.; Revellino, P.; Grelle, G.; Fiorillo, F.; Guadagno, F.M. Landslides and infrastructures: The case of the montaguto earth flow in southern Italy. Ital. J. Eng. Geol. Environ. 2013, 6, 459–466. [Google Scholar]
- Magliulo, P. Quaternary deposits and geomorphological evolution of the Telesina Valley (Southern Apennines). Geogr. Fis. Dinam. Quat. 2005, 28, 125–146. [Google Scholar]
- Rossi, F.; Villano, P. (Eds.) Valutazione delle Piene in Campania, pubbl n 1470 of CNR-GNDCI. In Progetto VAPI; CNR-GNDCI: Perugia, Italy, 1994. [Google Scholar]
- Fiorillo, F.; Diodato, N.; Meo, M. Reconstruction of a Storm Map and New Approach in the Definition of Categories of the Extreme Rainfall, Northeastern Sicily. Water 2016, 8, 330. [Google Scholar] [CrossRef]
- Jenkinson, A.F. The frequency distribution of the annual maximum (or minimum) values of meteorological elements. Q. J. R. Meteorol. Soc. 1955, 81, 158–171. [Google Scholar] [CrossRef]
- Nguyen, T.H.; El Outayek, S.; Lim, S.H.; Nguyen, V.T.V. A systematic approach to selecting the best probability models for annual maximum rainfalls – A case study using data in Ontario (Canada). J. Hydrol. 2017, 553, 49–58. [Google Scholar] [CrossRef]
- Fortelli, A.; Musto, F.M. Aree urbane e modalità di risposta agli eventi pluviometrici estremi: Analisi del fenomeno e strategie di salvaguardia. Territorio Della Ricerca Su Insediamenti E Ambiente 2015, 8, 153–167. [Google Scholar]
- Lee, K.O.; Flamant, C.; Ducrocq, V.; Duffourg, F.; Fourrié, N.; Davolio, S. Convective initiation and maintenance processes of two back-building mesoscale convective systems leading to heavy precipitation events in Southern Italy during HyMeX IOP 13. Q. J. R. Meteorol. 2016, 142, 2623–2635. [Google Scholar] [CrossRef]
- McKee, T.B.; Doesken, N.J.; Kleist, J. The relationship of drought frequency and duration to time scales. In Proceedings of the 8th Conference on Applied Climatology, Anaheim, CA, USA, 17–22 January 1993; American Meteorological Society: Boston, MA, USA, 1993; pp. 179–184. [Google Scholar]
- Hungr, O.; Leroueil, S.; Picarelli, L. The Varnes classification of landslide types, an update. Landslides 2014, 11, 167–194. [Google Scholar] [CrossRef]
- Coe, J.A.; Kinner, D.A.; Jonathan, W.G. Initiation conditions for debris flows generated by runoff at chalk cliffs, central colorado. Geomorphology 2008, 96, 270–297. [Google Scholar] [CrossRef]
- Santi, P.M.; deWolfe, V.G.; Higgins, J.D.; Cannon, S.H.; Gartner, J.E. Sources of debris flow material in burned areas. Geomorphology 2008, 96, 310–321. [Google Scholar] [CrossRef]
- Godt, J.W.; Coe, J.A. Alpine debris flow striggered by a 28 July 1999 thunderstorm in the central Front Range, Colorado. Geomorphology 2006, 84, 80–97. [Google Scholar] [CrossRef]
- Berti, M.; Genevois, R.; Simoni, A.; Tecca, P.R. Field observations of a debris flow event in the Dolomites. Geomorphology 1999, 29, 265–274. [Google Scholar] [CrossRef]
- Selby, M.J. Hillslope Materials and Processes; Oxford University Press: Oxford, UK, 1993. [Google Scholar]
- Iverson, R.M. The debris-flow rheology. In Proceedings of the 3rd International Conference on Debris-Flow Hazard Mitigation: Prediction and Assessment; Rickenmann, D., Chen, C.L., Eds.; Millpress: Rotterdam, The Netherlands, 2003; pp. 303–314. [Google Scholar]
- Grelle, G.; Soriano, M.; Revellino, P.; Diodato, N.; Guadagno, F.M. Space-time prediction of rainfall-induced shallow landslides through a combined probabilistic/deterministic approach, optimized for initial water table conditions. Bull. Eng. Geol. Environ. 2014, 73, 877–890. [Google Scholar] [CrossRef]


| Categories of Maxima | Storm Year | 1 h | 3 h | 6 h | 12 h | 24 h | |
|---|---|---|---|---|---|---|---|
| Extreme | Z ≥ 2 | 2015 | 2.39 | 2.41 | 2.29 | 2.20 | 2.14 |
| 2003 | 2.02 | ||||||
| 1949 | 2.11 | 2.41 | 2.59 | 2.48 | |||
| Severe | 1.5 ≤ Z < 2 | 1997 | 1.68 | 1.98 | 1.76 | 1.73 | |
| 1966 | 1.59 | 1.55 | |||||
| 1949 | 1.73 | ||||||
| Moderate | 1 ≤ Z < 1.5 | 2013 | 1.47 | 1.07 | |||
| 2011 | 1.10 | 1.25 | 1.37 | 1.12 | |||
| 2010 | 1.38 | 1.23 | 1.05 | ||||
| 2005 | 1.09 | ||||||
| 2003 | 1.43 | 1.27 | 1.08 | ||||
| 2002 | 1.22 | ||||||
| 1997 | 1.06 | ||||||
| 1996 | 1.16 | ||||||
| 1972 | 1.03 | 1.31 | 1.37 | ||||
| 1969 | 1.16 | 1.12 | |||||
| 1967 | 1.32 | ||||||
| 1966 | 1.41 | ||||||
| 1964 | 1.13 | 1.35 | 1.23 | ||||
| 1961 | 1.11 | 1.37 | |||||
| 1960 | 1.17 | ||||||
| 1952 | 1.06 | ||||||
| 1937 | 1.35 | 1.32 | |||||
| Storm Effects | Number | Area (km2) | Source Height Range (m a.s.l.) | Transport Distance (m) | Source Slope Angle (°) | Deposit Thickness (m) | Erosion Thickness (m) |
|---|---|---|---|---|---|---|---|
| F | - | 43 | - | - | - | - | - |
| SE | - | 930 | - | - | - | - | up to 1.5 |
| EF | 264 | - | - | - | - | - | - |
| DFrun | ≈50 | 1.3 | 350–1000 | 100–7800 | 10–40 | up to 1.0 | up to 2.0 |
| DFril | >200 | - | 100–900 | 50–2000 | 5–15 | 0.1–1 | >1 |
© 2019 by the authors. Licensee MDPI, Basel, Switzerland. This article is an open access article distributed under the terms and conditions of the Creative Commons Attribution (CC BY) license (http://creativecommons.org/licenses/by/4.0/).
Share and Cite
Revellino, P.; Guerriero, L.; Mascellaro, N.; Fiorillo, F.; Grelle, G.; Ruzza, G.; Guadagno, F.M. Multiple Effects of Intense Meteorological Events in the Benevento Province, Southern Italy. Water 2019, 11, 1560. https://doi.org/10.3390/w11081560
Revellino P, Guerriero L, Mascellaro N, Fiorillo F, Grelle G, Ruzza G, Guadagno FM. Multiple Effects of Intense Meteorological Events in the Benevento Province, Southern Italy. Water. 2019; 11(8):1560. https://doi.org/10.3390/w11081560
Chicago/Turabian StyleRevellino, Paola, Luigi Guerriero, Neri Mascellaro, Francesco Fiorillo, Gerardo Grelle, Giuseppe Ruzza, and Francesco M. Guadagno. 2019. "Multiple Effects of Intense Meteorological Events in the Benevento Province, Southern Italy" Water 11, no. 8: 1560. https://doi.org/10.3390/w11081560