
Comparing Frequency and Severity Ratings for ME/CFS versus Controls

Center for Community Research, DePaul University, Chicago, IL 60614, USA
*
Author to whom correspondence should be addressed.
Psych 2023, 5(3), 662-669; https://doi.org/10.3390/psych5030042
Submission received: 27 May 2023
/
Revised: 14 June 2023
/
Accepted: 27 June 2023
/
Published: 30 June 2023
(This article belongs to the Special Issue Feature Papers in Psych)
Abstract
:Most questionnaires for somatic symptoms focus either on occurrence, frequency, or severity, and in doing so, they might not be able to comprehensively assess the burden that symptoms present to patients. For example, a symptom might occur at a high frequency but only a minimal severity, so that it is less likely to be a burden on a patient; whereas a symptom that has both a high frequency and severity is more likely to be negatively impacting a patient. Study 1 examined frequency and severity scores for classic Myalgic encephalomyelitis/chronic fatigue syndrome (ME/CFS) symptoms among patients with ME/CFS versus a control group. Findings in Study 1 indicate there were more frequency/severity discrepancies for individuals with ME/CFS versus the control group. Study 1 concluded that collecting data on both measures of symptom burden provides unique indicators that can better assess the burden of the symptoms on patients. In a separate data set, Study 2 reported reliability data on slight differences in the time period and the way the severity was assessed. Study 2 findings indicated high levels of reliability for these changes in the time period and the way questions were asked. These studies provide important psychometric properties that could lead to more reliable and valid assessments of patients with post-viral illnesses.
1. Comparing Frequency and Severity Ratings for ME/CFS and Controls
Initially, patients with Myalgic encephalomyelitis/chronic fatigue syndrome (ME/CFS) had case definitions that only stipulated symptom occurrence. Unfortunately, many of the somatic symptoms among patients with this illness are relatively common, so there was a need to move beyond assessing symptoms by just measuring occurrence in order to better differentiate symptoms that are common but not a burden to the patients versus those that are a burden to patients [1]. This was achieved by measuring frequency rather than just occurrence of symptoms, as a highly frequent somatic symptom was considered to be more of a burden than one that occurred not frequently. Another problem soon emerged, as some patients with psychiatric disorders, such as major depressive disorder, had high frequencies of fatigue, similar to patients with ME/CFS. However, by introducing severity ratings, it was found that ME/CFS and major depressive disorders could be differentiated, as those with ME/CFS had significantly higher fatigue severity ratings [2].
In addition to introducing frequency/severity ratings when measuring somatic symptoms for those with ME/CFS, determining the threshold for either severity or frequency was needed to determine if a score was considered a burden to the patient. Selecting a threshold can be achieved by using k-means clustering to dynamically adjust the threshold [3]. Using this procedure with a ME/CFS sample, a frequency of “half the time” and severity of “moderate” were found to be adequate thresholds [4], and these thresholds have been incorporated into the DePaul Symptom Questionnaire [5]. However, few studies have investigated this threshold issue within the ME/CFS field.
In other data mining efforts, Jason et al. [4] identified fatigue, post-exertional malaise, neurocognitive impairment, and unrefreshing sleep as the best predictors of ME/CFS. These types of findings were useful in the development of the IOM [6] clinical case definition of ME/CFS. Advantages of this case definition included rating symptoms for frequency and severity in order to indicate if symptoms met threshold criteria, although a limitation is that there are few exclusionary illnesses in the new case definition [7].
Study 1 employed the key symptoms of the IOM [8] and examined frequency and severity ratings. In this exploratory investigation, Study 1 examined whether there are significant differences between frequency and severity for a ME/CFS sample and a control sample. In addition, we determined whether the correlations between frequency and severity statistically differed for the ME/CFS and control groups. Finally, we examined discrepancies in the frequency and severity ratings for ME/CFS to better understand whether both indicators are needed to understand the burden of symptoms for patients. Study 2 explored other psychometric properties involving symptom duration and different ways to tap the wording of symptom severity.
2. Method
2.1. Participants
2.1.1. ME/CFS Sample
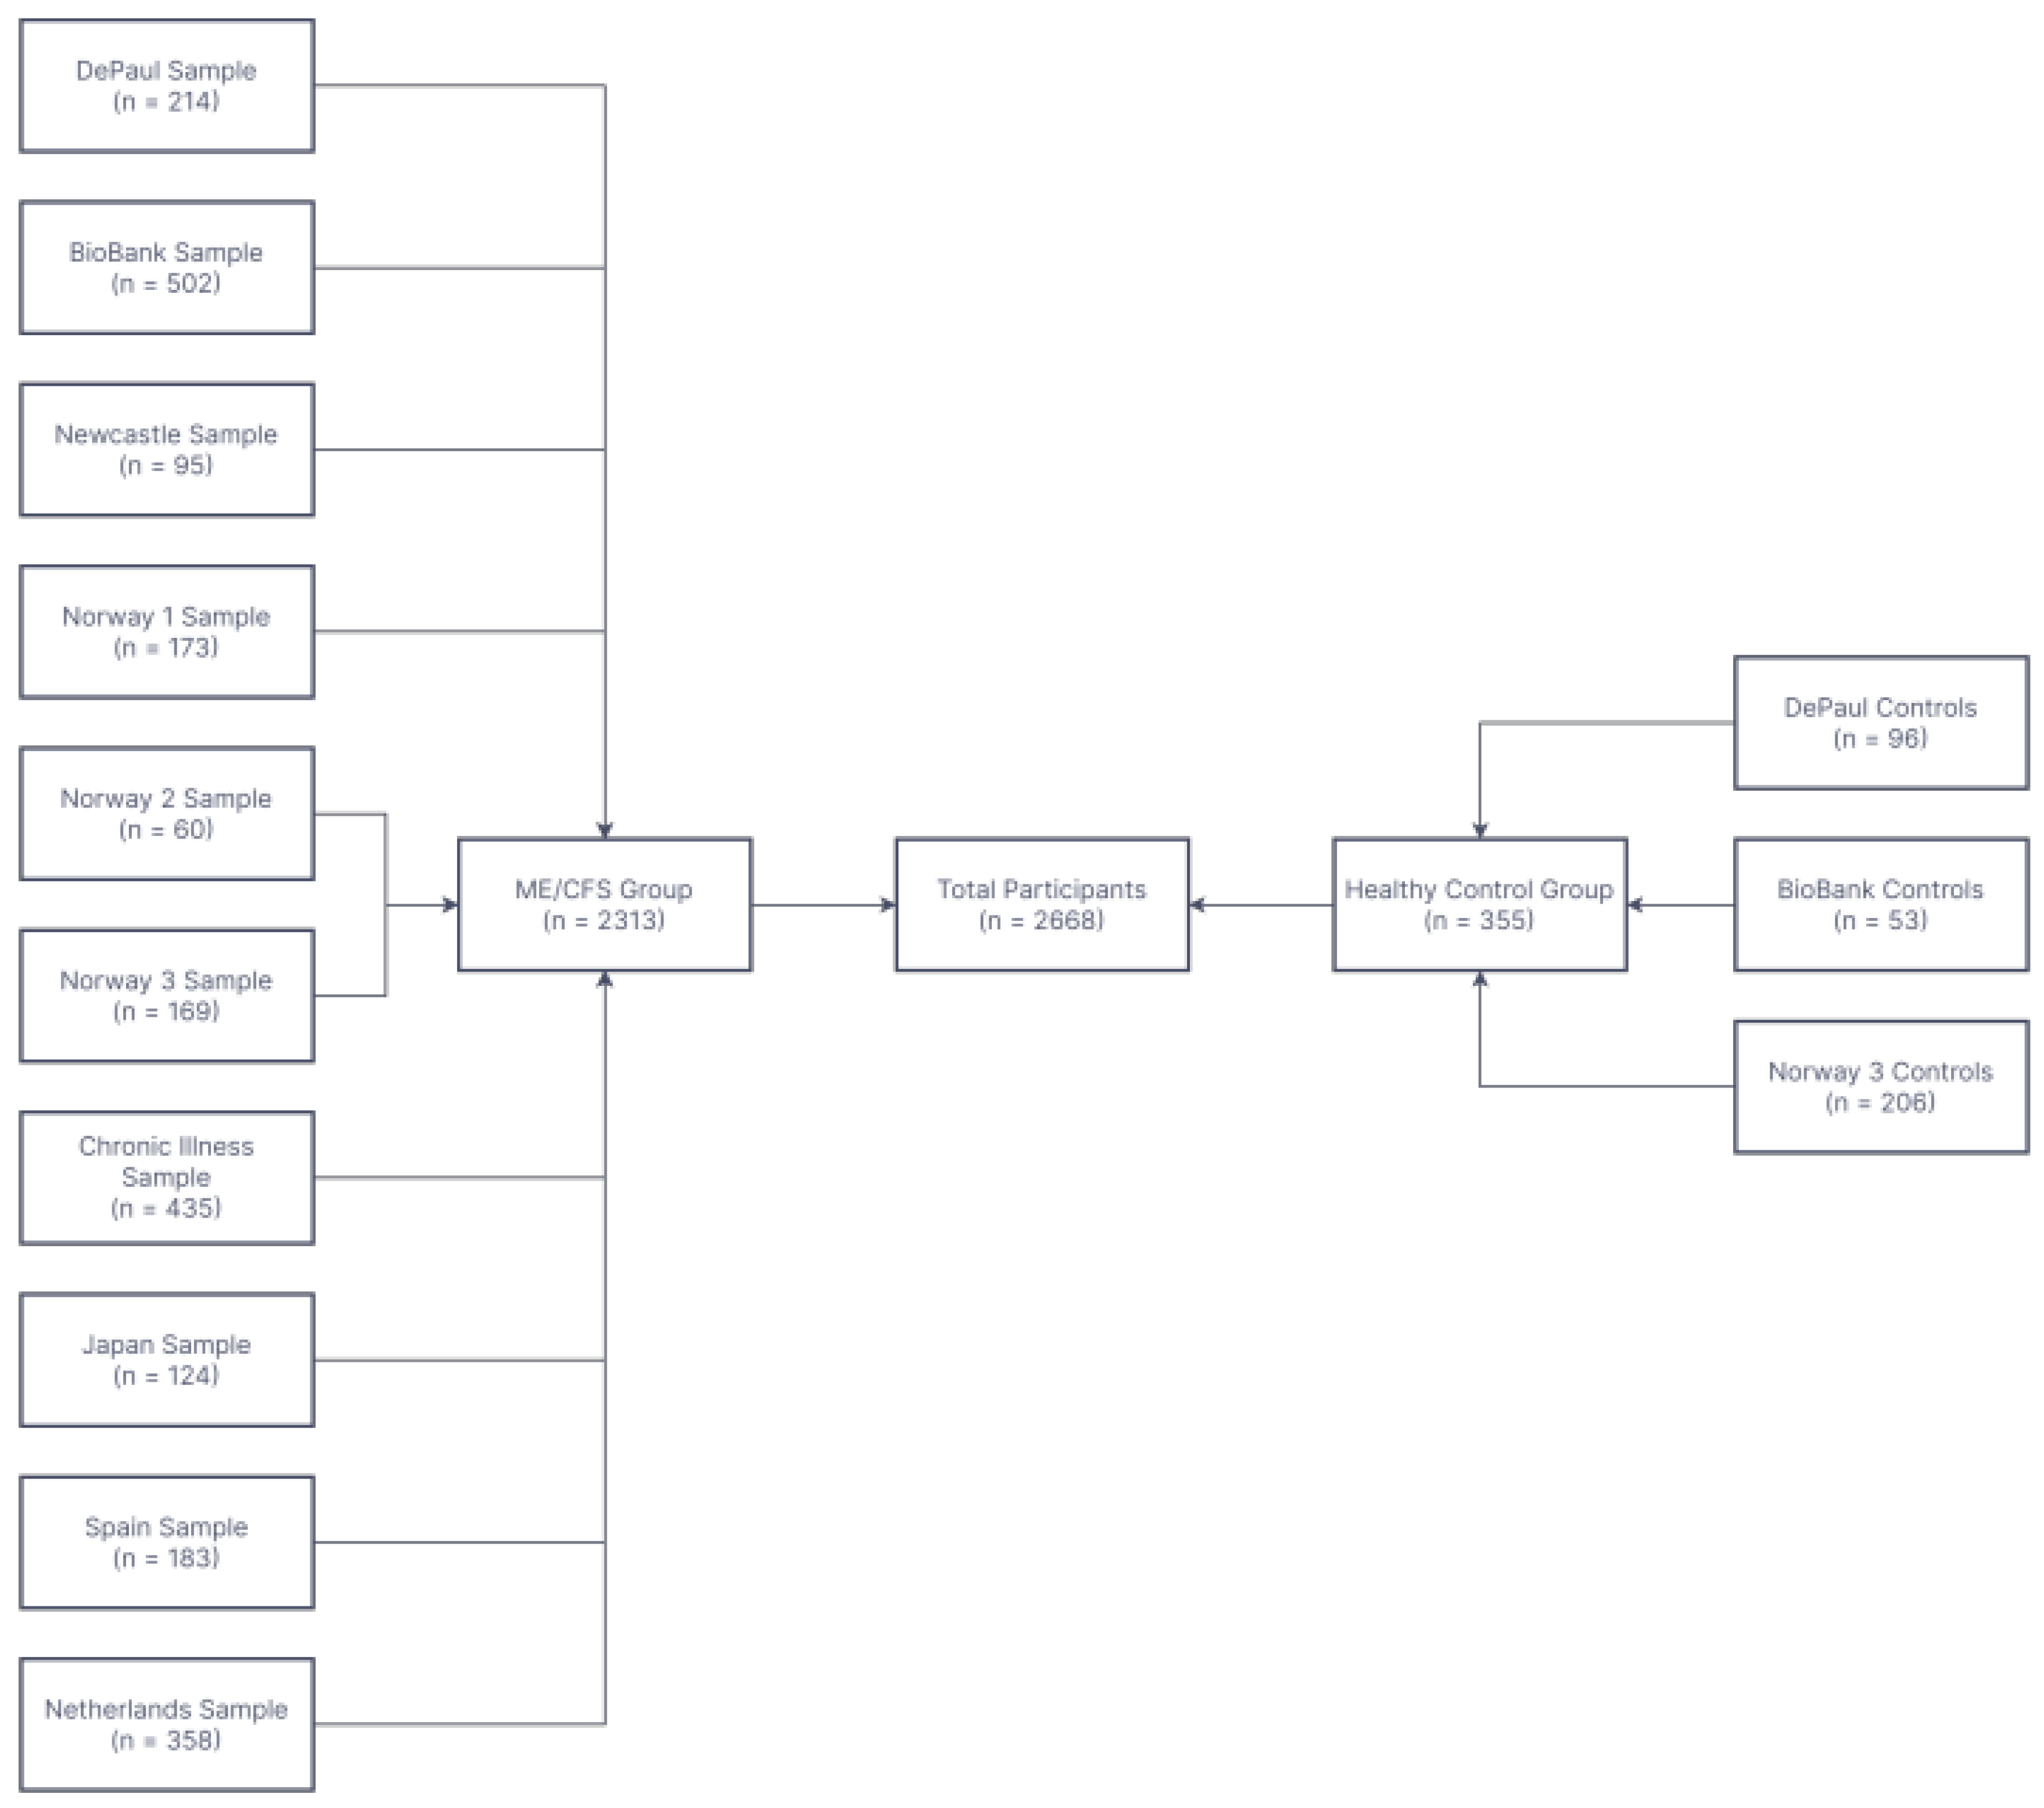
Figure 1 provides the numbers of individuals that were involved in Study 1 with data collected internationally, and more details of the sample are available at Conroy et al. (2022). The first sample was called the DePaul sample and included 214 participants who self-reported a diagnosis of ME/CFS. The sample was mostly female (84.0%) and had an average age of 52 years. The second sample of 502 participants is referred to as the BioBank sample, as it was collected by physicians at the Solve ME/CFS Initiative. This sample was also mostly female (76.8%) and were an average age of 54.8 years. A sample of 95 respondents from Great Britain is referred to as the Newcastle sample, and as with the other samples, most respondents were female (82.1%) with a mean age of 45.8. Three samples were collected from Norway, and they are referred to as Norway 1 sample (with 173 patients), Norway 2 sample (N = 60), and Norway 3 sample (N = 169). These samples were also mostly female (from 81.7% to 87.2%) and aged from 35.4 to 43.3 years old. The next sample of 435 participants is called the chronic illness sample, and was 88.4% female and of a mean age of 49.6 years. The Japan sample included 124 participants who were mostly female (78.2%) and a mean 46.1 years of age. A Spanish sample included 183 participants that they were mostly female (85.7%) and had an average age of 50.4 years. The final sample was from Amsterdam and included 358 participants who were, once again, mostly female (78.4%) and had an average age of 37.0 years.
2.1.2. Control Group
The healthy control group consisted of 355 adults aggregated from three independent samples. The DePaul controls consisted of 96 students, with an average age of 19.9 years, of which 70.8% were female (which was considerably younger than the ME/CFS samples). The BioBank controls consisted of 53 healthy adults with a mean age of 56.1 years, and two-thirds were female. The final sample was called the Norway 3 controls, which consisted of 206 healthy adults of an average age of 31.4 and 68.6% were female.
3. Measure
The DePaul Symptom Questionnaire ([DSQ-1] [5] measures 54 symptoms of ME/CFS. Participants rate the frequency of symptoms over the past 6 months on a 5-point scale (0 = none of the time, 1 = a little of the time, 2 = about half the time, 3 = most of the time, and 4 = all of the time). The severity of each symptom over the past 6 months was also rated on a 5-point scale (0 = symptom not present, 1 = mild, 2 = moderate, 3 = severe, and 4 = very severe). For Study 1, we only selected four items that measured the IOM criteria, and they were fatigue (“fatigue/extreme tiredness”), unrefreshing sleep (“feeling unrefreshed after you wake up in the morning”), cognitive impairment (“problems remembering things”), and post-exertional malaise (“minimal exercise makes you physically tired”). The frequency scores and severity scores were standardized to a 100-point scale. For each symptom, the frequency and severity scores were averaged to create one composite score per symptom. The DSQ-1 has demonstrated high test–retest reliability among persons with ME/CFS and controls [9], shown excellent internal consistency [8], and yielded valid and clinically useful results [10].
Methods for Replacing Missing Values
If 10% or more of the participants had missing responses, their items were removed and for the remaining participants, an imputation system was used that is described elsewhere [8].
4. Results
There were 2313 individuals with ME/CFS in our database and 355 controls without ME/CFS. Table 1 examines whether the frequency and severity scores differed for the four targeted DSQ symptoms for the two groups. The four symptoms for the ME/CFS group had frequency scores significantly higher than the severity scores. For the control group, two of the four symptoms examined had frequency scores significantly higher than severity scores.
Table 2 explores the correlations between the frequency and severity scores, and the correlations were significantly higher for Controls versus those with ME/CFS. As the fatigue variable had the lowest correlation between frequency and severity for the ME/CFS sample, we decided to examine scores in more detail in cases with inconsistencies, and these are reported in Table 3. As is evident, there are multiple individuals who indicated extremely low frequencies very few times (1 s), but higher severity ratings of severe or very severe (3 s or 4 s). In addition, there were multiple individuals who reported low severity scores of mild (1) but with frequencies of most or all of the time (3 s or 4 s). If investigators do not use both a threshold of a score of 2 for frequency for half of the time or higher, and a threshold of at least a severity score of 2 (at least moderate severity), some individuals will not meet the threshold of a rating of 2 or higher for both frequency and severity. Therefore, some symptoms might be identified as being a burden when the rating of the symptom is a 0 or 1 for frequency (none of the time or a little) or severity (symptom not present or mild).
Study 2
ME/CFS symptoms need to occur for at least 6 months to meet most case definitions, but long COVID symptoms can meet diagnostic criteria for shorter periods of time, such as after only one month of persistent symptoms following an infection of SARS-CoV-1 [11]. The length of the onset of symptoms has been explored in the ME/CFS area [12], but not for those with long COVID. Study 2 explored if differences in symptom ratings occurred with a time frame of 1 versus 6 months. In addition, whereas Study 1 compared differences in people with ME/CFS and a control group in terms of rating frequency and severity scales for somatic symptoms, Study 2 explored changes in the wording of the severity scale. We explored the test–retest reliability of a standard way of wording symptoms of ME/CFS and then evaluated whether differences in how the severity was worded would result in any differences in reliability.
5. Method
Whereas Study 1 focused on those with ME/CFS versus control groups, Study 2 recruited 480 individuals with long COVID. The respondents were recruited using social media sites dedicated to COVID-19 and long COVID communities and groups. This sample is reported on in more detail in Jason and Dorri [13], and it involved securing responses from three questionnaires. Two of the questionnaires had been previously validated, and they included the DePaul Symptom Questionnaire-short form (DSQ-SF), which has 14 items from the DSQ-1, and this abbreviated questionnaire has been found to have good reliability and validity [14]. In addition, respondents completed the DePaul Symptom Questionnaire-Post Exertional Malaise (DSQ-PEM), which has 10 questions. The DSQ-PEM has also been shown to have adequate psychometric properties [15]. The DSQ-SF was administered to participants before the DSQ-PEM. Both scales were filled out with the time period for symptoms being the last 6 months. As two of the questions on the DSQ-SF are similar to the DSQ-PEM (“Next day soreness or fatigue after non-strenuous, everyday activities” and “Minimum exercise makes you physically tired”), with a similar 6 month period of time as measured in Study 1, we were able to assess the reliability of participants answering the same questions twice in this study.
In Study 2, the first questionnaire that the respondents with long COVID completed was called the DePaul Symptom Questionnaire-COVID (DSQ-COVID), which has also been found to have adequate construct validity [16]. The survey had 38 of the most common long COVID symptoms, including fatigue, but the fatigue question was also on the DSQ-SF. The time period for questions on the DSQ-COVID was the last month, whereas the time period for the DSQ-SF was the last 6 months. The frequency scale for this new questionnaire (DSQ-COVID) had the same question asked to the respondents; however, the severity questions had one difference. For the DSQ-SF, respondents were asked “throughout the past 6 months, how much has this symptom bothered you?” Whereas for the DSQ-COVID, respondents were asked: “Throughout the past month, when a symptom below was present, how severe was it?” While the questions’ stems differed, severity responses were similar, and included 0 = symptom not present, 1 = mild, 2 = moderate, 3 = severe, and 4 = very severe. For Study 2, we were thus able to compare possible differences in the responses to fatigue with different time periods (6 versus 1 month) and with stems assessing being “bothered” versus “how severe” the symptom was.
6. Results
When the participants answered the identical questions from the DSQ-SF and the DSQ-PEM, the intercorrelation was (r = 0.77, p < 0.01) for “Next day soreness or fatigue after non-strenuous, everyday activities”, with the DSQ-SF having a mean severity score of 3.45 (SD = 1.07) and the DSQ-PEM having a mean severity score of 3.33 (SD = 1.08). Similar results were found for the item “Minimum exercise makes you physically tired,” where the intercorrelation was (r = 0.81, p < 0.01), with the DSQ-SF having a mean severity score of 3.61 (SD = 1.07) and the DSQ-PEM having a slightly lower mean severity score of 3.46 (SD = 1.11). In addition, when the fatigue question was asked in a different way, from the 6-month period for the DSQ-SF (using the term “bother”) and the 1-month period for the DSQ-COVID (using the term how “severe”), the correlation was slightly lower at (r = 0.69, p < 0.01). This item was found to have a mean severity score of 3.67 (SD = 0.95) on the DSQ-SF and a mean severity score of 3.55 (SD = 0.87) on the DSQ-COVID.
7. Discussion
Study 1′s main finding is that among individuals with ME/CFS, frequency scores tend to be higher than their severity scores, and the correlations between frequency and severity scores are lower for those with ME/CFS than control groups. When examining the fatigue and unrefreshed sleeping scores, the correlations between frequency and severity suggest that only about 25% of the variance is explained for those with ME/CFS. It appears that control groups have a closer correspondence between frequency and severity scores for the four somatic symptoms than those with ME/CFS, which replicates prior results where one larger factor was found among somatic items for a healthy control group, whereas those with ME/CFS had more differentiated symptom factor scores [17]. Just as with Eskimos who can differentiate multiple varieties of snow, patients with ME/CFS can differentiate in more sophisticated ways subtle frequency and severity differences in symptoms that are not noticed among those in the non-symptomatic, healthy population. The findings suggest that there is considerable merit in assessing both frequency and severity for these somatic symptoms among patients with ME/CFS.
Patients are asked in many somatic interview schedules whether a symptom has occurred, but as many somatic symptoms are widespread in community and clinic samples, these efforts do not provide a useful threshold for deciding whether a problem is severe enough to be a problem or burden to the participants [5]. For example, classification systems assessing long COVID rarely differentiate severity from frequency and most just focus on the occurrence of symptoms, but many long COVID symptoms (e.g., fatigue) are common. As indicated in Study 1, there are differences between frequency and severity, and by using frequency and severity measures when assessing symptoms, it might be possible to more accurately assess long COVID symptoms.
Study 2 explored how respondents would respond to similar questions on the DSQ-SF and DSQ-PEM and the correlations were high, suggesting there is adequate stability in the measure. When the question was worded differently in terms of 1 versus 6 months and changing the term “bother” to “severity”, the correlation, again, was relatively high, although lower than when the questions were asked in an identical way. While it is difficult to determine whether it was the alternate time frame or alternate wording that most influenced differences in patient scores, this lower correlation may reflect differences in how patients interpret the severity of a symptom versus how much a symptom bothers them. Since scores were slightly higher when the question used “bother” rather than “severity”, this may indicate that patients believe the bothersome nature of a symptom to be greater than the actual severity of that symptom. The term bother may provide a broader view of patient impairment than severity alone, although further research is needed to better understand patients’ interpretations of these terms. Overall, the findings suggest that small changes in either the length of symptoms or using the words “bother” or “severity” does not dramatically change the outcomes.
There are several limitations in the current studies. Individuals in Study 1 were diagnosed using different case definitions, so it is probable that all patients did not meet the IOM [6] criteria. In addition to the criteria for sample selection not being homogeneous among the different datasets used in Study 1; in some groups, the patients self-reported having ME/CFS; in others, they were identified by the doctor; in others, they were members of patient associations. Furthermore, the qualifications of the selecting doctors were not specified. The samples had a higher prevalence of women, and there might have been a gender influence on the perception of symptoms reported. Furthermore, the control sample was younger in Study 1 than the ME/CFS sample. In addition, there was not an independent verification of the self-report data using more biological indicators, although other studies have confirmed these types of relationships [5]. Finally, the data reported on in Study 1 is for only one illness, that being ME/CFS, so caution needs to be exercised in extending the findings to other post-viral illnesses.
In conclusion, the psychometric issues reviewed in this article are of importance for the development and validation of any case definition. When investigators use case definitions using symptoms selected and measured in different ways, criterion variance occurs [18]. Empirical approaches can contribute to helping specify which symptoms and domains have both the needed sensitivity and specificity. As an example, machine learning or data mining has been used to contrast case definitions and determine which symptoms are most useful in accurately diagnosing ME/CFS [3]. The current study suggests that improvements to the diagnostic process can occur with the utilization of more sophisticated methods for characterizing symptoms, suach as the use of both frequency and severity measures in surveys.
Author Contributions
Conceptualization, L.A.J. and S.B.; methodology, L.A.J. and S.B.; formal analysis, L.A.J., S.B. and N.H.; resources, L.A.J.; writing—original draft preparation, L.A.J. and S.B.; writing—review and editing, L.A.J., S.B. and N.H.; supervision, L.A.J.; funding acquisition, L.A.J. All authors have read and agreed to the published version of the manuscript.
Funding
Funding was provided by the National Institute of Neurological Disorders and Stroke (Grant number: 5R01NS111105).
Institutional Review Board Statement
All data were collected with approval from the DePaul Institutional Review Board.
Informed Consent Statement
Not applicable.
Data Availability Statement
Data can be made available by contacting the first author.
Conflicts of Interest
The authors declare no conflict of interest.
References
- Dorri, J.A.; Jason, L.A. An exploratory factor analysis of Long-COVID. Cent. Asian J. Med. Hypotheses Ethics 2022, 3. Available online: https://cajmhe.com/index.php/journal/article/view/217/93. [CrossRef]
- Conroy, K.E.; Islam, M.F.; Jason, L.A. Evaluating case diagnostic criteria for Myalgic Encephalomyelitis/Chronic Fatigue Syndrome (ME/CFS): Toward an empirical case definition. Disabil. Rehabil. 2023, 45, 840–847. [Google Scholar] [CrossRef] [PubMed]
- Cotler, J.; Holtzman, C.; Dudun, C.; Jason, L.A. A brief questionnaire to assess post-exertional malaise. Diagnostics 2018, 8, 66. [Google Scholar] [CrossRef] [PubMed]
- Evans, M.; Jason, L.A. The impact of symptom stability on timeframe and recall reliability in CFS. Cogent Psychol. 2015, 2, 1079945. [Google Scholar] [CrossRef] [PubMed]
- Institute of Medicine. Beyond Myalgic Encephalomyelitis/Chronic Fatigue Syndrome: Redefining an Illness; The National Academies: Washington, DC, USA, 2015. [Google Scholar]
- Jason, L.A.; Boulton, A.; Porter, N.S.; Jessen, T.; Njoku, M.G.; Friedberg, F. Classification of Myalgic Encephalomyelitis/chronic fatigue syndrome by types of fatigue. Behav. Med. 2010, 36, 24–31. [Google Scholar] [CrossRef] [PubMed]
- Jason, L.A.; Choi, M. Dimensions and assessment of fatigue. In Fatigue Science for Human Health; Yatanabe, Y., Evengard, B., Natelson, B.H., Jason, L.A., Kuratsune, H., Eds.; Springer: Tokyo, Japan, 2008; pp. 1–16. [Google Scholar]
- Jason, L.A.; King, C.P.; Richman, J.A.; Taylor, R.R.; Torres, S.R.; Song, S. U.S. case definition of chronic fatigue syndrome: Diagnostic and theoretical issues. J. Chronic Fatigue Syndr. 1999, 5, 3–33. [Google Scholar] [CrossRef]
- Jason, L.A.; Dorri, J.A. ME/CFS and Post-Exertional Malaise among patients with Long COVID. Neurol. Int. 2023, 15, 1–11. [Google Scholar] [CrossRef] [PubMed]
- Jason, L.A.; So, S.; Brown, A.A.; Sunnquist, M.; Evans, M. Test–Retest Reliability of the DePaul Symptom Questionnaire. Fatigue Biomed. Health Behav. 2015, 3, 16–32. [Google Scholar] [CrossRef] [PubMed]
- Jason, L.A.; Kot, B.; Sunnquist, M.; Brown, A.; Evans, M.; Jantke, R.; Williams, Y.; Furst, J.; Vernon, S.D. Chronic Fatigue Syndrome and myalgic encephalomyelitis: Toward an empirical case definition. Health Psychol. Behav. Med. Open Access J. 2015, 3, 82–93. [Google Scholar] [CrossRef] [PubMed]
- Jason, L.A.; Lapp, C. (Eds.) Understanding the Behavioral and Medical Impact of Long COVID: An Empirical Guide to Assessment and Treatment of Post-Acute Sequelae of SARS CoV-2 Infection; Routledge: New York, NY, USA, 2023. [Google Scholar]
- Jason, L.A.; Sunnquist, M. The development of the DePaul Symptom Questionnaire: Original, expanded, brief and pediatric versions. Front. Pediatr. 2018, 6, 330. [Google Scholar] [CrossRef] [PubMed]
- Jason, L.A.; Sunnquist, M.; Kot, B.; Brown, A. Unintended consequences of not specifying exclusionary illnesses for Systemic Exertion Intolerance Disease. Diagnostics 2015, 5, 272–286. [Google Scholar] [CrossRef] [PubMed]
- King, C.; Jason, L.A. Improving the diagnostic criteria and procedures for chronic fatigue syndrome. Biol. Psychol. 2005, 68, 87–106. [Google Scholar] [CrossRef] [PubMed]
- Murdock, K.W.; Wang, X.S.; Shi, Q.; Cleeland, C.S.; Fagundes, C.P.; Vernon, S.D. The Utility of Patient Reported Outcome Measures Among Patients with Myalgic Encephalomyelitis/Chronic Fatigue Syndrome. Qual. Life Res. 2017, 26, 913–921. [Google Scholar] [CrossRef] [PubMed]
- Sunnquist, M.; Lazarus, S.; Jason, L.A. The development of a short form of the DePaul symptom questionnaire. Rehabil. Psychol. 2019, 64, 453–462. [Google Scholar] [CrossRef] [PubMed]
- Watson, S.; Ruskin, A.; Simonis, V.; Jason, L.; Sunnquist, M.; Furst, J. Identifying defining aspects of chronic fatigue syndrome via unsupervised machine learning and feature selection. Int. J. Mach. Learn. Comput. 2014, 4, 133–138. [Google Scholar] [CrossRef]
Figure 1.
Flowchart of patients and controls for Study 1.


Table 1.
Comparisons of frequency and severity scores for ME/CFS and controls.
| ME/CFS | Controls | |||||
|---|---|---|---|---|---|---|
| Fatigue | Mean (SD) | t | Sig. (2-Tailed) | Mean (SD) | t | Sig. (2-Tailed) |
| Frequency | 3.27 (0.83) | 12.43 | 0.00 | 0.90 (1.04) | −0.79 | 0.43 |
| Severity | 3.07 (0.76) | 0.92 (1.07) | ||||
| Minimum Exercise | ||||||
| Frequency | 3.05 (1.02) | 10.53 | 0.00 | 0.46 (0.86) | 2.93 | 0.00 |
| Severity | 2.89 (1.00) | 0.41 (0.77) | ||||
| Unrefreshing Sleep | ||||||
| Frequency | 3.32 (0.90) | 13.52 | 0.00 | 1.31 (1.03) | 2.41 | 0.02 |
| Severity | 3.08 (0.95) | 1.24 (0.97) | ||||
| Problems Remembering | ||||||
| Frequency | 2.57 (1.14) | 6.35 | 0.00 | 0.72 (0.91) | 0.00 | 1.00 |
| Severity | 2.47 (1.11) | 0.72 (0.95) |
Table 2.
Frequency and severity correlations and Fisher’s z transformation results.
| DSQ Item | Correlations for ME/CFS (N = 2313) | Correlations for Controls (N = 355) | Fisher’s z | p-Value |
|---|---|---|---|---|
| Fatigue: Frequency by Severity | R = 0.54 | R = 0.84 | −10.69 | 0.00 |
| Minimum Exercise: Frequency by Severity | R = 0.73 | R = 0.92 | −11.31 | 0.00 |
| Unrefreshed Sleep: Frequency by Severity | R = 0.57 | R = 0.84 | −9.83 | 0.00 |
| ProblemsRemembering: Frequency by Severity | R = 0.79 | R = 0.92 | −8.89 | 0.00 |
Table 3.
Discrepant Frequency and Severity Scores for Fatigue.
| Fatigue Scores | ||
|---|---|---|
| Participant | Frequency | Severity |
| 01 | 3 | 1 |
| 02 | 3 | 1 |
| 03 | 3 | 1 |
| 04 | 3 | 1 |
| 05 | 4 | 1 |
| 06 | 4 | 1 |
| 07 | 4 | 1 |
| 08 | 4 | 1 |
| 09 | 1 | 3 |
| 10 | 1 | 3 |
| 11 | 1 | 3 |
| 12 | 1 | 3 |
| 13 | 1 | 3 |
| 14 | 1 | 3 |
| 15 | 1 | 3 |
| 16 | 1 | 3 |
| 17 | 1 | 3 |
| 18 | 1 | 3 |
| 19 | 1 | 3 |
| 20 | 1 | 4 |
| 21 | 1 | 4 |
| 22 | 1 | 4 |
| 23 | 1 | 4 |
| 24 | 1 | 4 |
| 25 | 1 | 4 |
Disclaimer/Publisher’s Note: The statements, opinions and data contained in all publications are solely those of the individual author(s) and contributor(s) and not of MDPI and/or the editor(s). MDPI and/or the editor(s) disclaim responsibility for any injury to people or property resulting from any ideas, methods, instructions or products referred to in the content. |
© 2023 by the authors. Licensee MDPI, Basel, Switzerland. This article is an open access article distributed under the terms and conditions of the Creative Commons Attribution (CC BY) license (https://creativecommons.org/licenses/by/4.0/).
Share and Cite
MDPI and ACS Style
Jason, L.A.; Benner, S.; Hansel, N. Comparing Frequency and Severity Ratings for ME/CFS versus Controls. Psych 2023, 5, 662-669. https://doi.org/10.3390/psych5030042
AMA Style
Jason LA, Benner S, Hansel N. Comparing Frequency and Severity Ratings for ME/CFS versus Controls. Psych. 2023; 5(3):662-669. https://doi.org/10.3390/psych5030042
Chicago/Turabian StyleJason, Leonard A., Sage Benner, and Nicole Hansel. 2023. "Comparing Frequency and Severity Ratings for ME/CFS versus Controls" Psych 5, no. 3: 662-669. https://doi.org/10.3390/psych5030042