Influence of Wall Thickness and Water Content on the Out-of-Plane Stability of Adobe Walls


1
Department of Civil Engineering, New Mexico State University, Las Cruces, NM 88003-8001, USA
2
Department of Architectural Engineering, Hashemite University, Zarqa 13133, Jordan
*
Author to whom correspondence should be addressed.
Infrastructures 2020, 5(9), 78; https://doi.org/10.3390/infrastructures5090078
Submission received: 2 August 2020
/
Revised: 15 September 2020
/
Accepted: 17 September 2020
/
Published: 22 September 2020
(This article belongs to the Special Issue Selected Papers from the REHABEND 2020 Congress)
Abstract
:This paper presents the results of a numerical study using the finite element method to assess the effect of wall thickness and a moist region along the wall base on the out-of-plane lateral stability of adobe walls. The models consisted of cantilever unreinforced adobe walls with a thickness of 25 cm, 30 cm, and 40 cm. Numerical analyses were performed for four lengths (L) of the moist region and for dry walls. The moist region was modelled with material characteristics corresponding to partially saturated and nearly saturated adobe. The results showed the detrimental effect of moisture along the lower portion of the wall on the out-of-plane lateral strength. The out-of-plane lateral strength reduction ratio dropped significantly as L increased. A high slenderness ratio was found to be critical for cantilever adobe walls when L extended beyond half of the wall length. The results provided insights concerning the role of wall thickness in the stability against overturning.
1. Introduction
Adobe structures are becoming an important part of the architectural identity of many cities in the southwestern region of the United States of America (USA). In addition, many landmarks with historic significance were built with adobe. Adobe bricks are made by forming mud into bricks and drying them under the sun. Traditionally, adobe walls are constructed by laying the brick units in alternating courses, filling the bed and head joints with mud mortar that has the same soil constituents as the bricks. The soils used to make adobe bricks typically contain fractions of clay, silt, and sand. Cut straw is often added to the adobe mixture to help obtain even drying and in turn reduce the shrinkage cracking of the bricks.
Adobe walls are usually thick, load bearing walls. They have high thermal mass that results in an excellent passive temperature control inside of the building [1]. However, adobe walls are susceptible to water damage [2,3,4,5]. Heavy rain, shallow ground water, and poor runoff drainage system may cause the increase of water content in adobe walls. Water can penetrate through cracks in the plaster and move up in the wall by capillary action. When the wall plaster has low permeability, such as cement-based stucco, water remains entrapped inside the wall [5]. Problems related to moisture and the associated material weathering, like basal erosion, coving, and bulging, have been observed in the walls of many adobe buildings in the Rio Grande region, southern New Mexico, USA.
In historic and older adobe buildings that generally include adobe footings, uncontrolled or excessive moisture in the adobe walls has been reported as the most prevalent cause of deterioration [3,5]. Capillary rise from ground water was the primary cause of wall damage in the Mission San Cayetano de Tumacácori (1691), located in Santa Cruz County, Arizona, USA. Water content values up to 16% and moisture as high as 90 cm above the ground were recorded in the walls of this historic church building [4]. As part of an ongoing project led by the second author at New Mexico State University, gravimetric water content values up to 9.5% and 11.5% have been recorded in the adobe footing and walls (30 cm above the ground surface), respectively, in the Amador Building (c. 1870), a two-story historic building located in Las Cruces, New Mexico, USA [6]. The walls of the first story of the Amador Building are approximately 76 cm thick. In both buildings, the adobe walls required significant restoration due to the damage caused by moisture over the years. Nevertheless, despite the moisture damage, the walls were still standing before the restoration efforts, likely due to their considerable thickness. On the other hand, modern adobe structures may have much thinner walls. The New Mexico Earthen Building Materials Code [7] allows the construction of unstabilized adobe walls with a minimum thickness of about 25 cm (10 inches). The stability of adobe walls with such small thickness could become an issue if the material properties or other code-specified requirements change during their service life.
The moisture entrapped within an adobe wall can reduce the compressive and tensile strengths of the adobe bricks and mud mortar and, consequently, compromise its ability to resist structural and environmental loads [8,9,10,11,12]. Several approaches to improve moisture resistance of adobe, such as additives, plastering materials, and laser material treatments [13,14,15,16], have been studied. However, most of the experimental and numerical research that addresses the structural stability of adobe walls assumes dry wall conditions. Limited research has considered the wall performance when part of the wall is moist or damp. Hence, experience is often used to predict the wall’s structural integrity. An empirical scale based on the water content of the adobe recommends implementing safety procedures for the structure when the water content is 9% or higher [5]. The work on this paper is part of a research program at New Mexico State University that aims to determine the critical conditions of water content that might lead to a considerable drop in the lateral strength of adobe walls.
Finite element (FE) modeling has been used to study the structural behaviour of adobe walls [17,18,19,20,21,22,23]. The adobe brick units and mortar are often modeled as a continuum at the macroscale. The macroscale modelling approach is preferable when studying the global behaviour of relatively large structures because it requires fewer input parameters and computational effort [24]. The structural behaviour of laterally loaded adobe masonry construction can be approximated with sufficient accuracy in the macroscale approach despite the inherent simplifications of the method [19]. The macro modelling approach was adopted in [18,21] to simulate the experimental setup of dry adobe walls under lateral loading conducted in [25]. The concrete damage plasticity (CDP) model was used to describe the pre-peak and post-peak behaviours of the walls. The numerical results from [18,21] represented well the global behaviour of the physical model tests in terms of crack pattern and lateral capacity. An approach to account for the weakening effect of moisture on the lateral resistant of adobe walls was developed in [21]. The approach uses a field variable to link the water content of the adobe soil within the wall to a certain set of material strength parameters. The moist soil region is defined as a set of nodes in the FE model and assumed to have lower strength than the dry soil. By assigning a field variable to this node set, the material strength parameters at that location can be easily changed during the analysis to represent the change in water content of the moist region. For validation, the behaviour of a wall with a moist region at nearly saturated conditions was compared to the behaviour of a similar wall with the same region modeled as a void or opening. The results showed comparable results in terms of the pushover curve and the distribution of plastic strains [21].
Wall stability is an important concept for masonry structures and depends on the wall geometry and boundary conditions. The out-of-plane strength of masonry walls is affected by the support conditions, aspect ratio (height to length), and slenderness ratio (height to thickness) [26]. Hence, instability failure is more likely for slender unreinforced masonry buildings and tall walls when subjected to out-of-plane lateral loading [27]. For example, wall overturning was a common failure in adobe buildings during the 2007 Peru earthquake (moment magnitude, Mw, of 8.0) especially for slender walls [28]. Similar observation was documented after the January 2001 El Salvador earthquake (Mw = 7.6) [29] and the 1994 Northridge earthquake (Mw = 6.7) [30]. Out-of-plane failure in unreinforced masonry could also happen in the absence of seismic activity. Vertical cracks due to improper corner stitching of bricks or differential settlements can cause a wall to disconnect from the rest of the structure. Material deterioration or moisture damage along the wall base (i.e., area of the wall immediately above the footing) can create a weak longitudinal rotational axis that promotes out-of-plane instability [31]. Under this condition, relatively small loading, such as the lateral thrust from a roof frame, could lead to wall collapse. The presence of a moist region above the footing was found to decrease significantly the in-plane lateral strength of adobe walls [21,31].
The literature focuses mostly on the in-plane behaviour of adobe walls, especially when subjected to seismic loads. However, understanding the out-of-plane behaviour of adobe walls is as important [32]. This paper presents and discusses the results of a numerical study to assess the effect of the wall thickness and slenderness ratio and the presence of moisture in the lower region of adobe walls on the out-of-plane lateral stability. Three cantilever adobe walls with different slenderness ratios were modeled using finite element method. Pushover curves and maximum in-plane plastic strains from the numerical analysis were used to determine and compare the stability and out-of-plane lateral strength of the walls.
2. Methodology
2.1. Model Geometry and Boundary Conditions
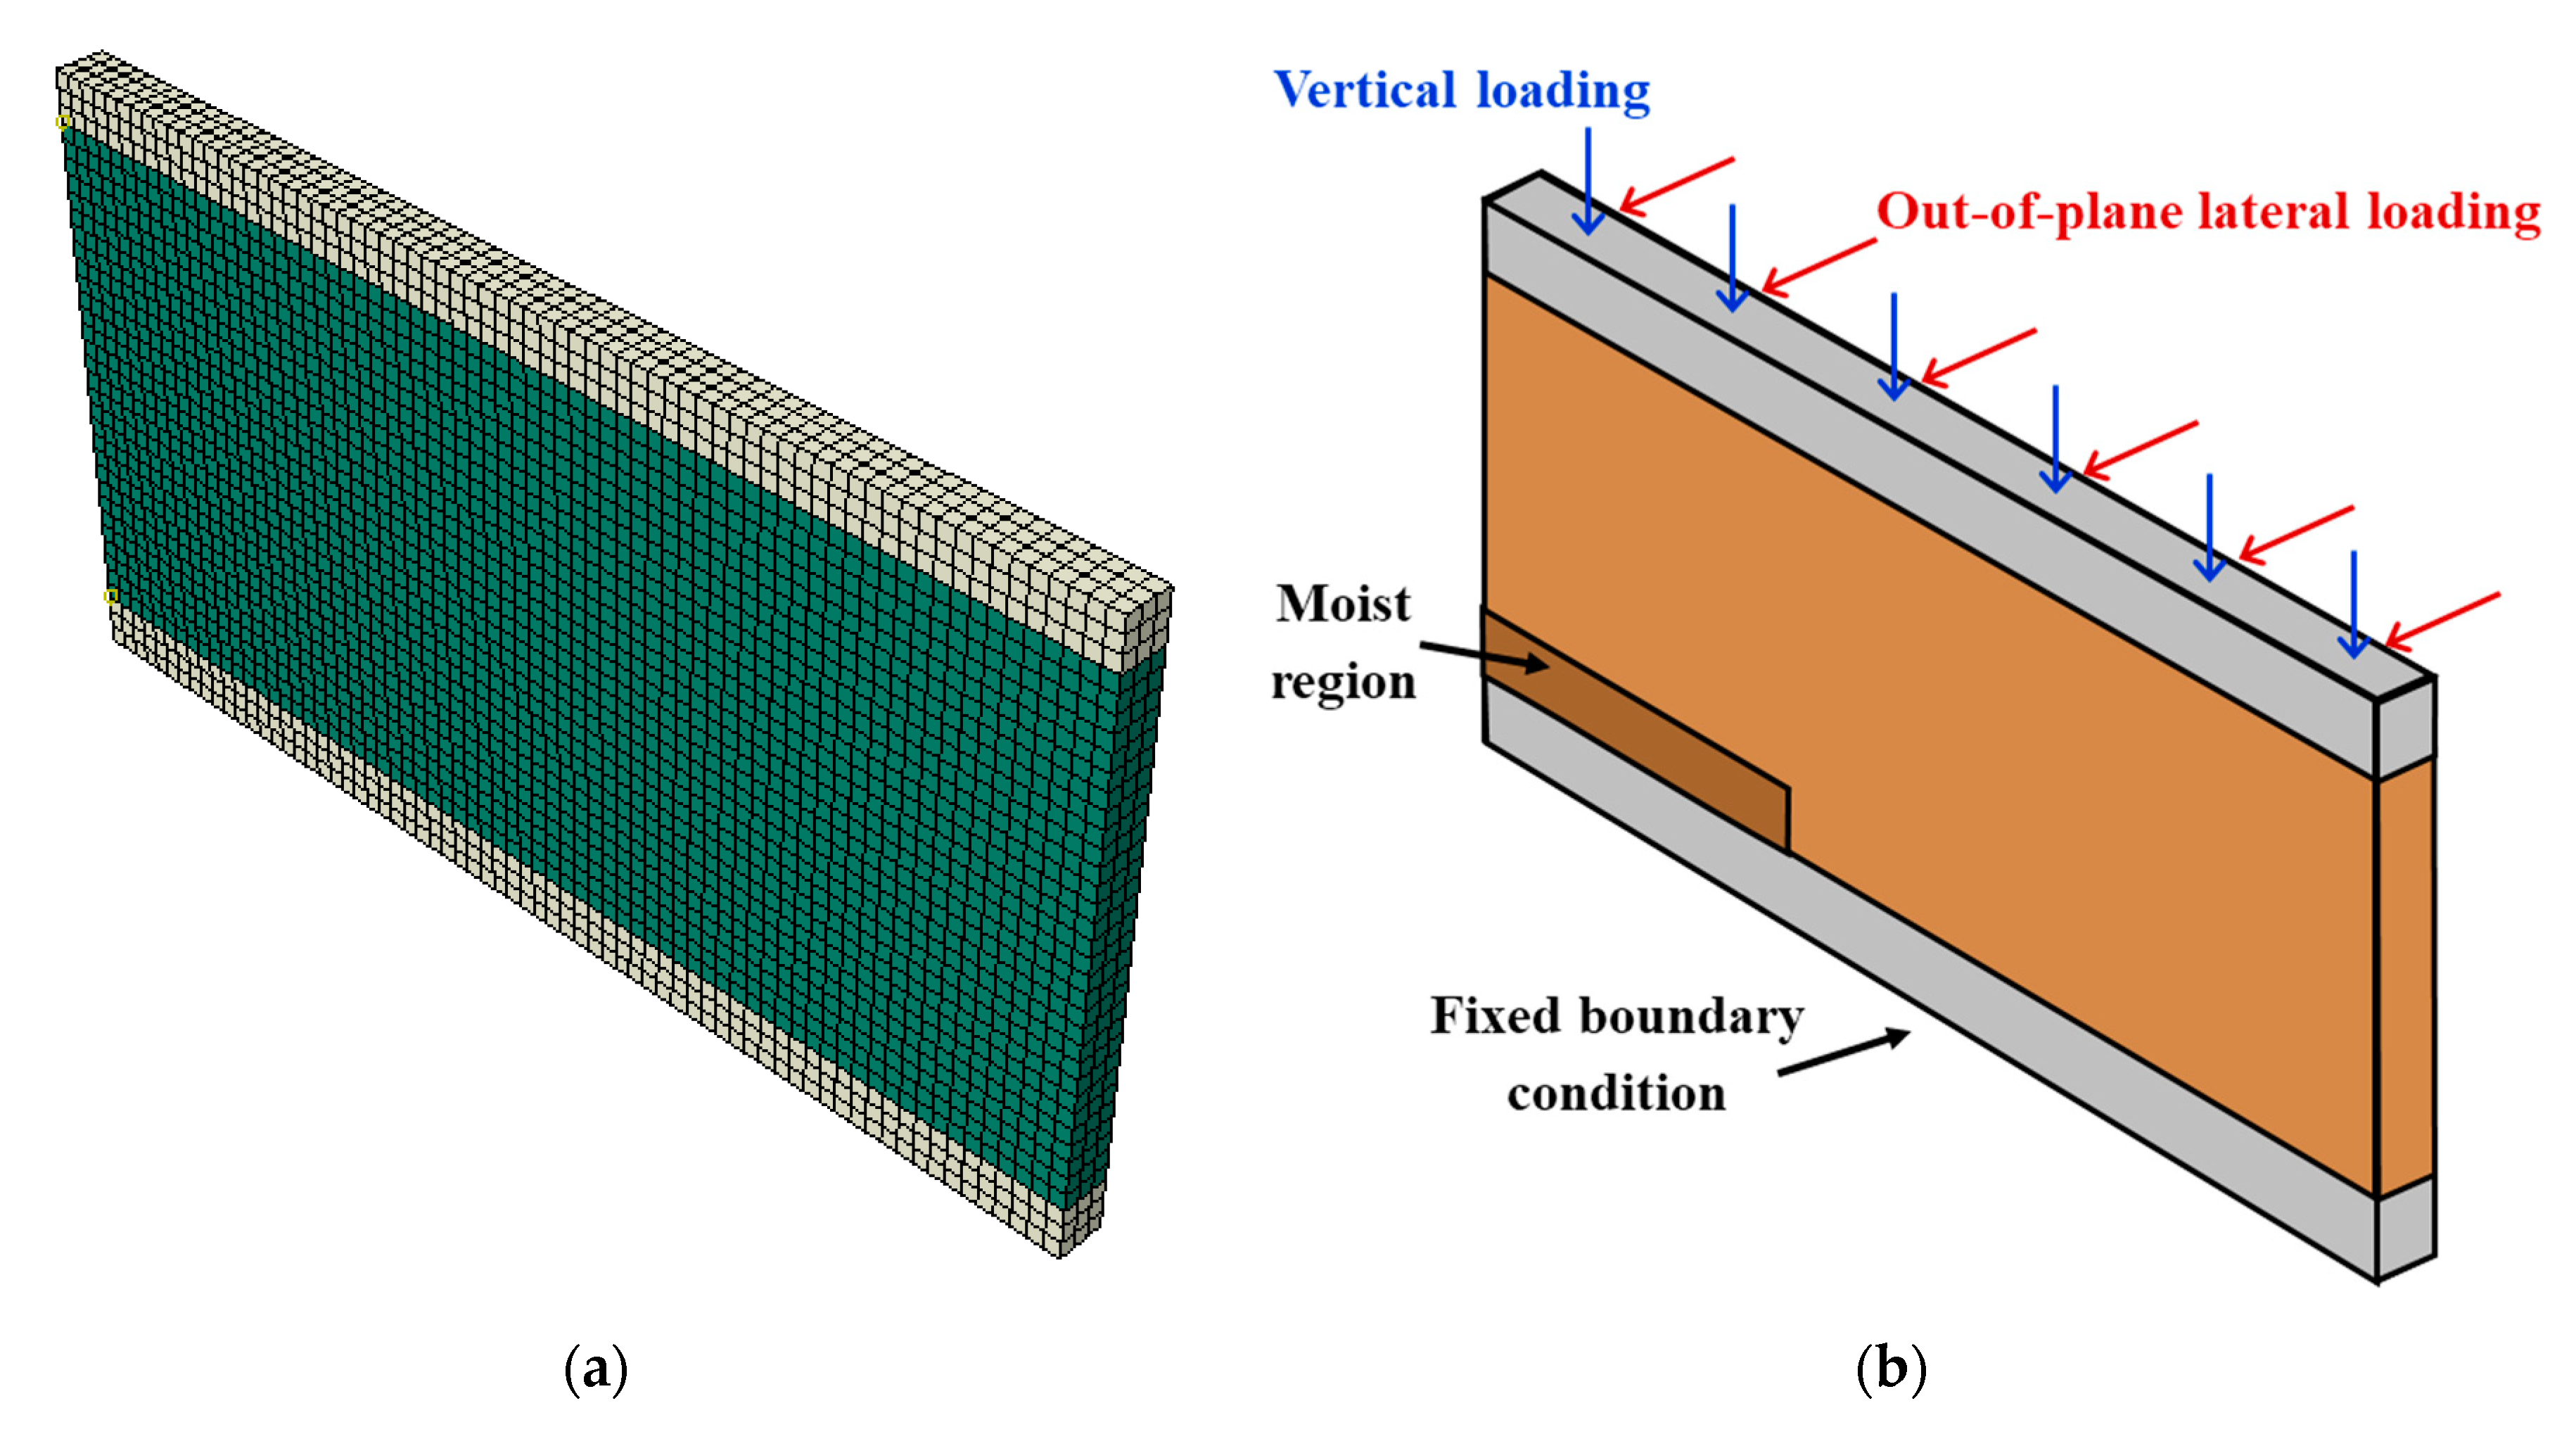
A finite element model was created using the FE analysis software Abaqus® [33] to simulate a freestanding cantilever wall subjected to lateral loading (Figure 1). The wall dimensions are 700 cm long and 300 cm high, which are within the range of the typical dimensions of exterior walls of one-story adobe dwellings in the southwestern USA. Three values of wall thickness (t) are considered, 25 cm, 30 cm, and 40 cm, corresponding to slenderness ratios (Sl) of 12, 10, and 7.5, respectively. The wall is bounded at the top and bottom by two concrete beams with no interaction. The base beam serves as the wall footing with fixed boundary conditions. The beam at the top serves as a bond beam to ensure a uniform distribution of the applied loads. The top and side boundaries of the wall are unrestricted. The concrete beams and the adobe wall are represented by linear brick solid elements (see Figure 1a). The size of each solid element is 100 × 100 × 100 mm.
The FE model includes an area with higher water content located in the lower portion of the adobe wall, immediately above the footing (See Figure 1b), herein referred to as the moist region. It is assumed that the moist region starts from one of the wall edges and extends towards the opposite side along the wall base for a specified length (L). The height of the moist region is set to be 30 cm, based on common field observations of moisture height in adobe walls. The thickness of the moist region is assumed to be constant across the wall thickness (t). Despite the fact that moisture may vary across the wall thickness depending on the water source, the assumption of constant water content and material properties across the wall thickness represents the worst-case scenario and offers a baseline against which the detrimental effect of moisture in adobe walls can be compared. For each case of t, four L values are considered, namely 100 cm, 300 cm, 500 cm, and 700 cm, in addition to the dry wall case (L = 0 cm).
2.2. Numerical Approach
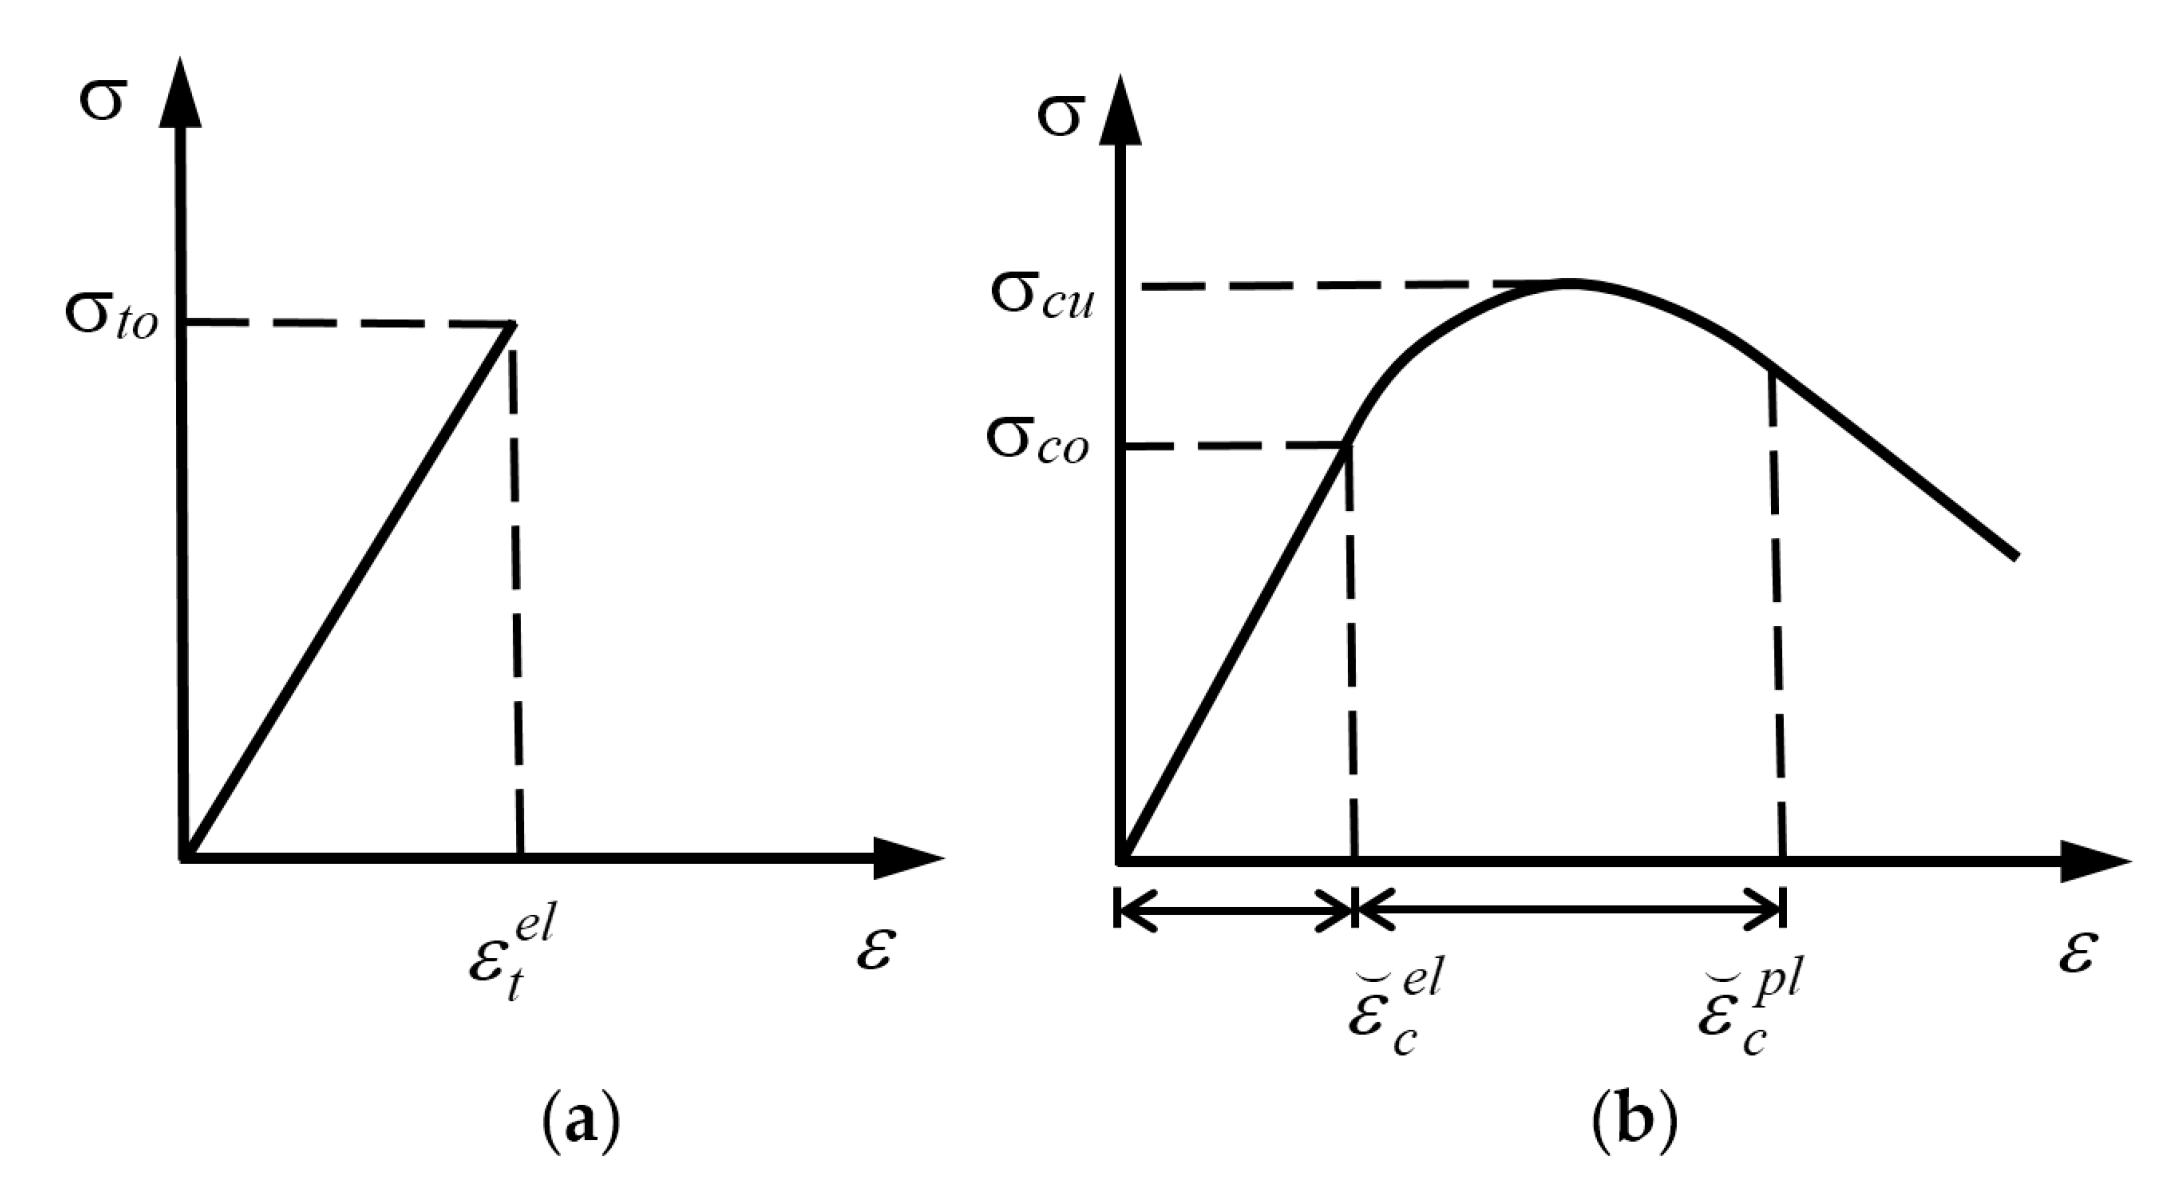
Traditionally, the same soil used to form the adobe bricks has been used for the mortar. Hence, the adobe wall is modeled herein as a homogeneous, isotropic continuum. The concrete damage plasticity (CDP) model is used in this study to account for the nonlinear behaviour of the adobe material. The CDP model is a plasticity-based damage material model in which failure is assumed to happen through tensile cracking or compressive crushing [34,35]. The uniaxial tension and uniaxial compression behaviours of the adobe material are defined by the curves illustrated in Figure 2. In uniaxial compression, the input material parameters for the plastic range of the CDP model were obtained from the results of unconfined compression tests performed on adobe soil specimens with water content (w) values ranging from 1% (air-dry adobe) to 15% (nearly saturated condition) [31]. The initial compressive failure stress (σco) was assumed to occur at 50% of the ultimate compression strength (σcu) [17,21]. The tensile failure stress (σto) values were calculated as 0.1 σco [17,21,36]. The compressive equivalent plastic strain () was calculated as the total strain minus the elastic strain (). The nonlinear stress-strain curve for each water content was input into the FE analysis as a set of stress-strain values that describe the shape of the curve. To complete the description of the yield surface of the CDP model, the values of the dilation angle (ψ), the flow potential eccentricity (∈), the relation between the initial equibiaxial compressive yield stress to the initial uniaxial compressive yield stress (fbo/fco), and a parameter that defines the shape of the yield surface in the deviatoric plane (K) are 1 degree, 0.1, 1.16, and 2/3, respectively [17,21].
In uniaxial tension, the tensile failure is assumed to have no strain softening, i.e., brittle failure. Strain softening in tension could not be considered due to the lack of literature and data about the post cracking behaviour of adobe at various values of water content. To address this limitation, a small out-of-plane lateral displacement is applied to the wall in small increments to allow for the comparison of pushover curves. The elastic parameters of the adobe material were adopted from the literature [17]. The elastic modulus (E), Poisson’s ratio (υ), and density (ρ) of the adobe material are 200 MPa, 0.2, and 1700 kg/m3, respectively. The top and bottom beams are assigned the properties of concrete: E = 22,000 MPa, υ = 0.2, and ρ = 2500 kg/m3. The input material parameters for the elastic range are assumed to be constant regardless of any change in water content (w). From preliminary analyses, it was found that changing E as a function of water content does not affect significantly the results or the lateral behaviour of the wall as long as reasonable E values for the dry adobe are used. A similar observation was made for υ. Regarding the moist adobe, the elastic range is very narrow and the selection of the E value in the analyses does not affect the results at relatively large deformations.
In the numerical model, the moist region is defined as a set of nodes in an area with dimensions L, H, and t (length, height, and thickness, respectively). This node set (moist region) is assumed to have higher gravimetric water content (w), and consequently weaker material properties, than the rest of the dry adobe in the wall. Table 1 contains the values of the initial compressive failure stress (σco) and the tensile failure stress (σto) of adobe relative to w of the adobe soil. Two scenarios for the soil conditions in the moist region are considered; one scenario with w = 7–9% (referred to as partially saturated condition or Scenario wps) and another scenario with w = 13–15% (referred to as nearly saturated condition or Scenario wns). The rest of the wall is assigned nearly dry conditions with w = 1–3%. Even though the strength properties may vary among adobe bricks (depending on characteristics of the soil constituents, proportions, regional brick making techniques, etc.), the values of dry adobe used in the study are reasonable and within the expected range for the adobe of the Southwestern United States and meet the New Mexico Earthen Building Materials Code [7] requirements. Lower compressive and tensile strengths of the moist adobe are associated with changes in the consistency of the clay fraction in the adobe bricks and mortar as a function of the water content. As the water content of the adobe increases, the matric suction of the soil drops considerably leading to substantial loss of compressive, tensile and shear strengths [9]. For the adobe soil used in this study, the matric suction decreases with increasing water content from 30 MPa at w = 2.8% to 0.5 MPa at w = 8.0%, and to 0.03 MPa at w = 15.0% [9].
2.3. Numerical Analysis
The FE analysis included four loading steps as described in detail by Al Aqtash et al. [21]. The wall self-weight was applied in the first step. In the second step, 12-kN/m (800-lb/ft) uniformly distributed (vertical) load was applied along the bond beam, representing a typical downward thrust from the roof of a one-story adobe house (Figure 1). The initial material properties of the wall were those of the adobe in nearly dry condition. In the third step, the material properties of the node set in the moist region were changed to those of Scenario wps or wns, whereas the rest of the wall maintained the material properties of dry adobe. In the last step, 70-mm out-of-plane lateral displacement was progressively imposed on the bond beam (Figure 1).
Graphs of out-of-plane lateral force vs. lateral displacement (i.e., pushover curves) were prepared for all the cases. For a given wall thickness, the pushover curves of walls with a moist region along the base were compared to the pushover curve of the dry wall. The out-of-plane lateral strength of the adobe walls was defined as the maximum lateral force corresponding to a 70 mm displacement (applied along the top of the wall). When the FE analysis did not converge before reaching 70 mm, the last value of the applied lateral force was used. For the purposes of this paper, the wall behaviour up to the peak lateral force was considered. It was assumed that plastic strains appeared at the locations of tensile failure, i.e., wall cracks. Thus, the initiation and propagation of tensile cracks on the main wall face was observed by mapping contours of the maximum in-plane plastic strains [19,21].
The stability of the walls was investigated by relating the top wall displacement (d) when the maximum in-plane plastic strains appeared to the slenderness ratio. The effect of wall thickness and length and water content of the moist region on the wall ability to carry out-of-plane lateral loads was determined using the strength reduction ratio (R), defined as the ratio of the lateral strength of a wall with a moist region to the lateral strength of the dry wall with the same thickness. Additional strength assessment was conducted by comparing the out-of-plane lateral strength to the typical roof thrust on a one-story adobe building. The horizontal out-of-plane uniformly distributed load (i.e., roof thrust from a light wood frame) was estimated at approximately 0.75 kN/m (50 lb/ft) [31]. For the 7-m long wall model used in this research, the out-of-plane lateral force induced by the roof thrust was considered as 5 kN.
3. Results
3.1. Dry Walls
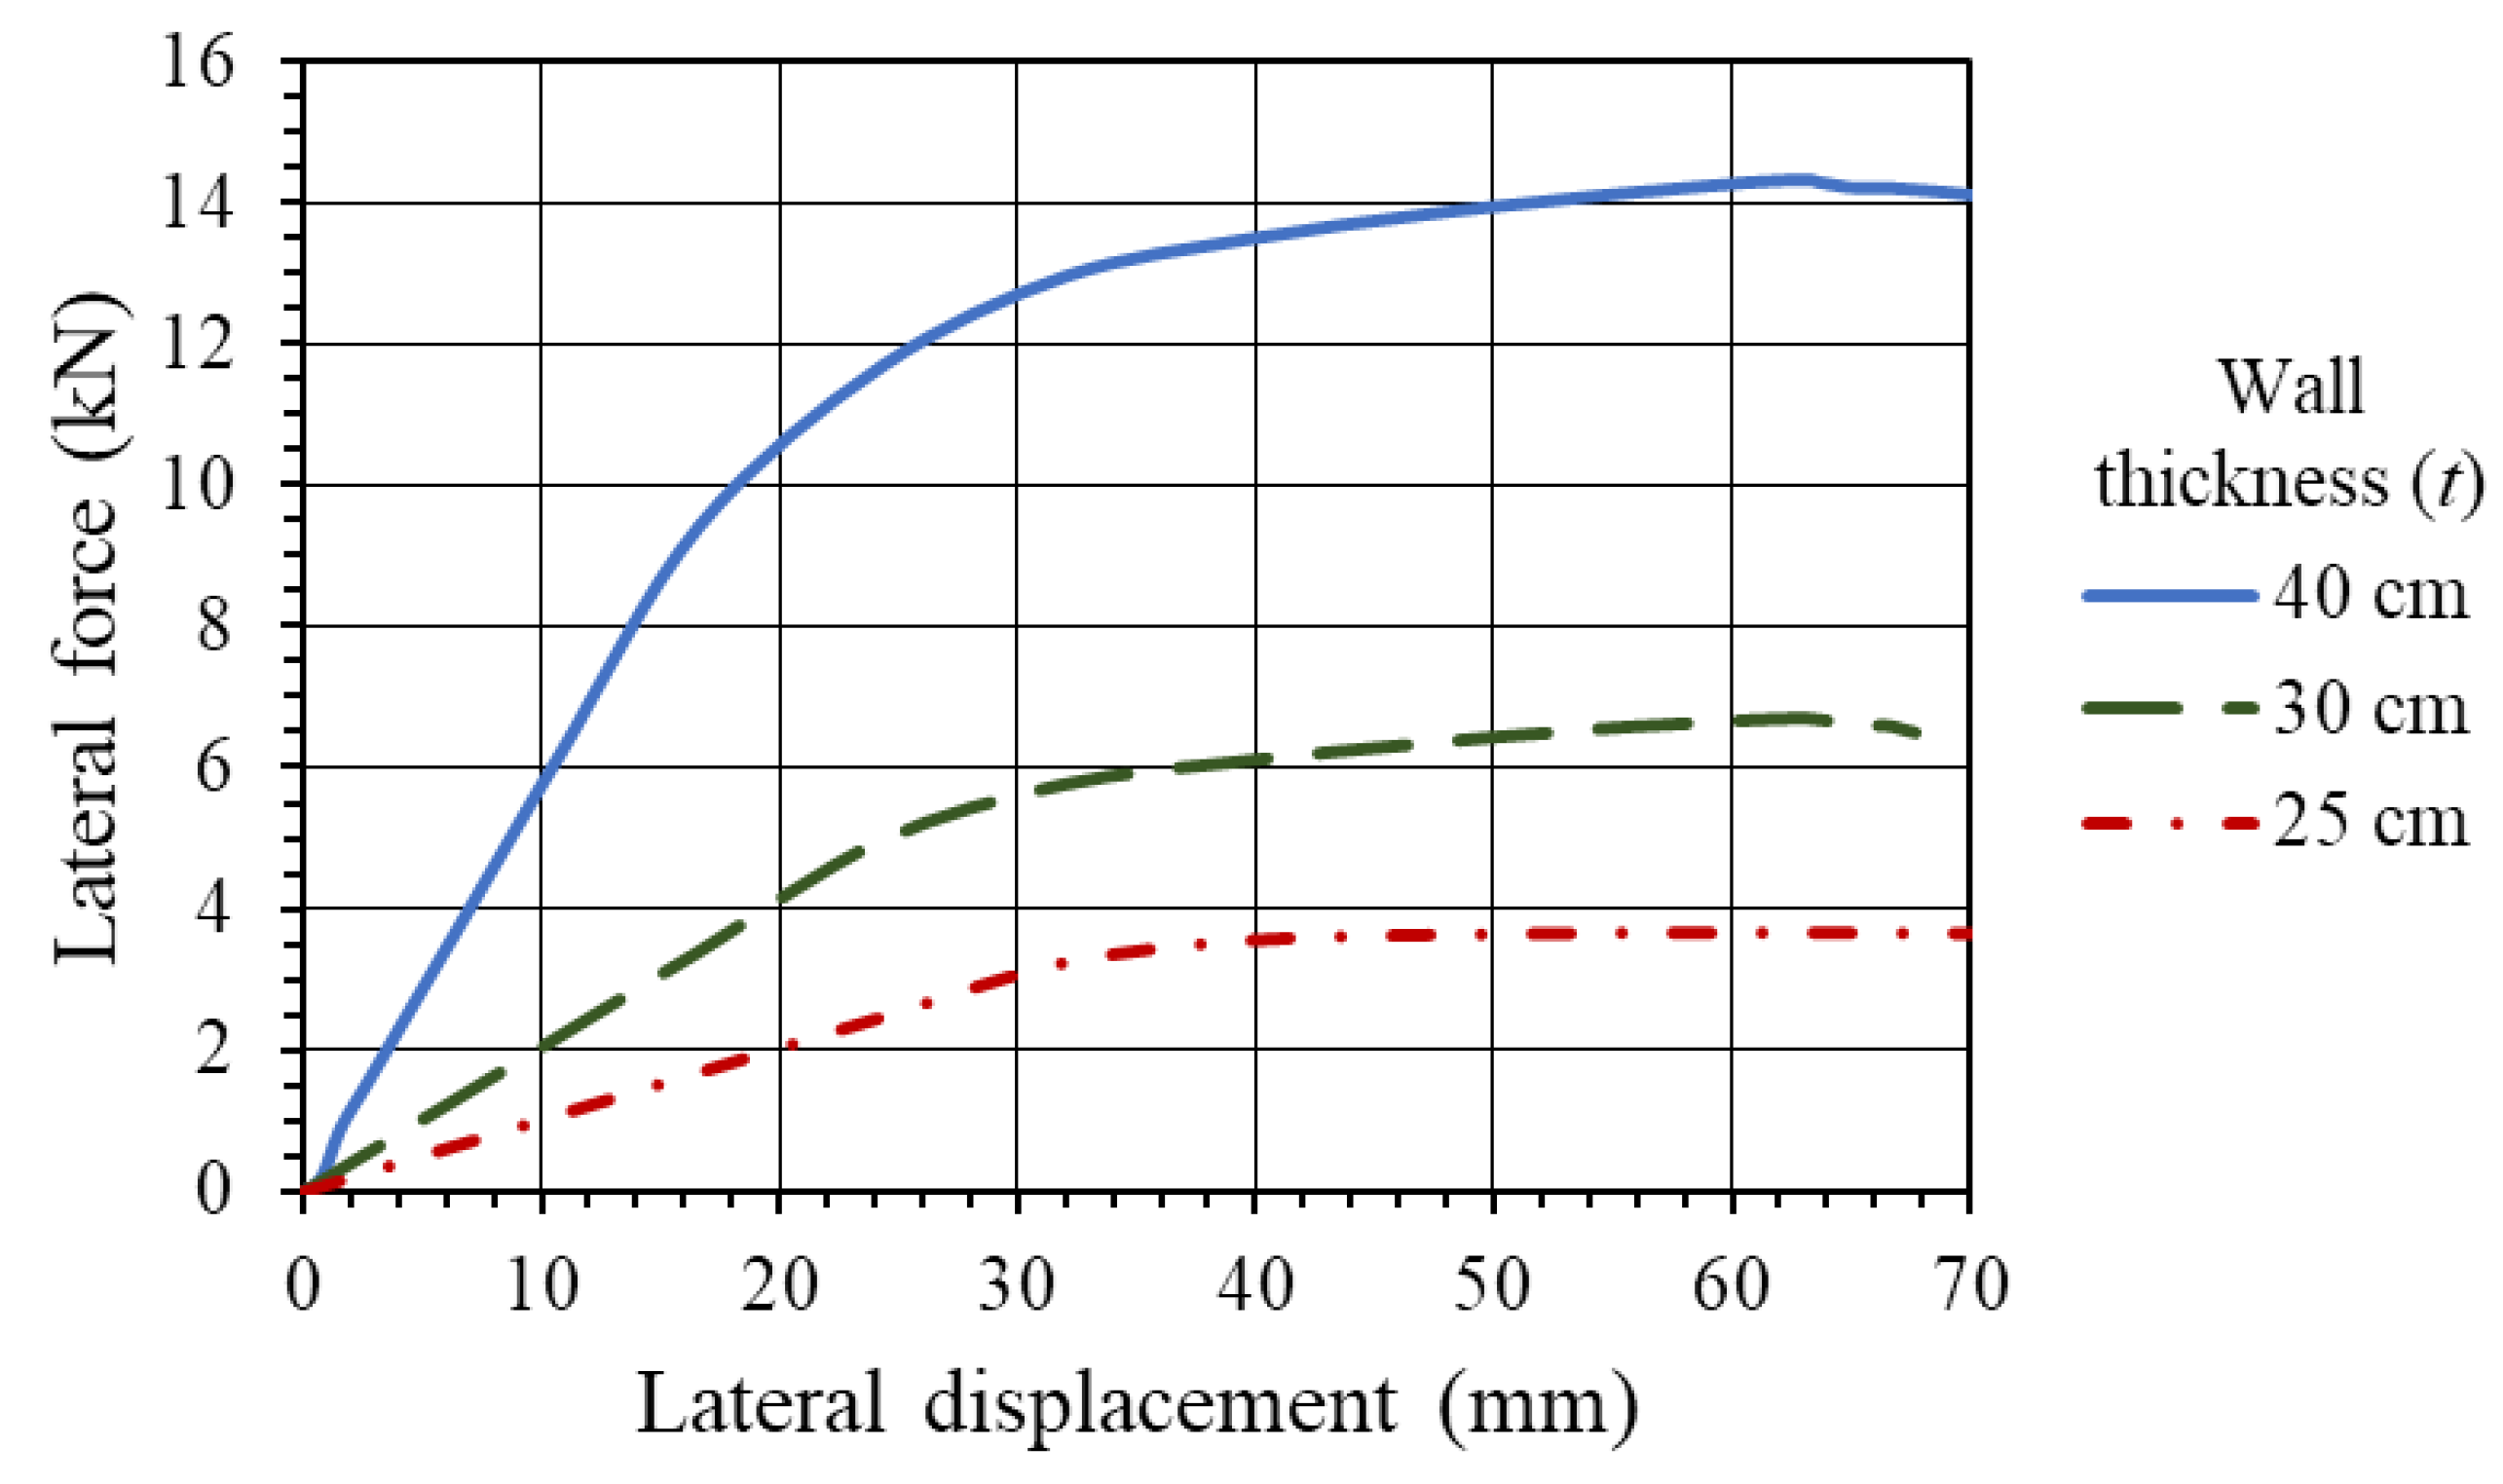
The pushover curves of the dry walls for the three values of wall thickness (t) are presented in Figure 3. These curves have an initial linear portion and become nonlinear with further lateral displacement (d). The pushover curves for t = 25 cm, 30 cm, and 40 cm are linear up to d corresponding to 45%, 35%, and 23% of the prescribed maximum displacement, respectively. The maximum lateral force, a representation of the lateral strength, is 3.7 kN, 6.7 kN, and 14.3 kN when the wall thickness is t = 25 cm, 30 cm, and 40 cm, respectively.
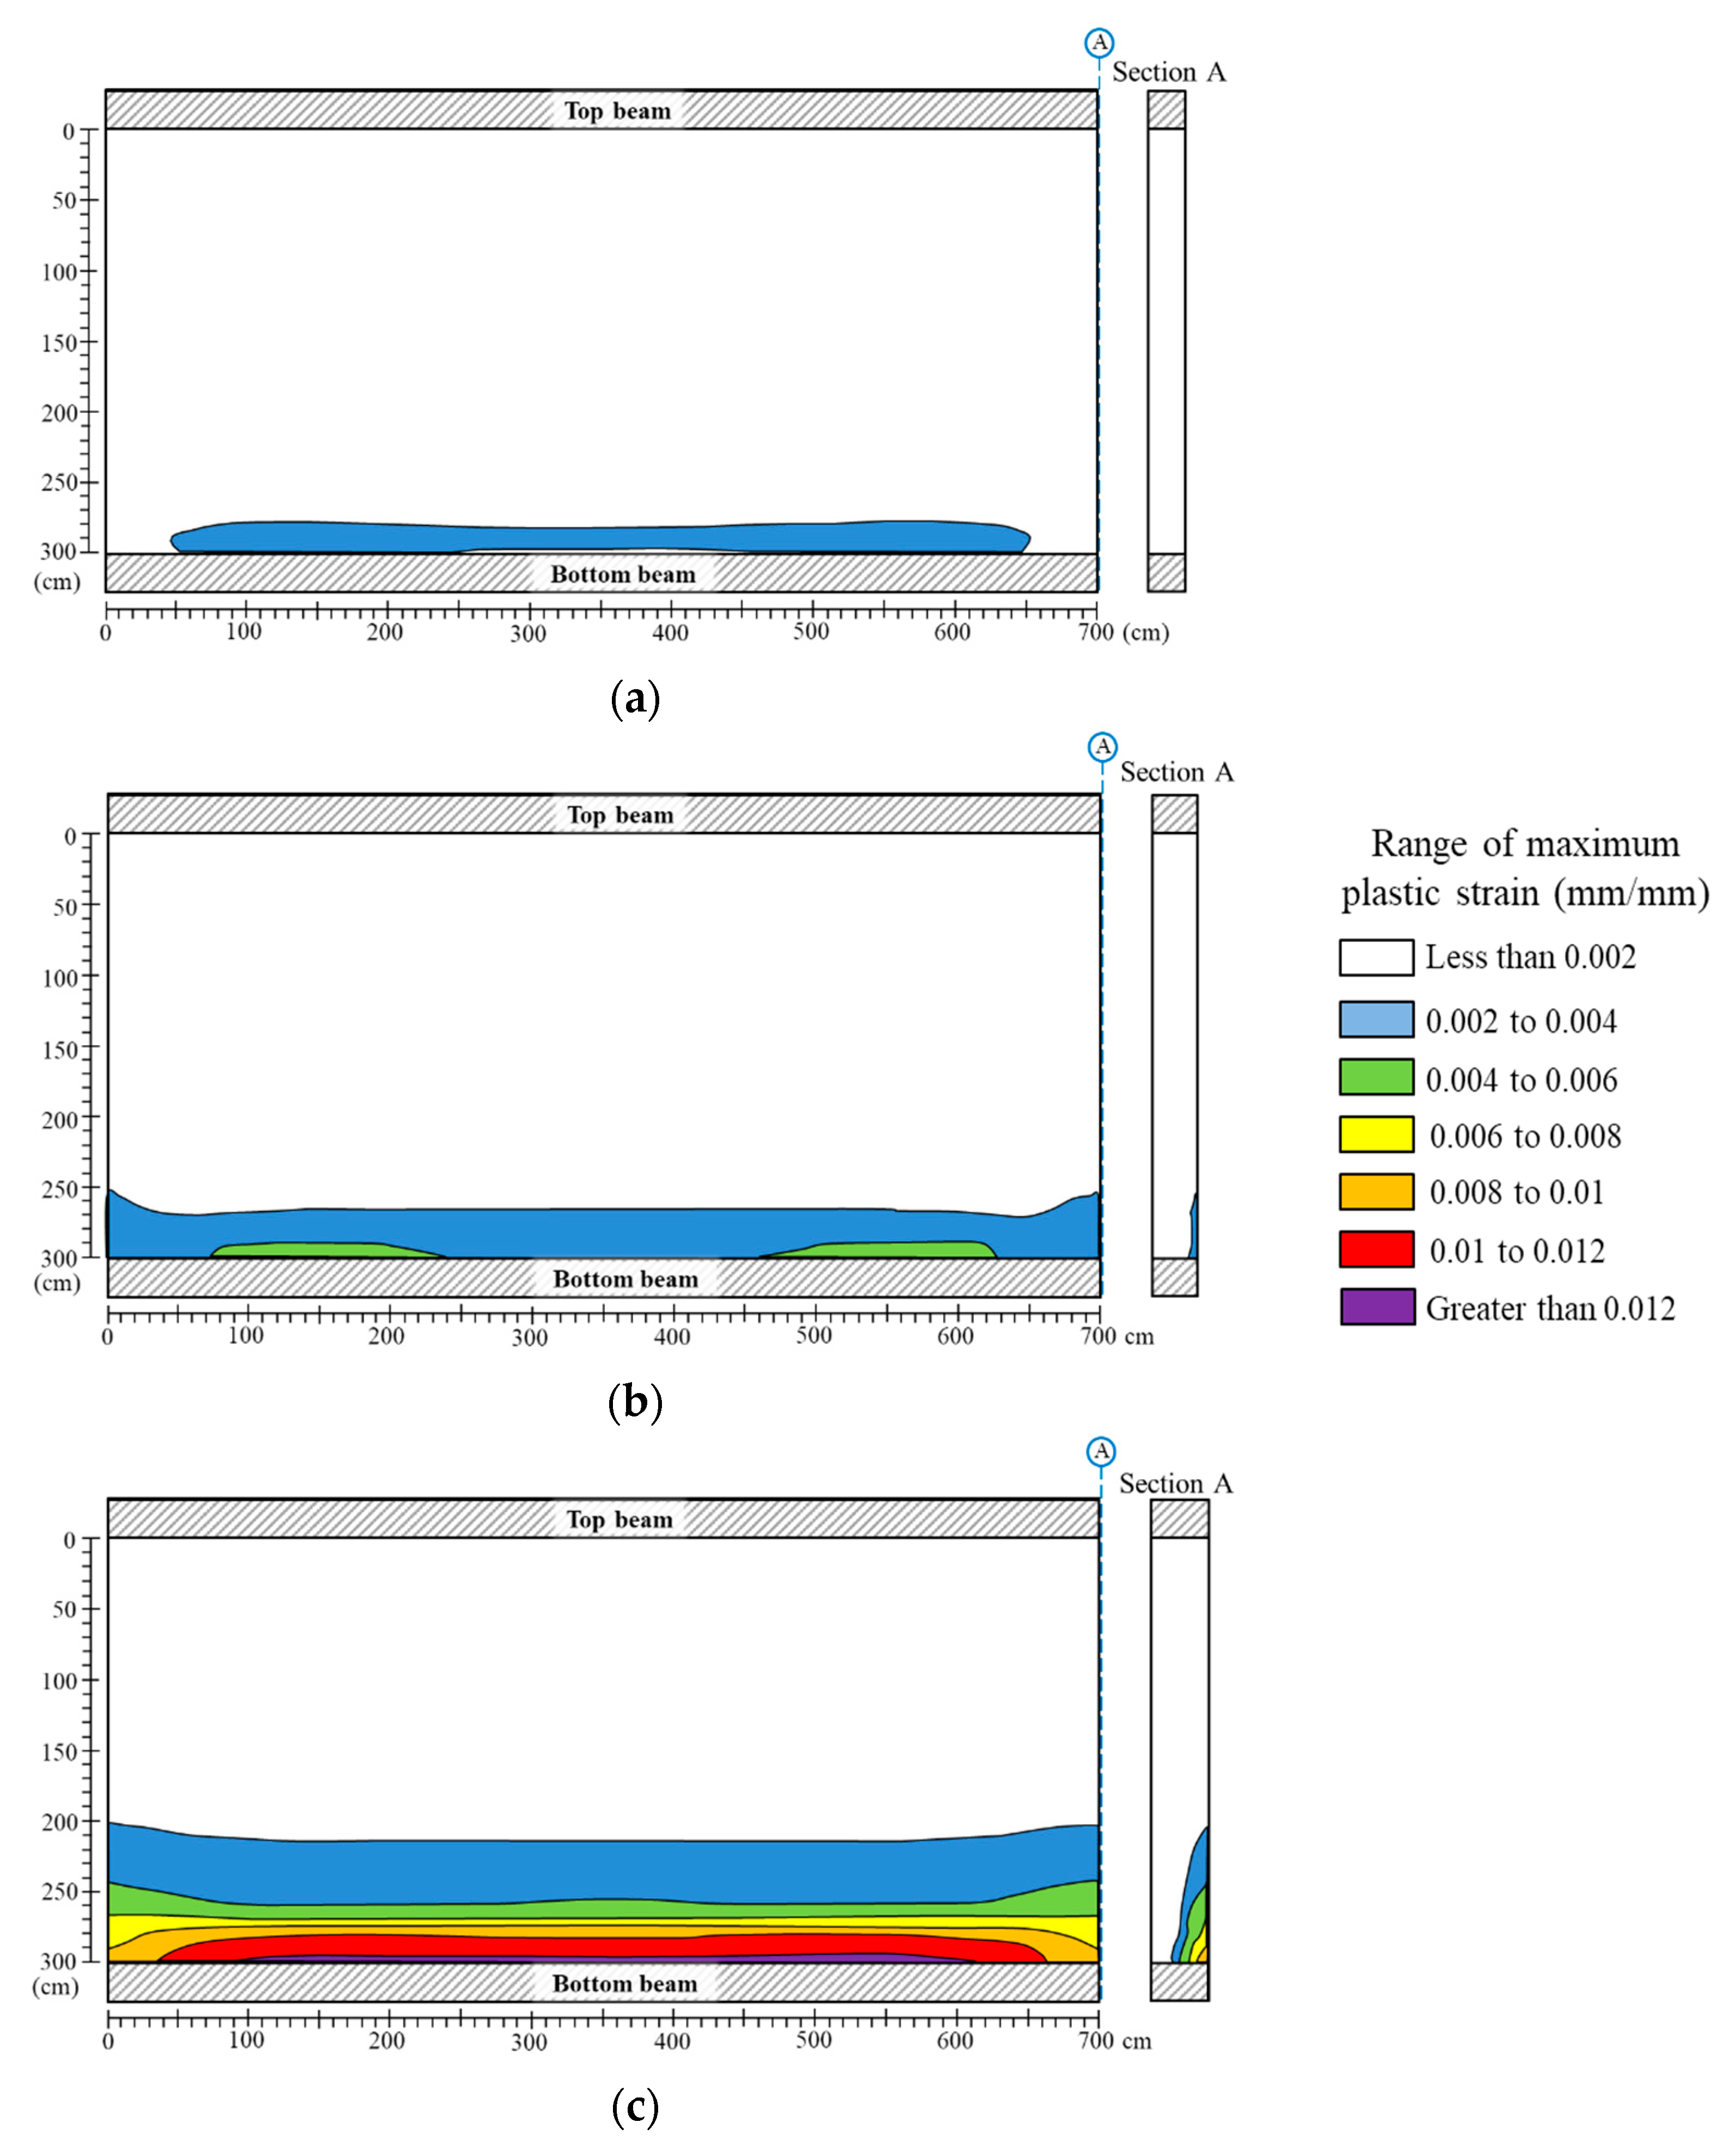
The maximum in-plane plastic strain distribution in the dry walls is presented in Figure 4. The plastic strain contours correspond to the largest applied lateral displacement in each case and are shown for the inside wall face (same side on which the out-of-plane force is applied) and for a wall cross section at the wall edge. The first appearance of in-plane plastic strains is along the wall base (i.e., immediately about the footing). The lateral displacement at which the pushover curve changes from linear to nonlinear in Figure 3 corresponds to the initial appearance of plastic strains. With additional lateral displacement, the plastic strain contours extend upward on the wall, but no more than about one third of the wall height. The moment about the fixed wall base generated by the applied displacement causes the interior face of the wall (on which the displacement is applied) to be in tension and the outer face to be in compression. The plastic strains appear in the interior wall face, which is in tension.
3.2. Walls with a Moist Region along the Base
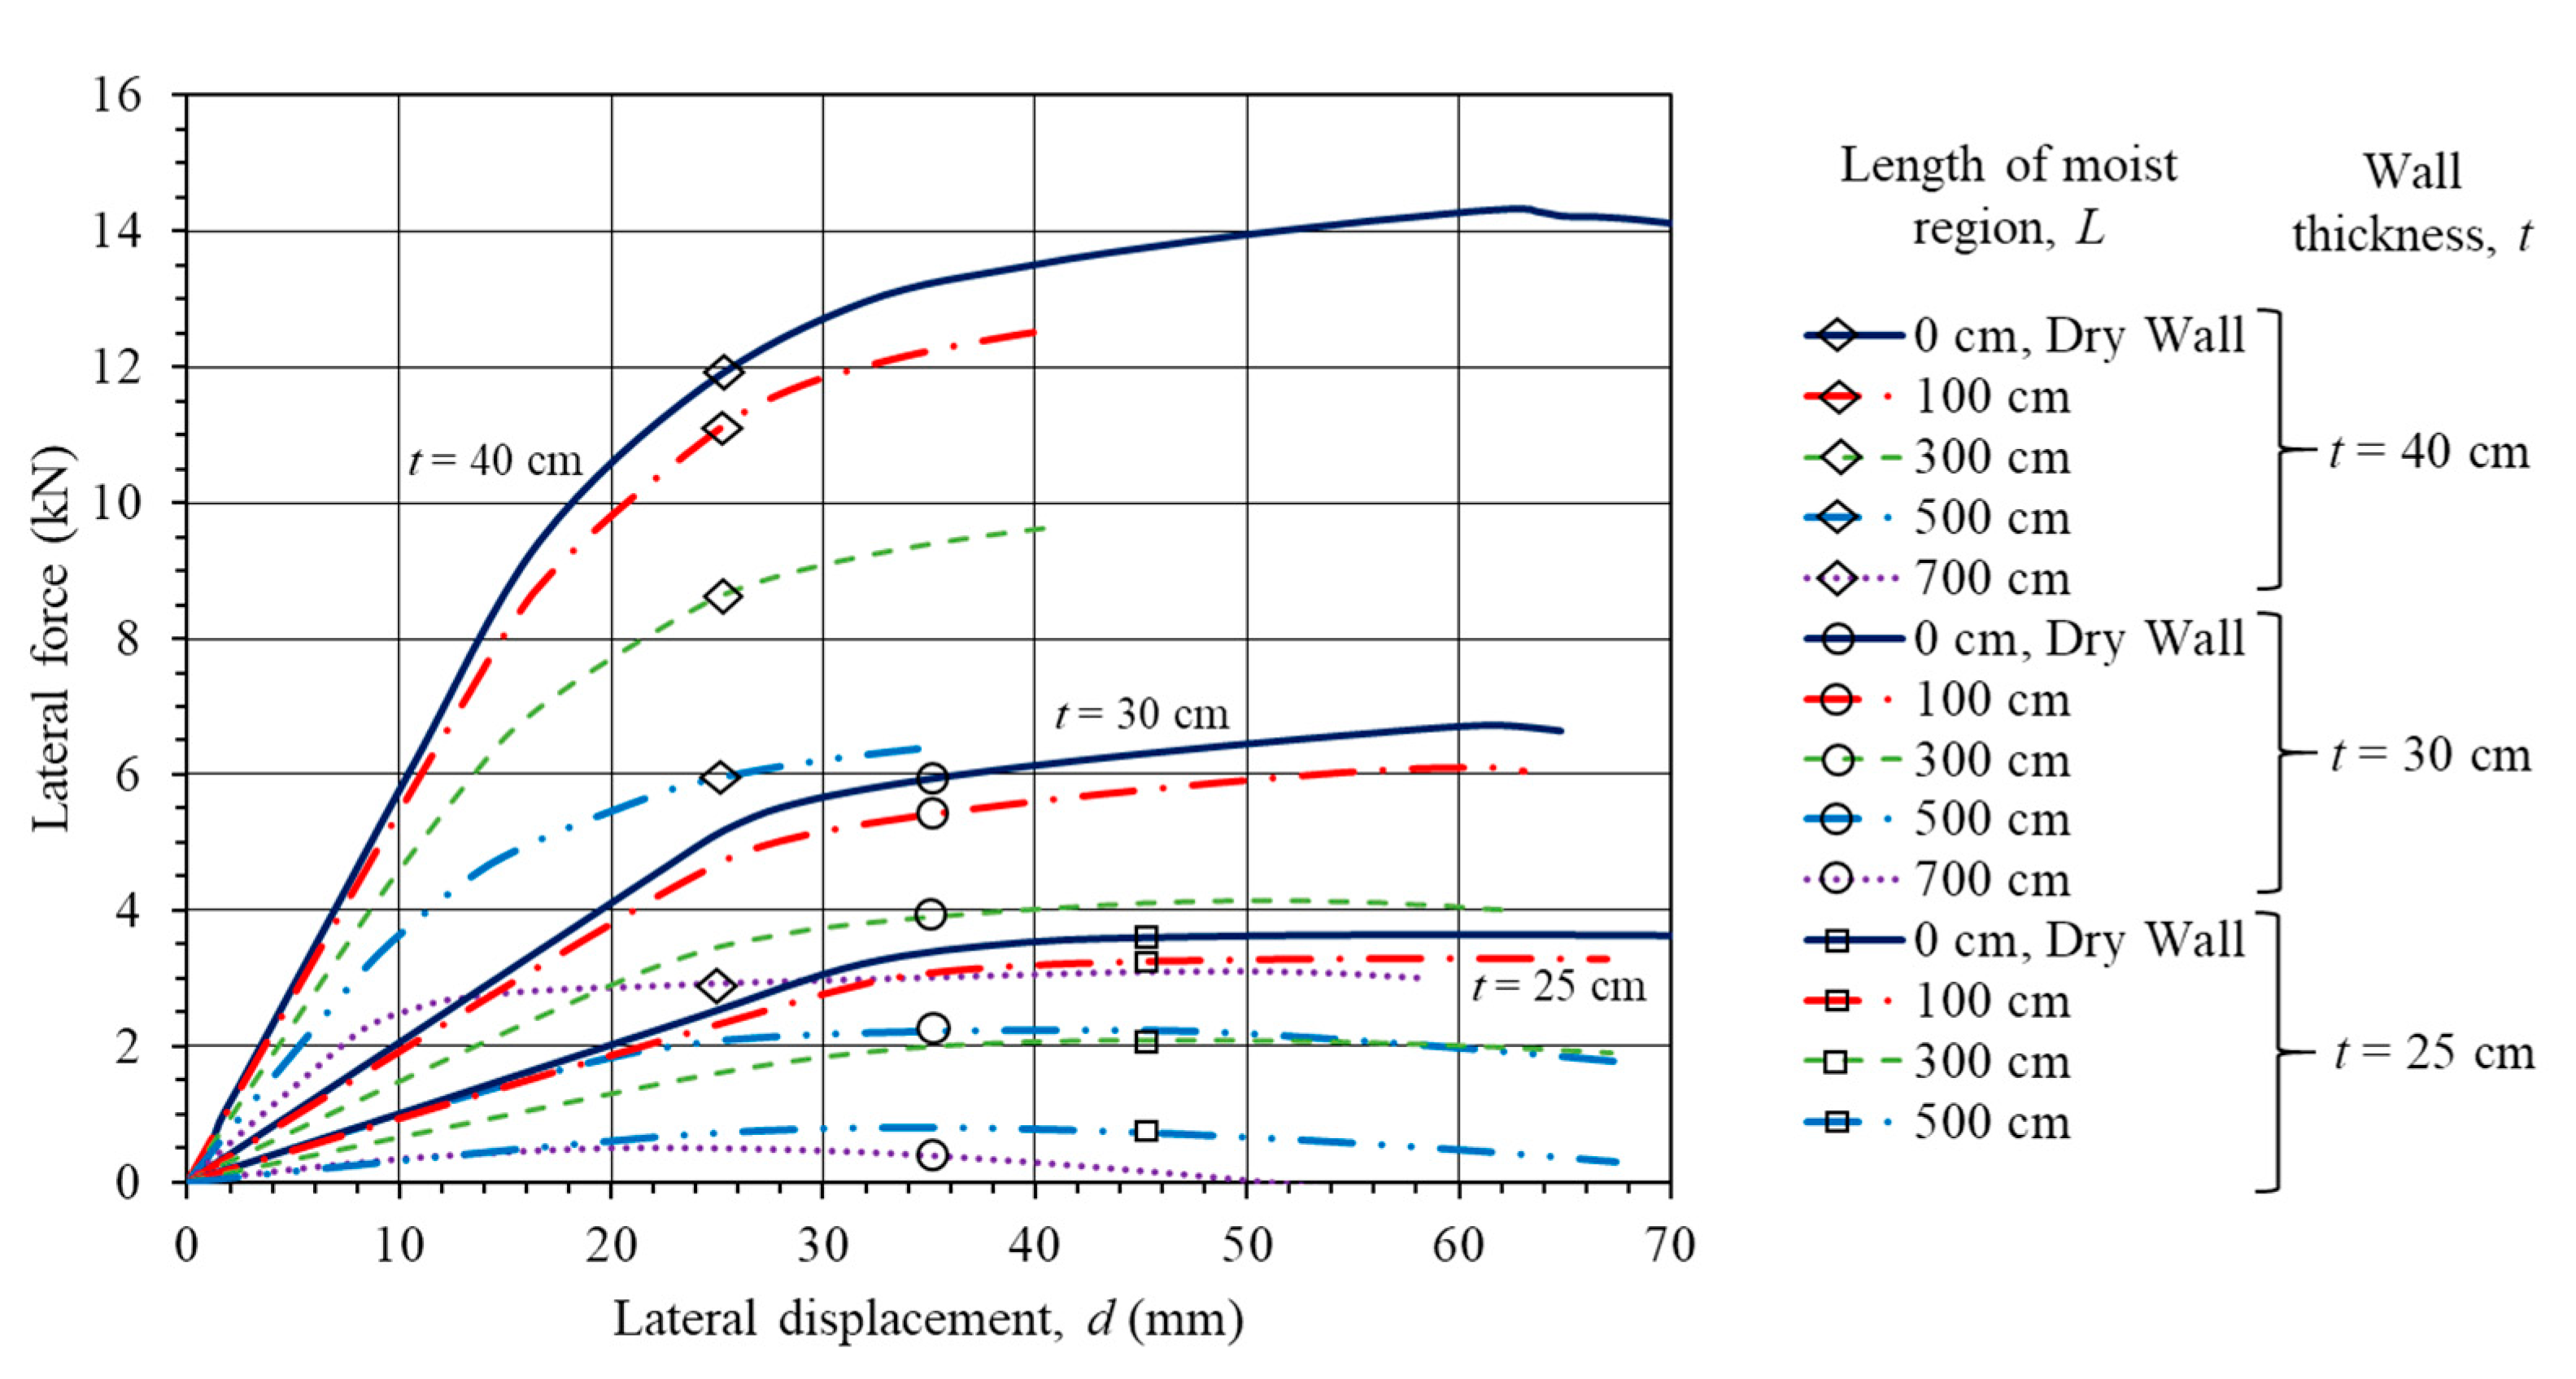
The pushover curves for Scenarios wps and wns are shown in Figure 5 and Figure 6, respectively, to illustrate trends and general observations. These figures compare the out-of-plane pushover curves in terms of L for the three wall thicknesses. The curves follow a similar trend as the dry curves including an initial linear portion followed by a nonlinear part. For a given t, the displacement d at which the curves turn nonlinear is smaller when the wall has a moist region compared to the dry wall. The values of the out-of-plane lateral strength obtained from the pushover curves for all cases analyzed are provided in Table 2.
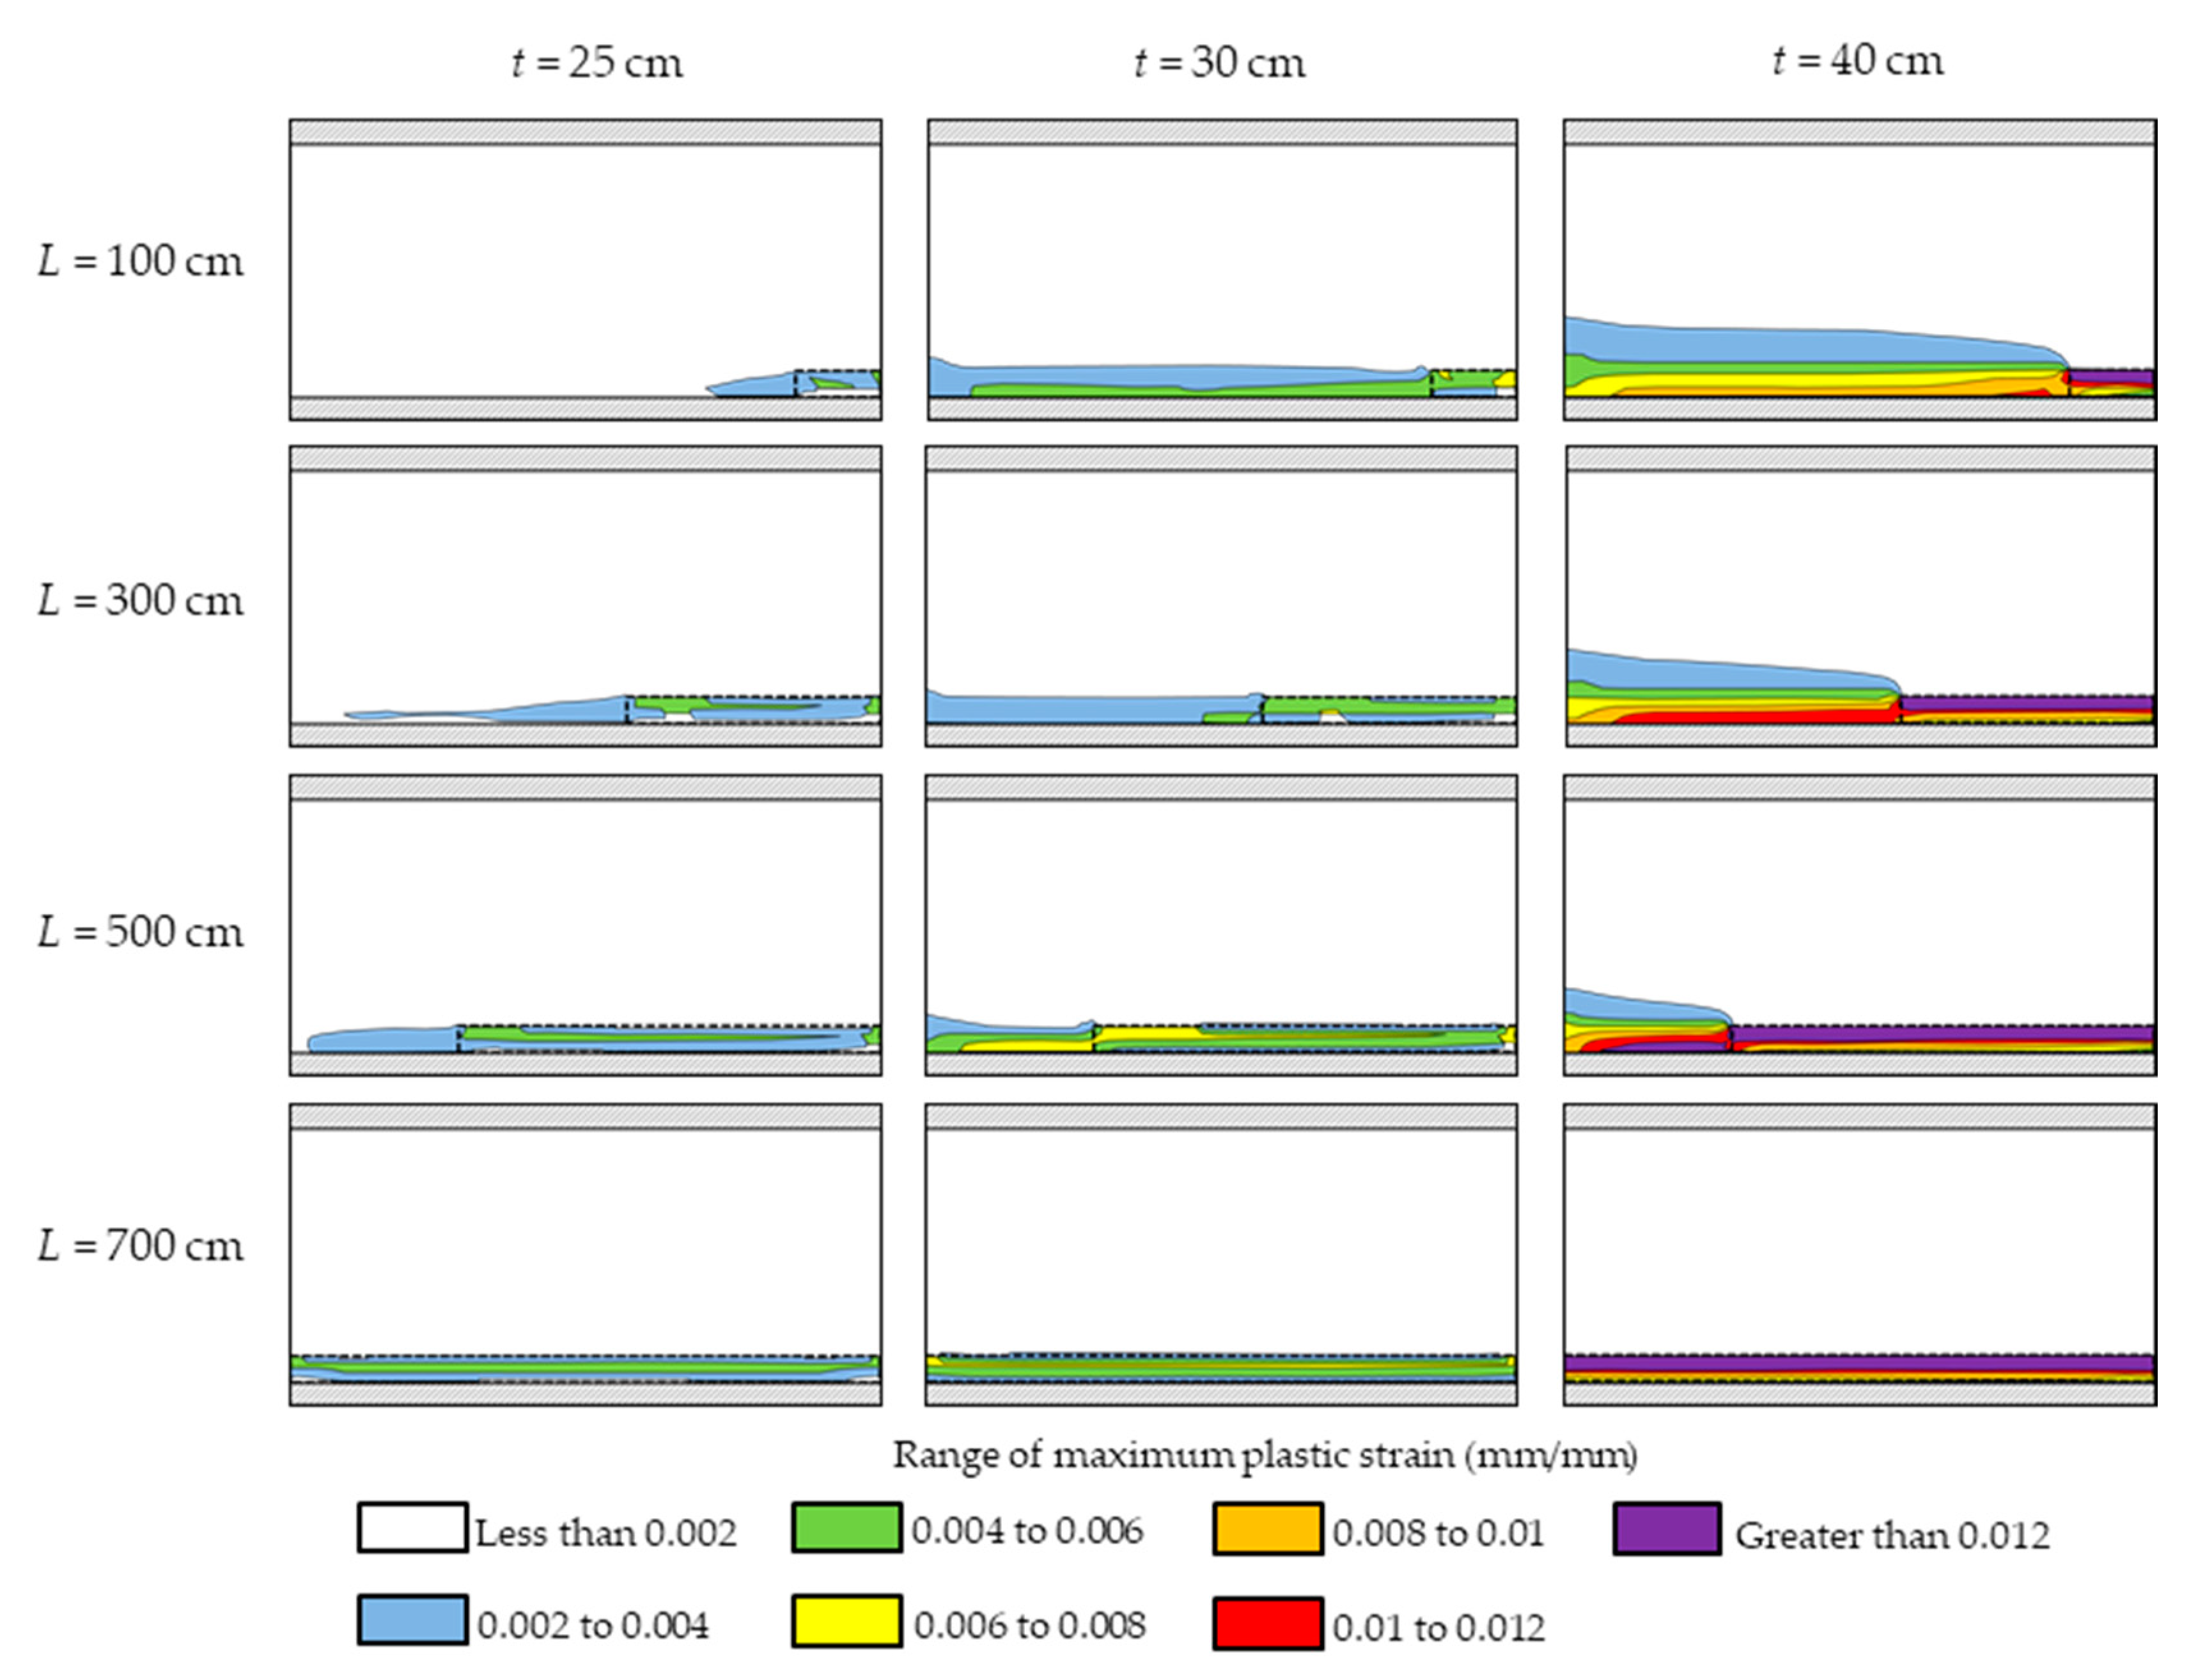
Figure 7 presents the maximum in-plane plastic strain distribution for the three wall thicknesses and Scenario wps at the end of loading for different L values. Location of the moist region is shown with dashed lines. This figure shows the interior face of the wall on which the out-of-plane displacement is applied (i.e., face in tension). The in-plane plastic strains in Scenario wps do not appear on the wall during the first three loading steps of the FE analysis. As the lateral displacement is progressively applied, in-plane plastic strains develop initially within the moist region regardless of the wall thickness. As loading continues, the zone of in-plane plastic strains spreads throughout the moist region and extends laterally to the dry adobe along the wall base, starting from the inner end of the moist region towards the wall edge. The plastic strain zone does not propagate upward to the dry adobe above the moist region. In some cases of Scenario wns, the maximum in-plane plastic strains appear in the moist region due to the wall self-weight and the vertical component of the roof thrust, before any out-of-plane lateral displacement is applied, particularly for L = 300 cm or greater, when t = 25 cm and 30 cm. This observation indicates that the adobe material with high water content (near saturation) is very weak and cannot contribute considerably to carrying lateral loading in the subsequent step of the FE analysis.
4. Discussion
Adobe masonry walls rely on their own weight to resist lateral loads. The thicker the wall, the larger the load required to cause overturning about its base. In Figure 3, the out-of-plane lateral strength of the dry wall with t = 40 cm is more than twice the lateral strength of the dry wall with t = 30 cm and almost four times the lateral strength of the dry wall with t = 25 cm. Because the wall self-weight is the major contributor to the resistance against the overturning moments, a relatively small increase in the wall thickness increases the wall weight significantly. The point at which the top displacement of the wall starts to increase nonlinearly occurs at a smaller d for the thicker walls. At this transition point, the initial signs of cracking start to appear at the location of tensile stresses on the wall face. This observation provides an indication of the effect of the slenderness ratio on the wall stability. The thinnest wall (t = 25 cm), which has the highest slenderness ratio (Sl = 12), reaches the maximum lateral strength (peak strength) shortly after the initial signs of cracking. Beyond that point, the top displacement of the wall continues to increase without any increase of the lateral force (Figure 3). In practice, a slender wall with a moist region at the base might undergo sustained plastic displacement with no further change in the loading, so shoring the wall prior to any work in the site is necessary. On the other hand, 70% of the wall maximum strength (peak strength) of the thickest wall (t = 40 cm), which has the lowest slenderness ratio (Sl = 7.5), is reached before the first signs of cracking. With additional displacement, the lateral capacity of the wall continues to increase nonlinearly until the maximum lateral strength is reached (Figure 3). This explains why many historical adobe buildings with considerably thick walls are still standing despite having a partially damaged base.
When considering Scenario wps (Figure 5), the difference between the dry lateral strength and the lateral strength of the walls with a moist region is greater for t = 40 cm. For example, when t = 40 cm, there is a 6.6-kN drop in the out-of-plane lateral strength between the dry wall and the wall with L = 700 cm. For t = 30 cm and t = 25 cm, the drop in out-of-plane lateral strength is 3.5 kN and 1.9 kN, respectively. The pushover curves for all the cases with t = 40 cm show a greater out-of-plane lateral strength than for the cases with t = 30 cm and 25 cm even when dry. This observation is consistent with the practice of constructing thick adobe walls even though the local building code [7] may allow the construction of a wall with t = 25 cm. The results on this work are for free-standing walls separated from their lateral support. For any given case, the difference between the dry lateral strength and the lateral strength of the wall with a moist region in Scenario wns (see Figure 6) is greater than in Scenario wps (Figure 5). These results confirm that the wall thickness is a key factor when designing adobe buildings or assessing their structural stability. Adobe walls are more likely to perform better structurally over time if they have enough mass to support out-of-plane loading despite having moisture damage along their base and compromised support conditions.
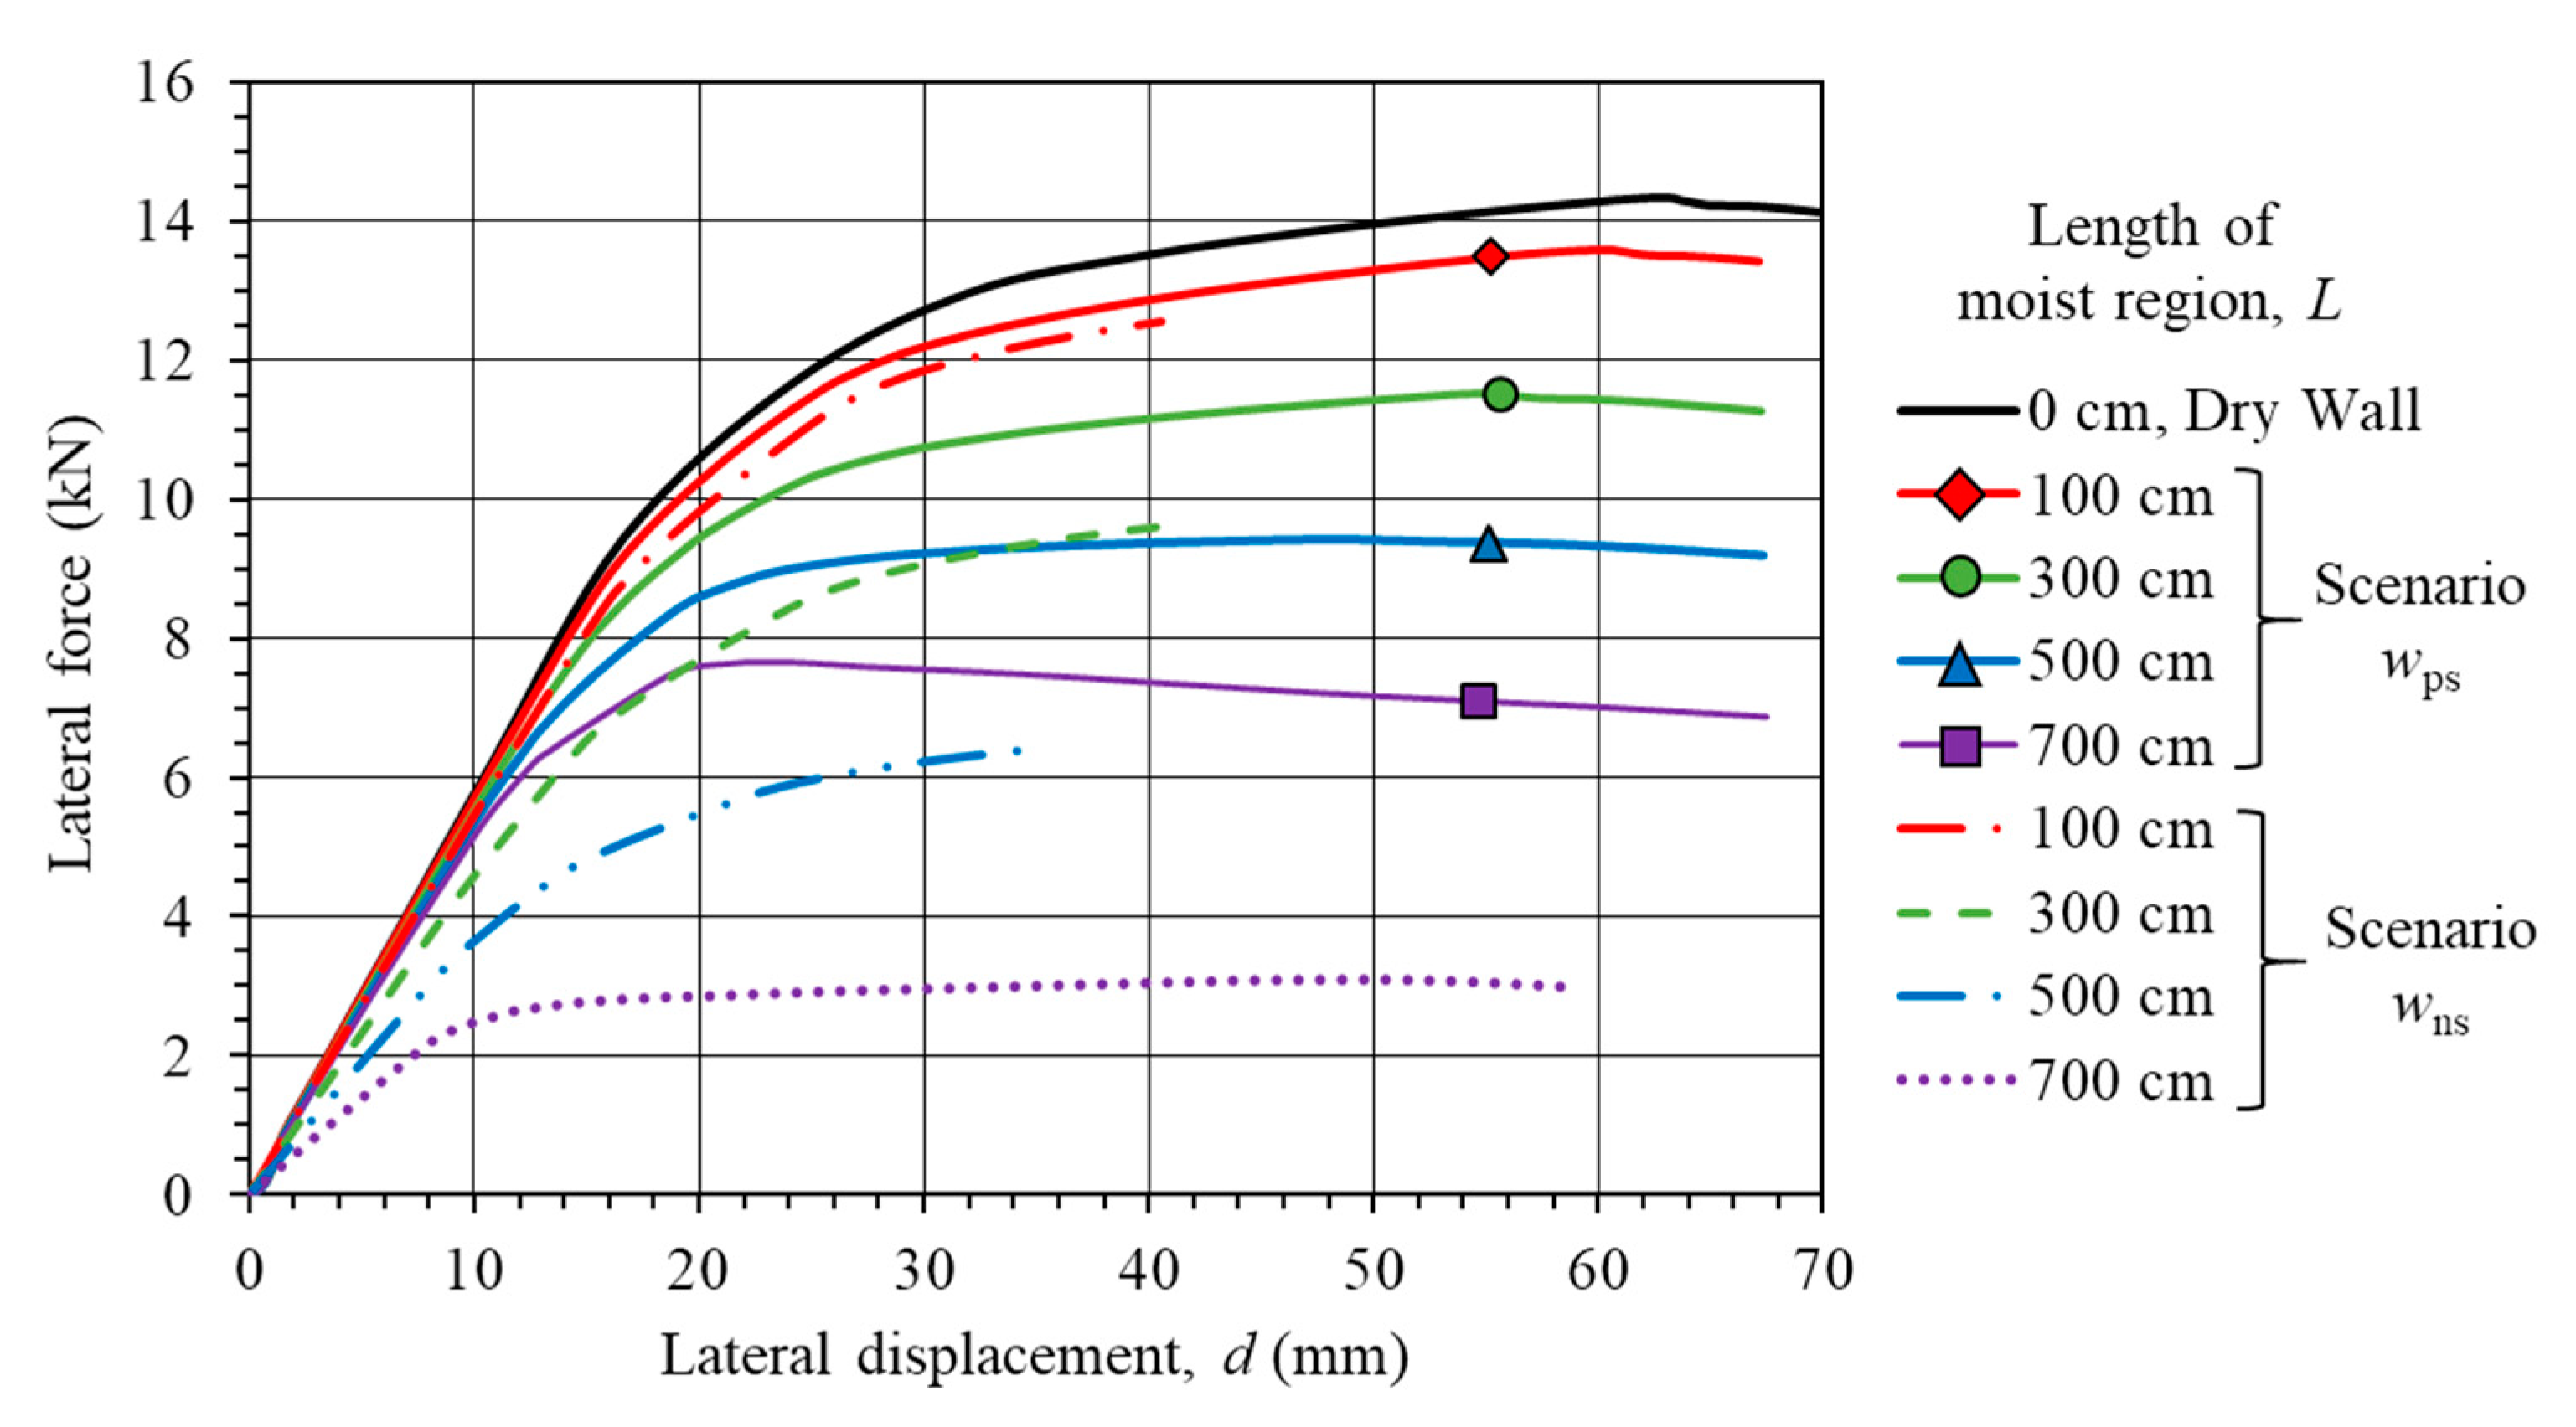
The pushover curves of the adobe walls with t = 40 cm for Scenarios wns and wps are compared in Figure 8. For a given L value, the curves for Scenario wps are lower than those for Scenario wns. When L = 100 cm, the curves for these two cases are close to the pushover curve of the dry wall, indicating that a short moist region has a limited effect on the out-of-plane lateral strength of the wall. As the length of the moist region extends, the difference between the curve of the dry wall and the curve of the wall with a moist region becomes larger (i.e., the wall becomes weaker). Similar observations are noted for t = 30 cm and 25 cm.
Table 3 shows the strength reduction ratio (R) for the cases considered. An R value lower than but close to 1.0 means that the out-of-plane lateral strength of the wall is not considerably affected by the presence of a moist region along the base compared to the strength of a dry wall. This ratio is 0.90 or higher for all the cases with L = 100 cm. This is due to stress arching and load redistribution over the relatively short, weak (moist) region. The R values for all the cases in Scenario wps are approximately 0.50 or greater. However, the R values for the cases with L = 300 cm or greater in Scenario wns are lower than 0.50 regardless of the wall thickness. The strength reduction ratio R is practically zero for the cases in Scenario wns when L = 700 cm for any t, which means that a free-standing adobe wall with a nearly saturated base is highly unstable and will collapse under the slightest lateral force.
By comparing the strength values in Table 2 to the lateral roof thrust of 5 kN considered in this study, it is possible to identify the cases at which the wall will be able to support or resist that load. A cantilever adobe wall with t = 25 cm cannot support a 5 kN lateral load even if the wall is dry (i.e., case when L = 0). A cantilever adobe wall with t = 30 cm can support this roof thrust when L = 100 cm regardless of the water content of the moist region. On the other hand, a cantilever adobe wall with t = 40 cm can support the 5 kN roof thrust, even if the moist region extends the full length of the wall (L = 700 cm) and the adobe material is partially saturated (Scenario wps) or if L is no longer than 500 cm and the adobe material is nearly saturated (Scenario wns). In the construction of contemporary adobe structures, which are likely to be designed with relatively high slenderness ratio, attention should be placed in securing and maintaining the connection between perpendicular walls as they may not be able to carry the horizontal roof thrust if they become structurally disconnected from adjacent walls and a region along the base has a relatively high water content.
5. Conclusions
This paper studied the strength and stability of adobe walls under static, out-of-plane lateral load from the roof thrust of a light wood frame when the walls have a moist region along the base. The results showed that greater wall thickness provides sufficient out-of-plane stability despite having a moist region along the base. A moist region shorter than approximately one fourth of the wall length is not critical for the wall stability and has a relatively small effect on the out-of-plane lateral strength. When the moist region is longer, the out-of-plane lateral strength drops to 80% or lower compared to a dry wall with the same thickness. Because the walls of contemporary adobe buildings are likely to be constructed with a large slenderness ratio, caution is advised when a wall starts to lose support and detach from the rest of the structure.
While the strength properties may vary among adobe bricks depending on the characteristics of the soil constituents, proportions, or other factors related to fabrication, the values used in the study are reasonable and within the expected range for adobe in the Southwestern United States. The results help to stress the importance of maintaining proper surface drainage conditions around adobe structures and preventing the accumulation of moisture within the walls. Future studies will consider the variability of moisture across the wall thickness and boundary conditions of the walls to represent lateral support.
Author Contributions
Conceptualization, U.A.A. and P.B.; methodology, U.A.A. and P.B.; formal analysis, U.A.A. and P.B.; data curation, U.A.A. and P.B.; writing—original draft preparation, U.A.A. and P.B.; writing—review & editing, U.A.A. and P.B.; funding acquisition, P.B. All authors have read and agreed to the published version of the manuscript.
Funding
This material is based upon work primarily supported by the U.S. National Science Foundation (NSF) under NSF Award Number EEC-1449501. Any opinions, findings and conclusions, or recommendations expressed in this material are those of the authors and do not necessarily reflect those of the NSF.
Conflicts of Interest
The authors declare no conflict of interest.
References
- Heathcote, K. The thermal performance of earth buildings. Inf. Construcción 2011, 63, 117–126. [Google Scholar] [CrossRef] [Green Version]
- Rainer, L. Deterioration and pathology of earthen architecture. In Terra Literature Review, an Overview of Research in Earthen Architecture Conservation; Avrami, E., Guillaud, H., Hardy, M., Eds.; The Getty Conservation Institute: Los Angeles, CA, USA, 2008; pp. 45–61. [Google Scholar]
- National Park Service, U.S. Department of the Interior. Preservation Brief 5: Preservation of Historic Adobe Buildings. Available online: https://www.nps.gov/tps/how-to-preserve/briefs/5-adobe-buildings.htm (accessed on 25 September 2019).
- Crosby, A. Monitoring moisture at Tumacacori. Apartm. Bull. 1987, 4, 32–44. [Google Scholar] [CrossRef]
- Cornerstones Community Partnerships. Adobe Conservation: A Preservation Handbook; Sunstone Press: Santa Fe, NM, USA, 2006; pp. 51–56. [Google Scholar]
- Zelkowski, P. Sensor Installation for Monitoring of Volumetric Water Content and Temperature in Walls of a Historic Adobe Building. Master’s Thesis, New Mexico State University, Las Cruces, NM, USA, 2020. [Google Scholar]
- 2015 New Mexico Earthen Building Materials Code, Construction Industries Division of the Regulation and Licensing Department, 14.7.4 NMAC (11/15/2016). Available online: http://164.64.110.134/parts/title14/14.007.0004.html (accessed on 25 September 2019).
- Wosick, E.; Gebremariam, T.; Weldon, B.; Bandini, P.; Al-Aqtash, U. Strength characteristics of typical adobe material in the Southwestern United States. In Proceedings of the 9th International Masonry Conference, Guimarães, Portugal, 7–9 July 2014. [Google Scholar]
- Al Aqtash, U.; Bandini, P. Prediction of unsaturated shear strength of an adobe soil from the soil-water characteristic curve. Constr. Build. Mater. 2015, 98, 892–899. [Google Scholar] [CrossRef]
- Martins, T.; Fernandez, J.; Varum, H. Influence of moisture on the mechanical properties of load-bearing adobe masonry walls. Int. J. Arch. Herit. 2019, 13, 841–854. [Google Scholar] [CrossRef]
- Li Piani, T.; Weerheijm, J.; Peroni, M.; Koene, L.; Krabbenborg, D.; Solomos, G.; Sluys, L.J. Dynamic behaviour of adobe bricks in compression: The role of fibres and water content at various loading rates. Constr. Build. Mater. 2020, 230, 117038. [Google Scholar] [CrossRef]
- Zonno, G.; Aguilar, R.; Boroschek, R.; Lourenço, P.B. Experimental analysis of the thermohygrometric effects on the dynamic behavior of adobe systems. Constr. Build. Mater. 2019, 208, 158–174. [Google Scholar] [CrossRef]
- Oliver, A. Fort Selden Adobe Test Wall Project Phase I: Final Report; The Getty Conservation Institute: Los Angeles, CA, USA, 2000. [Google Scholar]
- Memari, A.M.; Grossenbacher, S.V.; Iulo, L.D. Comparative evaluation of structural and water penetration performance of three different masonry wall types for residential construction. J. Civ. Eng. Sci. 2012, 1, 9–21. [Google Scholar]
- San Bartolomé, A.; Quiun, D.; Cabrera, D.; Huaynate, W.; Romero, I.; Pereyra, J. Experimental study on adobe walls with long term water exposure due to floods. In Proceedings of the 12th Canadian Masonry Symposium, Vancouver, BC, Canada, 2–5 June 2013. [Google Scholar]
- Savary, M.; Mehdizadeh Saradj, F.; Shayganmanesh, M.; Tahmasebiboldaji, N.; Sadat Kazemi, A. Improving the adobe material properties by laser material processing. Constr. Build. Mater. 2020, 249, 118591. [Google Scholar] [CrossRef]
- Tarque, N. Numerical Modelling of the Seismic Behavior of Adobe Buildings. Ph.D. Thesis, Università degli Studi “G. d’Annunzio”, Chieti-Pescara, Italy, 2011. [Google Scholar]
- Tarque, N.; Camata, G.; Spacone, E.; Blondet, M.; Varum, H. The use of continuum model for analyzing adobe structures. In Proceedings of the 15th World Conference on Earthquake Engineering, Lisbon, Portugal, 24–28 September 2012. Paper No. 0128. [Google Scholar]
- Illampas, R.; Charmpis, D.C.; Ioannou, I. Laboratory testing and finite element simulation of the structural response of an adobe masonry building under horizontal loading. Eng. Struct. 2014, 80, 362–376. [Google Scholar] [CrossRef]
- Hashemi Rafsanjani, S.; Bakhshi, A.; Ghannad, M.A.; Yekrangnia, M.; Soumi, F. Predictive tri-linear benchmark curve for in-plane behavior of adobe walls. Int. J. Arch. Herit. 2015, 9, 986–1004. [Google Scholar] [CrossRef]
- Al Aqtash, U.; Bandini, P.; Cooper, S.L. Numerical approach to model the effect of moisture in adobe masonry walls subjected to in-plane loading. Int. J. Arch. Herit. 2017, 11, 805–815. [Google Scholar] [CrossRef]
- Sadeghi, N.; Oliveira, D.; Correia, V.M.; Azizi-Bondarabadi, H.; Orduña, A. Seismic performance of historical vaulted adobe constructions: A numerical case study from Yazd, Iran. Int. J. Arch. Herit. 2018, 12, 879–897. [Google Scholar] [CrossRef]
- Parisi, F.; Balestrieri, C.; Varum, H. Nonlinear finite element model for traditional adobe masonry. Constr. Build. Mater. 2019, 223, 450–462. [Google Scholar] [CrossRef]
- Lourenço, P.B. Computational Strategies for Masonry Structures. Ph.D. Thesis, Delft University, Delft, The Netherlands, 1996. [Google Scholar]
- Blondet, M.; Madueño, I.; Torrealva, D.; Villa-García, G.; Ginocchio, F. Using industrial materials for the construction of safe adobe houses in seismic areas. In Proceedings of the Earth Build 2005, Sydney, Australia, 19–21 January 2005. [Google Scholar]
- Varela-Rivera, J.L.; Navarrete-Macias, D.; Fernandez-Baqueiro, L.E.; Moreno, E.I. Out-of-plane behaviour of confined masonry walls. Eng. Struct. 2011, 33, 1734–1741. [Google Scholar] [CrossRef]
- Bean Popehn, J.R.; Schultz, A.E.; Lu, M.; Stolarski, H.K.; Ojard, N.J. Influence of transverse loading on the stability of slender unreinforced masonry walls. Eng. Struct. 2008, 30, 2830–2839. [Google Scholar] [CrossRef]
- Blondet, M.; Vargas, J.; Tarque, N. Observed behavior of earthen structures during the Pisco earthquake (Peru). In Proceedings of the 14th World Conference on Earthquake Engineering, Beijing, China, 12–17 October 2008. [Google Scholar]
- Dowling, D.M. Adobe housing in El Salvador: Earthquake performance and seismic improvement. In Natural Hazards in El Salvador; Rose, W.I., Bommer, J.J., López, D.I., Carr, M.J., Major, J.J., Eds.; Geological Society of America: Boulder, CO, USA, 2004; Volume 375, pp. 281–300. [Google Scholar] [CrossRef]
- Tolles, E.L.; Webster, F.A.; Crosby, A.; Kimbro, E.E. Survey of Damage to Historic Adobe Buildings after the January 1994 Northridge Earthquake; GCI Scientific Program Reports; Getty Conservation Institute: Los Angeles, CA, USA, 1996. [Google Scholar]
- Aqtash, U.A. An Experimental and Numerical Study of Moisture Effects on Soil Strength and Performance of Adobe Walls. Ph.D. Thesis, New Mexico State University, Las Cruces, NM, USA, 2014. [Google Scholar]
- Aqtash, U.A.; Bandini, P. Wall thickness and water content contribution to the out-of-plane instability of adobe walls. In Proceedings of the REHABEND 2020: 8th Euro-American Congress on Construction Pathology, Rehabilitation Technology and Heritage Management, Granada, Spain, 28 September–1 October 2020. in pressing. [Google Scholar]
- Dassault Systèmes Simulia Corp. Abaqus 17.0 Analysis User’s Manual; Dassault Systèmes Simulia Corp: Providence, RI, USA, 2017. [Google Scholar]
- Lee, J.; Fenves, G.L. Plastic-damage model for cyclic loading of concrete structures. J. Eng. Mech. 1998, 124, 892–900. [Google Scholar] [CrossRef]
- Lubliner, J.; Oliver, J.; Oller, S.; Oñate, E. A plastic-damage model for concrete. Int. J. Solids. Struct. 1989, 25, 299–326. [Google Scholar] [CrossRef]
- Standards New Zealand. NZS 4297: Engineering Design of Earth Buildings; Standards New Zealand: Wellington, New Zealand, 1998. [Google Scholar]
Figure 1.
Finite element model of the adobe wall: (a) wall geometry and mesh (b) loading and boundary conditions.
Figure 1.
Finite element model of the adobe wall: (a) wall geometry and mesh (b) loading and boundary conditions.


Figure 3.
Pushover curves of the dry adobe walls.

Figure 4.
Maximum in-plane plastic strain distribution corresponding to the largest applied out-of-plane displacement for the dry wall in the interior wall face and in the cross section (A) at the wall edge for: (a) t = 25 cm, (b) t = 30 cm, and (c) t = 40 cm.
Figure 4.
Maximum in-plane plastic strain distribution corresponding to the largest applied out-of-plane displacement for the dry wall in the interior wall face and in the cross section (A) at the wall edge for: (a) t = 25 cm, (b) t = 30 cm, and (c) t = 40 cm.

Figure 5.
Pushover curves for Scenario wps.

Figure 6.
Pushover curves for Scenario wns.

Figure 7.
Maximum in-plane plastic strain distribution at end of loading for Scenario wps in the interior wall face (face in tension).
Figure 7.
Maximum in-plane plastic strain distribution at end of loading for Scenario wps in the interior wall face (face in tension).

Figure 8.
Pushover curves of the adobe wall with t = 40 cm for Scenarios wns and wps.


Table 1.
Material input sets used in the CDP model.
| Material Input Set | Range of w (%) | Initial Compressive Failure Stress (MPa) | Tensile Failure Stress (MPa) |
|---|---|---|---|
| Nearly dry (Dry wall) | 1 to 3 | 0.514 | 0.051 |
| Partially saturated (Scenario wps) | 7 to 9 | 0.125 | 0.010 |
| Nearly saturated (Scenario wns) | 13 to 15 | 0.028 | 0.002 |
Table 2.
Out-of-plane lateral strength (kN) for all the cases.
| Length of Moist Region, L (cm) | Partially Saturated (Scenario wps) | Nearly Saturated (Scenario wns) | ||||
|---|---|---|---|---|---|---|
| t = 25 cm | t = 30 cm | t = 40 cm | t = 25 cm | t = 30 cm | t = 40 cm | |
| 0 (Dry wall) | 3.7 | 6.7 | 14.3 | 3.7 | 6.7 | 14.3 |
| 100 | 3.5 | 6.4 | 13.6 | 3.3 | 6.1 | 12.5 |
| 300 | 2.8 | 5.3 | 11.5 | 2.1 | 4.1 | 9.6 |
| 500 | 2.2 | 4.1 | 9.4 | 0.8 | 2.2 | 6.4 |
| 700 | 1.8 | 3.2 | 7.7 | 0.0 | 0.5 | 3.1 |
Table 3.
Out-of-plane lateral strength reduction ratio (R).
| Length of Moist Region, L (cm) | Partially Saturated (Scenario wps) | Nearly Saturated (Scenario wns) | ||||
|---|---|---|---|---|---|---|
| t = 25 cm | t = 30 cm | t = 40 cm | t = 25 cm | t = 30 cm | t = 40 cm | |
| 100 | 0.95 | 0.95 | 0.95 | 0.90 | 0.91 | 0.87 |
| 300 | 0.76 | 0.79 | 0.80 | 0.57 | 0.62 | 0.67 |
| 500 | 0.61 | 0.62 | 0.66 | 0.22 | 0.33 | 0.45 |
| 700 | 0.50 | 0.47 | 0.53 | 0.00 | 0.08 | 0.22 |
© 2020 by the authors. Licensee MDPI, Basel, Switzerland. This article is an open access article distributed under the terms and conditions of the Creative Commons Attribution (CC BY) license (http://creativecommons.org/licenses/by/4.0/).
Share and Cite
MDPI and ACS Style
Al Aqtash, U.; Bandini, P. Influence of Wall Thickness and Water Content on the Out-of-Plane Stability of Adobe Walls. Infrastructures 2020, 5, 78. https://doi.org/10.3390/infrastructures5090078
AMA Style
Al Aqtash U, Bandini P. Influence of Wall Thickness and Water Content on the Out-of-Plane Stability of Adobe Walls. Infrastructures. 2020; 5(9):78. https://doi.org/10.3390/infrastructures5090078
Chicago/Turabian StyleAl Aqtash, Umaima, and Paola Bandini. 2020. "Influence of Wall Thickness and Water Content on the Out-of-Plane Stability of Adobe Walls" Infrastructures 5, no. 9: 78. https://doi.org/10.3390/infrastructures5090078