The Influence of Confining Topography Orientation on Experimental Turbidity Currents and Geological Implications
 Euan L. Soutter1*
  Daniel Bell1,2†
  Zoë A. Cumberpatch1 Ross A. Ferguson1
  Yvonne T. Spychala2†
  Ian A. Kane1
  Joris T. Eggenhuisen2
- 1Department of Earth and Environmental Sciences, University of Manchester, Manchester, United Kingdom
- 2Department of Earth Sciences, Utrecht University, Utrecht, Netherlands
Turbidity currents distribute sediment across the seafloor, forming important archives of tectonic and climatic change on the Earth’s surface. Turbidity current deposition is affected by seafloor topography, therefore understanding the interaction of turbidity currents with topography increases our ability to interpret tectonic and climatic change from the stratigraphic record. Here, using Shields-scaled physical models of turbidity currents, we aim to better constrain the effect of confining topography on turbidity current deposition and erosion. The subaqueous topography consists of an erodible barrier orientated 1) parallel, 2) oblique and 3) perpendicular to the incoming flow. An unconfined control run generated a supercritical turbidity current that decelerated across the slope, forming a lobate deposit that thickened basinwards before abruptly thinning. Flow-parallel confinement resulted in erosion of the barrier by the flow, enhanced axial velocities, and generated a deposit that extended farther into the basin than when unconfined. Oblique confinement caused partial deflection and acceleration of the flow along the barrier, which resulted in a deposit that bifurcated around the barrier. Forced deceleration at the barrier resulted in thickened deposition on the slope. Frontal confinement resulted in onlap and lateral spreading at the barrier, along with erosion of the barrier and down-dip overspill that formed a deposit deeper in the basin. Acceleration down the back of the barrier by this overspill resulted in the generation of a plunge-pool at the foot of the barrier as the flow impacted the slope substrate. Observations from ancient and modern turbidity current systems can be explained by our physical models, such as: the deposition of thick sandstones upstream of topography, the deposition of thin sandstones high on confining slopes, and the complex variety of stacking patterns produced by confinement. These models also highlight the impact of flow criticality on confined turbidity currents, with topographically-forced transitions between supercritical and subcritical flow conditions suggested to impact the depositional patterns of these flows.
Introduction
Turbidity currents are the primary mechanism by which sediment is transported from shallow to deep water (e.g., Kuenen and Migliorini, 1950), where they build the largest sediment accumulations on Earth (e.g., Curray and Moore, 1971; Ingersoll et al., 2003). Turbidity currents are strongly affected by subaqueous topography (e.g., Ericson et al., 1952; Gorsline and Emery, 1959; van Andel and Komar, 1969) that can be formed by many processes, such as: compressional folding (e.g., Lucente 2004; Morley and Leong, 2008), extensional faulting (e.g., Cullen et al., 2019), contourite drifts (e.g., Heezen et al., 1966; Fuhrmann et al., 2020), or salt diapirism (e.g., Cumberpatch et al., 2020). Understanding the effects this topography exerts on turbidity currents is crucial for the prediction of turbidity current pathways and deposit character (e.g., Kneller and Buckee, 2000). This has implications for reconstructing paleoenvironments (e.g., Sinclair, 1994; Lomas and Joseph, 2004; Smith, 2004; Bell et al., 2018a; Dodd et al., 2018), de-risking subsurface infrastructure placement (e.g., Bruschi et al., 2006; Carter et al., 2014), predicting hydrocarbon or CO2 reservoir quality (e.g., McCaffrey and Kneller, 2001), and for improved understanding of fluid mechanics (e.g., Mulder and Alexander, 2001; Meiburg and Kneller, 2010).
The effect of confining topography orientation has been shown to be influential in the stratigraphic record of turbidity currents, with both centimetre-scale depositional processes and kilometre-scale depositional patterns differentially affected (e.g., Sinclair, 1994; Hansen et al., 2019). Lateral confinement, for example, has been used to explain lobe thinning trends (Amy et al., 2004) and stacking patterns (Spychala et al., 2017), oblique confinement has been suggested to cause deflection (Kneller et al., 1991; Haughton, 1994) and acceleration (Kneller and McCaffrey, 1999; Jobe et al., 2017) of incoming flows, and frontal confinement has been postulated as the reason for thick deep-water sandstones deposited up-stream of the confinement (e.g., Bersezio et al., 2005; Stevenson and Peakall, 2010).
Natural turbidity currents are notoriously difficult to observe, with only a few studies collecting direct flow measurements (e.g., Talling et al., 2013; Clarke, 2016; Azpiroz-Zabala et al., 2017; Symons et al., 2017; Paull et al., 2018). The characteristics of turbidity currents are therefore often inferred from scaled-down physical model analogues (e.g., de Leeuw et al., 2016; Pohl et al., 2019a; Pohl et al., 2019b) that permit systematic variation of individual parameters and analysis of their effects. The effect of subaqueous topography on experimental turbidity currents has been studied previously (e.g., Edwards et al., 1994; Alexander and Morris 1994; Kneller, 1995; Kneller and McCaffrey, 1995; Brunt et al., 2004; Bursik and Woods, 2000; Al Ja’aidi et al., 2004; Amy et al., 2004; Kubo, 2004; Stevenson and Peakall, 2010; Oshaghi et al., 2013; Abhari et al., 2018; Farizan et al., 2019). However, almost all of these studies are performed either within narrow flume tanks, with non-erodable substrate, or using homogenous or synthetic sediment. Therefore, while these studies provide important insights into the interaction between turbidity currents and topography, they may only be representative of depositional patterns at their particular bounding conditions.
Supercritical turbidity currents and their deposits are becoming increasingly recognized as influential components of modern and ancient deep-water systems (e.g. Postma and Cartigny, 2014). Deposition from supercritical flows can be driven by their transition to a subcritical regime via a hydraulic jump (e.g., Komar, 1971). Hydraulic jumps are most commonly associated with channelized flows (e.g., Hage et al., 2018), flows over levees (Fildani et al., 2006), or flows at slope-breaks (e.g., Kostic and Parker, 2006; Covault et al., 2017; Brooks et al., 2018). The prevalence and character of hydraulic jumps and their associated deposits are less well understood in topographically-complex settings (e.g., Edwards et al., 1994; Lamb et al., 2008; Maier et al., 2018; Howlett et al., 2019).
This study documents scaled physical models of turbidity currents interacting with basin-floor topography and has three main aims: 1) to assess the effect of confining topography orientation (0, 45, and 90°) on turbidity currents and their deposits, 2) to explore the effect of topography on flow criticality and associated depositional features; and 3) to use these findings to aid in the stratigraphic interpretation of deep-water basins.
Methodology
Experimental Set-Up and Data Collection
Experiments were carried out in the Eurotank flume tank at Utrecht University. The flume tank configuration used is similar to that of previous studies (e.g., de Leeuw et al., 2018; Pohl et al., 2019a; Ferguson et al., 2020; Spychala et al., 2020). It comprises a 3 m long, 80 cm wide and 8 cm deep channel on a 11° dipping slope, a 4 m long and 4° dipping slope without a channel, and a 4 m long horizontal basin floor (Figure 1A). The most confining channel-form of de Leeuw et al. (2018) was used in order to promote bypass along the upper slope and deposition on the topographically-confined lower slope.
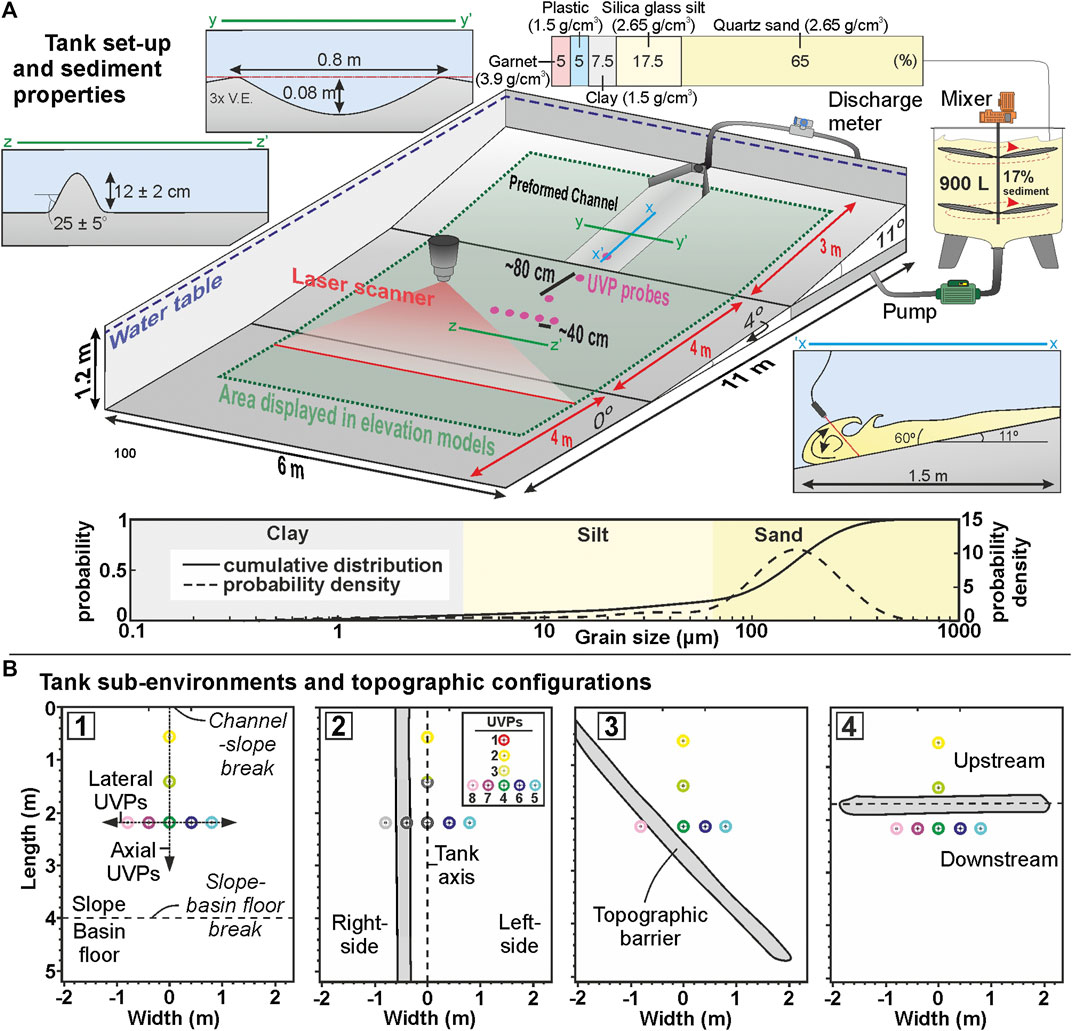
FIGURE 1. (A) Key features and dimensions of the experimental method showing the channel, slope, topography and sediment mixture. UVP probe positions and sediment composition are also indicated (modified from Ferguson et al., 2020). Grain-size distributions are derived from Malvern Mastersizer analysis. (B) Tank sub-environments and topographic configurations discussed in text. The left- and right-sides of the tank are with respect to the flow.
The first experiment was run without any basin-floor topography (i.e., unconfined). A linear topographic ridge was created for three subsequent experiments with incidence angles of 0, 45, and 90° relative to the dip-slope (lateral, oblique and frontal confinement respectively (Figure 1B)). The ridge was a 12 ± 2 cm high, ∼40 cm wide triangular prism with a confining surface that dipped at 25° ± 5° on both the upstream- and downstream-facing sides (Figure 1A). The barrier height was approximately double the flow thickness, fully confining the base of the flow (Figures 1A,2B,C; section 2.3.4). The barrier, channel, slope, and basin floor were formed from fine-sand (Figure 1B). The use of an erodible substrate allowed both erosion and deposition to be recorded by high-resolution laser scans (2 × 2 mm resolution) of the tank before and after each run (Figure 3). These difference maps were used to describe the geometry of the deposit, to create cross- and dip-sections, and to quantify changes in deposit thickness laterally and longitudinally (thinning rates). Thinning rates were calculated based on three thickness intervals: 1) thickest point of deposit to 5 cm (axis), 2) 5 cm to 2 cm (off-axis), and 3) 2 cm to 1 cm (fringe) (Supplementary Figure S1). Longitudinal thinning rates (parallel to flow and deposit axis) could not be calculated within the distal fringe due to ponding of water at the base of the drained tank, which obscured the edge of the deposit. The edges of deposits, and therefore morphometric descriptions, are also measured based on the 20 mm pinch-out line due to water ponding at the toe of the deposit after draining of the tank prior to laser-scanning.
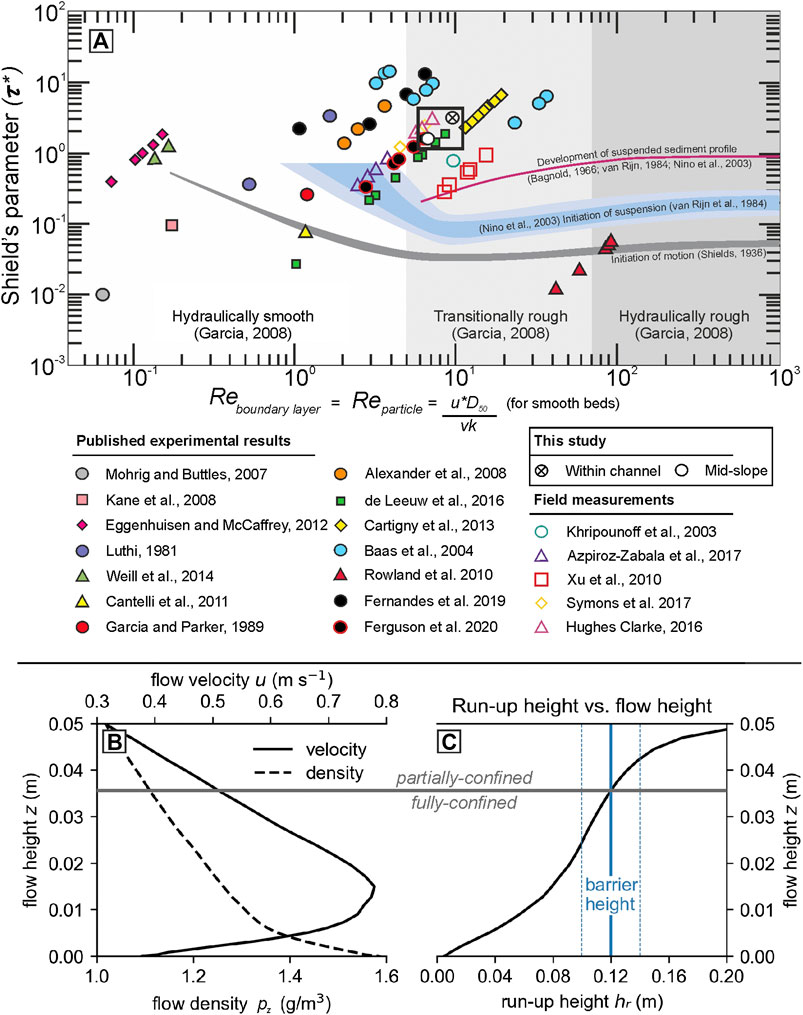
FIGURE 2. (A) Shields-scaled experimental and field-measured flows (modified from de Leeuw et al., 2016; Fernandes et al., 2020). The flows produced by these experiments are Shields-scaled within the channel (UVP 1) and on the slope (UVP 4) to promote both sediment entrainment and transport, making the experimental flows similar to natural flows. (B) Velocity (UVP 4) and density (predicted) profiles used for run-up height estimation. (C) The lower, denser part of the flow is confined by the barrier, while the upper, less-dense part of the flow is able to run-up and surmount the barrier (C).
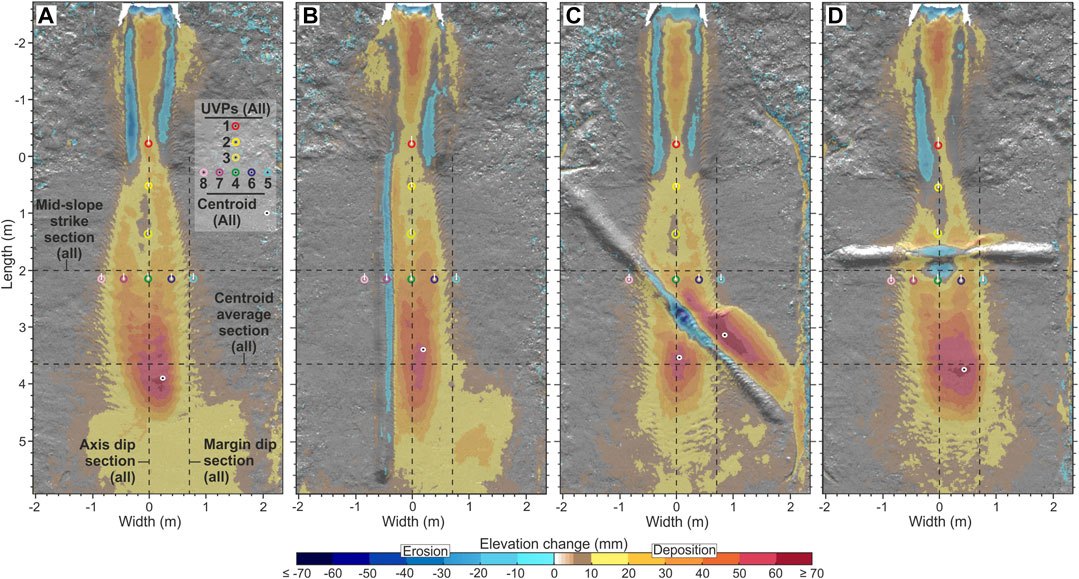
FIGURE 3. Difference maps for the experimental runs discussed in this study. The maps are made by subtracting the laser scan derived elevation of the pre-experiment tank surface from the post-experiment tank surface. (A) Unconfined; (B) laterally confined; (C) obliquely confined, and (D) frontally confined. Erosion is shown in blue and deposition is shown in yellow, orange and red. White tick on the UVP represents the approximate limit of upstream velocities captured by that UVP.
Ultrasonic Doppler Velocity Profiler (UVP) probes were used to measure flow velocity. Seven UVP probes were located on the slope and one was located in the channel (Figure 1A). Four UVPs were positioned longitudinally along the axis of the tank and spaced ∼80 cm apart (UVP 1, 2, 3, 4), and four UVPs were positioned laterally across at ∼20 cm spacing (UVP 5, 6 7, 8), forming a “T” shaped probe distribution capable of capturing both longitudinal and lateral cross-sections (Figure 3 and Figure 4). The UVPs are orientated facing downward, at a 60° angle to the local bed, consequently the velocities measured reflect the velocity field from the indicated UVP position to ∼ 10 cm upstream on the slope and ∼ 12 cm in the channel (Figure 3A). The velocity profiles were calculated from the UVP measurements under the assumption that the mean flow is dominantly parallel to the bed (Cartigny et al., 2013) and that bed-perpendicular velocity is negligible. It should be noted that the lateral measurements were collected with the probes aligned straight up-slope, obliquely with respect to the spreading oncoming flow, therefore the measured velocities from these probes may be slightly underestimating the true flow speed. Normalized velocities (by maximum channel velocity for axial velocities and UVP D for lateral velocities) are used to compare velocities between each run, in order to counter the effect of minor variations in discharge that may be present between each run.
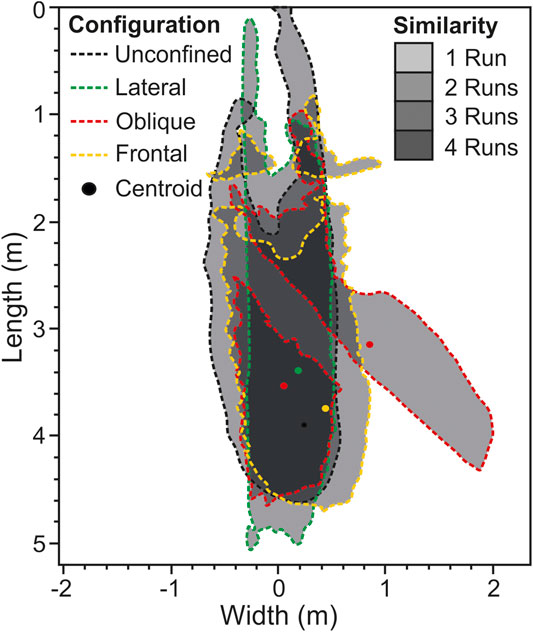
FIGURE 4. Slope extent comparison for each of the deposits showing the similarity between each deposit. The pinch-out line is at 2 cm due to the difficulty in tracing accurately around the 2 cm line because of water-ponding in the drained tank.
Flow Properties
Each flow had a bulk sediment concentration of 17% and a mixed grain size of fine-sand (D50 of 141 μm) in order to meet scaling criteria. The sediment in each experiment consisted of a mixture of materials (Figure 1; Supplementary Table S1). The sediment composition, by weight-percent, was 65% quartz sand (2.65 g/cm3; 161 μm), 17.5% silica glass silt (2.65 g/cm3; 53 μm), 7.5% kaolinite clay (2.65 g/cm3; 7 μm), 5% plastic (urea, melamine and acrylic) (1.5 g/cm3; 331 μm) and 5% garnet (3.9 g/cm3; 193 μm) (Figure 1A; Supplementary Table S1). The use of this mixture was motivated by research interests in the effect of sediment density on turbidity currents deposits, which will be discussed in a separate manuscript. The sediment composition (i.e., variable densities) and grain-size is similar to that measured within natural turbidity current deposits (e.g., Stanley, 1963; Bell et al., 2018b). Grain size distributions of the input sediment were established using a Malvern Mastersizer laser diffraction particle size analyser (Figure 1A; Supplementary Table S1). The sediment-laden water was pumped at a discharge rate of 40 m³ h−1 into the flume tank and flowed down the channel and onto the slope as a turbidity current.
Scaling
Froude Scaling
Froude scale modeling uses the dimensionless Froude and Reynolds numbers to scale natural turbidity currents to experimental turbidity currents (Yallin, 1971; Peakall et al., 1996; Kneller and Buckee, 2000), with the Reynolds number relaxed compared to natural systems and the Froude number held as similar (e.g., Graf, 1971). The Reynolds number (Re) describes the ratio of inertial to viscous forces, where Re values greater than ∼2,000 represent a fully turbulent flow:
where ρc = the density of the current, U = the average velocity below the flow height (h), hmax = flow height at the velocity maximum, and μ = dynamic viscosity. The experimental flows used by this study have Reynolds numbers of 76,000 within the channel and 37,000 at the most distal axial probe on the slope (∼200 cm), and are therefore fully turbulent (Supplementary Table S1) (e.g., Leeder, 1982).
The Froude number (Fr) describes the ratio of inertial to gravitational forces acting on a turbidity current, and for scaling purposes it should be held comparable to natural turbidity currents. Flows with Froude numbers greater than one are termed supercritical, while flow with Froude numbers less than one are termed subcritical (e.g., Komar, 1971). The transition from supercritical to subcritical flow is marked by a discontinuity known as a hydraulic jump, and is manifested by thickening and deceleration of the flow through the jump (e.g., Komar, 1971; Garcia and Parker, 1989). The ratio between the Froude number upstream of the jump and Froude number downstream of the jump controls the strength of the jump (velocity decrease and thickness increase), with low ratios resulting in weaker jumps and high ratios resulting in stronger jumps (e.g., Cartigny et al., 2014). The densimetric Froude number (Frd) further accounts for gravity acting on the density difference between the flow and ambient fluid (i.e., the reduced gravity [g’]), and is thus used for describing turbidity currents (Kneller and Buckee, 2000):
where
where g = acceleration due to gravity and ρa = the density of the ambient fluid. Flow height is here determined as the height of the flow at ½ of the Umax (Launder and Rodi, 1983; Pohl, 2019). The modeled turbidity currents (based on the unconfined control experiment) were supercritical (Frd = > 1) within the channel axis (Frd = 1.78) and on the mid-slope (Frd = 1.46) (Supplementary Table S1). These Frd numbers are consistent with those estimated for natural turbidity currents (Sequeiros, 2012), and thus scalable to natural systems. It should be noted that Froude number calculations assume a constant flow density; however, it is likely that flow density decreased due to deposition of sediment and entrainment of water, making the mid-slope Frd numbers a minimum estimation.
Shields Scaling
Recent experimental studies (e.g., Pohl et al., 2019b; Ferguson et al., 2020; Fernandes et al., 2020) have adopted the scaling approach of de Leeuw et al., 2016, which emphasizes the importance of scalable turbulence-sediment interactions. This approach depends on the relationship between the Shield’s number (τ*) (Shields, 1936), and the particle Reynolds number (Rep), which governs how sediment is transported (e.g., van Rijn, 1984; de Leeuw et al., 2016) (Figure 2A):
where ρs is the sediment density (2705.95 kg/m3), ρf is the flow density (1,290 kg/m3), and D50 is the median grain size (141 µm), v is kinematic viscosity of fresh water at 20°C, and U* is the shear velocity (m s−1) that can be estimated with (Middleton and Southard, 1984; van Rijn, 1993):
where k is von Kármán’s constant (0.40), and D90 is the 90th percentile of grain size (274 µm). If the Shields number is too low, then the experimental current is below the initiation of suspension and is therefore not representative of natural turbidity currents (Figure 2A). The experimental turbidity currents in this study plot above the initiation of suspension and developed a suspended sediment profile (e.g., Bagnold, 1966; van Rijn, 1984) (Figure 2A). The currents also had a transitionally rough boundary layer, which causes both turbulent and viscous forces to interact with the bed and prevents the flow being overly depositional (de Leeuw, 2016), or “depletive” (e.g., Kneller, 1995). This means that, when characterized with the Shields parameter and the particle Reynolds number, these flows are in the same dynamic regime as natural turbidity currents (Figure 2A). Both of these scaling criteria hold true for flows within the channel, and flows at the point of topographic interaction on the slope (Figure 2A). The sediment mobility of these physical models therefore scales to natural turbidity currents using the most current scaling approaches.
Hierarchical Scaling
The deposits generated by the individual experimental flows have been suggested to represent lobe elements (sensuPrélat et al., 2009) by other studies (Ferguson et al., 2020; Spychala et al., 2020). This is due to the way in which an individual experimental deposit shows little to no compensation and instead aggrades vertically, while multiple experimental deposits are heavily influenced by the relief of previous deposits and stack compensationally (Ferguson et al., 2020; Spychala et al., 2020). This same pattern of poorly-developed compensational stacking between successive event beds to the well-developed compensational stacking between successive lobe elements (that build lobes) has been observed in the subsurface (e.g., Deptuck et al., 2008) and at outcrop (e.g., Prélat et al., 2009), leading to the interpretation that the deposits formed in these models are most representative of lobe elements.
Confinement Scaling
The degree of confinement produced by the 12 cm barrier has been estimated by calculating the run-up height potential of the unconfined experimental turbidity current (hr) as a function of its measured vertical velocity profile and a predicted density profile (Allen, 1985; Kneller and McCaffrey, 1999):
where z is the flow height, uz is the flow velocity at height z, Δρz is density difference between the flow at height z and the ambient fluid (freshwater), and E is the frictional energy loss (0.33; Allen, 1985). Estimations of hr for these experimental flows has been calculated using the time-averaged velocity profile of UVP four and a logarithmic decrease in density from double the excess depth-averaged density at the base of the flow (∼1.6 g/m3) to low excess densities at the top of the flow (∼1.05 g/m3) (Figure 2B). These estimations indicate that the lower, denser base of the experimental flows are unable to surmount the barrier and are therefore fully-confined, while the upper, less-dense parts of the flow are able to surmount the barrier and are therefore partially-confined (Figure 2C). Due to a lack of vertical density or concentration measurements, and the wide density variation of the grains used, these absolute values are necessarily uncertain; however, the estimation provides a useful basis with which to interpret the experimental deposits, which will be discussed throughout.
It should be noted that the flows are sustained and deposits aggrade through time, consequently, relative confinement also reduces through time. Temporal changes in velocity measured downstream of the barriers are therefore used to infer when confinement was breached.
Comparison to Nature
The experimental results (Figures 1–11) are discussed within the context of: 1) outcrop observations from the topographically-confined Grès d’Annot turbidites of Alpine foreland basin (see Joseph and Lomas, 2004 for review), 2) existing facies and hierarchical schemes (e.g., Prélat et al., 2009; Postma and Cartigny, 2014; Hage et al., 2018), and 3) a predicted second deposit (t2) following the initial deposit (t1), in order to consider how the experimental results may be applied to exhumed or subsurface deep-water basins (Figures 12–15). These comparisons are necessarily speculative, but it is hoped the discussion will aid in the interpretation of deep-water sedimentary systems.
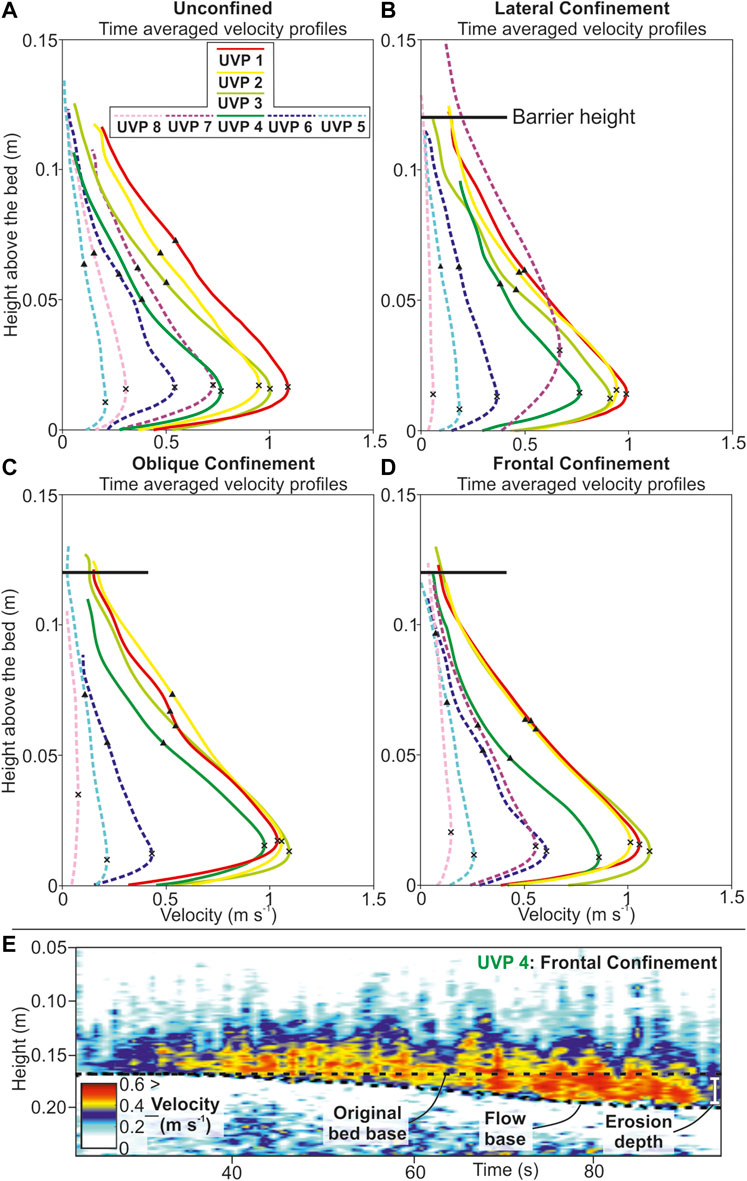
FIGURE 5. (A–D) Time-averaged velocity profiles for each experimental run. Dashed lines indicate lateral velocity measurements. The head (first 5 s) and tail (final 15 s) have been cropped to exclude noise from the depth averaging process. The cross on the time-averaged velocity profiles is the Umax, and the triangle is the flow height. (E) Velocity field through the passage of frontally confined turbidity current immediately downstream of the barrier. Acceleration through time and erosion is indicated by the UVP data.
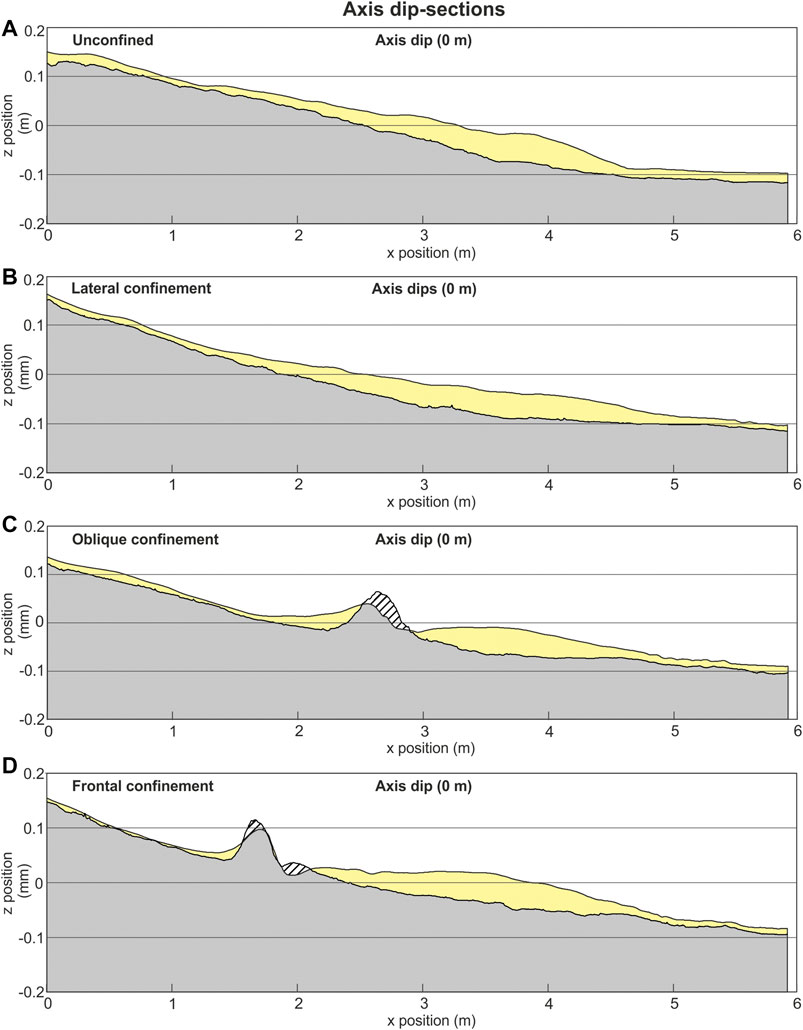
FIGURE 6. Dip sections along the axis of the deposits. Section locations on Figure 3. Striped pattern indicates erosion.
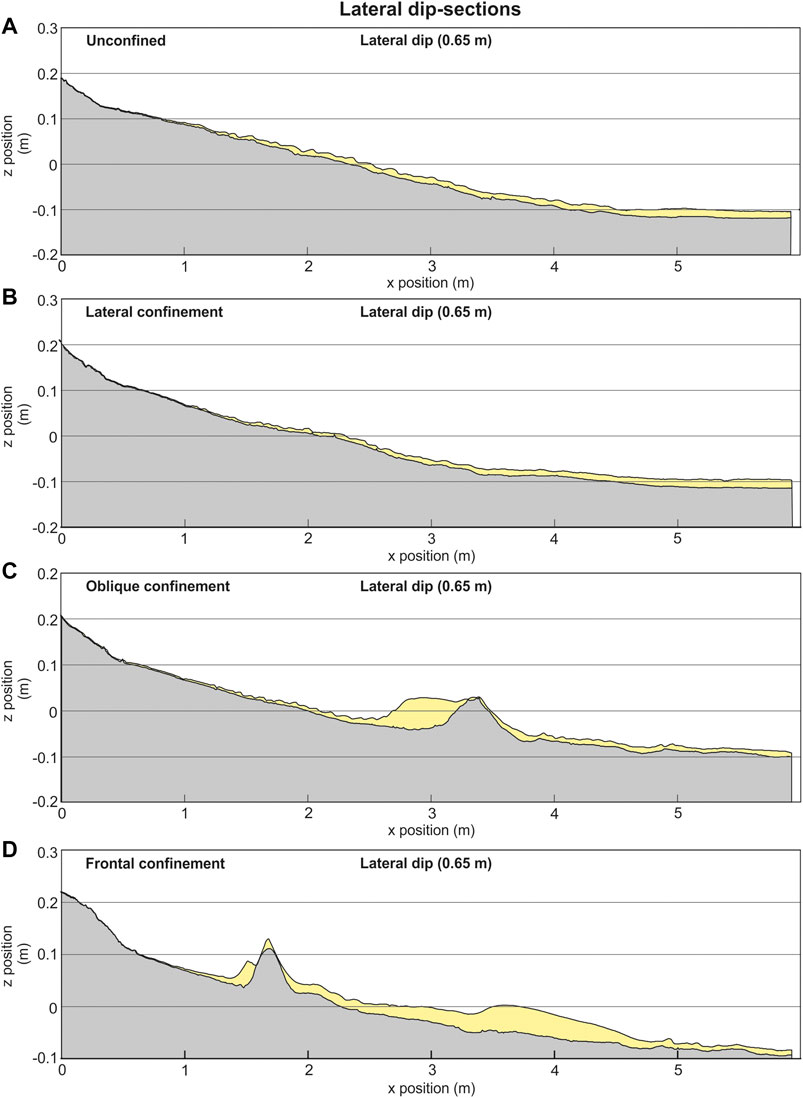
FIGURE 7. Dip sections through the margin of the deposits. Section location on Figure 3. Striped pattern indicates erosion.
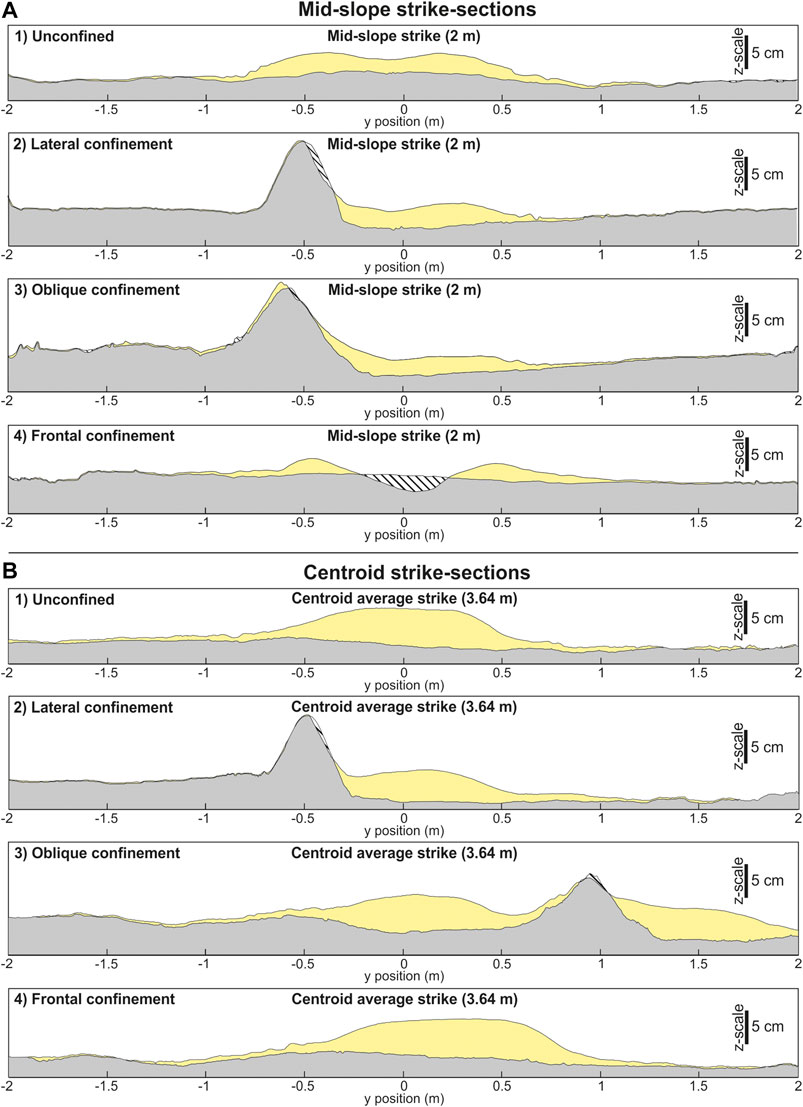
FIGURE 8. (A) Strike sections through the deposits mid-way down the slope. Section locations on Figure 3. (B) Strike sections through the average position of the centroid across the runs. Section locations on Figure 3. Striped pattern indicates erosion.
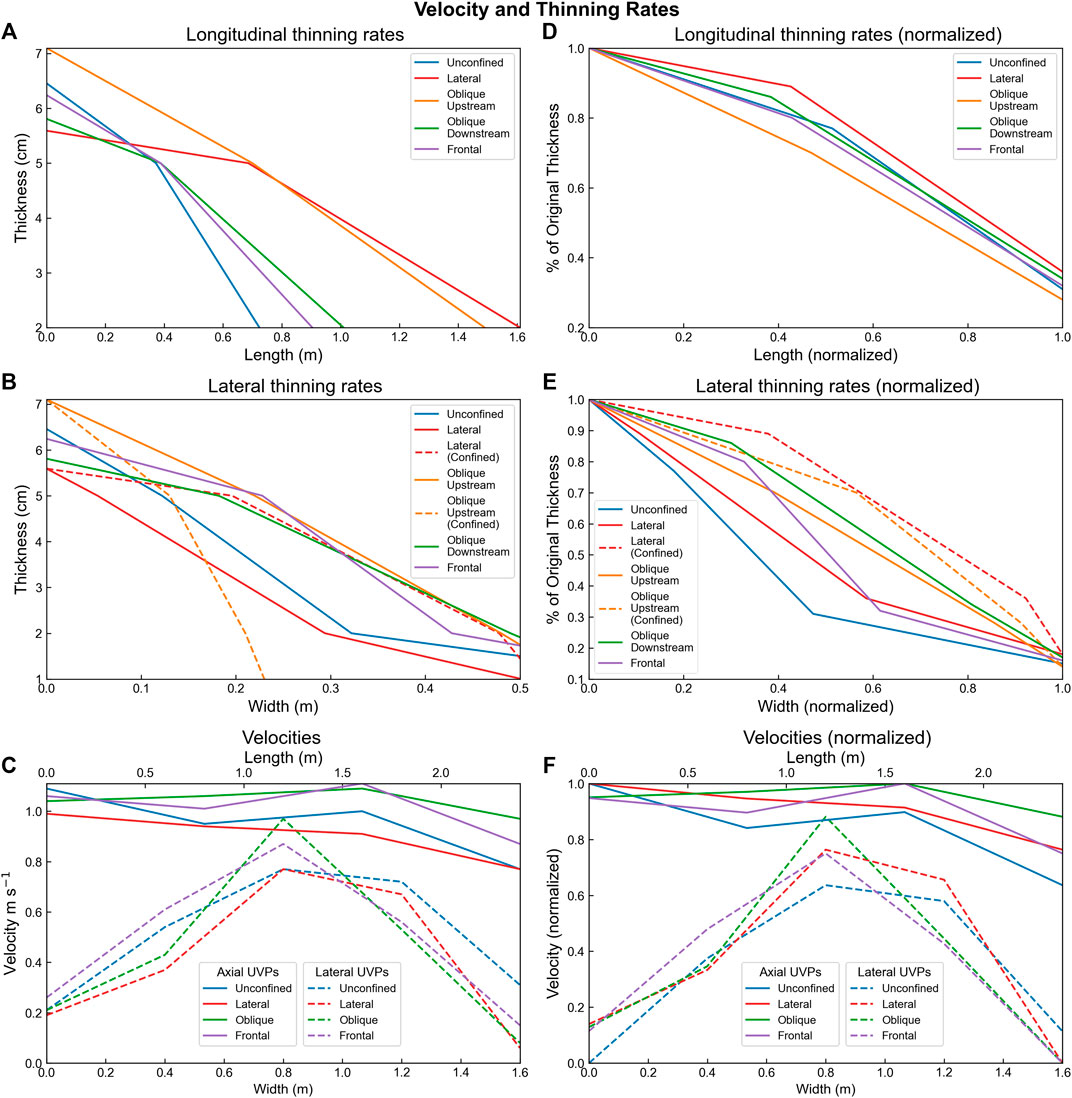
FIGURE 9. Actual (A–C) and normalized (D–F) thinning and velocity rates recorded by these experiments. The deposits have been divided into their depositional components, i.e., in the oblique experiment the upstream confined deposit is treated as a separate to the downstream unconfined deposit.
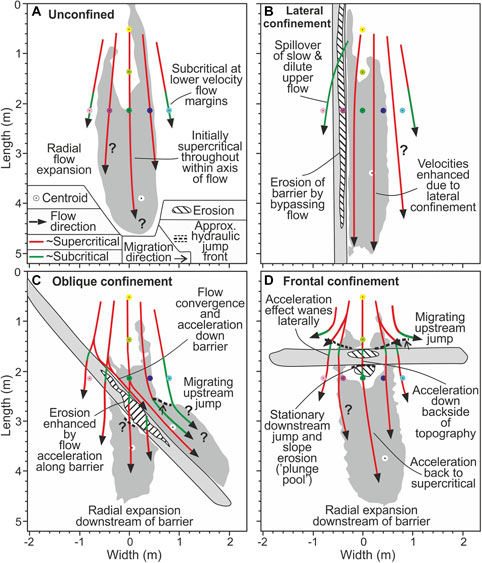
FIGURE 10. Flow pathways and criticality for each of the runs. Criticality is based on UVP measurements. Criticality down-dip of UVPs is inferred based on sedimentary architecture.
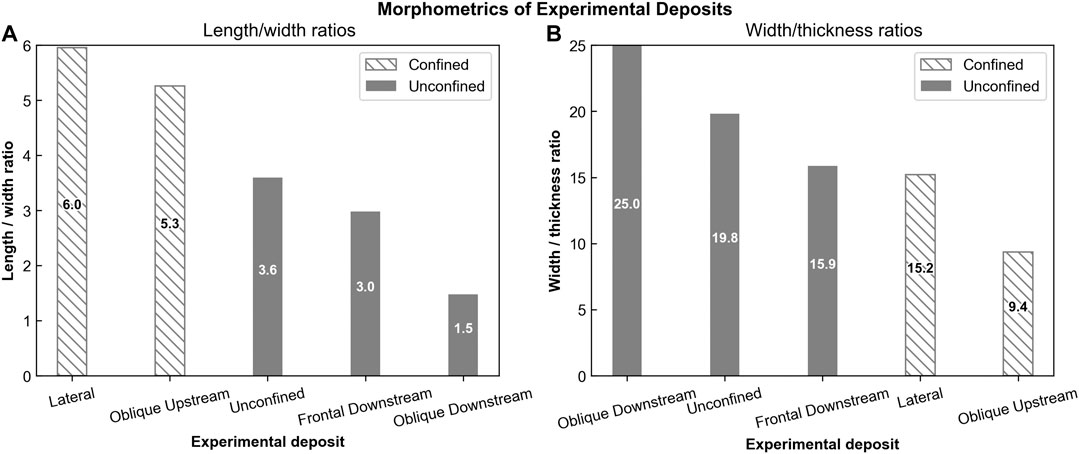
FIGURE 11. (A) L/W ratios from experimental deposit. Lateral confinement results in the highest L/W ratios, while up-dip confinement results in the lowest L/W ratios. (B) Width-thickness ratios for each experimental deposit. Laterally confined deposits have the greatest thickness-width ratios.
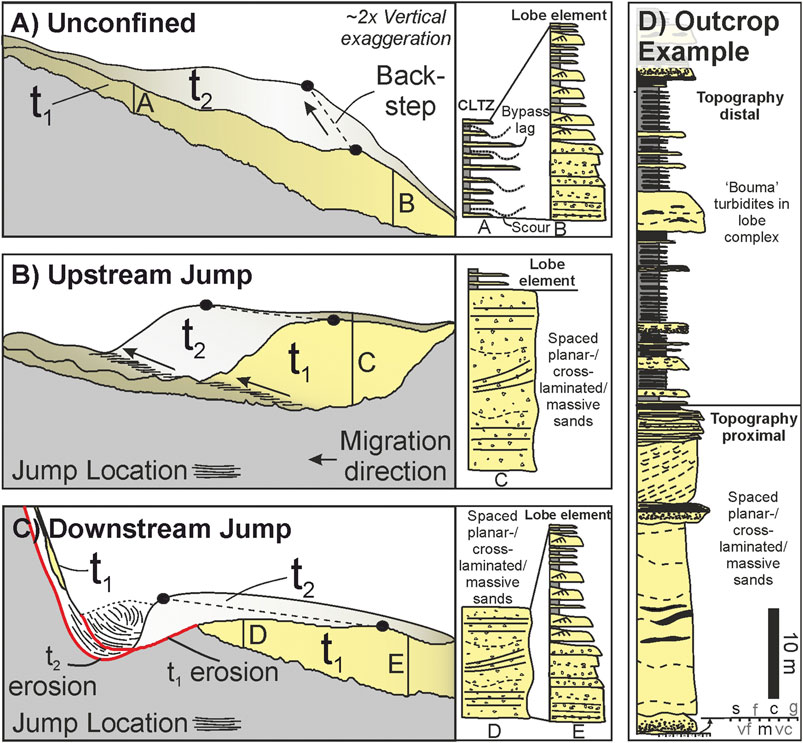
FIGURE 12. Schematic diagram showing how these experimental deposits (t1; Figures 6,7) and a hypothetical second deposit (t2) may scale to natural lobe element stacking patterns and facies. Facies modified from Prélat et al., 2009, Postma and Cartigny, 2014, Hage et al., 2018, and Soutter et al., 2019. (A) Back-stepping of lobe elements caused by the depositional relief of the underling deposit. (B,C) Major back-stepping caused by an upstream hydraulic jump (B) or downstream (C) hydraulic jumps and erosion. These jumps form due to rapid deceleration at counter-slopes. The second deposit (t2) in A, B and C is hypothetical. (D) Logged section from the Annot Basin (modified from Soutter et al., 2019; Braux Fault, 43° 59′ 3.84″ N/6° 42′ 50.76″ E), showing the potential field expression of proximal hydraulic jump and/or highly confined deposition passing into distal hydraulic jump and/or weakly confined deposition.
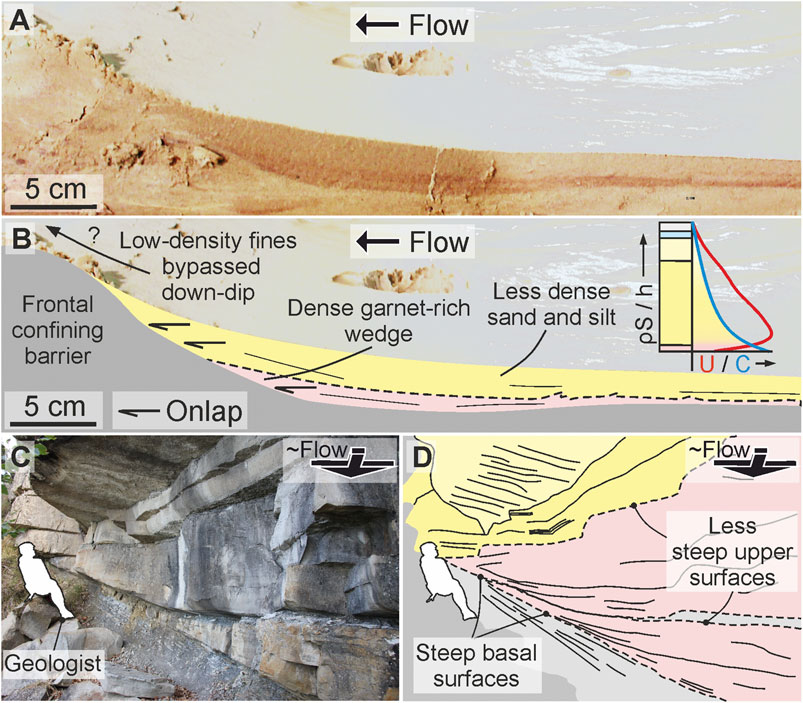
FIGURE 13. (A) Uninterpreted and (B) interpreted cross-section photographs from the upstream side of the frontally confining run. This section is taken ∼20 cm off-axis. The image shows onlap of a red garnet-rich layer and layer onlap of a more sand-silt dominated layer. A schematic concentration-velocity profile is also indicated on (B) based on the densities of the sediment that comprises the flow. (C) Uninterpreted and (D) interpreted field expression of the onlap geometries seen on A and B. The red shading highlights the wedged onlapping flows. Outcrop in D is mirrored from actual outcrop (Col du Fa, 44° 0′ 33.84″ N/6° 43′ 5.52″ E).
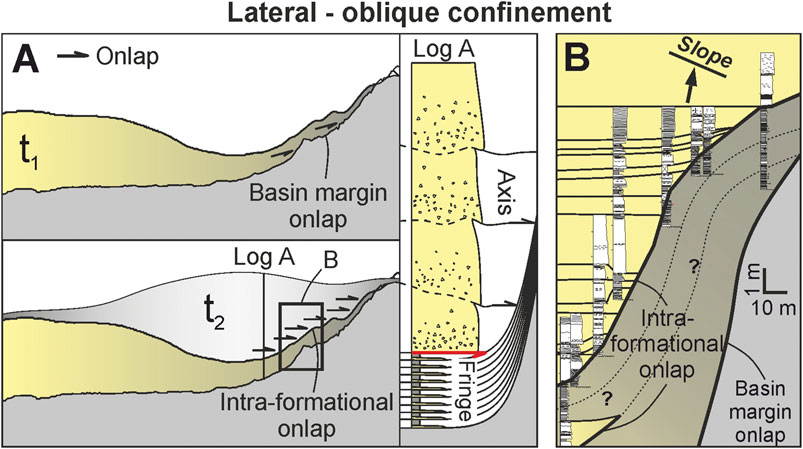
FIGURE 14. (A) Schematic diagram showing the predicted deposition if another current (t2) was able to deposit over the obliquely confined t1 and the sedimentary log representation of that geometry. Onlap occurs against the topography (basin margin onlap) and within the deposits (intra-formational onlap), through draping of the topography by the lower-concentration fringe. (B) A field example of oblique confinement and onlap against the Annot Basin margin (modified from Soutter et al., 2019; Col du Fa, 44° 0′ 33.84″ N/6° 43′ 5.52″ E), showing an onlap geometry that may have been formed in the same manner as A. Question marks indicate uncertainty in correlation.
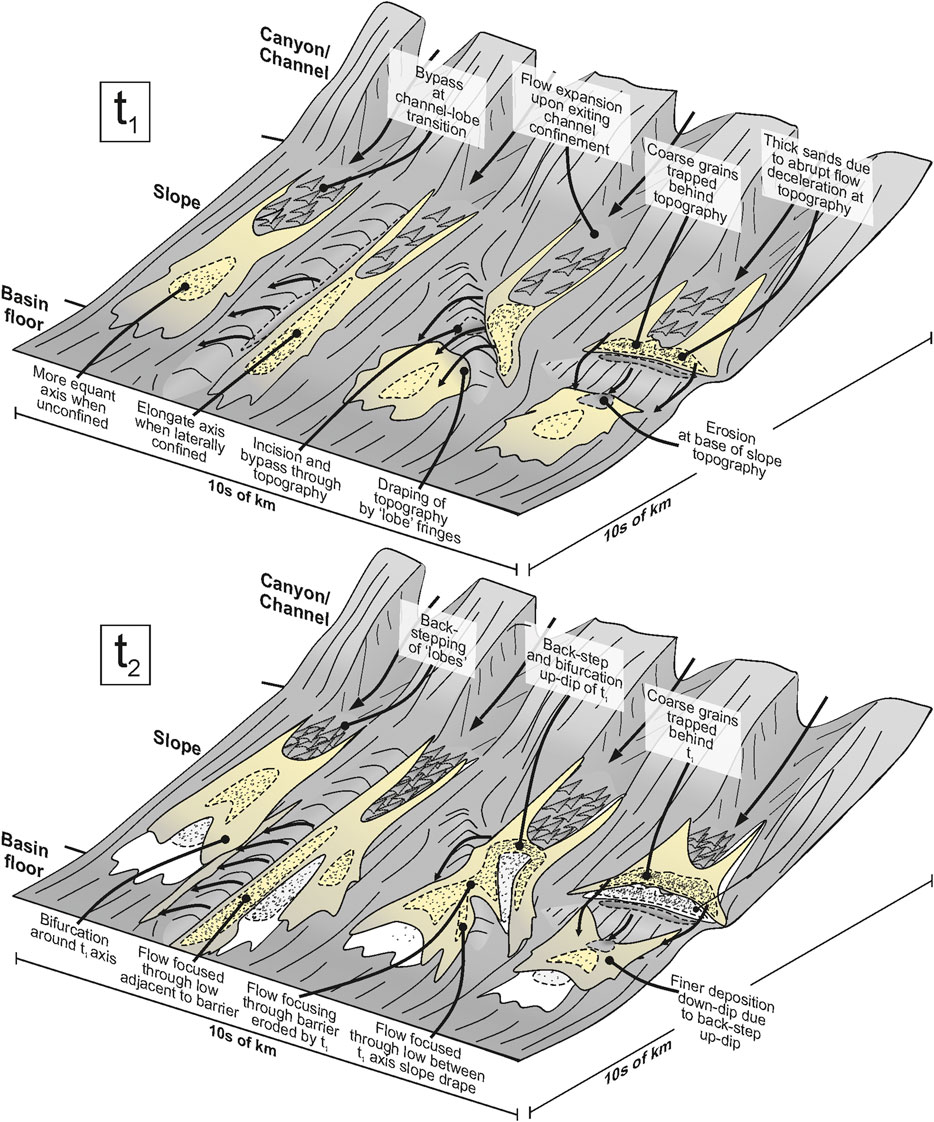
FIGURE 15. Summary schematic diagram showing the depositional features and stacking patterns that can be expected on a topographically-complex slope based on these experiments. Initial deposition (t1) is based on the experiments, while t2 is hypothetical. Initial deposition (t1) indicated by white fill on t2.
Experimental Results
Channel and Channel-Slope Transition: All Experiments
Observations
The input flow parameters and channel-form dimensions were uniform across all runs so the following description applies to all flows. Flows were highly erosional within a 15 cm radial zone around the mouth of the inlet pipe, becoming partly depositional down the axis of the channel (Figure 3). Channel deposits thin distally and laterally, reaching maximum thicknesses of 5.1 cm ∼7 cm away from the inlet pipe and thinning to < 2 cm at the channel-mouth and channel-margin. Channel margins were eroded asymmetrically, with erosion of up to 4 cm into the inside channel margin measured (Figure 3). Thin (<1 cm) overbank deposits were observed across the runs.
Loss of channel confinement and reduction in slope angle at the channel-slope transition was characterized by < 2 cm of deposition, or non-deposition, through the axis for a distance of 1 m (Figure 3). This axial zone initially thins at the mouth of the channel toward a depositional minimum at ∼20–60 cm down-dip, before thickening again ∼160 cm down-dip of channel mouth. This results in an up to ∼40 cm wide and ∼90–130 cm long oval-shaped area of bypass on the slope. This area of bypass was flanked by up to 3 cm of deposition that thickens down-dip from the margins of the channel (Figure 4).
Interpretations
Excessive erosion at the channel head is caused by the turbidity current exiting the inlet pipe and transitioning from an un-erodible to erodible substrate, and is therefore an experimental artefact. Deposition immediately down-dip of this zone is driven by capacity-driven deposition (sensuHiscott, 1994), with thicker deposits in the channel axis than the channel margins due to higher sediment concentrations within the axis. The channel was predominantly a bypass zone but the deposit gradually aggraded due to the high concentration of the flows, eventually filling by sedimentation of the slower and more depositional tail of the flow (e.g., Barton et al., 2010). Lateral confinement of the flow by the channel caused erosion along the length of the channel margins. This asymmetrical channel-margin erosion is attributed to either variation within turbulent flows exiting the inlet pipe at slightly offset directions, or small irregularities in the pre-formed channel topography. Deposition on the outsides of the channel-form margins was driven by overspill of the upper parts of the turbidity current that were able to surmount the channel relief (e.g., de Leeuw et al., 2016; de Leeuw et al., 2018), forming levee deposits (e.g., Normark et al., 1983; Kane and Hodgson, 2011).
Flow relaxation, coupled with a relatively high slope angle, counteracted the effects of flow expansion and deceleration at the channel mouth, developing the broad bypass region (Pohl et al., 2019a). Deposition occurred at the margins of this non-depositional zone due to lower velocities at the margins of the flow (e.g., de Leeuw et al., 2016). The marginal deposits acted to further confine the flow, enhancing bypass and creating a constructional channel-form evident in strike cross-sections (Figure 8A,1) (e.g., Hamilton et al., 2015; de Leeuw et al., 2016).
Channel-Slope Transition–Basin Floor
The following sections will describe deposition solely on the topographically-varied portions of the slope and basin floor (>1.5 m down-dip from the channel-slope break), except within the laterally confined run, which is affected by topography from the mouth of the channel to the basin floor. Each section will describe the thickness and velocity observations, followed by the interpretations.
Unconfined
Observations
The unconfined experiment produced a 12.8 cm wide and 46 cm long deposit, with a length-width ratio (L/W) of 3.6. The deposit thickened from 1–2 cm to a maximum between 20–32 cm down-dip (Figure 3A), with the thickest point of the deposit (centroid) reaching 6.5 cm near the slope-floor break at 390 cm (Figure 3A). From 43 to 320 cm the deposit maintained a 5–< 6 cm thickness, forming a 90 cm long and 60 cm wide axial zone. The deposit thinned to < 2 cm thick over 30 cm before the thickness became obscured by ponded water on the flat basin floor (Figure 5A). The deposit also thinned laterally, reaching its maximum width of 128 cm, 240 cm down-dip of the channel mouth Figures 7A,B; Figure 8A,B).
Flow velocity decreased with distance away from the inlet pipe and through time (Figure 4A). The maximum velocity of 1.09 m s−1 was recorded by the most proximal probe in the channel. The velocity decreased down-dip to 0.77 m s−1 at the most distal axial probe (UVP 4) over a distance of 240 cm. Velocity decay was more rapid laterally within the flow, from 0.77 m s−1 to 0.21–0.31 m s−1 over 80 cm, away from the flow axis (UVPs 5 and 8). Velocity decay laterally was not symmetrical. Velocity initially decayed slower toward the left of the flow between the axis and first lateral probe (UVP 6), before decelerating more-rapidly between the first and second left-lateral probe. Comparatively, the right-lateral probe measurements showed more linear velocity decay from axis to margin (Figure 5A; Figure 9C).
Interpretations
Distal thickening of the unconfined deposit is attributed to the gradual waning of flow velocity as the flow expanded across the slope (Figures 4A,6A,10A), with velocities likely decreasing and deposition increasing throughout the run in this zone as the deposit aggraded, generating topography (Hamilton et al., 2015). The centroid located near the slope to basin-floor transition suggests that the relative change in slope gradient at this point enhanced deposition. Thinning of the deposit onto the basin floor is attributed to waning and competency-driven deposition of the less dense components of the flow (clay, silt, and plastic) (Figure 1; Supplementary Table S1). Lateral thinning is attributed to flow expansion, deceleration and deposition on the margins (e.g., de Leeuw et al., 2016). The variation of lateral thinning rates is possibly due to subtle lateral dip-variations on the constructed slope.
Lateral Confinement
Observations
Lateral confinement parallel to the right-hand channel margin resulted in a deposit 34% narrower (58.5 cm narrower) than the unconfined deposit and 10% longer (50.6 cm narrower) (L/W = 6) (Figure 1B; Figure 3B; Figure 9D). Lateral thinning rates differed between the confined and unconfined sides of the deposit; on the confined margin the deposit thinned 74% less from the centroid (5.6 cm) to 5 cm, 29% less in the off-axis, and ∼8x more in the fringe when compared with the unconfined deposit (Figure 8B). On the unconfined margin the deposit thinned 8–17% less initially, before thinning 72% more at the fringe (Figure 1C). Thinning rates were also reduced by 78% down-dip of the centroid (Figures 3B; Figure 9A). Up to 3 cm of erosion was seen along the barrier margin confining the flow (Figure 8A). This erosion extends for ∼440 cm down-dip from the channel-mouth, adjacent to the main deposit.
The normalized axial velocity (UVP 4) of the laterally confined run was 20% faster (0.76 m/s) compared with the unconfined run (Figure 4B). Lateral velocities were also affected by confinement, with the velocity profile measured by the UVP adjacent to the barrier having an Umax ∼50% higher than the equivalent point in the unconfined run. On the outside of the topography (UVP 8) the velocity was 81% slower than the unconfined run (Figures 4B; Figure 9C,D). The velocity at the equivalent probe on the unconfined side of the laterally confined flow was 10% slower than the unconfined run.
Interpretations
Erosion of the lateral barrier was caused by confinement of the flow and consequent shear stresses exerted on the barrier substrate (Cossu and Wells, 2012). Erosion decreased down-dip as the flow waned. Non-deposition on the right-hand ‘shielded’ side of the barrier was caused by this confinement, which prevented lateral spreading of the flow and deposition on the right-hand side of the tank (Figures 4; Figure 10B). This is supported by the reduced velocities measured on the right-hand side of the barrier (Figure 5B). The velocity measurement collected adjacent to the barrier with a vertically higher Umax is attributed to a more well-mixed, homogenous and slower upper part of the flow that was able to run-up the topographic barrier (Al Ja’aidi, 2000; Al Ja’aidi et al., 2004).
Enhanced thinning rates in the fringe adjacent to the barrier (Figure 9B) are suggested to be caused by deceleration against the barrier slope, resulting in faster rates of deposition in lateral positions (e.g,. Barker et al., 2008), and consequent onlap of the deposit against the barrier (Figures 8A2,B2). Reduced thinning rates through the axis and on the unconfined margin of the flow are also attributed to this confinement. The axis of the flow was confined laterally between the barrier and marginal deposition, thus allowing the maintenance of high velocities along its length and decreased rates of deposition down-dip and laterally, resulting in an elongation of axial deposition. This interpretation is complicated by the 14% faster velocity decay measured from axis to margin on the unconfined side of the flow compared with the unconfined run (Figure 9C). This indicates that proximally (0–200 cm) the flow was focused axially through the basin due to confinement by the barrier and marginal deposition, resulting in rapid velocity drop-off laterally within the flow. The rate of marginal deposit aggradation will have exceeded the rate of axial aggradation throughout the passage of the experiment, further confining the flow (e.g., de Leeuw et al., 2016), enhancing sediment bypass, and causing elongation of axial deposition. At more distal positions (200–400 cm) this effect had been reduced as the flow began to spread laterally over the slope. Amy et al., 2004 reported similar patterns from outcrop and experimental observations, with enhanced bypass adjacent to a laterally-confining barrier and enhanced deposition away from the barrier during the passage of a high-velocity flow.
Oblique Confinement
Observations
Oblique confinement of the flow resulted in a bifurcated deposit, with one “axis” of the deposit positioned upstream of the barrier, and the other “axis” downstream of the barrier (Figure 3C), resulting in two distinct centroids. The upstream centroid was 20% thicker than the downstream centroid (7 cm compared with 5.8 cm). The upstream deposit was also more elongate (L/W 5.3) and extended over a longer distance than the downstream deposit (L/W 1.5), having a similar geometry to the laterally confined deposit described previously (Figures 3B; Figure 8D). The upstream deposit was different, however, in that it displayed an arcuate surface on its upstream side that dipped steeply towards the channel, forming a wedge- or ridge-like geometry. (Figures 3C; Figure 7C). Thickening across this surface was rapid, increasing down-dip from ∼10 to ∼70 cm over ∼20 cm. The ridge caused a discontinuity within the axis of the upstream deposit, with the axis ∼50% narrower than would be expected if continuous along the barrier. Thinning from centroid to 5 cm thick down-axis within this upstream deposit was 78% less, and 62% less in the off-axis, when compared with the unconfined deposit (Figure 9A). Thinning rates on the confined margin of the upstream oblique deposit were also much greater than those measured within the laterally confined deposit; the oblique deposit thinned 451% greater within the axis, 257% greater with the off-axis, and 100% greater within the fringe (Figure 9B).
Up to 7.8 cm of erosion was recorded down the axis, removing a substantial amount of material from the topographic barrier (Figures 3C; Figure 5C). Erosion decreased laterally and was confined to an erosional zone approximately the same width as the channel (∼8 cm). The deposit initially thins across the barrier, before thickening again down-dip, forming the same downstream depositional geometry as seen in the unconfined experiment, but with a thinner centroid (5.6 cm). Thinning rates were slower within this downstream deposit compared to the unconfined deposit, with down-dip thinning rates 47% slower in the axis, and 43% slower in the off-axis. Marginal thinning rates were also slower, with thinning rates 63% slower in the axis, and 35% slower from in the off-axis. This resulted in a more equant, and less lobate, deposit down dip (L/W 1.5).
The measured velocity field of this flow was similar to that of the unconfined run due to most of the UVP probes being located upstream of topography (Figure 3C). The only upstream velocity difference was measured by the UVP closest to the topography (UVP 4), which was located within the axis of the flow 20 cm upstream of the topography. When normalized the velocities at this axial position were 36% higher than the same relative position within the unconfined run and 20% higher than the laterally confined run (Figure 9F). This velocity anomaly was present throughout the experiment and was maintained even when more proximal velocities began to wane. Velocities from the “shielded” UVP eight on the downstream side of the topography were also affected, being 74% slower than the equivalent position on the unconfined experiment and 2.5x higher Umax (Figure 5C). Velocities were not able to be analyzed from UVP seven due to the steep barrier slope underlying the probe preventing accurate data collection.
Interpretations
The increased thickness of the upstream bifurcated deposit indicates that it formed immediately upon turbidity current interaction with the barrier and that left-lateral deflection was the primary route taken by the incoming flow throughout the experiment. The downstream deposit may have formed concurrently with the upstream deposit, with the deposit representing the lower concentration upper regions of the flow that were able to surmount the topographic relief (Figure 2C). This may explain the equant shape of the deposit, which is a characteristic of deposition from lower-concentration flows (Al-Ja’aidi et al., 2004). Alternatively, the downstream deposit formed after the upstream deposit as erosion of the barrier decreased the degree of confinement, allowing the flow to overtop it. A combination of both of these processes is likely to have contributed to the deposition of the downstream deposit. The similarity in geometry between the unconfined deposit and this downstream deposit is as expected due to their relative lack of confinement and radial expansion.
The higher flow-velocities upstream of the barrier are suggested to be caused by the axis of the flow impacting with the barrier. Flow convergence and acceleration down the barrier will have enhanced this erosion, with deposition extending obliquely down-dip along the barrier (Figure 10C). Flow convergence is attributed to similar features seen at oblique onlap surfaces in field investigations (see “accumulative flow” of Kneller and McCaffrey, 1999). It is also possible that flow reflection may have interfered with the velocity measurement; however this should have resulted in deceleration, and not acceleration, so is not deemed to be significant. Erosion of the barrier may have been enhanced by flow convergence as the flow became increasingly laterally confined by the margins of the barrier incision (Gee et al., 2001). Erosion may also have been enhanced through time as the deposit aggraded updip of the barrier, decreasing the relative height of the barrier. The low-velocities and higher Umax measured on the UVP eight downstream of the barrier are interpreted to have been caused by shielding of this UVP by the barrier, with only the well-mixed and lower velocity upper parts of the flow able to surmount the topography and be detected by the UVP. This is an analogous process as inferred to have occurred at UVPs seven and eight over the crest of the barrier and on the shielded side of the tank. The velocity measured in the oblique run is slightly higher (0.08 m s−1 compared with 0.06 m s−1), possibly due to acceleration of the flow down the backside of the oblique topographic barrier.
The steep-sided ridge deposited adjacent to the barrier and to the left (looking downstream) of the flow axis is suggested to be formed through rapid flow deceleration and thickening upon interaction with the barrier (e.g., Alexander and Morris, 1994), with the barrier essentially acting to bring the slope profile above-grade (e.g., Prather, 2003). Similar geometries have been formed within both topographically-affected experimental and numerical turbidity currents and has been attributed to the flow thickening and decelerating at the barrier and forming a hydraulic jump or reflective bore (Edwards et al., 1994; Kneller and Buckee, 2000; Lamb et al., 2004; Howlett et al., 2019), resulting in the deposition of a thick “sediment ridge” at the barrier (Alexander and Morris, 1994). Similar structures were also produced in granular pyroclastic flows through the formation of a “granular jump” (Smith et al., 2020). Flow “lofting” has also been described within subcritical flows encountering frontal barriers (Stevenson and Peakall, 2010). While there were no UVP measurements in the correct position to record a jump, it can be inferred based on the supercriticality of the incoming flow, the geometry of the ridge and its similarity to other examples where Fr numbers were more constrained (e.g., Hamilton et al., 2015; Hamilton, 2017) The aggrading sediment ridge, along with increased flux from deflected flow upstream (Alexander and Morris, 1994), will have caused the jump front and associated deposition to migrate and back-step through time (Figure 10C–12B). The formation of the ridge laterally within the flow, and not within the axis, is attributed to lateral flow velocities and being sufficiently low to allow hydraulic jump formation upon deceleration at the barrier. The axial velocities were high enough to maintain supercritical conditions upon deceleration at the barrier, therefore deposition was concentrated downstream of the barrier, forming an essentially unconfined deposit (Figure 4–11C; Supplementary Figure S2).
Frontal Confinement
Observations
Frontal confinement resulted in onlap and perpendicular spreading of the deposit against the barrier (Figure 3D). Spreading was greater on the left-hand side of the flow axis. Deposition was not significantly thicker upstream of the barrier, and compared with the unconfined deposit, the perpendicular geometry of the deposition on the left hand-side was the only variation. The ridge seen at the up-dip extent of the deflected deposit within the obliquely confined run was also observed at the up-dip reaches of the deflected deposits within this run, albeit at a smaller scale (Figure 7D) The same thickening pattern was observed, although the deposit only thickens to ∼ 4 cm compared to 7 cm in the obliquely confined run.
Erosion of the middle of the barrier was again observed, although not as deep as the erosion in the obliquely confining run (Figure 3D–6). Erosion (up to 2.5 cm) was also focused on the upstream side of the barrier and failed to fully breach the barrier, while erosion was more focused on the downstream side of the oblique barrier, breaching it with up to 7.8 cm of erosion (Figures 2C,D). Erosion was also observed at the downstream foot of the barrier (Figure 3D), forming a 2.5 cm deep scour into the slope substrate that shallowed down-dip over 40 cm before the flow became depositional (Figure 8A4). This down-dip deposition had a similar depositional pattern to the unconfined run, with thickening and thinning occurring at broadly the same points on the slope. However, the frontally confined deposit had more linear frontal and lateral margins (L/W = 3) than the unconfined deposit (L/W = 3.6), which was more lobate and had more curvilinear margins (Figure 11). The frontally-confined deposit thinned from its centroid (6.2 cm) to 5 cm down-dip, 18% less than the unconfined deposit (Figure 9A). Marginal thinning rates were similar to the unconfined deposit (Figure 9B).
Velocities up-dip of the topography were similar to those observed in the unconfined control run (Figure 5D). The axial velocity measurement (UVP 4) when averaged between 10 and 40s is similar to those seen in the unconfined run. The velocity at UVP four was not constant, however, and accelerated throughout the run, reaching a normalized velocity 36% higher than the unconfined run by ∼ 55s (Figure 5E). Lateral UVPs show the opposite pattern, however, with the flow initially up to 16% faster than the unconfined run, before decelerating through the run and becoming up to 33% slower (Figures 9E,F).
Interpretations
The downstream velocity increase toward the end of this experiment indicates that more of the flow was able to surmount the topography and deposit down-dip through time (Figure 5E), compared to the obliquely-confined experiment. This suggests that the upstream deflected “wing’ was deposited initially as the flow decelerated at the barrier (Figures 4D–10D). Similar spreading at frontally confining barriers has been reproduced in numerically-modelled turbidity currents (Howlett et al., 2019). Aggradation upstream of the barrier gradually reduced the degree of confinement, allowing bypass and deposition downdip, i.e., “fill-and-spill” deposition (e.g., Sinclair and Tomasso, 2002). This loss of relative frontal confinement was enhanced by axial erosion of the barrier, which also has been observed in subsurface fold-thrust belts (Morley and Leeong, 2008). The axial deposition that allowed the topography to be surmounted is interpreted to have been subsequently eroded, leaving the upstream right-hand margin “wing” (Figure 3D) and left-hand margin onlap (Figure 13A) as the erosional remnants of this early deposition. The opposite pattern observed by the lateral probes (deceleration through time) is suggested to be caused by the upstream deposition preventing overspill in lateral position through time, thus limiting the flow’s ability to reach the lateral probes downstream through time. Alternatively, the velocity decrease is due to increasing confinement axially within the downstream scour, which allowed only the upper and lower-velocity parts of the flow to reach the lateral UVPs.
The ridge present on the upstream right-hand side of the deposit are suggested to be formed in the same way as those formed in the same relative position on the obliquely confined deposit, with the flow decelerating and thickening at the barrier and subsequently undergoing a localized hydraulic jump on the slope (Figure 10D) (e.g., Alexander and Morris, 1994). The axial erosion seen on the slope at the downstream base of the topographic barrier is attributed to either deceleration at the foot of the slope, hydraulic jump formation and scouring (e.g., Sumner et al., 2013) or excavation by flows that accelerated down the backside of the barrier and impacted the slope (e.g., Lee et al., 2002). Erosion may have been enhanced by entrainment of the early onlapping garnet (Figure 13A), which increased the flow density and velocity. As more of the flow was able to surmount and flow down the barrier the velocity gradually increased (Figure 5E), which would have deepened the scour, and may have gradually prevented deposition downstream through entrenchment (Figure 12C). Deposition downstream of this scour, possibly analogous to deposition on the stoss-side of a cyclic step (e.g., Postma et al., 2014), resulted in an unconfined lobate deposit at the slope to slope-basin floor transition. If a jump was absent at the foot of the slope then it is likely that the flow deposited in the same manner as in the unconfined experiment.
It is also possible that the barrier acted essentially as a defect on the bed, with the incoming flow attempting to equilibrate the slope. This process would be analogous to a waxing flow that has formed bedforms (i.e., the barrier) that were stable at a low velocity, but which are now unstable at higher velocities and are therefore re-worked by the flow (e.g., Cartigny et al., 2014). The scour at the foot of the barrier in this case may therefore be formed by streamline separation and erosion at the foot of the lee-slope, much in the same way erosion occurs at the foot of a lee-slope during ripple formation (e.g., Allen, 1969).
Summary and Comparison of Results
Morphometrics
The laterally confined deposits have the highest length-width (L/W) ratios (5.3–6) (Figure 11A). The lowest L/W ratios are seen in the deposits downstream of oblique and frontal slope confinement (1.5–3). Complete unconfinement produces the median L/W ratio (3.6) (Figures 3A–10A). These differences in L/W ratios between confined and unconfined deposits are consistent with those seen from lobes in natural systems (Prélat et al., 2010), with the unconfined deposit having the same L/W as the average of unconfined lobes on the Amazon Fan (3.6), for example, (Figure 10A). The experimental deposits are scaled to lobe elements, however, which in nature have much lower L/W values when confined, with Pleistocene lobe elements measured offshore Borneo (Saller et al., 2008) having a mean L/W ratio of 1.9 (0.6–3 range), consistent with the unconfined experimental deposits. This is most likely due to the relatively weak confinement felt by the Borneo lobe elements on the basin floor (Saller et al., 2008), highlighting the influence that the degree of confinement has on planform depositional architecture. Unconfined lobe elements in the Gulf of Mexico show a high degree of variance in their L/W ratios (Twichell et al., 2009; Pettinga et al., 2018), ranging from 1.2 to 11.7, which may be due to compensational stacking and internal confinement, resulting in significant L/W variation. Factors such as flow concentration, sediment supply and grain size may also cause L/W variance, highlighting that L/W alone is not a sufficient predictor of confinement. When L/W is combined with thickness measurements, however, confinement may be more accurately estimated (e.g., Prélat et al., 2010; Pettinga et al., 2018), with unconfined deposits tending to be more laterally extensive but thinner, and confined deposits tending to be less laterally extensive but thicker (Figure 11B).
Thinning Rates
Across the experiments the unconfined deposits show lateral thinning rates that are higher than longitudinal thinning rates, giving all of the deposits a lobate shape elongate in the dip or flow-parallel direction (Figure 9B). The unconfined deposit shows the greatest longitudinal thinning rate, with laterally confined deposits having the lowest rates (Figures 9A,D). The opposite relationship describes the outer margins of the deposits, with thinning rates enhanced at the fringe when confined (Figures 9B, E). It should be noted, however, that in the axis and off-axis lateral thinning rates are lower when confined than when unconfined, and that elevated thinning rates associated with confinement are only seen in the fringe (Figures 9B,E).
Velocities
Normalized axial velocities (UVP 4) are lowest in the purely unconfined experiment (0.64 m s−1), and greatest during the obliquely confined experiment (0.86 m s−1), with confinement (at any orientation) always causing an acceleration of axial velocities (Figure 9F). The lowest velocities measured (0.06–0.08 m s−1) were in the furthest lateral positions on the shielded sides of the parallel and oblique topography (Figure 9C). Lateral velocities (UVP four to 6/7) decayed fastest from the axis during frontal and oblique confinement and decayed slowest from the axis on the confined margin of the laterally confined experiment (Figure 9F). Lateral confinement induced the most rapid velocity decay from the axis on the unconfined margin, however. Lateral confinement also showed the greatest velocity decay on the furthest lateral margins (UVP 7 to 8) within the “shadow” zone on the backside of the barrier.
Discussion
Topographically-Forced Hydraulic Jumps
Two styles of topographically-forced transition between supercritical and subcritical flow and consequent hydraulic jump may be inferred from the depositional products of these experiments. One jump style is formed upstream of topography and the other is formed downstream of topography (Figure 12).
Upstream Hydraulic Jumps
Upstream jumps are forced by sudden flow deceleration and thickening upstream of confining topography (Figures 10C, D–12B) (e.g., Alexander and Morris, 1994; Howlett et al., 2019), forming a thick ridge of sediment upstream of the barrier (Figures 6C; t1 of Figure 12B). Experimental granular pyroclastic density currents exhibit the same depositional pattern, depositing increasingly steep backsets until the topography of the backset is such that a “granular jump” or “bore” forms, resulting an upstream-thickening deposit that is similar to that produced by this study (Smith et al., 2020). This process occurs in the absence of topography, indicating that it may arise should flow be sustained for long enough to allow backsets to sufficiently steepen and either 1) decrease the Frd of the incoming flow below unity, forming a jump, or 2) block the flow and cause rapid deposition without decreasing the Frd of the incoming flow below unity (Smith et al., 2020). This was demonstrated within turbidity currents by Hamilton et al., 2017, who showed that backset aggradation beneath unconfined supercritical flows forms an increasingly steep upstream-dipping slope that eventually forces deceleration and hydraulic jump formation within the incoming flow, resulting in avulsion. Pohl et al., 2019b also experimentally demonstrated that such a jump may be generated if the depositional topography becomes high enough to create an adverse (upstream-dipping) slope. These experiments show that this effect can be enhanced by the presence of pre-existing slope topography.
This hydraulic jump generation and migration process may be recorded stratigraphically as thick sandstones (t1), which may be massive, amalgamated or have planar or backset bedding (Postma and Cartigny, 2014; Hage et al., 2018), overlain by more “typical” heterolithic lobe deposits (t2) (e.g., Prélat et al., 2009; Kane et al., 2017; Figure 12B,D), with the thick sandstones deposited as ancient incoming flows encountered topography, thickened and decelerated, and the overlying thinner-sandstones representing the down-dip expression of younger thick sandstones deposited upstream as the jump migrated landwards (Figure 12B,C). Backsets may be present within the thick sandstone, indicating upstream aggradation (Figure 12B). Such a stratigraphic relationship is observed at outcrop in the deep-marine Grès d’Annot of the bathymetrically-complex Cenozoic Alpine foreland basin and is interpreted to be caused by oblique confinement and rapid deposition. There, thick amalgamated sandstones, which are interpreted to have aggraded rapidly adjacent to relict fault topography (Tomasso and Sinclair, 2004), are overlain by heterolithic sandstones and mudstones that appear to be less confined and stack compensationally (Soutter et al., 2019) (Figure 12D). Evidence for flow deflection, such as opposing paleocurrent values (e.g., Kneller et al., 1991), may also form upstream of the confining barrier should the reflected bore tractionally-rework the aggraded sediment (e.g., Edwards et al., 1994). Opposing paleocurrents are present at the base of the outcrop example presented in Figure 12D, as predicted by Edwards et al., 1994.
Downstream Hydraulic Jumps
Downstream jumps are formed downstream of topography when either: 1) supercritical flows descend and rapidly decelerate at the foot of an continental margin or intra-basinal slope or 2) subcritical flows descend, accelerate and become supercritical down the slope, before decelerating at the foot of the slope and passing through a hydraulic jump (Figures 10C–12C). Scouring of the slope (Figure 12C) may occur in response to the development of strong vertical velocities within the hydraulic jump (Sumner et al., 2013), or, in the absence of a jump, as the flow impacts the slope and erodes the substrate, much like plunge-pools seen at the foot of slopes in seafloor bathymetry data (“impact pool” of Lee et al., 2002; Schnyder et al., 2018). This plunge-pool is expected to deepen through time as subsequent flows (t2) repeatedly erode the subtract (Figure 12C). Deposition downstream of the jump in nature may form a thick sequence of amalgamated sandstones that may correlate with more organized lobe deposits further down-dip (Figure 12C) (Lee et al., 2004; Amy et al., 2007).
Upstream and downstream hydraulic jumps are expected to be more prevalent in settings with steep slopes or where slopes are likely to be above-grade, such as fold-thrust belts (e.g., Amy et al., 2007; Vinnels et al., 2010), salt provinces (e.g., Prather et al., 1998) or active margins (e.g., Harris and Whiteway, 2011). Their identification may therefore be useful for paleoenvironmental interpretations. Due to the relatively high slope angle in these experiments it is possible that the flow accelerated and became supercritical once again downstream of the jump, or did not undergo a hydraulic jump and instead excavated the slope (Lee et al., 2002) and re-accelerated, before expanding across the slope and decelerating (Figure 10D). The presence of steep slopes and topography may therefore allow the formation of multiple types of hydraulic jump upstream and downstream of topography, and associated depositional heterogeneities.
Turbidity Current Stratification and Run-up
Run-up, or “superelevation”, of turbidity currents and consequent deposition of turbidites high on counter-slopes has been noted in geophysical (e.g., Muck and Underwood, 1990; Lamb et al., 2008), theoretical (e.g., Dorrell et al., 2018) and field (e.g., Soutter et al., 2019) investigations. Run-up has also been recognized in these experiments (Figure. 7C; Figure 8A2,3,4,B2,3,4), with the dense and higher-concentration garnet-rich base and axis of the flow less able to run up the topography than the less dense sand-silt higher in the flow and on the flow fringes, forming an onlapping red-colored wedge against the barrier (Figure. 13A). This range of confinement is predicted by the velocity and density profiles of an individual flow (Figure. 2C), and results in highly-confined deposition upstream of topography and relatively unconfined deposition downstream of topography (Figure. 10C; D).
Turbidity current run-up is also evident where the downstream lateral fringe of the obliquely-confined deposit runs up and drapes the topographic barrier (Figure. 7A), creating a relative low between the deposit centroid and the deposit draping the topography (Figure. 14A). A hypothetical subsequent turbidity current (t2) could be expected to fill this relative bathymetric low, and its axis would onlap directly against the slope drape of the early deposit, and not the topographic barrier itself (Figure. 14A). A potential natural example of this relationship has been interpreted in the Grès d’Annot turbidites of SE France, where low-concentration flows deposited a thin-bedded drape high on the tectonically-formed basin margin (Figure. 14B) (Soutter et al., 2019). This drape was subsequently onlapped by the deposits of higher-concentration flows less able to surmount the topography, forming an intra-formational onlap surface (Figure. 14B). These experiments provide evidence for this stacking pattern being a common feature of confined basins, and provide a mechanism for explaining abrupt coarsening-upward trends adjacent to basin margins (Figure. 14B).
Implications for the Interpretation of Confined Deep-Water Systems
These experiments highlight the morphological variation possible simply by changing the orientation of confining basin topography. This is synthesized in Figure 15, where a conceptual basin margin receives two consecutive deliveries of sediment (t1 and t2). Assuming no external or allogenic signature is recorded in the deposits, lobe elements in unconfined settings are expected to follow a general pattern of avulsion and/or back-stepping (Hamilton et al., 2015, Hamilton et al., 2017; Ferguson et al., 2020) as each successive flow is influenced by depositional relief created by previous flows (Figure 12A). This process is enhanced where flows are frontally or obliquely confined, as successive flows have to surmount both the barrier and the underlying thick sandstones (t1) that were deposited by previous flows at the barrier, thus trapping coarse-grains on the slope (Figure 13) (Brunt et al., 2004) and causing a topographically-forced back-step (Figure 15) that could be mis-interpreted as an external signal, such as decreasing sediment supply (Ferguson et al., 2020) or sea-level rise.
Topographic orientation also affects the spatial distribution of individual flows. This is best seen where an individual flow is obliquely confined, resulting in two separate axial zones deposited from one flow (Figure 3D–15). These disparate areas of positive relief will act to complicate compensational stacking patterns and therefore the correlation of units that are spatially distinct but time-equivalent. Bifurcation of deposits will also affect paleocurrent measurements, with two separate populations of paleocurrents in spatially separate areas (e.g., two separate field exposures) representing deflection of turbidity currents and not a migrating sediment input point (Figure 15). Lateral and oblique confinement may also affect lobe morphologies by preventing lateral expansion of turbidity currents and enhancing their ability to transport sediment basinward. This would cause a topographically-forced progradation that again could be mis-interpreted as an external signal, such as an increasing sediment supply or sea-level fall.
It should be noted that these stacking patterns will be impacted depending on the ratio between topographic growth and sedimentation. If the rate of topographic growth is greater than the sedimentation rate, then sequential flows will be consistently confined in a particular orientation, resulting in maintenance of the externally-influenced stacking patterns described here. If the rate of topographic growth is less than the sedimentation rate, then confinement will be gradually healed by deposition from each sequential flow, resulting in stacking patterns that evolve from more externally-controlled to more internally-controlled, i.e., compensationally stacked, through time.
Conclusions and Future Work
Physical models of turbidity currents interacting with topographic barriers at incidence angles of 0, 45, and 90° were created to better understand the effect topography has on natural turbidity currents and their deposits. Unconfined turbidity currents are able to spread radially over the slope, forming a lobate deposit that thickens, then thins distally. Laterally confined turbidity currents are prevented from spreading on one side, forming an asymmetric deposit. Down-dip thinning rates are also reduced in a laterally confined setting, allowing flows to deposit farther into the basin. Oblique confinement resulted in an upstream deflected deposit and a downstream deposit, which has implications for deposit correlation in deep-water outcrop and subsurface datasets. Frontal confinement caused lateral spreading, with inferred trapping of coarse grains higher on the slope, compared to unconfined deposits. Flow stratification is also shown to be important for confinement, with the higher-concentration base of turbulent flows more affected by the topography than the lower-concentration upper parts of flows, resulting in both highly confined and weakly confined deposits being produced by one individual flow.
Two styles of topographically-forced hydraulic jump are inferred from these experiments. Upstream jumps are formed when flows rapidly decelerate upstream of slope topography, resulting in the deposition of thick sandstones up-dip of topography. Downstream jumps are formed downstream of topography and are caused by rapid deceleration of flows at the foot of the barrier, with slope erosion occurring at the foot of the barrier as the flow impacts the slope. The prevalence of these jump styles will be greater in deep-water environments capable of producing local and steep slopes e.g., fold and thrust belts and salt-influenced basins.
It is suggested that future work should focus on: 1) the grain size and composition distribution of differentially confined deposits, 2) performing scalable experiments on erodible topographic barriers with different geometries, such as salt-diapir-analogous mounds, or deep-water fold-and-thrust belts, 3) performing experiments with multiple confining topographic barriers on one slope, such as two laterally confining barriers, 4) varying the height of the topography barrier, and 5) releasing sequential flows into the basin to assess the stacking pattern predictions made in this study.
Data Availability Statement
All datasets generated for this study are included in the article/Supplementary Material.
Author Contributions
ES processed and analyzed the majority of the data, and wrote the manuscript. ES, DB, ZC, RF, YS, and IK constructed and performed experiments. YS prepared the materials required for the experiments. ES, DB, ZC, IK, and JE secured the funding and designed the experiments. All authors contributed to the manuscript.
Funding
This work was funded through the European Plate Observing System (EPOS) Transnational Access to the Total Core Services (TCS) Multi-scale laboratories facilities scheme and the Natural Environmental Research Council (NERC) (grant number NE/M00578X/1).
Conflict of Interest
The authors declare that the research was conducted in the absence of any commercial or financial relationships that could be construed as a potential conflict of interest.
The reviewer CS declared a collaboration with one of the authors DB to the handling editor.
Acknowledgments
We would like to gratefully acknowledge the European Plate Observing System (EPOS) and the Natural Environmental Research Council (NERC) for funding this project, and Utrecht University for enabling the experiments. We would also like to thank Christopher Stevenson, Kathryn Amos and Anne Bernhardt for their reviews, which greatly helped the clarity of the manuscript.
Supplementary Material
The Supplementary Material for this article can be found online at: https://www.frontiersin.org/articles/10.3389/feart.2020.540633/full#supplementary-material.
References
Abhari, M. N., Iranshahi, M., Ghodsian, M., and Firoozabadi, B. (2018). Experimental study of obstacle effect on sediment transport of turbidity currents. J. Hydraul. Res. 56, 1–12. doi:10.1080/00221686.2017.1397778
Al Ja’Aidi, O. S. (2000). The influence of topography and flow efficiency on the deposition of turbidites. PhD thesis. (United Kingdom): University of Leeds, 162.
Al Ja’aidi, O. S., Mccaffrey, W. D., and Kneller, B. C. (2004). Factors influencing the deposit geometry of experimental turbidity currents: implications for sand-body architecture in confined basins London. Spec. Publ.Spec. Publ. 222, 45–58. doi:10.1144/GSL.SP.2004.222.01.0
Alexander, J. (2008). “Bedforms in froude-supercritical flow: marine and river dune dynamics,” in Marine and river dune dynamics conference volume. (Brest: Leeds University), 1–5.
Alexander, J., and Morris, S. (1994). Observations on experimental, nonchannelized, high-concentration turbidity currents and variations in deposits around obstacles. J. Sediment. Res. 64 (4a), 899–909. doi:10.1306/D4267F00-2B26-11D7-8648000102C1865D
Allen, J. R. L. (1985). Principles of physical Sedimentology. London, United Kingdom: George Allen & Unwin, 272.
Allen, J. R. (1969). “Some recent advances in the physics of sedimentation,” in Proceedings of the Geologists’ Association, 80 (1), 1–IN4. doi:10.1016/S0016-7878(69)80016-7
Amy, L. A., kneller, B. c., and MCcaffrey, W. D. (2007). Facies architecture of the Gres de Peira Cava, SE France: landward stacking patterns in ponded turbiditic basins. J. Geol. Soc. 164, 143–162. doi:10.1144/0016-76492005-019
Amy, L. A., McCaffrey, W. D., and Kneller, B. C. (2004). The influence of a lateral basin-slope on the depositional patterns of natural and experimental turbidity currents. Geol. Soc. London Special Publ. 221, 311–330. doi:10.1144/GSL.SP.2004.221.01.17
Azpiroz-Zabala, M., Cartigny, M. J., Talling, P. J., Parsons, D. R., Sumner, E. J., Clare, M. A., et al. (2017). Newly recognized turbidity current structure can explain prolonged flushing of submarine canyons. Sci. Adv. 3, e1700200. doi:10.1126/sciadv.1700200
Baas, J. H., Kesteren, V., and Postma, W. G. (2004). Deposits of depletive high-density turbidity currents: a flume analogue of bed geometry, structure and texture. Sedimentology 51, 1053–1088. doi:10.1111/j.1365-3091.2004.00660.x
Bagnold, R. (1966). An approach to the sediment transport problem from general physics: U.S. Geological. Survey Profess. Paper 422, 1–I37. doi:10.3133/pp422I
Barker, S. P., Haughton, P. D., Mccaffrey, W. D., Archer, S. G., and Hakes, B. (2008). Development of rheological heterogeneity in clay-rich high-density turbidity currents: aptian Britannia Sandstone Member, UK continental shelf. J. Sediment. Res. 78 (2), 45–68. doi:10.2110/jsr.2008.014
Barton, M., O'byrne, C., Pirmez, C., Prather, B., Van Der Vlugt, F., Alpak, F. O., et al. (2010). Turbidite channel architecture: recognizing and quantifying the distribution of channel-base drapes using core and dipmeter data. AAPG Memoir. 92, 195–210. doi:10.1306/13181284M923289
Bell, D., Kane, I. A., Pontén, A. S., Flint, S. S., Hodgson, D. M., and Barrett, B. J. (2018b). Spatial variability in depositional reservoir quality of deep-water channel-fill and lobe deposits. Marine Petrol. Geol. 98, 97–115. doi:10.1016/j.marpetgeo.2018.07.023
Bell, D., Stevenson, C. J., Kane, I. A., Hodgson, D. M., and Poyatos-Moré, M. (2018a). Topographic controls on the development of contemporaneous but contrasting basin-floor depositional architectures. J. Sediment. Res. 88 (10), 1166–1189. doi:10.2110/jsr.2018.58
Bersezio, R., Felletti, F., and Micucci, L. (2005). Statistical analysis of stratal patterns and facies changes at the terminations of “turbiditic” sandstone bodies. The oligocene cengio unit (tertiary piedmont basin). Geoacta. 4, 83–104.
Brooks, H. L., Hodgson, D. M., Brunt, R. L., Peakall, J., Hofstra, M., and Flint, S. S. (2018). Deep-water channel-lobe transition zone dynamics: processes and depositional architecture, an example from the Karoo Basin, South Africa. Geol. Soc. Am. Bull. 130, 1723–1746. doi:10.1130/B31714.1
Brunt, R. L., Mcaffrey, W. D., and Kneller, B. C. (2004). Experimental modeling of the spatial distribution of grain size developed in a fill-and-spill mini-basin setting. J. Sediment. Res. 74, 438–446. doi:10.1306/093003740438
Bruschi, R., Bughi, S., Spinazzè, M., Torselletti, E., and Vitali, L. (2006). Impact of debris flows and turbidity currents on seafloor structures. Norwegian J. Geol. 86 (3), 317–336.
Bursik, M. I., and Woods, A. W. (2000). The effects of topography on sedimentation from particle-laden turbulent density currents. J. Sediment. Res. 70 (1), 53–63. doi:10.1306/2DC408FE-0E47-11D7-8643000102C1865D
Cantelli, A., Pirmez, C., Johnson, S., and Parker, G. (2011). Morphodynamic and stratigraphic evolution of self-channelized subaqueous fans emplaced by turbidity currents. J. Sediment. Res. 81, 233–247. doi:10.2110/jsr.2011.20
Carter, L., Gavey, R., Talling, P., and Liu, J. (2014). Insights into submarine geohazards from breaks in subsea telecommunication cables. Oceanography 27, 58–67. doi:10.5670/oceanog.2014.40
Cartigny, M. J., Eggenhuisen, J. T., Hansen, E. W., and Postma, G. (2013). Concentration-dependent flow stratification in experimental high-density turbidity currents and their relevance to turbidite facies models. J. Sediment. Res. 83, 1047–1065. doi:10.2110/jsr.2013.71
Cartigny, M. J., Ventra, D., Postma, G., and Van Den Berg, J. H. (2014). Morphodynamics and sedimentary structures of bedforms under supercritical-flow conditions: new insights from flume experiments. Sedimentology 61 (3), 712–748. doi:10.1111/sed.12076
Clarke, J. E. H. (2016). First wide-angle view of channelized turbidity currents links migrating cyclic steps to flow characteristics. Nat. Commun. 7, 11896. doi:10.1038/ncomms1189610.1038/ncomms11896
PubMed Abstract | CrossRef Full Text CrossRef Full Text | Google Scholar
Cossu, R., and Wells, M. G. (2012). A comparison of the shear stress distribution in the bottom boundary layer of experimental density and turbidity currents. Eur. J. Mech. B Fluid 32, 70–79. doi:10.1016/j.euromechflu.2011.09.006
Covault, J. A., Kostic, S., Paull, C. K., Sylvester, Z., and Fildani, A. (2017). Cyclic steps and related supercritical bedforms: building blocks of deep-water depositional systems, western North America. Mar. Geol. 393, 4–20. doi:10.1016/j.margeo.2016.12.009
Cullen, T. M., Collier, R. E. L., Gawthorpe, R. L., Hodgson, D. M., and Barrett, B. J. (2019). Axial and transverse deep-water sediment supply to syn-rift fault terraces: insights from the west xylokastro fault block, Gulf of corinth, Greece. Basin Res. 00, 1–35. doi:10.1111/bre.12416
Cumberpatch, Z., Kane, I. A., Soutter, E. L., Hodgson, D. M., Jackson, C. A. L., Kilhams, B., et al. (Forthcoming 2020). Interactions of deep-water gravity flows and active salt tectonics. J. Sediment. Res.
Curray, J. R., and Moore, D. G. (1971). Growth of the Bengal deep-sea fan and denudation in the Himalayas. Geol. Soc. Am. Bull. 82 (3), 563–572. doi:10.1130/0016-7606(1971)82[563:GOTBDF]2.0.CO;2
De Leeuw, J., Eggenhuisen, J. T., and Cartigny, M. J. B. (2016). Morphodynamics of submarine channel inception revealed by new experimental approach. Nat. Commun. 7, 10886. doi:10.1038/ncomms10886
De Leeuw, J., Eggenhuisen, J. T., Spychala, Y. T., Heijnen, M. S., Pohl, F., and Cartigny, M. J. (2018). Sediment volume and grain-size partitioning between submarine Channel− levee systems and lobes: an experimental study. J. Sediment. Res. 88, 777–794. doi:10.2110/jsr.2018.46
Deptuck, M. E., Piper, D. J., Savoye, B., and Gervais, A. (2008). Dimensions and architecture of late Pleistocene submarine lobes off the northern margin of East Corsica. Sedimentology 55 (4), 869–898. doi:10.1111/j.1365-3091.2007.00926.x
Dodd, T. J., Mccarthy, D. J., and Richards, P. C. (2018). A depositional model for deep-lacustrine, partially confined, turbidite fans: early Cretaceous, North Falkland Basin. Sedimentology 66, 53–80. doi:10.1111/sed.12483
Dorrell, R. M., Patacci, M., and McCaffrey, W. D. (2018). Inflation of ponded, particulate laden density currents. J. Sedimen. Res. 88 (11), 1276–1282. doi:10.2110/jsr.2018.65
Edwards, D. A., Leeder, M. R., Best, J. L., and Pantin, H. M. (1994). On experimental reflected density currents and the interpretation of certain turbidites. Sedimentology 41 (3), 437–461. doi:10.1111/j.1365-3091.1994.tb02005.x
Eggenhuisen, J. T., and Mccaffrey, W. D. (2012). The vertical turbulence structure of experimental turbidity currents encountering basal obstructions: implications for vertical suspended sediment distribution in non-equilibrium currents. Sedimentology 59, 1101–1120. doi:10.1111/j.1365-3091.2011.01297.x
Ericson, D. B., Ewing, M., and Heezen, B. C. (1952). Turbidity currents and sediments in north atlantic. AAPG Bull. 36 (3), 489–511. doi:10.1306/3D934415-16B1-11D7-8645000102C1865D
Farizan, A., Yaghoubi, S., Firoozabadi, B., and Afshin, H. (2019). Effect of an obstacle on the depositional behaviour of turbidity currents. J. Hydraul. Res. 57 (1), 75–89. doi:10.1080/00221686.2018.1459891
Ferguson, R. A., Kane, I. A., Eggenhuisen, J. T., Pohl, F., Tilston, M., Spychala, Y. T., et al. (2020). Entangled external and internal controls on submarine fan evolution: an experimental perspective. Depositional Record 6, 605–624. doi:10.1002/dep2.109
Fernandes, A. M., Buttles, J., and Mohrig, D. (2020). Flow substrate interactions in aggrading and degrading submarine channels. J. Sediment. Res. 90, 573–583. doi:10.2110/jsr.2020.31
Fildani, A., Normark, W. R., Kostic, S., and Parker, G. (2006). Channel formation by flow stripping: large-scale scour features along the Monterey East Channel and their relation to sediment waves. Sedimentology 53 (6), 1265–1287. doi:10.1111/j.1365-3091.2006.00812.x
Fuhrmann, A., Kane, I. A., Clare, M. A., Ferguson, R. A., Schomaker, E., Bonamini, E., et al. (2020). Hybrid turbidite-drift channel complexes: an integrated multiscale model. Geology 48, 562–568. doi:10.1130/G47179.1
Garcia, M., and Parker, G. (1989). Experiments on hydraulic jumps in turbidity currents near a canyon-fan transition. Science 245, 393–396. doi:10.1126/science.245.4916.393
Gee, M. J., Masson, D. G., Watts, A. B., and Mitchell, N. C. (2001). Passage of debris flows and turbidity currents through a topographic constriction: seafloor erosion and deflection of flow pathways. Sedimentology 48 (6), 1389–1409. doi:10.1046/j.1365-3091.2001.00427.x
Gorsline, D. S., and Emery, K. O. (1959). Turbidity-current deposits in san pedro and santa monica basins off southern California. Geol. Soc. Am. Bull. 70 (3), 279–290. doi:10.1130/0016-7606(1959)70[279:TDISPA]2.0.CO;2
Hage, S., Cartigny, M. J., Clare, M. A., Sumner, E. J., Vendettuoli, D., Clarke, J. E. H., et al. (2018). How to recognize crescentic bedforms formed by supercritical turbidity currents in the geologic record: insights from active submarine channels. Geol. 46, 563–566. doi:10.1130/G40095.1
Hamilton, P. B., Strom, K. B., and Hoyal, D. C. J. D. (2015). Hydraulic and sediment transport properties of autogenic avulsion cycles on submarine fans with supercritical distributaries. J. Geophys. Res. 120 (7), 1369–1389. doi:10.1002/2014JF003414
Hamilton, P., Gaillot, G., Strom, K., Fedele, J., and Hoyal, D. (2017). Linking hydraulic properties in supercritical submarine distributary channels to depositional-lobe geometry. J. Sediment. Res. 87 (9), 935–950. doi:10.2110/jsr.2017.53
Hansen, L. A. S., Hodgson, D. M., Pontén, A., Bell, D., and Flint, S. (2019). Quantification of basin-floor fan pinchouts: examples from the Karoo Basin, South Africa. Front. Earth Sci. 7, 12. doi:10.3389/feart.2019.00012
Harris, P. T., and Whiteway, T. (2011). Global distribution of large submarine canyons: geomorphic differences between active and passive continental margins. Mar. Geol. 285, 69–86. doi:10.1016/j.margeo.2011.05.008
Haughton, P. D. (1994). Deposits of deflected and ponded turbidity currents, Sorbas Basin, Southeast Spain. J. Sediment. Res. 64, 233–246. doi:10.1306/D4267D6B-2B26-11D7-8648000102C1865D
Heezen, B. C., Hollister, C. D., and Ruddiman, W. F. (1966). Shaping of the continental rise by deep geostrophic contour currents. Science 152, 502–508. doi:10.1126/science.152.3721.502
Hiscott, R. N. (1994). Loss of capacity, not competence, as the fundamental process governing deposition from turbidity currents. J. Sediment. Res. 64, 209–214. doi:10.2110/jsr.64.209
Howlett, D. M., Ge, Z., Nemec, W., Gawthorpe, R. L., Rotevatn, A., and Jackson, C. A. (2019). Response of unconfined turbidity current to deep-water fold and thrust belt topography: orthogonal incidence on solitary and segmented folds. Sedimentology. 66 (6), 2425–2454. doi:10.1111/sed.12602
Ingersoll, R. V., Dickinson, W. R., Graham, S. A., Chan, M. A., and Archer, A. W. (Forthcoming 2003). Remnant-ocean submarine fans: largest sedimentary systems on Earth. Special Papers–Geol. Soc. Am. 191–208. doi:10.1130/0-8137-2370-1.191
Jobe, Z. R., Sylvester, Z., Howes, N., Pirmez, C., Parker, A., Cantelli, A., et al. (2017). High-resolution, millennial-scale patterns of bed compensation on a sand-rich intraslope submarine fan, western Niger Delta slope, AAPG Bull. 129, 23–37. doi:10.1130/B31440.1
Joseph, P., and Lomas, S. A. (2004). “Deep-water sedimentation in the alpine Foreland Basin of SE France,” in New perspectives on the Grès d’Annot and related systems—an introduction. London, United Kingdom: Geological SocietySpecial Publications, 221, 1–16.
Kane, I. A., and Hodgson, D. M. (2011). Sedimentological criteria to differentiate submarine channel levee subenvironments: exhumed examples from the Rosario Fm. (Upper Cretaceous) of Baja California, Mexico, and the Fort Brown Fm. (Permian), Karoo basin, S. Africa. Mar. Petrol. Geol. 28 (3), 807–823. doi:10.1016/j.marpetgeo.2010.05.009
Kane, I. A., Mccaffrey, W. D., and Peakall, J. (2008). Controls on sinuosity evolution within submarine channels. Geol. 36, 287–290. doi:10.1130/G24588A.1
Kane, I. A., Pontén, A. S., Vangdal, B., Eggenhuisen, J. T., Hodgson, D. M., and Spychala, Y. T. (2017). The stratigraphic record and processes of turbidity current transformation across deep-marine lobes. Sedimentology 64 (5), 1236–1273. doi:10.1111/sed.12346
Khripounoff, A., Vangriesheim, A., Babonneau, N., Crassous, P., Dennielou, B., and Savoye, B. (2003). Direct observation of intense turbidity current activity in the Zaire submarine valley at 4000 m water depth. Mar. Geol. 194, 151–158. doi:10.1016/S0025-3227(02)00677-1
Kneller, B. (1995). Beyond the turbidite paradigm: physical models for deposition of turbidites and their implications for reservoir prediction. Geol. Soc. 94 (1), 31–49. doi:10.1144/GSL.SP.1995.094.01.04
Kneller, B., and Buckee, C. (2000). The structure and fluid mechanics of turbidity currents: a review of some recent studies and their geological implications. Sedimentology 47, 62–94. doi:10.1046/j.1365-3091.2000.047s1062.x
Kneller, B. C., Edwards, D., Mccaffrey, W. D., and Moore, R. (1991). Oblique reflection of turbidity currents. Geol. 19, 250–252. doi:10.1130/0091-7613(1991)019<0250:OROTC>2.3.CO;2
Kneller, B. C., and Mccaffrey, W. D. (1999). Depositional effects of flow non-uniformity and stratification within turbidity currents approaching a bounding slope: deflection, reflection and facies variation, J. Sediment. Res. 69, 980–991. doi:10.2110/jsr.69.980
Kneller, B. C., and McCaffrey, W. D. (1995). Modelling the effects of salt-induced topography on deposition from turbidity currents. SEPM Soc. Sediment. Geol., 137–145. doi:10.5724/gcs.95.16.0137
Komar, P. D. (1971). Hydraulic jumps in turbidity currents, Geol. Soc. Am. Bull. 82 (6), 1477–1488. doi:10.1130/0016-7606(1971)82[1477:HJITC]2.0.CO;2
Kostic, S., and Parker, G. (2006). The response of turbidity currents to a canyon-fan transition: internal hydraulic jumps and depositional signatures. J. Hydraul. Res. 44 (5), 631–653. doi:10.1080/00221686.2006.9521713
Kubo, Y. S. (2004). Experimental and numerical study of topographic effects on deposition from two-dimensional, particle-driven density currents, Sediment. Geol. 164, 311–326. doi:10.1016/j.sedgeo.2003.11.002
Kuenen, P. H., and Migliorini, C. I. (1950). Turbidity currents as a cause of graded bedding, J. Geol. 58 (2), 91–127. doi:10.1086/625710
Lamb, M. P., Hickson, T., Marr, J. G., Sheets, B., Paola, C., and Parker, G. (2004). Surging versus continuous turbidity currents: flow dynamics and deposits in an experimental intraslope minibasin, J. Sediment. Res. 74 (1), 148–155. doi:10.1306/062103740148
Lamb, M. P., Parsons, J. D., Mullenbach, B. L., Finlayson, D. P., Orange, D. L., and Nittrouer, C. A. (2008). Evidence for superelevation, channel incision, and formation of cyclic steps by turbidity currents in Eel Canyon, California. Geol. Soc. Am. Bull. 120, 463–475. doi:10.1130/B26184.1
Launder, B. E., and Rodi, W. (1983). The turbulent wall jet measurements and modelling. Annu. Rev. Fluid Mech. 15, 429–459. doi:10.1146/annurev.fl.15.010183.002241
Lee, S. E., Amy, L. A., and Talling, P. J. (2004). The character and origin of thick base-of-slope sandstone units of the Peïra Cava outlier, SE France. Geol. Soc. 221, 331–347. doi:10.1144/GSL.SP.2004.221.01.18
Lee, S. E., Talling, P. J., Ernst, G. G., and Hogg, A. J. (2002). Occurrence and origin of submarine plunge pools at the base of the US continental slope. Mar. Geol. 185 (3–4), 363–377. doi:10.1016/S0025-3227(01)00298-5
Leeder, M. R. (1982). Sedimentology, process and product. London, United Kingdom: George Allen and Unwin Publishers, 344.
Lomas, S. A., and Joseph, P. Confined turbidite systems. London, United Kingdom: Geological Society Special Publications, 222, 1–7.
Lucente, C. C. (2004). Topography and palaeogeographic evolution of a middle Miocene foredeep basin plain (Northern Apennines, Italy). Sediment. Geol. 170, 107–134. doi:10.1016/j.sedgeo.2004.06.002
Luthi, S. (1981). Experiments on non-channelized turbidity currents and their deposits. Mar. Geol. 40, M59–M68. doi:10.1016/0025-3227(81)90139-0
Maier, K. L., Roland, E. C., Walton, M. A., Conrad, J. E., Brothers, D. S., Dartnell, P., et al. (2018). The tectonically controlled san gabriel channel–lobe transition zone, catalina basin, southern California borderland. J. Sediment. Res. 88, 942–959. doi:10.2110/jsr.2018.50
McCaffrey, W. D., and Kneller, B. C. (2001). Process controls on the development of stratigraphic trap potential on the margins of confined turbidite systems and aids to reservoir evaluation. AAPG Bull. 85, 971–988. doi:10.1306/8626CA41-173B-11D7-8645000102C1865D
Meiburg, E., and Kneller, B. (2010). Turbidity currents and their deposits. Annu. Rev. Fluid Mech. 42, 135–156. doi:10.1146/annurev-fluid-121108-145618
Middleton, G. V., and Southard, J. B. (1984). Mechanics of sediment movement. SEPM Soc. Sediment. Geol. 3, 401. doi:10.2110/scn.84.03
Mohrig, D., and Buttles, J. (2007). Deep turbidity currents in shallow channels. Geol. 35, 155–158. doi:10.1130/G22716A.1
Morley, C. K., and Leong, L. C. (2008). Evolution of deep-water synkinematic sedimentation in a piggyback basin, determined from three-dimensional seismic reflection data. Geosphere 4, 939–962. doi:10.1130/GES00148.1
Muck, M. T., and Underwood, M. B. (1990). Upslope flow of turbidity currents: a comparison among field observations, theory, and laboratory models. Geol. 18, 54–57. doi:10.1130/0091-7613(1990)018<0054:UFOTCA>2.3.CO;2
Mulder, T., and Alexander, T. (2001). The physical character of submarine density flows and their deposits. Sedimentology 48, 269–301. doi:10.1046/j.1365-3091.2001.00360.x
Normark, W. R., Piper, D. J. W., and Stow, D. A. V. (1983). Quaternary Development of channels, levees, and lobes on middle Laurentian Fan. AAPG Bull. 67, 1400–1409. doi:10.1306/03B5BA33-16D1-11D7-8645000102C1865D
Oshaghi, M. R., Afshin, H., and Firoozabadi, B. (2013). Experimental investigation of the effect of obstacles on the behavior of turbidity currents. Can. J. Civ. Eng. 40 (4), 343–352. doi:10.13140/2.1.2117.5362
Paull, C. K., Talling, P. J., Maier, K. L., Parsons, D., Xu, J., Caress, D. W., et al. (2018). Powerful turbidity currents driven by dense basal layers. Nat. Commun. 9 (1), 4114. doi:10.1038/s41467-018-06254-6
Peakall, J., Ashworth, P., and Best, J. (1996). “Physical modelling in fluvial geomorphology: principles, applications and unresolved issues,” in The Scientific Nature of Geomorphology: proceedings of the 27th Binghamton symposium, September 27–29, 1996. Editors B. Rhoads, and C. Thorn (Hoboken, NJ: Wiley and Sons Ltd), Chap. 9, 221–253.
Pettinga, L., Jobe, Z., Shumaker, L., and Howes, N. (2018). Morphometric scaling relationships in submarine channel–lobe systems. Geol. 46, 819–822. doi:10.1130/G45142.1
Pohl, F. (2019). Turbidity currents and their deposits in abrupt morphological transition zones. PhD thesis. Utreacht (NL): UU Dept. of Earth Sciences, 210.
Pohl, F., Eggenhuisen, J., Cartigny, M., Tilston, M., De Leeuw, J., and Hermidas, N. (2019b). The influence of a slope break on turbidite deposits: an experimental investigation. Mar. Geol. 424, 106160. doi:10.1016/j.margeo.2020.106160
Pohl, F., Eggenhuisen, J. T., Tilston, M., and Cartigny, M. J. B. (2019a). New flow relaxation mechanism explains scour fields at the end of submarine channels. Nat. Commun. 10 (1), 1–8. doi:10.1038/s41467-019-12389-x
Postma, G., and Cartigny, M. J. (2014). Supercritical and subcritical turbidity currents and their deposits—a synthesis. Geol. 42 (11), 987–990. doi:10.1130/G35957.1
Postma, G., Kleverlaan, K., and Cartigny, M. J. (2014). Recognition of cyclic steps in sandy and gravelly turbidite sequences, and consequences for the Bouma facies model. Sedimentology 61 (7), 2268–2290. doi:10.1111/sed.12135
Prather, B. E. (2003). Controls on reservoir distribution, architecture and stratigraphic trapping in slope settings. Mar. Petrol. Geol. 20, 529–545. doi:10.1016/j.marpetgeo.2003.03.009
Prather, B. E., Booth, J. R., Steffens, G. S., and Craig, P. A. (1998). Classification, lithologic calibration, and stratigraphic succession of seismic facies of intraslope basins, deep-water Gulf of Mexico. AAPG Bull. 82 (5), 701–728. doi:10.1306/1D9BC5D9-172D-11D7-8645000102C1865D
Prélat, A., Covault, J. A., Hodgson, D. M., Fildani, A., and Flint, S. S. (2010). Intrinsic controls on the range of volumes, morphologies, and dimensions of submarine lobes. Sediment. Geol. 232 (1–2), 66–76. doi:10.1016/j.sedgeo.2010.09.010
Prélat, A., Hodgson, D. M., and Flint, S. S. (2009). Evolution, architecture and hierarchy of distributary deep-water deposits: a high-resolution outcrop investigation from the Permian Karoo Basin, South Africa. Sedimentology 56, 2132–2154. doi:10.1111/j.1365-3091.2009.01073.x
Rowland, J. C., Hilley, G. E., and Fildani, A. (2010). A test of initiation of submarine leveed channels by deposition alone. J. Sediment. Res. 80, 710–727. doi:10.2110/jsr.2010.067
Saller, A., Werner, K., Sugiaman, F., Cebastiant, A., May, R., Glenn, D., et al. (2008). Characteristics of Pleistocene deep-water fan lobes and their application to an upper Miocene reservoir model, offshore East Kalimantan, Indonesia. AAPG Bull. 92, 919–949. doi:10.1306/03310807110
Schnyder, J. S., Eberli, G. P., Betzler, C., Wunsch, M., Lindhorst, S., Schiebel, L., et al. (2018). Morphometric analysis of plunge pools and sediment wave fields along western Great Bahama Bank. Mar. Geol. 397, 15–28. doi:10.1016/j.margeo.2017.11.020
Sequeiros, O. E. (2012). Estimating turbidity current conditions from channel morphology: a Froude number approach. J. Geophys. Res. 117, 4003S. doi:10.1029/2011JC007201
Shields, A. (1936). Anwendung der Aehnlichkeitsmechanik und der Turbulenzforschung auf die 369 Geschiebebewegung. PhD Thesis. Berlin (Germany): Technical University Berlin.
Sinclair, H. D. (1994). The influence of lateral basinal slopes on turbidite sedimentation in the Annot sandstones of SE France. J. Sediment. Res. 64 (1a), 42–54. doi:10.1306/D4267CFD-2B26-11D7-8648000102C1865D
Sinclair, H. D., and Tomasso, M. (2002). Depositional evolution of confined turbidite basins. J. Sediment. Res. 451–456, 72. doi:10.1306/111501720451
Smith, G., Rowley, P., Williams, R., Giordano, G., Trolese, M., Silleni, A., et al. (2020). A bedform phase diagram for dense granular currents. Nat. Commun. 11, 1–11. doi:10.1038/s41467-020-16657-z
Smith, R. (2004). Turbidite systems influenced by structurally induced topography in the multi-sourced Welsh Basin. Geol. Soc. 222 (1), 209–228. doi:10.1144/GSL.SP.2004.222.01.11
Soutter, E. L., Kane, I. A., Fuhrmann, A., Cumberpatch, Z. A., and And Huuse, M. (2019). The stratigraphic evolution of onlap in clastic deep-water systems: autogenic modulation of allogenic signals. J. Sediment. Res. 89, 890–917. doi:10.2110/jsr.2019.49
Spychala, Y., Eggenhuisen, J., Tilston, M., and Pohl, F. (2020). The influence of basin settings and flow properties on the dimensions of submarine lobe elements. Sedimentology. in press. doi:10.1111/sed.12751
Spychala, Y. T., Hodgson, D. M., Prélat, A., Kane, I. A., Flint, S. S., and Mountney, N. P. (2017). Frontal and lateral submarine lobe fringes: comparing sedimentary facies, architecture and flow processes. J. Sedim. Res. 87 (1), 75–96. doi:10.2110/jsr.2017.2
Stanley, D. G. (1963). Vertical petrographic variability in Annot sandstone turbidites; some preliminary observations and generalizations. J. Sediment. Res. 33 (3), 783–788. doi:10.1306/74D70F2E-2B21-11D7-8648000102C1865D
Stevenson, C. J., and Peakall, J. (2010). Effects of topography on lofting gravity flows: implications for the deposition of deep-water massive sands. Mar. Petrol. Geol. 27 (7), 1366–1378. doi:10.1016/j.marpetgeo.2010.03.010
Sumner, E. J., Peakall, J., Parsons, D. R., Wynn, R. B., Darby, S. E., Dorrell, R. M., et al. (2013). First direct measurements of hydraulic jumps in an active submarine density current. Geophys. Res. Lett. 40, 5904–5908. doi:10.1002/2013GL057862
Symons, W. O., Sumner, E. J., Paull, C. K., Cartigny, M. J., Xu, J. P., Maier, K. L., et al. (2017). A new model for turbidity current behavior based on integration of flow monitoring and precision coring in a submarine canyon. Geol. 45, 367–370. doi:10.1130/G38764.1
Talling, P. J., Paull, C. K., and Piper, D. J. (2013). How are subaqueous sediment density flows triggered, what is their internal structure and how does it evolve? Direct observations from monitoring of active flows. Earth Sci. Rev. 125, 244–287. doi:10.1016/j.earscirev.2013.07.005
Tomasso, M., and Sinclair, H. D. (2004). Deep-water sedimentation on an evolving fault-block: the Braux and st benoit outcrops of the gres d’AnnotLondon. Geol. Soc. London Spec. Publ. 221, 267–283. doi:10.1144/GSL.SP.2004.221.01.14
Twichell, D., Nelson, C. H., Kenyon, N., Schwab, W., Kneller, B., Martinsen, O. J., et al. (2009). The influence of external processes on the Holocene evolution of the Mississippi Fan. External controls on deep-water depositional systems. SEPM Spec. Publ. 92, 145–157. doi:10.2110/sepmsp.092
Van Andel, T. H., and Komar, P. D. (1969). Ponded sediments of the mid-atlantic ridge between 22 and 23 north latitude. Geol. Soc. Am. Bull. 80, 1163–1190. doi:10.1130/0016-7606(1969)80[1163:PSOTMR]2.0.CO;2
Van Rijn, L. (1984). 1984, Sediment transport, part 2: suspended load transport. J. Hydraul. Eng. 110, 110. doi:10.1061/(ASCE)0733-9429 (1984)110:11(1613)
Van Rijn, L. C. (1993). Principles of sediment transport in rivers, estuaries and coastal seas. Amsterdam: Aqua Publications, 1200.
Vinnels, J. S., Butler, R. W., Mccaffrey, W. D., and Paton, D. A. (2010). Depositional processes across the Sinú accretionary prism, offshore Colombia. Mar. Petrol. Geol. 27 (4), 794–809. doi:10.1016/j.marpetgeo.2009.12.008
Weill, P., Lajeunesse, E., Devauchelle, O., Métiver, F., Limare, A., Chauveau, B., et al. (2014). Experimental investigation on self-channelized erosive gravity current. J. Sediment. Res. 84, 487498. doi:10.2110/jsr.2014.41
Xu, J. P. (2010). Normalized velocity profiles of field-measured turbidity currents. Geol. 38 (6), 563–566. doi:10.1130/G30582.1
Keywords: turbidity current, experimental, physical models, seafloor topography, confined basins, supercritical
Citation: Soutter EL, Bell D, Cumberpatch ZA, Ferguson RA, Spychala YT, Kane IA and Eggenhuisen JT (2021) The Influence of Confining Topography Orientation on Experimental Turbidity Currents and Geological Implications. Front. Earth Sci. 8:540633. doi: 10.3389/feart.2020.540633
Received: 05 March 2020; Accepted: 16 November 2020;
Published: 08 January 2021.
Edited by:
Rosa Poggiani, Amanda Owen, University of Glasgow, United KingdomReviewed by:
Christopher Stevenson, University of Liverpool, United KingdomKathryn Jane Amos, University of Adelaide, Australia
Anne Bernhardt, Freie Universität Berlin, Germany
Copyright © 2021 Soutter, Bell, Cumberpatch, Ferguson, Spychala, Kane and Eggenhuisen. This is an open-access article distributed under the terms of the Creative Commons Attribution License (CC BY). The use, distribution or reproduction in other forums is permitted, provided the original author(s) and the copyright owner(s) are credited and that the original publication in this journal is cited, in accordance with accepted academic practice. No use, distribution or reproduction is permitted which does not comply with these terms.
*Correspondence: Euan L. Soutter, euan.soutter@manchester.ac.uk
†Present addresses: Daniel Bell, Department of Geoscience, University of Calgary, Calgary, AB, Canada
Yvonne Spychala, Institut für Geologie, Leibniz Universität, Hannover, Germany