Quantification of Stemflow in Three Isolated Shrub Species in an Urban Environment
 Emma Rakestraw
 Stefan Jacobson
 Patrick L. Gurian
 Franco A. Montalto
- Department of Civil, Architectural, and Environmental Engineering, Drexel University, Philadelphia, PA, United States
As precipitation falls on to vegetation, it is partitioned into throughfall, vapor, and stemflow. The stemflow component is frequently neglected in water budgeting for trees and shrubs due to its presumed small volume and limited research. Studies of stemflow in shrub species are especially rare. This study focuses on stemflow in shrubs and specifically examines its relationship to plant morphology and meteorological factors. Two individuals of three species, Prunus laurocerasus (common name “Otto Luyken”), Hydrangea quercifolia (common name “Alice”), and Itea virginica (common name “Little Henry”), were studied in an outdoor experiment in Philadelphia, PA during the 2015 growing season. Stemflow was collected using aluminum collars which had been attached to individual branches of each plant. Vinyl tubing conveyed the stemflow from the collars into collection bottles which were weighed after rain events. To relate stemflow to plant morphology, the vertical projected canopy area of each collared branch, branch attachment angle, stem circumference, and direction of collar were evaluated. To relate stemflow to meteorological conditions, the research also quantified rain depth, rain intensity, rain event duration, wind speed, wind direction, temperature, relative humidity, gust speed, and date and time of storm. The importance of each of these independent variables were studied using a forward stepwise linear regression. Stemflow averaged 7.6% of total incident rainfall on the canopy area of the monitored stems, with values ranging from 0 to 58% by branch and storm event. Species-specific averages were found to be 11.4, 7.0, and 4.4% for P. laurocerasus, H. quercifolia, and I. virginica, respectively. The results suggest a significant variation in stemflow by species. Statistical analysis determined that between 55 and 79% of the observed variation in stemflow can be explained by the regression model variables and gust speed and projected canopy area were determined to be significant across all regression models. Stemflow rates appear to be impacted by both inter-plant and local climate factors; however, additional research is needed to further refine the understanding of stem flow and canopy water budgeting.
Introduction
Precipitation falling on vegetation canopies is partitioned into throughfall, vapor and stemflow. The stemflow component is frequently neglected in water budgeting for trees and shrubs due to its presumed small volume. However, because it is preferentially directed to the plant basal area, stemflow can cause soil erosion, facilitate evapotranspiration, and enrich the soil with nutrients originally deposited onto leaf surfaces. The volume of stemflow per unit basal area divided by rainfall is known as the funneling ratio, and values as large as 30 have been observed in the field. Researchers have underscored the importance of stemflow quantification (André et al., 2008), and specifically its relationship to meteorological conditions and plant canopy structure (Levia and Germer, 2015).
Most of the historical stemflow research has been conducted on trees, typically using collars fashioned from different materials that are wrapped around trunks in a spiral. The collars are typically sealed to the trunk surface with silicone caulking and connected to a collection vessel for measurement. Polyethylene plastic tubing is a common collar as the tubing can easily be cut in half and spiraled around the tree to allow for water collection (Farmer et al., 1991; Marin et al., 2000; Liu et al., 2002). Other studies fashioned a similar collar using vinyl sheeting (Levia and Herwitz, 2005; Levia et al., 2010). Neoprene has also been utilized as well as flexible polyurethane foam board to allow for growth of trees (André et al., 2008; Murakami, 2009). Stemflow is usually collected in plastic containers for weighing and chemical analysis (Farmer et al., 1991; Silva and Rodriguez, 2001; Liu et al., 2002; Levia and Herwitz, 2005; Murakami, 2009).
There is much less research on stemflow in shrubs, and greater variability in the methodology used for its quantification. Some studies have used a polyethylene funnel and silicone sealant for collection (Whitford et al., 1997; Li et al., 2008), as is common in tree studies. Others used double impermeable rings or folded aluminum foil plates (Garcia-Estringana et al., 2010; Zhang et al., 2013). In some cases, stems were specially prepared prior to the experiments, for example with fine sandpaper used to roughen the stem and/or to remove new growth from the lower 10 cm of the plant (Garcia-Estringana et al., 2010; Zhang et al., 2013). On shrubs with many stems, a random selection of only several stems for measurement is common (Whitford et al., 1997).
Stemflow is typically represented as a depth or a percentage of rainfall on the canopy. Studies using both natural and simulated rainfall have been undertaken. Recent literature reports stemflow ranges of 1.41–11.73% for trees (Bellot and Escarre, 1998), 2.2–26.4% for shrubs (Li et al., 2008), and 0.98–8.37% for mixed species landscapes (Návar, 2011). Among shrubs, Caragana korshinkskii stemflow was found to average 0.88 mm, accounting for 8.8% of incident rainfall, while Artemisia ordosica stemflow averaged 0.29 mm, or 2.8% of total rainfall (Zhang et al., 2013). When six Larrea tridentate were studied over the course of 18 rain events, stemflow averaged 16.8 ± 1.9% (Whitford et al., 1997). Stemflow coefficient values for Tamaulipan thorn-shrub forests were found to be >1 (Návar, 2011). Using a rain simulator in an arid climate, stemflow for Flourensia cernua ranged from 4 to 45% of total rainfall (Mauchamp and Janeau, 1993). It was found that lower rainfall intensities yielded a higher percentage stemflow. A similar study using a rainfall simulator found that stemflow ranged from 3.8 to 26.4% over nine species of shrubs and had an average of 16% (Garcia-Estringana et al., 2010). The greater range in reported stemflow in shrubs could be due to greater variation in their shape, size and branching patterns (compared to trees), or to the wider range of measurement approaches utilized in the shrub studies.
Relatively little is known about how shrub stemflow relates to meteorological conditions. Wind speed, for example, can either increase or decrease the amount of stemflow, while the direction of wind may change the distribution of stemflow throughout the plant depending on location and orientation. A study of tree observed that wind-driven rainfall can significantly impact measured rates (Van Stan et al., 2011), with greater stemflow at one site associated with predominant wind directions from east to north-northeast. Measured stemflow has also been compared to rainfall intensity. Li et al. (2008) measured stemflow from Reaumuria songorica in China, finding a positive correlation between rainfall and stemflow when rainfall intensities were below 2 mm/h. The converse was true for intensities greater than this 2 mm/h threshold.
The relationship between stemflow and plant morphology has also not been extensively studied. One study found that the vertical depth of canopy impacted stemflow. Trees with large vertical canopy depths, including the American Beech, had greater stemflow than those with shallower canopies, such as the yellow poplar (Van Stan et al., 2011). Another study reported that projected canopy area, plant area index, and stem diameter were important factors for certain shrubs but not for others (Zhang et al., 2017).
This study seeks to fill in some of these research gaps by relating measured stemflow from three different shrub species with local meteorological and morphological conditions, in an outdoor experiment under natural rainfall conditions. Collars were installed on select branches to provide a range of canopy areas, branch circumferences, and leaf attachment angles. A weather station was also installed onsite, to correlate each stemflow measurement with meteorological conditions. The independent variables included: date of event, time of event, collar direction, gust speed, wind speed, wind direction, temperature, relative humidity, event duration, event intensity, event volume, branch angle, branch circumference, and projected branch area. Eight forward stepwise linear regression models were used to identify the strongest predictors of stemflow for each species, and for a pooled set of all the collected data. To our knowledge, this is the first study to investigate stemflow in these particular species, and to investigate leaf attachment angle as a possible stemflow predictor.
Methods
Location and Shrub Species
The study site was a protected outdoor location at the intersection of 32nd and Winter Streets (39.959942, −75.187523) in Philadelphia, PA. Three different species were used in this study: Prunus laurocerasus “Otto Luyken,” Hydrangea quercifolia “Alice,” and Itea virginica “Little Henry.” A top view of each of these species is shown in Figure 1. These species were chosen for the study because of their prevalence in municipal green infrastructure projects in Philadelphia (PWD, 2019) and throughout much of the northeast United States. Two individuals of each species were studied. Individuals were received in 11.3 L pots, except the P. laurocerasus which were in 26.5 L pots. H. quercifolia were replanted in 26.5 L pots shortly after purchasing to ensure they remained healthy.
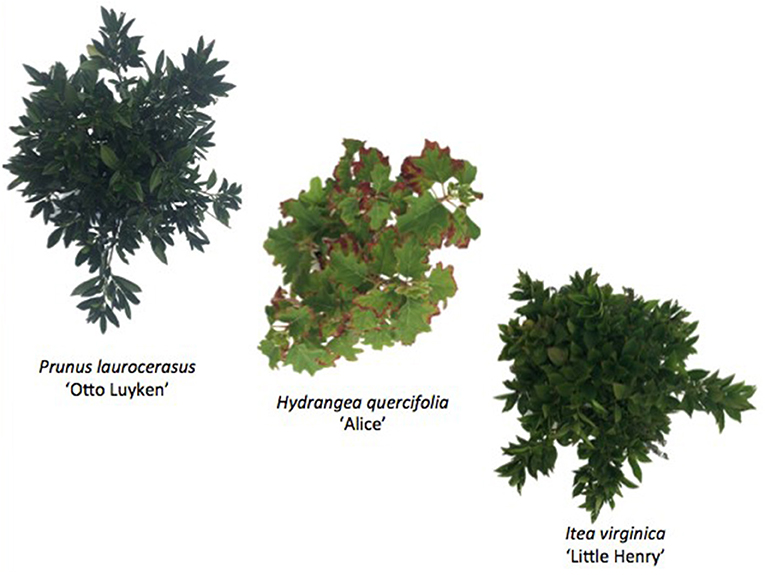
Figure 1. Species studied.
Design Setup
For a full description of the setup, see Rakestraw (2016). Stemflow collection collars were created on select branches of each individual. Branches were selected to provide a range of angles, circumferences, and projected canopy areas, as described above. A total of 17 branches were collared during this study. There were six collars on P. laurocerasus, five collars on H. quercifolia, and six collars on I. virginica. Collars were not installed on every branch of each individual so the study does not represent stemflow of the entire plant.
Each collar was fabricated with heavy-duty aluminum foil and reinforced with 18-gauge aluminum wire. Vinyl tubing with a 0.6-centimeter outer diameter was secured to each stem using construction adhesive. Each tube was notched in a “V” shape so that it was flush against the branch when attached. The aluminum collar was fabricated around the tube to fit each branch. The outside of the collar was then wrapped in a spiral of aluminum wire and sealed inside and out with construction adhesive. The vinyl tube was fed into a plastic bottle through a hole drilled in the cap. The sealant was also used to waterproof the opening in the cap. The bottles were kept upright around the pots using mildew resistant rope that was tied around the pot and bottles as seen in Figure 2.
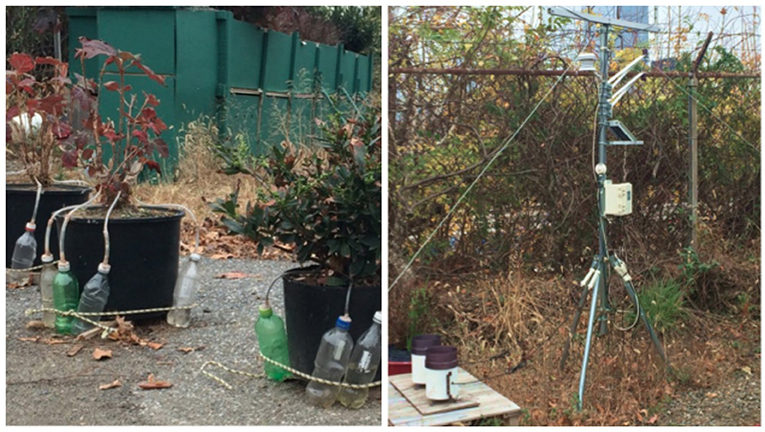
Figure 2. Stemflow collection system (left) and HOBO® weather station (right).
Data Collection
Individual rain events were defined using an inter-event dry period of 12 h for expedience in monitoring. After a rain event, each collection bottle was weighed and replaced with a dry counterpart. The dry tare weigh of each bottle was subtracted from the total weight to determine the weight of event stemflow.
Incident atmospheric precipitation was measured on site with bottles linked to conical collection surfaces meeting World Meteorological Organization standards for rainwater measurement (Technical Regulations, Volume I: General Meteorological Standards and Recommended Practices, 2015). The HOBO® weather station was purchased from ONSET (Cape Cod, MA). ONSET's HOBO® included an onsite tipping bucket which provided backup rain data. It also provided wind direction, gust speed, wind speed, temperature, and relative humidity. This data was available for most of the study period. However, meteorological data was not available due to instrumentation problems for several rainfall events. In these cases, stemflow amounts were included in the averages but not in the regression analysis.
Data Analysis
The projected canopy area of each branch was needed to convert the weight of stemflow to depth. This projected canopy area is the surface that a droplet hits, or the area looking straight down on the plant. To determine these areas, digital photos were taken of the top view of each plant. Photos were taken of both the whole individual, as well as each specific collared branch. To minimize the amount of noise in the background of the photo, white paper was arranged to cover the pot and ground under the plant prior to taking the photo. For images showing the area of one collared branch, white cloth was used to cover sections of the plant that did not contribute to flow at the collar of interest. A reference 5 by 5 cm square was held flat and at the same height as the widest part of the plant for use in scaling the digital image.
ImageJ software, a java-based image processing software developed by the National Institutes of Health (NIH), was used to set the image scale, using the reference square to establish an area for each image pixel. Next, the background of the photo was manually deleted using the “Threshold Color” feature of the software. The photo type was then changed from 24 to 8 bit and the “adjust” and “threshold” features were used to fill in the total area with red. Finally, the “analyze” feature was used to output both the area as an Excel file and a mask of the plant. The mask shows a black and white image of the pixels that were included in the area calculation. The results were checked to ensure that no background noise was included in the area calculation. A second validation step involved verifying that the reference square area was reported correctly. Figure 3 is an example of a raw and processed image.
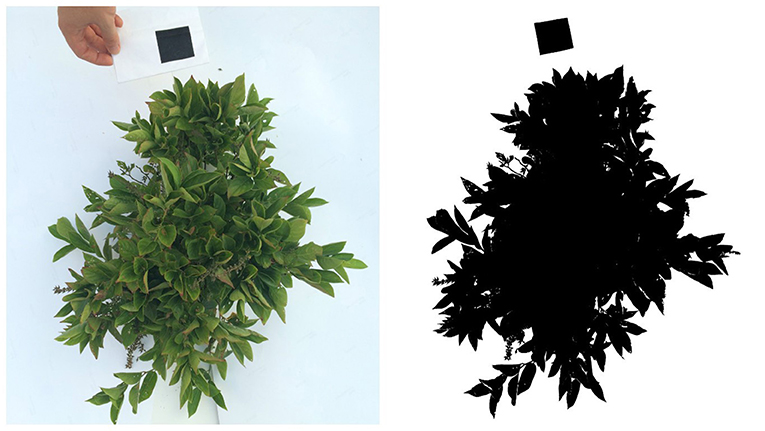
Figure 3. Image area analysis, original image (left) and processed image (right).
The projected canopy area of each branch was monitored three times over the course of the growing season. The second measurement, made on July 27th, was used as the baseline. Canopy areas for P. laurocerasus, H. quercifolia, and I. virginica were found to vary ±9, 16, and 30 percent, from the baseline values, respectively. The variation in canopy area is the net impact over time of factors, such as growth and loss of leaves.
Once the area of each branch was determined, measured stemflow values were converted from grams to millimeters using Equation (1). The same procedure was used to convert the mass of precipitation to a depth but using the rainfall collection area in place of the canopy projection. Percent stemflow, defined by the amount of incident rainfall that became stemflow, was calculated per Equation (2).
Equation (1)—Weight to Depth Equation
Equation (2)—Percent Stemflow Equation
Data specific to each precipitation event and the collared branches themselves was compiled. The circumference of each collared branch was determined by wrapping string around the branch directly above the collar. If the top of the collar had two branches entering the collar, the measurement from the larger branch was used. Branch angle was also determined for each collared branch. Photos taken parallel to the ground at collar height were processed in ImageJ to calculate the angle of each branch. The average leaf attachment for each species was determined by taking the average attachment angle of five representative leaves from each species. Also determined was the cardinal direction of each collar. These were defined as N, S, E, W, NE, NW, SE, and SW. Precipitation, gust speed, wind speed, wind direction, temperature, and relative humidity were provided by the weather station.
Using SPSS statistical software, a forward stepwise linear regression approach was used to determine which characteristics were significant predictors of stemflow. The final models include only variables that are statistically significant (p-value < 0.10) in predicting the dependent variable: stemflow. The full list of independent variables included: date of event, time of event, collar direction, gust speed, wind speed, wind direction, temperature, relative humidity, event duration, event intensity, event volume, branch angle, branch circumference, and projected branch area.
Eight model options (Table 1) were created by varying whether stemflow was expressed as a percent or as a volume, if stemflow data was log-transformed, and if the independent variables were log-transformed. All eight models used an alpha value of 0.1 to give a 90 percent confidence interval. The optimal model was chosen for each data set based on the R2 value, the fit of the observed vs. expected line, and the homoscedasticity scatter plot. Precise comparisons cannot be made between models with differing dependent variables.
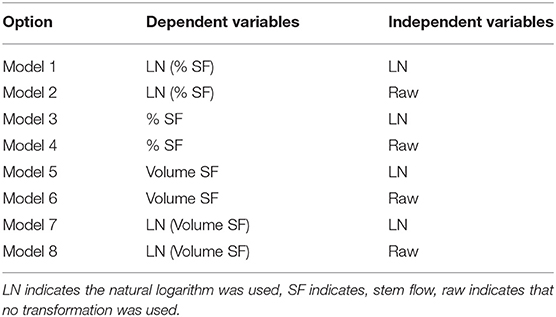
Table 1. Model options.
The eight model variations were performed on four different data sets. The first three data sets were species-specific stemflow measurements whereas the fourth was the pooled set of data from all plants. The optimal models were selected via forward stepwise linear regression for each dataset. The independent variables that were included in the final iteration of the regression procedure are all statistically significant determinants of stemflow.
Results
A total of 25 rain events occurring between June 6th, 2015 to October 10th, 2015 were included in the analysis varying from 0.75 to 60.16 mm. The average storm depth was 19.25 mm and the median depth was 14.05 mm.
Stemflow is first presented as a percent per branch for each rain event, as shown in Figure 4. Over the 25 rain events studied, the average stemflow of the six P. laurocerasus branches was 11.4%, with a maximum value on one branch during one storm as high as 54.0%. H. quercifolia had an average stemflow of 7.0% and a maximum value of 57.6%. I. virginica had an average of 4.4% stemflow and a maximum of 27.7%.
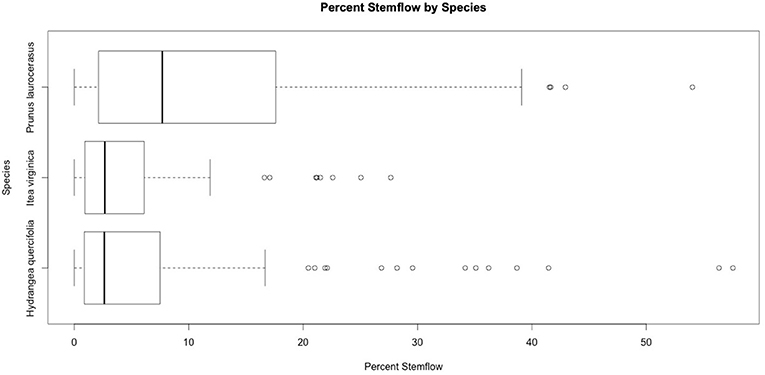
Figure 4. Percent stemflow in individual branches in each event.
A significant association between total rainfall and stemflow was not found, with the highest R2 being 0.43 in H. quercifolia during large events. However, the statistical analysis indicated that other factors were significantly associated with stemflow.
The statistical analysis suggests that for all four data sets, the best fit model used the natural log of stemflow volume. Regarding the independent variables, the P. laurocerasus, H. quercifolia, and pooled data sets yielded the best results when the independent variables were not transformed (model 8), while the I. virginica model was optimized when the independent variables were natural log-transformed (model 7). Residuals for all of the best fit models were reasonably close to a normal distribution (Rakestraw, 2016).
Table 2 presents the final results of the statistical analysis. The P. laurocerasus dataset had an R2 value of 0.78. This model included branch circumference, gust speed, collar direction, relative humidity, temperature, branch angle, and aerial branch area as the statistically significant variables. H. quercifolia's R2 value was 0.55 and included branch circumference, gust speed, relative humidty, aerial branch area, total volume, and date. I. virginica yielded an R2 value of 0.79 with the natural log of gust speed, wind speed, total volume, branch area, wind direction, event intensity, collar direction and date. The pooled data set had an R2 value of 0.57 and included branch circumference, gust speed, species, relative humidity, aerial branch area, and date.
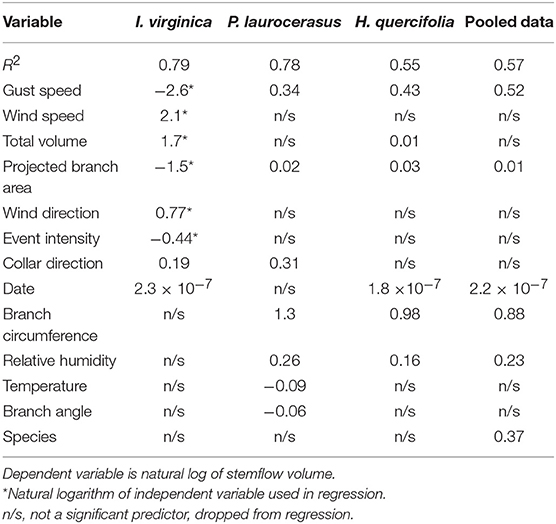
Table 2. Regression models.
Discussion
Stemflow values differed significantly by species but all fell within the range typically reported for other shrub species: 2.2–26.4% (Li et al., 2008; Garcia-Estringana et al., 2010; Zhang et al., 2013). The stemflow averages across the sampling period were compared with that of other species for which published stemflow data is available. Figure 5 shows the results of the three species measured here along with stemflow values from the literature. As evidenced by the figure, stemflow varies greatly among species.
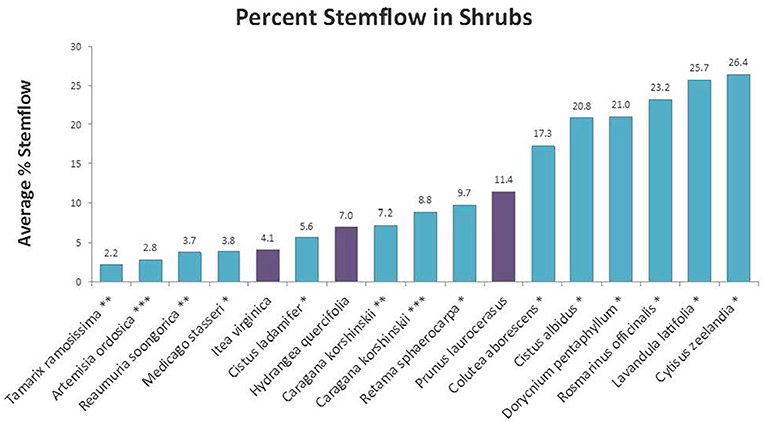
Figure 5. Determined percent stemflow compared to other species (Sources: *Garcia-Estringana et al., 2010; **Li et al., 2008; ***Zhang et al., 2013).
This study has several limitations. The use of R2 to compare models with differing dependent variables is useful a qualitative indicator but not a rigorous metric. A cross-validation approach would have been preferable had a sufficient sample size been available. The study also did not have a sufficient number of replicates to rigorously differentiate variability within a species from variability between species, as only two exemplars of each species could be used. While model results suggest significant species differences, these effects could be due to random variability among the exemplars chosen.
Each model did not result in the same combination of variables being significant when predicting stemflow. Gust speed and projected branch area were found to be significant in the best fit model for all four datasets. Branch circumference, relative humidity and event date were significant in three of the four datasets. Collar orientation and total rain were significant in the regression models for two of the four data sets.
Branch circumference and projected area may be positively associated with the ability to adhere large volumes of water and avoid the formation of droplets that fall directly to the ground. This finding would agree with results of a previous study which illustrates that above-ground biomass is a significant predictor for stemflow yield (Zhang et al., 2013). Collar direction was significant for two of the models whereas attachment angle was not significant for any model. One possible explanation is that the attachment angle, for smaller light shrubs in particular, is dynamic during storm events. Wind and water weight may impact this over the course of the event. Its dynamic nature could make it difficult to accurately quantify on a small time-scale and therefore not likely a great predictor variable.
Relative humidity seemed to be positive correlated with stemflow. A high relative humidity will diminish evaporation rates and may leave more water available for stemflow; however, there is little previous work on stemflow regarding relative humidity to validate these findings. This study may be the first to use relative humidity as a predictor for stemflow as similar studies were not found for comparative purposes.
Gust speed is interesting as it was positively associated with stemflow in three datasets but negatively associated in the fourth dataset, I. virginica. The positive association in three datasets may be due to the ability of wind to drive water from leaves to the stem, preventing a fully saturated canopy. When drops land on a fully saturated canopy, they may cause an abrupt overflow of the leaf that results in water falling to the ground rather than adhering to the stem as it flows downward.
In the I. virginica dataset, gust speed has a negative effect, but this is also unique in that wind speed emerged as a significant variable. It may be that wind speed and wind gust speed are positively correlated. A high but steady wind might be most favorable for stem flow as it would push water out of the leaves but not so forcefully as to directly drop to the ground. Conditional on a given wind speed, gusts might have a negative effect on stemflow as gusts could cause a direct fall to the ground, bypassing the stem.
Van Stan et al. (2011) found that wind speed and direction were important factors influencing stemflow generation in wind-driven rain events for two species of trees at a forest study site. This study found gust speed to be an important influencer; however, wind direction was not significant for two of the shrubs and the pooled-data set. Perhaps for small, light-weight shrubs at a fairly exposed site, wind direction is less important as they will be easily disturbed by wind regardless of the prevailing direction. This could suggest wind is an important determinant of stemflow generation but the relationship is highly dynamic and dependent on local climate conditions, plant structure and morphology and surrounding terrain.
Conclusion
This study determined that stemflow averaged 11.4, 7.0, and 4.4% for P. laurocerasus, H. quercifolia, and I. virginica, respectively. A significant difference in stemflow was observed between studied species and between 55 and 79% of stemflow can be statistically explained by the examined independent variables including both plant and climate characteristics. Good predictors of stemflow varied from species to species with gust speed and projected branch area being the only significant variables for all four optimal regression models. Additional research is recommended to better understand the dependence of stemflow on plant morphology and meteorological conditions.
For three of the models, there may have been insufficient information to fully parameterize both effects, particularly given a possible correlation in wind speed and gust speed. This could result in the positive effect of wind being associated with wind gust speed rather than wind speed. Larger sample sizes of plant species and more rain events would add confidence to the findings. Additionally, issues with collinearity between the studied plants could be more closely examined.
Future Work
Future studies should look for additional variables that may impact stemflow and isolate variables to help determine the impact of each variable on stemflow. Possible considerations include the leaf area index of each individual, age of the individual, protection from stresses including insects and sunscald, potted vs. planted installations and microclimate differences including temperature, humidity, shading and wind exposure. All of these factors could potentially impact stemflow yield.
Author Contributions
ER conducted the study, analyzed the data, and drafted the manuscript. FM directly supervised ER throughout the project. FM also reviewed and commented on the draft manuscript. PG advised ER on data analysis methods. PG also reviewed and commented on the draft manuscript. SJ reviewed the literature, compared results from literature with results of this study, and assisted with interpretation of results.
Funding
This work was partially supported by National Oceanic and Atmospheric Administration's grant NA15OAR4310147 to the Center for Climate Risk in the Urban Northeast.
Conflict of Interest
The authors declare that the research was conducted in the absence of any commercial or financial relationships that could be construed as a potential conflict of interest.
References
André, F., Jonard, M., and Ponette, Q. (2008). Effects of biological and meteorological factors on stemflow chemistry within a temperate mixed oak–beech stand. Sci. Total Environ. 393, 72–83. doi: 10.1016/j.scitotenv.2007.12.002
Bellot, J., and Escarre, A. (1998). Stemflow and throughfall determination in a resprouted mediterranean holm-oak forest. Ann. For. Sci. 55, 847–865. doi: 10.1051/forest:19980708
Farmer, A. M., Bates, J. W., and Bell, J. N. B. (1991). Seasonal variations in acidic pollutant inputs and their effects on the chemistry of stemflow, bark and epiphyte tissues in three oak woodlands in N.W. Britain. New Phytol. 118, 441–451. doi: 10.1111/j.1469-8137.1991.tb00026.x
Garcia-Estringana, P., Alonso-Blázquez, N., and Alegre, J. (2010). Water storage capacity, stemflow and water funneling in mediterranean shrubs. J. Hydrol. 389, 363–372. doi: 10.1016/j.jhydrol.2010.06.017
Levia, D. F., and Germer, S. (2015). A review of stemflow generation dynamics and stemflow-environment interactions in forests and shrublands. Rev. Geophys. 53, 673–714. doi: 10.1002/2015RG000479
Levia, D. F., and Herwitz, S. R. (2005). Interspecific variation of bark water storage capacity of three deciduous tree species in relation to stemflow yield and solute flux to forest soils. Catena 64, 117–137. doi: 10.1016/j.catena.2005.08.001
Levia, D. F., Van Stan, J. T., Mage, S. M., and Kelley-Hauske, P. W. (2010). Temporal variability of stemflow volume in a beech-yellow poplar forest in relation to tree species and size. J. Hydrol. 380, 112–120. doi: 10.1016/j.jhydrol.2009.10.028
Li, X.-Y., Liu, L.-Y., Gao, S.-Y., Ma, Y.-J., and Yang, Z.-P. (2008). Stemflow in three shrubs and its effect on soil water enhancement in semiarid loess region of China. Agric. Forest Meteorol. 148, 1501–1507. doi: 10.1016/j.agrformet.2008.05.003
Liu, W., Fox, J. E. D., and Xu, Z. (2002). Nutrient fluxes in bulk precipitation, throughfall and stemflow in montane subtropical moist forest on Ailao Mountains in Yunnan, South-west China. J. Trop. Ecol. 18, 527–548. doi: 10.1017/S0266467402002353
Marin, C. T., Bouten, W., and Sevink, J. (2000). Gross rainfall and its partitioning into throughfall, stemflow and evaporation of intercepted water in four forest ecosystems in Western Amazonia. J. Hydrol. 237, 40–57. doi: 10.1016/S0022-1694(00)00301-2
Mauchamp, A., and Janeau, J. L. (1993). Water funneling by the crown of Flourensia Cernua, a Chihuahuan Desert Shrub. J. Arid Environ. 25, 299–306. doi: 10.1006/jare.1993.1062
Murakami, S. (2009). Abrupt changes in annual stemflow with growth in a young stand of Japanese cypress. Hydrol. Res. Lett. 3, 32–35. doi: 10.3178/hrl.3.32
Návar, J. (2011). Stemflow variation in Mexico's Northeastern Forest Communities: its contribution to soil moisture content and aquifer recharge. J. Hydrol. 408, 35–42. doi: 10.1016/j.jhydrol.2011.07.006
PWD (2019) Field Inspector's Plant Manual. Available online at: http://www.phillywatersheds.org/what_were_doing/community_partnerships/programs/soak-it-adoption/green-stormwater-tools/plants-we-use
Rakestraw, E. (2016). Quantification of stemflow in three isolated shrub species in an urban environment. (Masters thesis). Department of Civil, Architectural, and Environmental Engineering, Drexel University. Available online at: https://idea.library.drexel.edu/islandora/object/idea%3A6907 (accessed September 19, 2019).
Silva, I. C., and Rodriguez, H. G. (2001). Interception loss, throughfall and stemflow chemistry in pine and oak forests in Northeastern Mexico. Tree Physiol. 21, 1009–1013. doi: 10.1093/treephys/21.12-13.1009
Van Stan, J. T., Siegert, C. M., Levia, D. F., and Scheick, C. E. (2011). Effects of wind-driven rainfall on stemflow generation between two codominant tree species with differing crown characteristics. Agricult. For. Meteorol. 151, 1277–1286. doi: 10.1016/j.agrformet.2011.05.008
Whitford, W. G., Anderson, J., and Rice, P. M. (1997). Stemflow contribution to the ‘fertile Island’ effect in Creosotebush, Larrea tridentata?. J. Arid Environ. 35, 451–457. doi: 10.1006/jare.1996.0164
Zhang, Y.-F., Wang, X.-P., Hu, R., Pan, Y.-X., and Zhang, H. (2013). Stemflow in two xerophytic shrubs and its significance to soil water and nutrient enrichment. Ecol. Res. 28, 567–579. doi: 10.1007/s11284-013-1046-9
Keywords: green infrastructure, stemflow, shrubs, P. laurocerasus, H. quercifolia, I. virginica
Citation: Rakestraw E, Jacobson S, Gurian PL and Montalto FA (2019) Quantification of Stemflow in Three Isolated Shrub Species in an Urban Environment. Front. Built Environ. 5:110. doi: 10.3389/fbuil.2019.00110
Received: 08 January 2018; Accepted: 30 August 2019;
Published: 01 October 2019.
Edited by:
Wouter Buytaert, Imperial College London, United KingdomReviewed by:
John T. Van Stan, Georgia Southern University, United StatesIzuru Takewaki, Kyoto University, Japan
Copyright © 2019 Rakestraw, Jacobson, Gurian and Montalto. This is an open-access article distributed under the terms of the Creative Commons Attribution License (CC BY). The use, distribution or reproduction in other forums is permitted, provided the original author(s) and the copyright owner(s) are credited and that the original publication in this journal is cited, in accordance with accepted academic practice. No use, distribution or reproduction is permitted which does not comply with these terms.
*Correspondence: Patrick L. Gurian, pgurian@drexel.edu