
Housing Market Recovery Index Highlights – Week Ending March 6
- The realtor.com Housing Market Recovery Index reached 101.6 nationwide, up 0.5 points compared to the previous week.
- The ‘housing supply’ component of our index increased by 0.3 points over the previous week, improving marginally but still the lowest recovery indicator in our index.
- The overall recovery index is showing the greatest recovery in Austin, Denver, Riverside, Portland, and Phoenix.
Download the full Housing Market Recovery Index dataset here.
National Recovery Trends
On March 11, one year will have passed since the World Health Organization declared COVID-19 a pandemic. Close to one year after this announcement, the housing market continues to display its resiliency, as the realtor.com Market Recovery Index reached 101.6 points nationwide this past week, 0.5 points higher than the previous week and 1.6 points above pre-pandemic, early 2020 benchmarks. This edition of our Housing Market Recovery Index will mark the final week of our regular tracking of housing trends compared to pre-pandemic baselines, as the housing market continues to further normalize and the end of the pandemic is just on the horizon. This week, we take a look back at how the pandemic has changed the housing market over the past year and where it stands today.
Looking Back: How COVID-19 Impacted the Housing Market
Following the announcement of the pandemic in the spring of 2020, we saw housing activity slow to a crawl, as local measures to curb the pandemic limited home buying and selling activity. In early April, online home shopping activity pulled back, as the number of home shoppers searching online declined by 4% on a year-over-year basis. During this time, sellers paused plans to list their homes, and newly listed homes fell by as much as 47% on a year-over-year basis in April. With waning buyer demand, homes that happened to already be listed spent more time on the market in the spring, and the days on market measure peaked to 30% greater than the previous year in May. With less demand, home listing price growth decelerated and came close to declining on a year-over-year basis in mid-April when price growth reached 0.3%.
Last Summer’s Surprising Housing Market Recovery
In the summer of 2020, the economy began a slow recovery after hitting bottom, and as policy-makers gradually gained a better understanding of COVID-19, social distancing measures became more targeted and less broad. Additionally, the real estate industry and consumers adapted to get better at doing business in a socially-distant way. After the initial housing market tumble, homebuyer demand reappeared and surged, as homebuyers looked to take advantage of lower interest rates and the ability to move to larger, more affordable homes and locations as they worked from home. Online home shoppers also made heavy use of remote-features such as virtual and 3D tours in lieu of visiting all prospective homes in person. By May, the number of shoppers searching online on realtor.com rebounded to 37% higher than the previous year. This surge in demand developed into a surprisingly competitive fall and winter homebuying season.
During this time, sellers continued to stand on the sidelines, with new listings failing to recover consistently until late October. The surge in buyer demand and lack of inventory resulted in homes being scooped up increasingly more quickly. The time a typical property spends on the market decreased by as much as 21% on a year-over-year basis in October. Listing price growth rebounded and consistently grew throughout this time. In August, they reached double-digit growth for the first time since late 2017. During this time, we saw housing demand increase in areas across the country, but suburban markets became hotter than their urban counterparts as homebuyers searched for more space away from crowded urban centers. We also saw demand for vacation homes increase. In particular, we noticed snowbirds in northeastern metros becoming increasingly interested in ski towns, which saw sales surge this past summer.
Bouncing Back from Political Unrest and Severe Winter Weather
In early January, political unrest captured the nation’s attention and this was reflected through a dip in online home shopping growth and another decline in the growth of new listings after a near recovery last fall. Just when the market began to gear up once again, a series of extreme winter storms hit cities across the country, stalling the housing market in areas that were most impacted, especially including Texan metros which faced wide-spread blackouts and water-access issues in addition to freezing temperatures. The year-over-year growth rate in newly listed homes fell during the months of January and February compared to last fall and December, and hasn’t significantly recovered since.
Looking forward to spring, a dearth of newly listed homes but strong homebuyer demand has led to a tight, quickly moving housing market with home listing prices continuing to grow at double-digit rates compared to last year. More recently, rising interest rates have notably decelerated growth in mortgage applications. While still higher than last year, the year-over-year growth rate in purchase mortgage applications has declined from 15% year-over-year several weeks ago, to just 1% year-over-year this past week. This signals a potential rebalancing of the housing market, as rising rates cool demand. If more sellers or more new construction can also improve the inventory crunch over the coming months, this spring may see an easing of the tight market conditions present since last summer.
| Week ending 3/6 | Current
Index |
w/w Change | |
| Overall Housing Recovery Index | 101.6 | +0.5 | |
| Housing Demand Growth Index | 116.8 | -1.0 | |
| Listing Price Growth Index | 110.6 | +0.3 | |
| New Supply Growth Index | 81.4 | +0.3 | |
| Pace of Sales Index | 107.5 | +1.3 |
The ‘housing demand’ component decreased to 116.8 this past week, down 1.0 points compared to the previous week. While the housing demand component registered a small decrease this past week, it remains 16.8 points above last year’s pre-COVID baseline, and it remains the most-recovered measure in our index. However, demand has decelerated slightly in recent weeks and further increases in home shopping activity are likely to be limited by a low supply of existing homes and shifting mortgage rates, which have begun to inch higher.
The ‘home price’ component remained fairly stable, at 110.6 points this past week, well above the pre-COVID baseline and 0.3 points above the previous week. With inventory failing to see visible improvement and buyer demand remaining elevated, asking prices continue to tick up to record levels.
The ‘pace of sales’ component – which tracks differences in the time-on-market of the inventory of homes – held above the pre-COVID baseline at 107.5, and is 1.3 points higher than the previous week. Homes are continuing to sell more quickly than before the pandemic as homebuyer demand holds steady.
The ‘housing supply’ component – which tracks the growth of new listings – has improved by 0.3 points this past week, to 81.4. The housing supply component of the index continues to be least recovered, remaining 18.6 points below the pre-COVID baseline. The continuing lack of new listings indicates that urgency on the behalf of sellers remains lower than that of buyers.
LOCAL TRENDS
This week, the recovery index of western and southern metros dipped on average, by 0.9 points and 1.0 points, respectively. While western metros continue to register the highest recovery scores in general, this week’s dip was fueled by a slowdown in the pace of new listings, which had until recently been much higher in metros such as San Jose and San Francisco. The supply measure in the West dropped by 4.7 points over the previous week. Despite this, demand remained strong, increasing by 2.4 points over the previous week. The dip in southern metros was also driven by the supply component, which decreased 7.3 points over the previous week. Meanwhile, the Midwest and Northeast rose by 1.3 points and 0.4 points, respectively. Both of these regions saw the pace of newly listed homes improve over the previous week.
| Region | Avg Recovery Index
(week ending 3/6) |
w/w Change | |
| West | 115.3 | -0.9 | |
| Midwest | 98.0 | +1.3 | |
| Northeast | 98.5 | +0.4 | |
| South | 102.6 | -1.0 |
32 of 50 Largest Markets Above Recovery Benchmark
Locally, a total of 32 markets have remained above the recovery benchmark, three more than the previous week. Eighteen markets now remain below the recovery pace, at least temporarily. The overall recovery index is showing the greatest recovery in Austin, Denver, Riverside, Portland, and Phoenix.
In the ‘housing demand’ component, 43 of the 50 largest markets are still positioned above the recovery trend, one more than the previous week, as buyer demand remains strong. The most recovered markets for home-buying interest are all southern metros: Tampa, Miami, Orlando, Houston, and Baltimore, with a housing demand growth index between 146 and 179.
In the ‘home price’ component, 34 of the 50 largest markets seeing growth in asking prices surpass the pre-COVID baseline, two less than the previous week. The most recovered markets for home prices include Austin, Buffalo, Atlanta, Richmond, and Detroit, with a home price growth index between 115 and 139.
In the ‘pace of sales’ component, 42 of the 50 largest markets are now seeing the time on market index surpass the pre-COVID baseline, five more than the previous week. The most recovered markets for time-on-market include Riverside, Denver, Phoenix, Los Angeles, and Austin, with a pace of sales growth index between 147 and 162.
In the ‘housing supply’ component, only 9 of the 50 largest markets saw the new listings index remain above the January 2020 baseline, one less than the previous week. The markets which are seeing newly listed homes grow most quickly compared to baseline are San Jose, Denver, San Francisco, Los Angeles, and San Diego, with a new listings growth index between 108 and 124. The markets seeing newly listed homes declining most compared to baseline include Chicago, Hartford, Raleigh, Virginia Beach, and Oklahoma City, with a new listings growth index of 55 to 61.
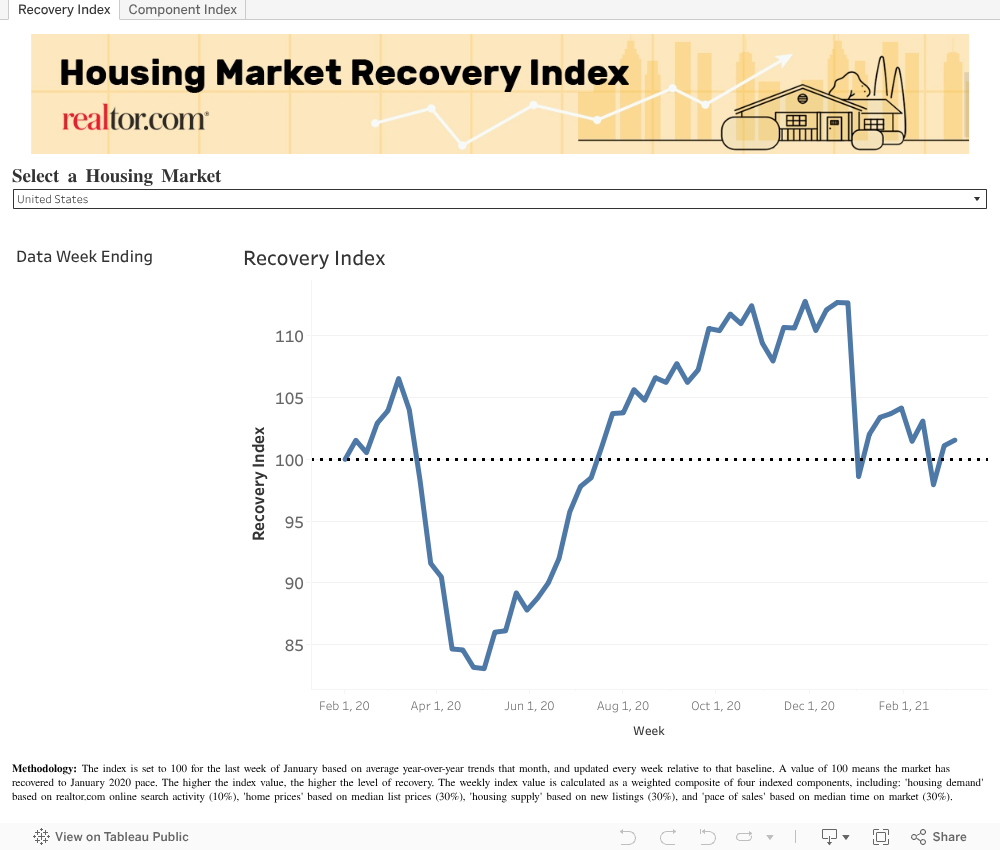
How to read the index – the overall index is set to 100 for the last week of January based on average year-over-year trends that month, and updated every week relative to that baseline. A value of 100 means the market has recovered to January 2020 pace. The higher the index value, the higher the level of recovery. The lower the index value, the lower the level of recovery.
Subscribe to our mailing list to receive monthly updates and notifications on the latest data and research.