


Abstract
This article investigates the spatial evolution of the Italian motorcycle industry during the period 1893–1993. We find strong support for the heritage theory of Klepper, even after controlling for agglomeration economies. However, we find also a positive effect of being located in the Motor Valley cluster in Emilia Romagna on the survival rate of motorcycle firms. Interestingly, this beneficial effect is stronger in the Emilia Romagna cluster than elsewhere. This might indicate the importance of a favorable local institutional environment, as propagated by the Emilian district literature.
1. Introduction
The work of Klepper and colleagues challenged the traditional cluster literature, suggesting that Marshallian externalities play no or a minor role in the agglomeration process of an industry (Klepper, 2002a, b, 2007, 2009, 2011; Buenstorf and Klepper, 2009). Based on the empirical investigation of a disparate set of industries that are strongly concentrated in space (e.g. automobiles in Detroit, tires in Akron, and semiconductors in Silicon Valley), they argued that the spin-off process is the main driver of the formation of an industrial cluster. These studies show that geographically concentrated industries grow thanks to the presence of a few successful early entrants (e.g. Olds Motor Works in Detroit and Fairchild in Silicon Valley), which give birth to a disproportionate number of spin-offs. These spin-offs tend to locate close to their parents and become successful by inheriting the superior routines of their parents.
The heritage theory of Klepper has influenced how economic geographers look at industrial clusters and their dynamics. This literature has provided robust evidence showing the key role of organizational reproduction and routine inheritance in the formation and success of industrial clusters. However, as pointed out in recent reappraisals of Klepper’s work, the heritage theory is not necessarily incompatible with the Marshallian externality theory (Boschma, 2015; Cusmano et al., 2015). For example, Klepper (2007) recognized that spin-offs, besides inheriting superior capabilities from their parents, are more capable of taking advantages of local externalities and therefore outperform other firms. And although Klepper’s work fundamentally challenged the idea that culture and institutions matter in explaining the success of clusters like the Silicon Valley, Klepper (2009) also did not exclude the possibility that institutions can play a role. He argued that the presence of relational capital or social networks, which are well-known levies of financial and knowledge capital, can influence the spin-off’s decision to locate nearby its parent. Some recent studies show that once institutions are included in the Klepper’s spin-off framework, significant differences across countries appear (Menzel and Kammer, 2012).
The aim of this article is twofold. First, we empirically address the question if the heritage theory is compatible with a Marshallian theory of industrial clusters in the context of the Italian motorcycle industry. This is an interesting industry, as it shares features with the automobile sector investigated by Klepper. We test whether our findings of the survival of motorcycle firms support the heritage theory, the Marshallian theory, or both. Second, we assess the possible role of local institutions for the spatial clustering of an industry. The Italian motorcycle industry is concentrated in the Motor Valley in the Emilia Romagna region, whose economy is populated by a type of industrial agglomerations known as “neo-Marshallian industrial districts” (Becattini, 1990). Cusmano et al. (2015) argued that the typical Italian district is characterized by a “social milieu (that) provides relevant knowledge about market opportunities and access to resources that can benefit a broader group of would-be entrepreneurs” (p. 15), besides spin-offs. We test the claim of the Italian industrial district literature, and the Emilian district model in particular (Brusco, 1982), whether the combination of flexible specialization with cultural and social proximity generated a favorable environment for entrepreneurial activities and knowledge sharing that enhanced the survival of Italian motorcycle firms, irrespective of the background of the entrepreneur.
The article is organized as follows. In Section 2, we present the theoretical arguments of the two competing approaches: heritage theory and Marshallian agglomeration economies. This section also discusses the peculiarity of the Emilian district model. Section 3 presents the data, variables, and methods used in the empirical analysis. Section 4 discusses the empirical findings of the survival analysis. Section 5 concludes.
2. Heritage theory versus agglomeration theory
The heritage theory of Klepper identifies the spin-off process as the main mechanism of knowledge/routine transmission. The key idea is that the set of capabilities of a new venture is strongly shaped by the working experience of the founder; that is, the background of a founder strongly influences the success of a start-up. In this framework, the spin-off process is interpreted as an evolutionary mechanism of knowledge transmission between parents and offsprings (i.e. spin-offs; Nelson and Winter, 1982), whereby founders of new ventures inherit the competences and skills they have acquired during their previous work experience in the parent company that is either active in the same industry or a related industry. From this, it follows that a prospective spin-off working at a parent with successful routines will acquire superior skills, which can be applied and replicated in the new venture. A central tenet in this literature is that successful firms generate more spin-offs, which are also more successful on average (Klepper and Sleeper, 2005). Therefore, according to Klepper (2010), the higher performance of firms in clusters, as compared with firms outside clusters, does not descend from the benefits of local externalities, but rather from the inherited routines these firms possess at the time of entry. This implies that the tendency of an industry to agglomerate is driven by the spin-off process, as spin-offs’ founders tend to locate close to their parents. The growth of a cluster happens when one or more early outstanding entrants (like Fairchild in Silicon Valley) spur many successful local spin-offs. Although agglomeration forces can play a role in attracting firms to a cluster, it is the inheritance of successful routines from the parent that explains the performance of the spin-off, according to Klepper.
The heritage theory goes against the seminal work of Marshall (1920) stating that the geographical concentration of economic activities should be understood essentially in terms of agglomeration economies. The core of this approach suggests that industries tend to concentrate in space due to the presence of scale economies that are external to the firm but internal to a bounded geographical area. The co-location of a pool of specialized workers, along with a specialized local market of suppliers, generates pecuniary externalities. Geographically proximate firms can access these at lower costs than firms outside such agglomerations. Agglomerations can also favor knowledge spillovers (Audretsch and Feldman, 1996; Maskell and Malmberg, 1999)1: firms and workers can match their (often idiosyncratic) characteristics and disseminate knowledge via labor mobility (Breschi and Lissoni, 2009), imitation (Maskell, 2001), user–producer interactions (Lundvall, 1992), and informal know-how bartering (von Hippel, 1987). The fast and wide circulation of tacit knowledge among co-located “narrow version” of localization economies when it concerns externalities derived from co-located firms in the same industry, whereas the “extended version” of localization economies, or “related externalities” (Neffke et al., 2011a), would include the co-location of firms from sectors related to the principal industry. Urbanization economies arise from the size and diversity of an urban economic structure and the availability of a wide range of collective goods (e.g. educational infrastructure), so it is the advantage of being located in a densely populated area, where many different industries and services are also present (Jacobs, 1969). In sum, the Marshallian agglomeration thesis claims that firms will benefit from agglomeration economies by simply being co-located.
So, the heritage theory of Klepper and the agglomeration theory of Marshall provide alternative explanations for why firms might do well in clusters. Empirical studies show a mixture of findings (Boschma, 2015; Frenken et al., 2015). Some studies found support for Klepper’s heritage theory, like the UK car industry (Boschma and Wenting, 2007), the Dutch publishing industry (Heebels and Boschma, 2011), and the German machine tool industry (Buenstorf and Guenther, 2011). Other empirical works found also evidence of agglomeration economies, though not always positively. A positive effect of localization economies was found in the plastic injection molds industry (Costa and Baptista, 2011) and the global video game industry (De Vaan et al., 2013), whereas Boschma and Wenting (2007) found negative effects of clustering on survival in the UK car industry. This negative effect shows that spatial clustering may turn into an obstacle for further agglomeration if firms perceive tight local competition and have to bear high local costs such as labor and land costs as a result of agglomeration. This is in line with studies showing that firms’ survival is negatively affected by increasing local density, meaning a higher number of firms in the same industry in a location (Sorenson and Audia, 2000; Staber, 2001; Cattani et al., 2003; Wezel, 2005).
Though providing alternative explanations for spatial clustering, the heritage theory is not necessarily incompatible with the Marshallian externality theory (Boschma, 2015; Cusmano et al., 2015). First, Boschma and Frenken (2003) stated the possibility that spin-off activity induces spatial clustering at the formative stage of an industry, after which Marshallian externalities support the further growth of the cluster (positive externalities), or set in a process of decline (negative externalities). Second, Klepper himself indicated that agglomeration economies could still play some role in explaining why spin-offs locate in clusters (Klepper, 2007: 629). More than that, he did not discard completely (though he did not test it empirically) that the superior performance of spin-offs in a cluster (as opposed to those outside clusters) is compatible with the Marshallian externality argument. Klepper recognized that spin-offs, besides inheriting superior capabilities from their parents, are outperforming other firms because these firms are more capable of taking advantages of local externalities. In his words, “it is possible that agglomeration economies in the Detroit area were significant but only benefitted spin-offs, perhaps because only they had suitable pre-entry backgrounds to benefit from agglomeration economies. It is hard to rule out such a theory…” (Klepper, 2007: 629).
What has been understudied in this Klepperian framework so far is the explicit recognition that local institutions may play a crucial force in making industries agglomerate, or not, in certain places. There are some studies that have focused on this particular point. Wenting and Frenken (2011) suggested that cultural factors are important to explain why ready-to-wear businesses in the fashion industry did not take off in Paris after WWII. Menzel and Kammer (2012) showed that national institutional factors could explain the success of the Danish wind industry in terms of firm survival, as compared with the US. Cusmano et al. (2015), examining a typical Marshallian industrial district in Italy, found that spin-offs did not outperform other local firms in the district and suggested that non-spin-off firms may have benefited from local institutional factors. But there are few studies to date that take local institutions on board when analyzing spatial clustering of an industry in a Klepperian framework.
Interestingly, the Italian industrial district literature (or at least part of that literature) has made a connection between Marshallian external economies and the importance of institutional factors to explain spatial clustering of industries (Piore and Sabel, 1984; Bellandi, 1989; Becattini, 1990; Harrison, 1992; Markusen, 1996; Hart, 2009; Loasby, 2009). In the historical experiences of industrial districts, which are characterized by thick institutions of governance, density is associated with embeddedness and cooperation that enhance (instead of lowering) the survival of firms. The presence of thick institutions and specialized organizations contributes to the supply of local “collective goods,” such as vocational training education, R&D centers, technical and financial services, and institutions of governance, which reduce uncertainty and transaction costs and lower the entry barriers for new enterprises. Moreover, cooperation, informal know-how sharing, and the ease of doing business are enhanced by a shared common culture, which is advocated as a quintessential feature of industrial districts (Dei Ottati, 2002; Becattini et al., 2009). These characteristics have featured prominently in Italian industrial districts, whose competitiveness is explained in terms of Marshallian industrial atmosphere and good governance (Pyke et al., 1990).
The industrial districts of Emilia Romagna, with well-known examples like ceramic tiles in Sassuolo and packaging machinery and motorcycles in Bologna, have been regarded as a paradigmatic case (Bianchi and Gualtieri, 1990). They are part of the so-called Emilian model, as popularized by the work of Brusco (1982): a socioeconomic model of territorial development combining flexible specialization with social cohesion and high quality of government (Amin, 1999). This model emerged in the early 19th century, when socialist ideas diffused in the urban and rural areas of the region, which soon led to the creation of cooperatives of workers and artisanal associations. These organized groups of workers, along with some progressive entrepreneurs, initiated several technical and vocational schools, which soon spread around in urban areas and contributed to the formation of a sizable class of technicians and a scientific culture (Capecchi, 1990: 23). Rural areas were characterized by share-cropping and proto-industrial activities in which many agricultural workers set up small entrepreneurial farming businesses. After WWII, the entrepreneurial climate was strongly supported by new local political elites that were dominated by the local communist party. Members of the party were present in trade unions, association of artisans, cooperatives, and farming associations, which, according to Capecchi (1990) “…became extremely important centres of economic power, and served as bases for training in business and in the management of small enterprises” (p. 28). This coalition of entrepreneurs, workers, and politicians generated a cohesive and progressive political community, which contributed to the diffusion of an entrepreneurial culture and a resilient local economy.
This article will investigate the spatial evolution of the Italian motorcycle industry during the period 1893–1993. Interestingly, this industry concentrated in three clusters, one of them located in the heartland of Emilia Romagna. We examine whether the heritage theory, the agglomeration theory, or both can explain survival rates of firms. In addition, we test whether firms in the Emilia Romagna cluster, as suggested by the Emilian district model, outperformed firms located in the other two clusters outside Emilia Romagna.
3. The historical evolution of the Italian motorbike industry
The emergence of the motorcycle industry in Italy dates back to 1893, when the engineer and professor Enrico Berardi from Padua built one of the first fuel engines, which he assembled on a trolley linked to a bicycle. In the same years, other attempts were made in Milan by Maffeis (1895) and in particular by Lazzati and Figini (1899), this latter company was the first one that successfully produced and sold at the same time its motorbikes (Grizzi and Clarke, 2014).<AQ/> All these developments happened when European motorbike (and car) producers were already manufacturing for mass markets.2 Thanks to this delayed entry, the Italian automotive industry greatly benefited from the widespread diffusion of knowledge and ideas about cars and motorbikes that pervaded all over Europe. With a positive image associated to speed and fuel engine, the nascent Italian automotive industry quickly took off (Kim et al., 2003). In this period, indeed a proliferation of initiatives spurred all over the country,3 and in particular around the urban areas of Milano and Torino, which were by far the most industrialized areas of the country. In these same years, the automobile industry was also emerging in those same areas4 (Annibaldi and Berta, 1999). In the beginning, it was not uncommon that early motorcycle companies were at the same time active in the cycling as well as in car industries. Notorious examples are Bianchi of Milan, which started producing bicycles in 1885, constructed its first motorbike prototype in 1897, and just before WWI expanded its activity to automobiles, tanks, and light trucks for the Army (Grizzi and Clarke, 2014). Similarly, in Torino were operating companies like Ceirano and Storero, which both had their roots in the bicycle industry. For example, one of the Ceirano brothers would patent in 1895 a pneumatic tire for bicycles and a few years later they will produce one of the first successful four-wheel vehicle in Italy named Welleyes (Treccani, 1979). Thanks to this very successful model, in 1899, the Ceirano brothers were able to gather together a small group of aristocrats who were passionate about cars: they will represent the core founders of F.I.A.T. (Fabbrica Italiana Automobili Torino; Castronovo, 1999). The history of FIAT, and of the car industry in Turin, matters also for the nascent motorbike industry in that city, because this company will soon become the largest car-making company in Italy and will dominate the entire automotive sector in the Turin area (before WWI, half of the Italian production of cars was made by FIAT).5 By out-competing its rivals—of which some were also active motorbike producers—FIAT limited the expansion of the motorbike sector around Torino and possibly in other areas.6 Similarly in Milano, because of the fierce competition of FIAT, car companies were forced to specialize in sport and high-powered cars (e.g. Isotta Fraschini and Alfa Romeo; Kim et al., 2003) or give up all together the car production and focus only bikes and motorbikes (e.g. Bianchi).
In the Emilia Romagna region, and in particular in the province of Modena and Bologna, the industry emerged a few years later. Around the mid-1920s, companies like G.D. and Moto Morini gained recognition by winning some important national and international races. These entrepreneurial ventures were in most cases artisanal companies often dedicated to building motorbikes for races. This is similar to what happened in the emerging automobile sector in the same area. While Torino became with FIAT the capital of the mass-production car industry, Bologna and its surrounding areas specialized in niche markets. The Motor Valley would become home of sport and luxury car producers like Ferrari and Maserati before WWII and Lamborghini or Pagani after WWII.
Looking at what happened outside Italy, the industry was clearly dominated by the British and French in the pre-WWI period, whereas during the interwar period, the German industry took the lead. The post-WWII period is characterized instead by the decline of these national motorbike industries, whereas Italy became since the early 1960s the largest European market for motorbikes (Wezel and Lomi, 2009). The Italian success was due to the diffusion of light motorbikes and scooters (e.g. Lambretta and Vespa), which represented the main mean of transportation of Italians after WWII. However, since the mid-50s, the economic boom favored the diffusion of small, cheap cars (e.g. FIAT Cinquecento), and many motorcycle producers entered in a long crisis that ended with a consolidation of the industry in the mid-60s. When the entry of Japanese producers wiped out the British industry and hardly bit the German one in the 1970s, the Italian producers managed, also thanks to industry protection, to keep abreast with international competition. At the turn of the 21st century, Italy represents the largest European producer, followed by Germany, and at the same time the largest market for motorcycles and moped (ACEM, 2015).
4. Data and methods
The study is based on an original data set of 667 motorcycle companies in Italy in the period 1893–1993. The data set draws on two sources: “Moto Italiane, i primi 50 anni 1895–1945” (Milani, 1998) and “Enciclopedia della motocicletta” (Wilson, 1995),7 which are two encyclopedias of motorbike companies providing rich and systematic information on the year of foundation of a company, the ending year of production or when a major re-organization or ownership change occurred, and the location of the company (city level). With this information at hand, it was possible to reconstruct the historical evolution of the industry and its geographical distribution. Milani (1998) and Wilson (1995) are also the key sources of information to detect the origin and background of firms. They provide information on the name of the founder, and in some cases about organizational changes that a company went through. Additional information on firms’ founders was searched in specialized magazines and company Web sites. Economic and social data on population have been extracted from statistical publications and databases at the Italian statistical office (ISTAT, 2011) and the Bank of Italy (Nuzzo, 2006). Historical census data on regional employment in the Italian manufacturing sector were extracted from Cainelli and Stampini (2002). Historical data on school enrollment and regional gross domestic product (GDP) were taken from the statistical appendix of Felice (2013).
4.1 Data description
In Figure 1, the yearly number of entries, exits, and the total number of producers is illustrated. The graph shows three cycles with the corresponding peaks and troughs. The first two main troughs are in 1917 and 1944, which correspond roughly with the end of WWI and WWII. The third trough is around mid-60s, when the Italian economic boom consolidated, and the transportation habits of Italian changed, with a shift from light motorbikes (e.g. Vespa scooter) to small cars (e.g. Fiat cinquecento). Before every trough, we have a peak, after which exits accelerated. Two peaks can be observed before WWI, in 1905 and 1910, which are right before the 1907 and 1911 financial crises, respectively. After every trough, it can be observed a sharp growth of entrants, in particular after WWI. In the period 1916–1926, on average, 16 firms were founded each year, reaching an absolute maximum of 132 companies active in the industry in 1926. After 1945 and till 1954, the number of entrants grew at a similar fast rate of 12 firms per year, reaching a peak of 119 firms in 1953.
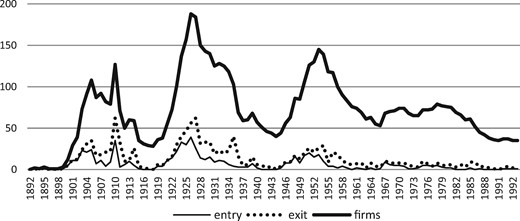
Historical evolution of the industry (entry, exit, and total number of firms).
Exit rates were low in the early and formative period of the industry (1893–1907). However, already before WWI, the number of exits overtakes the number of entrants (the first drop is in 1907, the year of the first worldwide financial crisis). After WWI, the exit rate is lower than the entry rate before each crisis, but it grows immediately after, until the next one. Between the two World Wars, exits accelerated after two economic-wide crises: in the mid-1920s, as a consequence of restrictive monetary policies implemented by the Italian fascist regime,8 and in the mid-1930s, when the autarchy period began in Italy and the effects of the 1929 Great Depression exacerbated (Labini, 2014). After WWII, another acceleration of exits can be observed after the peak of 1953, when Italians started switching from motorbikes to cars. This type of dynamics ended in the late 1970s, when the number of firms declined steadily till the early 90s, after which the number of firms stabilized at around 33 units in 1993.
The industry concentrated originally in three regions: the Piemonte region, around the city of Torino; the Lombardia region, in particular in the western provinces of Milano, Varese, and Pavia; and the Emilia Romagna region, in the provinces of Modena and Bologna (i.e. Motor Valley). Figure 2 illustrates the entry–exit dynamics in the Motor Valley. The dynamics of the industry is very similar to the one observed at the national level, at least until mid-60s. After WWII, the number of producers increased steadily, moving from a low of 4 in 1945 to a high of 21 in 1954. After the consolidation of the mid-60s, the local industry recovered and reached a new peak in 1978 (i.e. 23 companies). Since late 1970s, in line with the national trend, the number of firms declined, stabilizing at around seven firms in 1993.
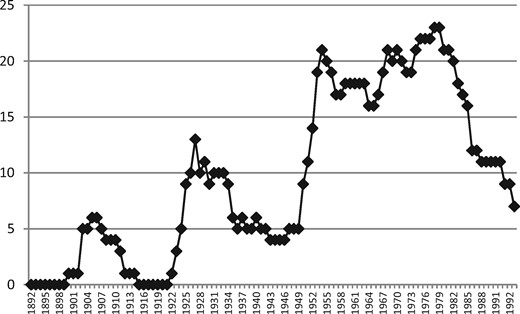
Number of Motor Valley firms.
As shown in Figure 3, the concentration of firms in the Motor Valley was initially low. It grew steadily over the years to reach a 10% share before WWII. In this period, Motor Valley ranked third after Torino and Milano. The geographical concentration around the Motor Valley grew at a faster rate in the post-WWII period, reaching a peak of 33.5% share in 1975. As for today, Motor Valley is the largest concentration of motorbike producers in Italy.
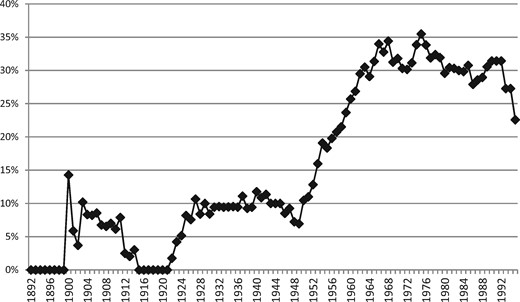
Percentage of Motor Valley firms.
4.2 Methods and variables
The quantity h0(t) is the baseline or underlying hazard function, corresponding to the probability of failure when all the explanatory variables are 0. The regression coefficients Bn of each explanatory variable indicate the proportional change of the hazard rate due to a change in the explanatory variables. The model is based on the assumptions that observations are independent and the hazard ratio is constant over time. Moreover, a Cox regression exploits the information of censored cases that are observations for which the event of interest occurred after the period of observation. In this case, censored cases are firms that were still active after 1993. The Cox model is semi-parametric, hence, different from other parametric models (e.g. exponential): it does not impose any restriction on the shape of the hazard function, which is an advantage, as there is no need to make an a priori hypothesis.
Our study tests the impact of a set of explanatory factors on the performance of firms, measured as survival time. The construction of the explanatory variables and the dependent variable closely follows the methodology used in similar studies (Klepper, 2002b, 2007; Boschma and Wenting, 2007).
4.3 Dependent variable
The hazard rate is the dependent variable, which is used to proxy the performance of firms. We have been able to determine the age of each firm with information on the years of exit (i.e. last year of production) and entry (i.e. first year of production). It is worth noting that takeovers and mergers are treated as exits, and the year of acquisition/merger as the time of exit, if the name of the company acquired/merged disappears or its location changes, whereas the firm is treated as continuing if the company name is still in use and its location stays the same.9 In the rare cases in which a firm changes name for reasons different from merger or acquisition (e.g. when one of the founders leaves the firm), the firm is treated as continuing. In our population, we count 30 mergers and acquisitions; for nine of them, the company was renamed.
4.4 Explanatory variables
4.4.1 Heritage model: firm background
Klepper identifies three types of backgrounds of founders, which correspond to four types of entrants: (1) Spinoffs, which are firms founded by employees of firms that were already active in the same industry. Spin-offs directly inherit the routines of the parent firm via the founder, so if the parent had superior routines, and accordingly superior performance, the spin-off is also expected to be successful (Klepper, 2007). Empirical evidence shows that more successful firms have indeed higher spin-off rates and more successful spin-offs (Klepper and Sleeper, 2005). (2) Experienced firms and experienced entrepreneurs: These are firms (or entrepreneurs) that enter an industry by diversifying their portfolio of products/activities (Carroll et al., 2007; Klepper, 2002b; Boschma and Wenting, 2007). Due to the cumulativeness of knowledge production, innovation and diversification are path-dependent processes (Dosi, 1988); therefore, firms tend to develop new activities around those they are good at. Empirical evidence confirms that the diversification process from related sectors is the main avenue to enter (and succeed) into new economic activities (Neffke et al., 2011b; Boschma et al., 2013). In particular, new firms with a background in closely related sectors should perform better than other diversifying firms. (3) Inexperienced firms: This category includes firms and entrepreneurs with no previous work experience in the same or related industries. As in most studies it is not always possible to track back the experience of the founder, this category includes also firms whose founders’ background is unknown. According to Klepper’s entry model (Klepper, 2002c), these firms show the lowest R&D productivity because they lack industry specific capabilities, resulting in lower performance at any age and time of entry.
Firm background refers to a set of binary variables defined according to the previous experience of the company founder (spinoff, experienced entrepreneur, experienced firm, and inexperienced firm). They get value 1 if the founder of the firm falls in one of the background categories and 0 otherwise. A firm is treated as a spin-off if the founder was a previous employee of an incumbent motorbike firm. In case the founder worked for more than one incumbent, the last firm is considered as the parent company. For each spin-off, a performance variable of the parent (Parent duration) has been constructed, which indicates the number of years of production of the parent firm. If the parent is a foreign firm, hence it is not included in the data set, the background is assigned as spin-off and the age of the foreign parent recorded in the variable Parent duration.
The Experienced entrepreneur variable refers to a new start-up founded by individuals who worked in closely related activities, such as technicians in motorbike repair workshops, sellers and importers of foreign motorbike brands, organizers of or riders in motorbike races, and army officers with expertise in motorbikes or its components. The variable Experienced firms refers to firms that diversified in the motorbike industry from related sectors such as automobile, bikes, carriages, engines, or other components. This type of firms mainly consists of bike producers, in particular in the early years of the industry, and suppliers of core inputs, like engines. The Inexperienced firm variable includes all firms for which the founder background is either unknown or unrelated to the sector. All the above variables are used to test the heritage model.
In addition to firm background, the heritage theory argues that the time of entry affects firm performance. Following the industry life cycle (Klepper, 1997), three phases of an industry are identified. The emergency phase, when few firms populate the industry, is characterized by technological turbulence and high rates of innovation. Second, as a technology becomes more diffused, the number of firms in the market grows considerably and a dominant technology emerges. During the last maturity phase, a shakeout occurs in the industry: firms with the fittest routine will survive, whereas the others exit the industry, and the industry becomes concentrated. In this model, it is argued that early entrance brings an advantage because of increasing returns to R&D. It is assumed that it is easier to enter an emerging industry than a mature industry, as entry barriers grow over time along with the growing costs of R&D. Three time cohorts have been created to account for the main turning points that occurred in the industry. They indicate at which age a firm/entrepreneur entered the industry. Firms born in the same cohort are assumed to face similar challenges and external pressure, as opposed to firms born in different cohorts. The first dummy (i.e. preWWI) includes firms entering before WWI, between the years 1893 and 1915. The second dummy stands for firms entering between the years 1916 and 1945 (i.e. preWWII), and the last cohort includes all firms starting from year 1945 (i.e. postWWII).
As the effect of time of entry on the hazard is possibly not constant overtime, we included time-varying co-variants in our model, which are given by the interaction of time of entry variables with time10 (i.e. preWWI × t; preWWII × t; postWWII × t).11
4.4.2 Agglomeration economies and district effects
To test the role of agglomeration economies, three variables were constructed. First, we measure the narrow version of localization economies (provdensity) using the number of active firms in the motorbike sector at time of entry in the province. We computed this variable also at the regional level (i.e. regdensity) to test at which scale agglomerations are important or not. Second, the role of agglomeration externalities derived from the local presence of sectors related to the motorbike industry (or related externalities) has been captured by regional employment (total employment in the region) in the mechanic sector (relvar). Third, urbanization economies (pop) was measured with the number of inhabitants in the region at time of entry.
To account for an additional institutional district effect on top of agglomeration economies, like the presence of local common goods, social institutions, or good government, which the literature suggests to play a crucial role in the Emilia Romagna region (Brusco, 1982), a geographical dummy (MotorValley) was created. This variable is equal to 1 if a firm is located in the provinces of Bologna and Modena, and 0 otherwise. Other geographical dummies were constructed to control for district effects in the two other large agglomerations in the industry: Torino for the Torino province, and Milanarea for the provinces of Milano, Varese, and Pavia.
Localization economies (i.e. provdensity) may be stronger in the above clusters than elsewhere. For this reason, we have computed the density of firms in each specific cluster to proxy for localization economies in the three areas (i.e. Motor Valley, Milan, and Torino). The variables are named, respectively, MVdensity, MIdensity, and TOdensity. We have built interaction effects for these clusters when localization economies are measured at the regional level. The three variables are built by multiplying the cluster dummies (i.e. Motorvalley, Milanarea, and Torino) to the density variable at the regional level (i.e. regdensity). The interaction terms have been named, respectively, MotorvalleyD, MilanareaD, and TorinoD.
To test if firm background and parental heritage affect differently firms in and outside the Motor Valley district, several interaction terms have been created by multiplying the location dummy with the variable of interest. To gauge the effect of the background of firms (i.e. spin-offs, experience entrepreneurs, and experienced firms) in the Motor Valley relative to firms located elsewhere, three interaction terms were created (i.e. spinoffmotorvalley, expentrmotorvalley, and expfirmmotorvalley) by multiplying the dummy motorvalley with the background dummies spin-off, experienced entrepreneurs, and experienced firms, respectively.
An additional variable, i.e. edu, which measures the school enrollment rate in regions at time of entry, has been included to control for the role of human capital. Moreover, a variable of regional GDP per capita (i.e. reggdp) has been added to control for the level of economic development at time of entry.
The correlation coefficients of the above variables are presented in Table A5 (see Appendix). It is worth noting that a high correlation exists between the variable pop (number of inhabitants at the regional level) and the variables relvar (number of employees in the mechanical sector at the regional level) and regdensity (number of motorbike firms at the regional level) (0.84 and 0.60, respectively). As this might signal multicollinearity among these predictors, we check for it by using the VIF (variance inflation test) command in STATA 14.2. The findings seem to indicate the absence of collinearity (VIF: pop= 4.37; relvar = 3.45; regdensity = 1.63). A table of summary statistics of the agglomeration and regional variables is presented in the Appendix (see Table A6).
4.4.3 Background of the firms
In line with the work of Klepper, the background of the entrants in the industry is classified distinguishing between spin-off, experienced firms, entrepreneurial firms, and inexperienced firms. Table 1 presents the geographical and temporal distribution of firms according to their background. The figures indicate that on average the largest group of entrants in the industry was represented by inexperienced firms with about 33% of the total. This also suggests, however, that the majority of entrants (about 60%) had some experience, as they were founded by either spin-offs, experienced entrepreneurs, or diversifiers. Among these latter groups, the majority (circa 30% of the total) was represented by individual entrepreneurs, followed by experienced firms (circa 20% of the total) and spin-offs (around 11% of the total). The geographical distribution across the three largest motorbikes clusters (Motor Valley, Milano area, and Torino) discloses some telling differences. Motor Valley had a larger share of spin-off entrants (about 20% of the total number of firms in the Motor Valley) as compared with Milano and Torino (16.49% and 10.69%, respectively). Torino instead had the largest share of experienced entrepreneurs, as compared with the other two clusters, and the lowest share of experienced firms. Table 1 also presents the figures about the time of entry, which show a picture coherent with the typical dynamics of an industry, where spin-offs appear a few years after the kick-off of the industry. Indeed, before WWII, only 6 out of 74 spin-offs were generated, and the entry dynamics was mainly driven in that period by inexperienced firms, diversifiers, and start-ups of experienced entrepreneurs.
Background of the firms by geographical area and time of entry (row percentages and absolute frequencies)
| Background of the founder | Motor Valley | Milano areaa | Torino area | Italy | preWWI | preWWII | afterWWII | |
|---|---|---|---|---|---|---|---|---|
| Spinoff | N | 14 | 30 | 11 | 74 | 6 | 40 | 28 |
| % | 18.42% | 15.54% | 8.40% | 11.09% | 3.45% | 13.94% | 11.09% | |
| Experienced Entrepreneur | N | 23 | 52 | 53 | 204 | 34 | 112 | 57 |
| % | 30.26% | 26.94% | 40.46% | 30.58% | 19.54% | 39.02% | 27.94% | |
| Experienced Firm | N | 16 | 48 | 23 | 130 | 25 | 44 | 60 |
| % | 21.05% | 24.87% | 17.56% | 19.49% | 14.37% | 15.33% | 29.41% | |
| Inexperienced | N | 23 | 63 | 44 | 259 | 109 | 91 | 59 |
| % | 30.26% | 32.64% | 33.59% | 38.83% | 62.64% | 31.71% | 28.91% | |
| Total | N | 76 | 193 | 131 | 667 | 174 | 287 | 204 |
| % | 10.94% | 28.93% | 19.64% | 100% | 26.11% | 68.54% | 30.86% |
It includes the provinces of Milano, Varese, and Monza-Brianza.
4.4.4 Survival of firms: empirical findings
The theoretical framework set out in Section 2 is tested using four regression models. The estimates are presented in Table 2. The heritage model is first tested, following a stepwise procedure, in which explanatory factors (i.e. agglomeration economies and district effects) are added one by one to test the robustness of the heritage model. The estimates presented in Table 2 report the coefficients of the hazard model, where a negative coefficient indicates a decrease in the hazard, that is a higher probability of survival at time of entry, whereas a positive coefficient means a higher hazard. Hazard ratios are presented in Table A1 in the Appendix: they show the expected increase (or decrease) of the hazard rate for a unit change in the explanatory variable: a coefficient higher than 1 means that an increase in the explanatory variable led to a higher hazard rate. In all specifications of the model, we included variables of regional GDP (i.e. reggdp) and education (i.e. edu) as controls.
Coefficient estimates of the hazard model, motorcycle producers in Italy, 1893–1993
| Variables | Model 1 | Model 2 | Model 3 | Model 4 | Model 5 |
|---|---|---|---|---|---|
| Spinoff | −1.114*** | −1.075*** | −1.026*** | −1.029*** | −1.065*** |
| (0.147) | (0.142) | (0.139) | (0.183) | (0.122) | |
| Expentr | −0.752*** | −0.741*** | −0.720*** | −0.730*** | −0.740*** |
| (0.0542) | (0.0563) | (0.0600) | (0.0636) | (0.0685) | |
| Expfirm | −0.996*** | −0.977*** | −0.971*** | −0.968*** | −1.021*** |
| (0.0860) | (0.0860) | (0.0918) | (0.0979) | (0.0905) | |
| Parentduration | −0.00496 | −0.00569* | −0.00630* | −0.00627* | −0.00546* |
| (0.00322) | (0.00342) | (0.00362) | (0.00347) | (0.00326) | |
| Relvar | 9.30e-07 | 9.00e-07 | 6.99e-07 | ||
| (5.81e-07) | (6.42e-07) | (6.11e-07) | |||
| Pop | −8.43e-05* | −9.73e-05 | −8.00e-05* | ||
| (4.46e-05) | (6.03e-05) | (4.48e-05) | |||
| Provdensity | 0.00386 | 0.00698 | 0.00412 | 0.00127 | |
| (0.00514) | (0.00757) | (0.00523) | (0.00433) | ||
| Motorvalley | −0.272*** | −0.205* | −0.429*** | ||
| (0.0919) | (0.115) | (0.122) | |||
| Milanarea | −0.104 | −0.195** | |||
| (0.194) | (0.0895) | ||||
| Torino | −0.152 | 0.161** | |||
| (0.145) | (0.0685) | ||||
| MVdensity | 0.00862** | ||||
| (0.00426) | |||||
| MIdensity | 0.000970*** | ||||
| (0.000176) | |||||
| TOdensity | −0.00107*** | ||||
| (0.000254) | |||||
| Spinmotorvalley | −0.0478 | ||||
| (0.256) | |||||
| Expentrmotorvalley | −0.00679 | ||||
| (0.101) | |||||
| Expfirmmotorvalley | −0.110 | ||||
| (0.141) | |||||
| Preww1 | 1.154*** | 1.201*** | 1.188*** | 1.179*** | 1.220*** |
| (0.120) | (0.133) | (0.141) | (0.127) | (0.134) | |
| Preww2 | 0.842*** | 0.834*** | 0.789*** | 0.783*** | 0.795*** |
| (0.141) | (0.155) | (0.153) | (0.149) | (0.160) | |
| Edu | −0.994*** | −0.822** | −0.846** | −0.972*** | −1.292*** |
| (0.306) | (0.363) | (0.357) | (0.349) | (0.339) | |
| Reggdp | 0.00670** | 0.00542* | 0.00580** | 0.00536* | 0.00686** |
| (0.00296) | (0.00300) | (0.00274) | (0.00288) | (0.00333) | |
| tvc model | |||||
| Preww1 | −0.029*** | −0.033*** | −0.034*** | −0.035*** | −0.029*** |
| (0.00760) | (0.00905) | (0.00875) | (0.00999) | (0.00777) | |
| Preww2 | −0.0201* | −0.0208** | −0.0215* | −0.0215* | −0.0192* |
| (0.0105) | (0.0106) | (0.0111) | (0.0114) | (0.0107) | |
| Observations | 638 | 632 | 632 | 632 | 638 |
Robust standard errors in parentheses.
p < 0.01;
p < 0.05;
p < 0.1.
Model 1 in Table 2 tests only the heritage effects, which includes the firms’ background (i.e. spinoff, expentr, and expfirm), the years of production of the parent (i.e. parentduration), and time of entry (i.e. preww1 and preww2). Findings are in line with Klepper’s predictions—all three background variables are highly significant and have a negative impact on the hazard rate (as compared with inexperienced firm, the excluded reference category). In terms of annual hazards, these coefficients show that spin-offs, experienced firms, and experienced entrepreneurs have, respectively, about 67%, 63%, and 53% higher chance of survival than inexperienced firms. The coefficient estimate of the parent duration variable is also negative, though only significant at 10% (and not significant in Model 1). Time of entry is positive and strongly significant. The estimates indicate that firms founded before WWI and between WWI and WWII have a hazard rate that is, respectively, 3.2 and 2.3 times higher than firms entering after WWII (i.e. postww2 is the excluded reference category) (see Table A1). Although these latter findings are at first glance contradicting the Klepper model, it is coherent with the peculiar dynamics of the motorcycle sector in Italy, which went through repeated shocks during its life cycle. Other studies testing the heritage theory in different industries than automobiles also found a negative effect of early entrance (Buenstorf and Guenther, 2011). Moreover, the coefficient of the cohorts interacting with time are significant and with a negative sign, suggesting that the hazard of time of entry changes with age. In particular, firms in the earlier cohorts (i.e. preWWI and preWWII) have a lower hazard at older ages as compared with those in the latest cohort (i.e. postWWII). This is not surprising, as the formative periods of the industry were very turbulent, so those who were born and survived these two periods became more successful.
To grasp the effects of agglomeration economies, in our second specification (see Model 2), three additional variables are included in the model. The coefficient estimate of the proxy of local related externalities (i.e. relvar) is positive, though with a very small coefficient, meaning that the presence of related sectors (i.e. industries classified in the mechanical and transport sectors) in the regional economy has no sizable effect on the survival of motorbike firms. Similarly, the coefficient estimate of urbanization economies, proxied by number of inhabitants in the region (i.e. pop), is negative and statistically significant. Despite the small size of the coefficient, this effect can be sizable if the growth in regional population is in the order of thousands. The effect of localization economies, when proxied by the density variable at the provincial level (i.e. provdensity), is not significant. After having controlled for agglomeration economies and the role of education, in Model 3 we add a dummy (i.e. motorvalley) for Motor Valley, which captures an additional “district” effect associated with the Emilian model. The long tradition of local collaboration between local government and the business community and a pervasive culture of entrepreneurship in the region, in particular in the mechanical and automotive industry, are factors that resonate in the dummy motorvalley (Brusco, 1982; Capecchi, 1990; Amin, 1999). To further assess the robustness of this interpretation, two additional geographical dummies are included in Model 3 (i.e. Torino and Milanarea). These dummies identify the two other prominent clusters in the industry, located around the urban areas of Torino and Milan. The findings reported in Model 3 in Table 2 show that “district” effects are present only in the Motor Valley, whereas the coefficient estimates of the two other agglomerations (i.e. Torino and Milan area) are not significant. The coefficient estimate for the dummy motorvalley is negative and significant. Firms located in the motorbike cluster spanning the provinces of Modena and Bologna have a 24% lower hazard than firms located elsewhere (see Table A1). This latter finding appears to be robust to changes to the model specifications.
Following Klepper (2007), we test in Model 4 in Table 2 whether the superior performance of firms in the Motor Valley area is confined to spin-offs, experienced firms, or experienced entrepreneurs by adding three dummies to the previous specification (i.e. spinmotovalley, expfirmmotorvalley, and expentrmotorvalley). The coefficients of the estimates of the three dummies are negative, though not significant. More importantly, and opposite to Klepper (2007), the coefficient estimate of the Motor Valley dummy (i.e. motorvalley) is still negative, sizable, and significant. This latter finding suggests that the district effects have played a nonmarginal role in survival of the local firms, besides the effect of the entrepreneurial background-specific features.
Finally, in Model 5 we test if the three clusters benefited differently from the effect of localization economies. The findings show that indeed localization economies played a different role, which was negative in the Motor Valley and Milan, whereas it was slightly positive for Torino (i.e. meaning lower hazard).12
4.4.5 Robustness check
The robustness of our findings crucially relies on the method used for classifying the background of founders and, accordingly, the variables spinoff, expfirm, expentr, and inexpfirm. Our classification of inexperienced firms is a residual category to some extent because we were not always able to identify the founders and/or classify their background. It is worth noting that this potential source of bias is also present in the work of Klepper. To address this, first we notice that the total share of inexperienced firms in our study is 38.8% of the total number of entrants (Table 1), of whom almost one-third is certainly an inexperienced entrant. Therefore, it is for about 25% of these inexperienced entrants that we lack information. This is far less than the 352 firms (out of a total of 752) that Klepper classified as inexperienced in his Detroit study (see Klepper, 2007: 621). And second, inexperienced firms were mainly active in the early stages of the industry: as shown in Table 1, 62.6% of them entered before WWI. It can be safely argued that these founders were unlikely to be spin-offs. In fact, spin-offs usually entered the industry after the initial period of industry development. This seems to be the case also in the Italian motorbike industry, where most spin-off entrants were founded after WWI (Table 1).
All in all, it is unlikely that we have systematically misclassified inexperienced firms. One way to rule out the potential source of bias generated by the misclassification of the residual category of inexperienced firms is to test the same models as in Table 2 but now excluding all inexperienced firms from the analysis (the reference category for the background of founders is experienced entrepreneurs, i.e. expentr). The coefficient estimates are presented in Table A2 in the Appendix. The findings are in line with the estimates presented in Table 2, where inexperienced firms are included in the analysis. In particular, the coefficient of spinoff is still negative, sizable, and statistical significant (but in Model 4). Similarly, the coefficient estimates of the dummy variable motorvalley are keeping their sign and significance, confirming the importance of the district effects (but in Model 5).
The models presented in Table 2 are also estimated with the inclusion of localization economies measured at the regional level, by replacing the variable provdensity with regdensity. We can observe three main differences (see Table A3). First, the effect of localization economies at the regional level is significant in all models, implying a higher hazard of approximately 1.4%. This finding suggests that in smaller geographical areas, such as the province, positive and negative localization externalities cancel out each other, whereas in more broadly defined geographical areas, like the region, there is less scope for positive spillovers (e.g. knowledge spillovers), so the overall net effect is negative. This latter finding is also consistent with other studies that pointed toward the presence of negative localization externalities in clusters (e.g. Boschma and Wenting, 2007). Second, we have only limited evidence on the role of localization economies in the Motor Valley when they are measured at the regional scale. Model 5 shows that the coefficients of the variables motorvalley and its interaction effect (i.e. motorvalleyD) are not significant, though with the right sign. Third, the effect of localization economies is significant for both the cluster of Torino and Milano, though positive for the former (higher hazard).
Finally, to further check that our findings are not affected by some confounding factors, we tested two additional models excluding all regional controls. In Table A4, Model 1 presents the coefficient estimates of the heritage theory and the cluster dummies alone. The coefficient estimates of firms’ background and the motorvalley dummy are significant and with the expected signs. Moreover, the other clusters dummies, i.e. Torino and Milanarea, are not significant. Model 2 and 3 present the interaction effects of the cluster dummies with the inclusion of the localization economy variables provdensity and regdensity, respectively. The sign and significance of the coefficients are in line with those tested with the controls (see Models 5 in Tables 2 and A3, respectively).
5. Conclusion
This article has investigated the industrial and spatial dynamics of the motorbike industry in Italy over a period of 100 years since its infancy in 1893. Broadly speaking, findings show that the spatial concentration of the industry was driven by mechanisms that strongly confirm to the heritage theory of Klepper, but also provide some support for the agglomeration thesis of Marshall. In line with Klepper, being a spin-off company or an experienced firm enhanced the survival rates. In line with Marshall, we found a positive effect of being located in a cluster for the cases of the Motor Valley cluster in Emilia Romagna and the Milano cluster in Lombardia. Interestingly, this beneficial effect of clusters is driven by the positive effect of localization economies in Milan, whereas it is independent of it in the case of the Motor Valley. This latter finding might indicate the importance of a favorable local institutional environment, as propagated by the Emilian district model. Accordingly, our study on the Italian motorbike industry shows that the heritage theory is not incompatible with the agglomeration theory. Moreover, it shows that regional institutions may be important, affecting the spatial clustering of an industry. Finally, it shows that industry specificity does play an important role in explaining the spatial dynamics of industries, as there is no uniform pattern applicable to all industries (Boschma, 2015).
There are also a few findings that are not fully in line with the predictions of Klepper’s heritage model. First, we find only limited evidence that more successful parents span out better spin-offs. Second, our study shows that early entrance does not bring any advantage to firms. This may be explained by the fact that latecomers do not carry the weight of previous investments in outdated technologies (Perez and Soete, 1988). Latecomers can also free ride on incumbents and imitate their technologies at lower costs (Mitchell, 1991; Bryman, 1997).
From an agglomeration point of view, the various outcomes tell the following story. First, localization economies (taking the narrow definition of Marshallian externalities, as proxied by local density) have a negative effect on firm survival (when measured at the regional level), or are not statistically significant (when measured at the province level), which is at odds with the Marshallian argument. On the contrary, urbanization economies have a positive effect, especially in the long run, when we can expect substantial changes in population growth. Second, related externalities (taking the extended definition of Marshallian externalities, as proxied by related variety) have no effect on firm survival either, again going against Marshall. Third, what is in line with Marshall is the finding that being in the Motor Valley cluster enhances the performance of the local motorbike firms, even after controlling for heritage effects and other agglomeration effects. Accordingly, although we found evidence of negative localization economies, this is turned into a positive effect on survival in the Motor Valley and Milano clusters. Fourth, contrary to the study on Detroit by Klepper (2007), the interaction variable SpinMotorValley was not significant, whereas the Motor Valley variable remained positive and significant. This indicates there is a positive cluster effect in the Motor Valley that applies to both spin-off and non-spin-off firms. Fifth, the positive district effect applies only to the Motor Valley cluster, not to the Torino and Milano clusters. This shows there is something special about being located in the Emilian region, which might indicate the importance of specific local institutions, as suggested by the Emilian district literature.
To conclude, the findings indicate that the heritage model can be reconciled with agglomeration arguments. However, the study suffers from a number of limitations. First, the longitudinal analysis is constrained by the availability of time-series data. For example, it would increase our understanding if we could have included additional (i.e. better) firm performance measures—next to firm survival—like productivity data. Second, we have accounted for the role of regional institutions referring to the Emilian model indirectly in the empirical study. This is a clear limitation but entirely due to the lack of longitudinal institutional data. To test more systematically for the role of regional institutions in this Klepperian framework, future work should try to use real institutional data, even though these are often available only at the national level (Menzel and Kammer, 2012; Boschma and Capone, 2015). Third, the variable inexperienced firm has been treated as a residual category in which it there is a lot of heterogeneity, which may shadow important heritage dynamics.
Acknowledgement
The authors would like to thank an anonymous referee for her insightful comments. We are also indebted to several students from Bocconi University for their support in constructing the dataset: Claudia delle Donne, Martina Barbanera, Giuseppe Brigante, Giovanni Ungaro. We thank for their suggestions the attendees to the DRUID Conference 2015, AAG Conference 2012, Geography of Innovation Conference 2014, the workshop “Resurrection or Reinvention: Industrial Resilience in Traditional Manufacturing Regions” 20 – 23 Nov 2016 at Collegio Carlo Alberto, Turin. We thank Mr. Milani for having shared with us his knowledge of the Italian motorcycle industry, Giulio Cainelli for having provided us with historical data of Italian regions and Gianluca Capone for his valuable suggestions on previous versions of this work. Andrea Morrison acknowledges the financial support of NWO, Innovation Research Incentive Scheme (VIDI). Project number: 45211013.
Footnotes
An alternative argument, inspired by Jacobs (1969), identifies interindustry agglomeration forces, highlighting the knowledge exchange across firms in different sectors.
Gottlieb Daimler is credited to be the inventor of the first motorcycle in 1885. Other attempts were made in Germany by Hildebrand & Wolfmuller, who patented their model in 1894. More successful were the experiences of Holden in England and by DeDion-Buton in France, who started the mass production of motorcycles in 1895 (Wilson, 1995).
A few examples are the following: in 1898, Ulrico Hoepli, a publisher based in Milan, will issue the Manuale del motociclista; in 1911 is established in Milan the Motoclub italiano, the first association of bikers; several races were organized all over the country (e.g. the Brescia–Mantova–Verona race in 1899; the Milano–Genova in 1903; first Giro d’Italia motociclistico in 1914; the Milano–Caserta raid in 1919); in 1914 the monthly magazine Motociclismo is founded, which soon will be issued weekly (Grizzi and Clarke, 2014).
In particular, Torino was strongly influenced by the already established French car industry. Historical reasons played an important role in this respect. The ruling monarchy, the Savoia, had French roots and was historically measuring up itself with the French. French culture was highly influential in all fields, and local aristocrats had always a kind of admiration for French (Volpato, 1999).
To be noticed, however, that despite FIAT soon becoming a multiproduct company, spanning all kinds of mechanical and automotive sectors (e.g. train, aviation, and ships), it never produced motorbikes. There is only evidence that it developed a prototype in 1938 (Milani, 1998: Vol 2, 275).
For example, important companies based in Turin like Ceirano, Itala, SCAT, and OTAV, among others, were over time taken over by FIAT (Treccani, 1979).
When these two sources did not provide relevant information about the founding year or the background of the founders, additional search was conducted on various sources, including specialized magazines, blogs of riders, and fan clubs of historical motorbikes. As far as Internet sources are concerned, we mainly relied on the following Web sites: Moto Club Storico Conti, Wheels of Italy, Moto di Lombardia, Motorvalley, and the company Web sites for companies that are still alive.
Having trouble to borrow on the international financial markets, the monetary authorities decided to re-evaluate the Italian lira against the British pound to achieve an exchange rate of 90 liras per pound. This policy is historically known as “quota 90” policy.
This differs from Klepper (2007) who treats mergers as censored exits if the name of the company disappears. In our case, we identified only few cases of mergers or acquisition with a name change. For these cases, the company resulting from the merge/acquisition was clearly moving away from the activities of the acquired company. If we treat these cases as censored exits in the analysis, our findings do not change.
The inclusion of time-dependent covariates can be handled in the Cox model by explicitly modeling time dependence (see Royston et al. 2011:168–176; Blossfeld et al., 2012:237). Operationally, this is done by using the tvc (time-varying covariate) command in STATA 14.2 (see Cleves et al., 2016:191–195), which gives two separate outputs, the estimation of the proportional Cox model, and the estimation of the time-dependent variable model.
Our time-of-entry variable tends to capture a cohort effect rather than an imprinting effect (see Marquis and Tilcsik, 2013). For this reason, we test whether these effects wear off over time when external conditions have radically changed, as it could have possibly happened after each World War.
To check whether the effect of the motorvalley dummy is offset by the positive effect (in terms of hazard) of the localization economies variable, we tested a model that includes the heritage theory variables and the cluster dummies alone (see Model 1, Table A4). Coefficient estimates indicate that firms in the Motor Valley show a lower hazard than firms located elsewhere. This latter finding is robust to the inclusion of the localization economies variables (see Model 5, Table 2). The Milanarea and Torino dummies become instead insignificant once localization economies variables are excluded from the model specification (see Model 1, Table A4).
References
ACEM (
ISTAT (
Treccani (
Appendix
Hazard ratios of the hazard model, motorcycle producers in Italy, 1893–1993
| Variables | Model 1 | Model 2 | Model 3 | Model 4 | Model 5 |
|---|---|---|---|---|---|
| Spinoff | 0.328*** | 0.341*** | 0.358*** | 0.357*** | 0.345*** |
| (0.0481) | (0.0485) | (0.0497) | (0.0655) | (0.0420) | |
| Expentr | 0.471*** | 0.477*** | 0.487*** | 0.482*** | 0.477*** |
| (0.0255) | (0.0268) | (0.0292) | (0.0307) | (0.0326) | |
| Expfirm | 0.369*** | 0.376*** | 0.379*** | 0.380*** | 0.360*** |
| (0.0318) | (0.0324) | (0.0348) | (0.0372) | (0.0326) | |
| Parentduration | 0.995 | 0.994* | 0.994* | 0.994* | 0.995* |
| (0.00320) | (0.00340) | (0.00359) | (0.00345) | (0.00325) | |
| Relvar | 1.000 | 1.000 | 1.000 | ||
| (5.81e-07) | (6.42e-07) | (6.11e-07) | |||
| Pop | 0.999* | 0.999 | 0.999* | ||
| (4.46e-05) | (6.03e-05) | (4.48e-05) | |||
| Provdensity | 1.004 | 1.007 | 1.004 | 1.001 | |
| (0.00516) | (0.00763) | (0.00525) | (0.00434) | ||
| Motorvalley | 0.762*** | 0.815* | 0.651*** | ||
| (0.0700) | (0.0934) | (0.0791) | |||
| Milanarea | 0.901 | 0.823** | |||
| (0.175) | (0.0737) | ||||
| Torino | 0.859 | 1.175** | |||
| (0.124) | (0.0804) | ||||
| MVdensity | 1.009** | ||||
| (0.00430) | |||||
| MIdensity | 1.001*** | ||||
| (0.000176) | |||||
| TOdensity | 0.999*** | ||||
| (0.000254) | |||||
| Spinmotorvalley | 0.953 | ||||
| (0.244) | |||||
| Expentrmotorvalley | 0.993 | ||||
| (0.100) | |||||
| Expfirmmotorvalley | 0.896 | ||||
| (0.126) | |||||
| Preww1 | 3.172*** | 3.325*** | 3.280*** | 3.252*** | 3.389*** |
| (0.380) | (0.443) | (0.464) | (0.415) | (0.453) | |
| Preww2 | 2.321*** | 2.302*** | 2.202*** | 2.187*** | 2.214*** |
| (0.328) | (0.357) | (0.338) | (0.327) | (0.354) | |
| Edu | 0.370*** | 0.440** | 0.429** | 0.378*** | 0.275*** |
| (0.113) | (0.160) | (0.153) | (0.132) | (0.0930) | |
| Reggdp | 1.007** | 1.005* | 1.006** | 1.005* | 1.007** |
| (0.00298) | (0.00301) | (0.00276) | (0.00289) | (0.00336) | |
| tvc model | |||||
| Preww1 | 0.971*** | 0.967*** | 0.966*** | 0.965*** | 0.971*** |
| (0.00738) | (0.00875) | (0.00845) | (0.00965) | (0.00754) | |
| Preww2 | 0.980* | 0.979** | 0.979* | 0.979* | 0.981* |
| (0.0103) | (0.0104) | (0.0109) | (0.0112) | (0.0105) | |
| Observations | 638 | 632 | 632 | 632 | 638 |
Robust standard errors in parentheses.
p < 0.01;
p < 0.05;
p < 0.1.
Coefficient estimates of the hazard model, motorcycle producers in Italy, 1893–1993: inexperienced firms not included
| Variables | Model 1 | Model 2 | Model 3 | Model 4 | Model 5 |
|---|---|---|---|---|---|
| Spinoff | −0.393*** | −0.355** | −0.323** | −0.327 | −0.365** |
| (0.140) | (0.158) | (0.159) | (0.202) | (0.151) | |
| Expfirm | −0.257*** | −0.241*** | −0.257*** | −0.247** | −0.286*** |
| (0.0824) | (0.0913) | (0.0895) | (0.0994) | (0.0879) | |
| Parentduration | −0.00478 | −0.00558 | −0.00613* | −0.00610* | −0.00472 |
| (0.00313) | (0.00340) | (0.00361) | (0.00345) | (0.00317) | |
| Relvar | 1.33e−06 | 1.06e−06 | 9.32e−07 | ||
| (8.75e−07) | (9.84e−07) | (8.41e−07) | |||
| Pop | −0.00015** | −0.000149 | −0.00013** | ||
| (7.14e-05) | (0.000100) | (6.85e-05) | |||
| Provdensity | 0.00367 | 0.00642 | 0.00385 | 0.00512 | |
| (0.00693) | (0.00989) | (0.00707) | (0.00502) | ||
| Motorvalley | −0.295*** | −0.230** | −0.294 | ||
| (0.113) | (0.0908) | (0.216) | |||
| Torino | −0.140 | 0.272*** | |||
| (0.213) | (0.0992) | ||||
| Milanarea | −0.113 | −0.325*** | |||
| (0.217) | (0.102) | ||||
| MVdensity | 6.03e−05 | ||||
| (0.00801) | |||||
| MIdensity | 0.000982*** | ||||
| (0.000301) | |||||
| TOdensity | −0.00215*** | ||||
| (0.000348) | |||||
| Spinmotorvalley | −0.00901 | ||||
| (0.229) | |||||
| Expfirmmotorvalley | −0.0943 | ||||
| (0.180) | |||||
| Preww1 | 1.063*** | 1.057*** | 1.073*** | 1.055*** | 1.150*** |
| (0.256) | (0.230) | (0.205) | (0.220) | (0.220) | |
| Preww2 | 0.880*** | 0.848*** | 0.804*** | 0.798*** | 0.839*** |
| (0.134) | (0.174) | (0.167) | (0.170) | (0.163) | |
| Edu | −1.351*** | −0.936** | −1.056* | −1.180** | −1.720*** |
| (0.413) | (0.449) | (0.560) | (0.468) | (0.497) | |
| Reggdp | 0.0116*** | 0.0112** | 0.0116*** | 0.0111** | 0.0119*** |
| (0.00354) | (0.00484) | (0.00443) | (0.00466) | (0.00414) | |
| Tvc model | |||||
| Preww1 | −0.0218*** | −0.0260*** | −0.0276*** | −0.0278*** | −0.0216** |
| (0.00745) | (0.00895) | (0.00925) | (0.0102) | (0.00856) | |
| Preww2 | −0.0215** | −0.0215* | −0.0223* | −0.0224* | −0.0213* |
| (0.0108) | (0.0113) | (0.0118) | (0.0121) | (0.0112) | |
| Observations | 399 | 396 | 396 | 396 | 399 |
Robust standard errors in parentheses.
p < 0.01;
p < 0.05;
p < 0.1.
Hazard ratios of the hazard model, motorcycle producers in Italy, 1893–1993: localization economies measured at regional levela
| Variables | Model 1 | Model 2 | Model 3 | Model 4 | Model 5 |
|---|---|---|---|---|---|
| Spinoff | 0.330*** | 0.348*** | 0.364*** | 0.360*** | 0.341*** |
| (0.0473) | (0.0510) | (0.0555) | (0.0672) | (0.0484) | |
| Expentr | 0.474*** | 0.489*** | 0.497*** | 0.495*** | 0.492*** |
| (0.0251) | (0.0272) | (0.0278) | (0.0314) | (0.0304) | |
| Expfirm | 0.367*** | 0.386*** | 0.385*** | 0.388*** | 0.379*** |
| (0.0316) | (0.0308) | (0.0316) | (0.0353) | (0.0323) | |
| Parentduration | 0.995 | 0.994 | 0.994* | 0.994* | 0.996 |
| (0.00321) | (0.00359) | (0.00380) | (0.00375) | (0.00364) | |
| Relvar | 1.000** | 1.000* | 1.000 | ||
| (4.62e-07) | (5.20e-07) | (5.03e-07) | |||
| Pop | 1.000*** | 1.000*** | 1.000*** | ||
| (4.49e-05) | (5.96e-05) | (4.82e-05) | |||
| Regdensity | 1.014** | 1.015*** | 1.015** | 1.011** | |
| (0.00588) | (0.00566) | (0.00582) | (0.00545) | ||
| Motorvalley | 0.751*** | 0.768** | 0.813 | ||
| (0.0738) | (0.0886) | (0.104) | |||
| Milanarea | 0.987 | 0.620*** | |||
| (0.0674) | (0.0965) | ||||
| Torino | 0.919 | 1.505*** | |||
| (0.0750) | (0.221) | ||||
| MotorvalleyD | 0.997 | ||||
| (0.00795) | |||||
| MilanareaD | 1.012** | ||||
| (0.00542) | |||||
| TorinoD | 0.984*** | ||||
| (0.00502) | |||||
| Spinmotorvalley | 1.040 | ||||
| (0.250) | |||||
| Expentrmotorvalley | 1.003 | ||||
| (0.0824) | |||||
| Expfirmmotorvalley | 0.913 | ||||
| (0.135) | |||||
| Preww1 | 2.990*** | 3.489*** | 3.384*** | 3.408*** | 3.486*** |
| (0.359) | (0.526) | (0.486) | (0.491) | (0.458) | |
| Preww2 | 2.240*** | 2.130*** | 2.027*** | 1.999*** | 2.138*** |
| (0.307) | (0.335) | (0.308) | (0.294) | (0.296) | |
| Edu | 0.412*** | 0.367*** | 0.334*** | 0.303*** | 0.260*** |
| (0.124) | (0.139) | (0.134) | (0.108) | (0.0886) | |
| Reggdp | 1.005* | 1.002 | 1.003 | 1.002 | 1.001 |
| (0.00261) | (0.00208) | (0.00208) | (0.00191) | (0.00275) | |
| Tvc model | |||||
| Preww1 | 0.971*** | 0.967*** | 0.965*** | 0.965*** | 0.971*** |
| (0.00734) | (0.00812) | (0.00834) | (0.00908) | (0.00745) | |
| Preww2 | 0.981* | 0.980* | 0.980* | 0.979* | 0.979** |
| (0.0103) | (0.0101) | (0.0106) | (0.0110) | (0.0102) | |
| Observations | 643 | 637 | 637 | 637 | 643 |
Localization economies measured by the variable Regdensity.
Robust standard errors in parentheses;
p < 0.01;
p < 0.05;
p < 0.1.
Hazard ratios of the hazard model, motorcycle producers in Italy, 1893–1993: regional variables not included
| Variables | Model 1 | Model 2 | Model 3 |
|---|---|---|---|
| Spinoff | 0.350*** | 0.354*** | 0.348*** |
| (0.0462) | (0.0361) | (0.0435) | |
| Expentr | 0.469*** | 0.474*** | 0.489*** |
| (0.0255) | (0.0357) | (0.0343) | |
| Expfirm | 0.361*** | 0.354*** | 0.369*** |
| (0.0315) | (0.0319) | (0.0312) | |
| Parentduration | 0.994* | 0.994* | 0.996 |
| (0.00313) | (0.00309) | (0.0033) | |
| Motorvalley | 0.820** | 0.711*** | 0.921 |
| (0.0652) | (0.0729) | (0.117) | |
| Milanarea | 0.997 | 0.815* | 0.527*** |
| (0.0552) | (0.0912) | (0.0491) | |
| Torino | 1.033 | 1.118* | 1.223** |
| (0.0648) | (0.0744) | (0.108) | |
| Provdensity | 1.005 | ||
| (0.00558) | |||
| Regdensity | 1.006* | ||
| (0.0035) | |||
| MVdensity | 1.005 | ||
| (0.00428) | |||
| MIdensity | 1.001*** | ||
| (0.00020) | |||
| TOdensity | 0.999*** | ||
| (0.00031) | |||
| MotorvalleyD | 0.992 | ||
| (0.0094) | |||
| MilanareaD | 1.017*** | ||
| (0.0037) | |||
| TorinoD | 0.991*** | ||
| (0.0035) | |||
| Preww1 | 2.075*** | 2.106*** | 2.267*** |
| (0.310) | (0.303) | (0.273) | |
| Preww2 | 1.887*** | 1.807*** | 1.828*** |
| (0.285) | (0.328) | (0.256) | |
| Tvc model | |||
| Preww1 | 0.969*** | 0.970*** | 0.971*** |
| (0.00767) | (0.00751) | (0.0073) | |
| Preww2 | 0.980* | 0.982* | 0.980* |
| (0.0111) | (0.0108) | (0.0106) | |
| Observations | 641 | 641 | 646 |
Robust standard errors in parentheses.
p < 0.01;
p < 0.05;
p < 0.1.
Correlation coefficients
| Variable | Spinoff | Expentr | Expfirm | Inexperienced | Parentduration | Preww1 | Preww2 | Postww2 | Motorvalley | Torino | Milanarea | Reggdp | Edu | Pop | Relvar | Regdensity | Provdensity |
|---|---|---|---|---|---|---|---|---|---|---|---|---|---|---|---|---|---|
| Spinoff | 1 | ||||||||||||||||
| Expentr | −0.2443 | 1 | |||||||||||||||
| Expfirm | −0.182 | −0.3395 | 1 | ||||||||||||||
| Inexperienced | −0.2769 | −0.5165 | −0.3849 | 1 | |||||||||||||
| Parentduration | 0.6597 | −0.1611 | −0.1201 | −0.1827 | 1 | ||||||||||||
| Preww1 | −0.1567 | −0.1494 | −0.0902 | 0.3224 | −0.1262 | 1 | |||||||||||
| Preww2 | 0.0829 | 0.1675 | −0.0876 | −0.1431 | −0.015 | −0.5075 | 1 | ||||||||||
| Postww2 | 0.0616 | −0.0407 | 0.1734 | −0.1459 | 0.1365 | −0.3966 | −0.5829 | 1 | |||||||||
| Motorvalley | 0.0764 | −0.0114 | 0.0174 | −0.0542 | 0.0278 | −0.0854 | −0.1059 | 0.1959 | 1 | ||||||||
| Torino | −0.0505 | 0.1003 | −0.0333 | −0.0352 | −0.0934 | 0.0921 | 0.1413 | −0.2424 | −0.188 | 1 | |||||||
| Milanarea | 0.0749 | −0.0551 | 0.0737 | −0.058 | 0.0659 | −0.1079 | 0.0888 | 0.0039 | −0.2408 | −0.3303 | 1 | ||||||
| Reggdp | 0.0723 | 0.0267 | 0.0292 | −0.0979 | 0.0476 | −0.1905 | −0.0628 | 0.2367 | −0.1407 | 0.1298 | 0.3354 | 1 | |||||
| Edu | −0.1195 | −0.0466 | −0.0645 | 0.1776 | −0.1234 | 0.6493 | −0.0599 | −0.545 | −0.2813 | 0.2926 | 0.1218 | 0.0333 | 1 | ||||
| Pop | 0.0873 | 0.014 | 0.0515 | −0.1142 | 0.0916 | −0.2435 | −0.0858 | 0.3185 | −0.2125 | −0.2453 | 0.6587 | 0.5703 | −0.01 | 1 | |||
| Relvar | 0.0956 | 0.0296 | 0.0785 | −0.1571 | 0.1235 | −0.3577 | −0.1724 | 0.5162 | −0.1739 | −0.1521 | 0.4747 | 0.5356 | −0.253 | 0.8414 | 1 | ||
| Regdensity | 0.0418 | 0.0143 | 0.0025 | −0.0435 | 0.0259 | −0.254 | 0.2437 | −0.0165 | −0.1833 | 0.056 | 0.5041 | 0.5401 | 0.1734 | 0.5827 | 0.442 | 1 | |
| Provdensity | 0.0331 | 0.0062 | 0.0261 | −0.0496 | −0.0261 | −0.2385 | 0.3836 | −0.1807 | −0.123 | 0.3222 | 0.4703 | 0.3237 | 0.1374 | 0.2555 | 0.160 | 0.706 | 1 |
Description of agglomeration and regional variables
| Variable | Obs | Mean | SD | Min | Max |
|---|---|---|---|---|---|
| relvar | 641 | 153, 260.50 | 143, 772.20 | 3835 | 716415 |
| regdensity | 648 | 21.81 | 14.66 | 1 | 55 |
| pop | 650 | 4, 111, 386 | 1, 464, 798 | 83, 000 | 8, 892, 000 |
| edu | 647 | 1.19 | 0.16 | 0.677 | 1.622 |
| provdensity | 650 | 13.03 | 13.70 | 0 | 50 |
| reggdpa | 649 | 119.54 | 21.28 | 0 | 153 |
| mvdensity | 650 | 2.62 | 9.33 | 0 | 60 |
| midensity | 650 | 51.96 | 143.64 | 0 | 804 |
| todensity | 650 | 26.31 | 72.52 | 0 | 324 |
Italy = 100.
