


Abstract
In humans, most genome-wide association studies have been conducted using data from Caucasians and many of the reported findings have not replicated in other populations. This lack of replication may be due to statistical issues (small sample sizes or confounding) or perhaps more fundamentally to differences in the genetic architecture of traits between ethnically diverse subpopulations. What aspects of the genetic architecture of traits vary between subpopulations and how can this be quantified? We consider studying effect heterogeneity using Bayesian random effect interaction models. The proposed methodology can be applied using shrinkage and variable selection methods, and produces useful information about effect heterogeneity in the form of whole-genome summaries (e.g., the proportions of variance of a complex trait explained by a set of SNPs and the average correlation of effects) as well as SNP-specific attributes. Using simulations, we show that the proposed methodology yields (nearly) unbiased estimates when the sample size is not too small relative to the number of SNPs used. Subsequently, we used the methodology for the analyses of four complex human traits (standing height, high-density lipoprotein, low-density lipoprotein, and serum urate levels) in European-Americans (EAs) and African-Americans (AAs). The estimated correlations of effects between the two subpopulations were well below unity for all the traits, ranging from 0.73 to 0.50. The extent of effect heterogeneity varied between traits and SNP sets. Height showed less differences in SNP effects between AAs and EAs whereas HDL, a trait highly influenced by lifestyle, exhibited a greater extent of effect heterogeneity. For all the traits, we observed substantial variability in effect heterogeneity across SNPs, suggesting that effect heterogeneity varies between regions of the genome.
POPULATION structure is a pervasive feature in plant, animal, and human populations (Gaggiotti et al. 2009; Pfenninger et al. 2011; Puckett et al. 2014). In population genetics, differentiation between subpopulations is often measured by comparing allele frequencies, e.g., using the “F-statistic” (Malécot 1947; Wright 1951; Cockerham 1969). In genome-wide association studies (GWAS), population differentiation is predominantly viewed as a confounder (Astle and Balding 2009) that can lead to spurious associations (Lander and Schork 1994; Deng 2001; Marchini et al. 2004; Liu et al. 2011). To address this problem a variety of methods have been proposed (Price et al. 2010). However, rather than a confounder, population stratification can act as an effect modifier, leading to heterogeneity in the genetic architecture of traits.
The evolutionary dynamics involved in the processes that lead to population structure can result in subpopulations with heterogeneity in allele frequencies and linkage disequilibrium (LD) patterns (Gabriel et al. 2002). Moreover, in some instances, ethnic background correlates with environmental exposures (e.g., diet, income, and lifestyle) and this can lead to genotype-by-environment interactions. All these differences between ethnic groups can induce heterogeneity in the genetic architecture of traits (de los Campos and Sorensen 2014). Quantifying the extent of effect heterogeneity between ethnically diverse groups is relevant across disciplines and can shed light on whether results obtained in one group are expected to replicate in others. This is particularly important when we consider that the vast majority of GWAS have been conducted using data from Caucasians and that results reported from these studies do not always replicate in other populations, which may indicate differences in genetic architectures between ethnic groups (Greene et al. 2009; Kraft et al. 2009; Ng et al. 2014).
Several studies have demonstrated (or alluded to) effect heterogeneity between ethnic groups (Ntzani et al. 2012; de Candia et al. 2013; Li and Keating 2014; Brown et al. 2016). Most of these studies measured effect heterogeneity by estimating the average correlation of marker effects between two or more ethnically diverse groups.
One may attempt to estimate effect correlations by quantifying the average correlation of estimated effects from GWAS conducted in different ethnic groups. However, estimation errors make the simple correlation of estimates of effects a seriously biased (toward zero) estimate of the correlation of (true) effects (see Supplemental Material, Appendix C). To overcome this problem, several studies have used multivariate Gaussian random regression models. Such methods have been considered in both animal and plant breeding (Wei and van der Werf 1994; García-Cortés and Toro 2006; Karoui et al. 2012; Olson et al. 2012; Christensen et al. 2014; Lehermeier et al. 2015) as well as in human genetics (e.g., Lee et al. 2012; de Candia et al. 2013). Another approach estimates the correlation of effects using an extension of the LD score regression (Brown et al. 2016).
The methods described above provide whole-genome summaries such as SNP heritability and average correlation of effects. However, they do not shed light on how effect heterogeneity may vary across regions of the genome or between SNP sets. Moreover, the random regression methods commonly used to estimate effect correlations assume that SNP effects follow Gaussian distributions. This assumption does not contemplate the possibility that some SNPs may have no effect in one or more than one group. To overcome this limitation, we consider modeling effect heterogeneity using a Bayesian random effect interaction model that decomposes SNP effects into main and interaction components. Unlike previously used methods, the proposed approach can be applied with both shrinkage and variable selection priors (e.g., Ishwaran and Rao 2005; Park and Casella 2008), and offers both whole-genome and SNP-specific measures of effect heterogeneity.
Using simulations, we show that the proposed method yields nearly unbiased estimates when sample size is not too small relative to the number of markers used. Subsequently, we applied the proposed methodology to data from the ARIC (multi-ethnic Atherosclerosis Risk in Communities) study to quantify effect heterogeneity between European and African ancestries [hereinafter referred to as European-Americans (EAs) and African-Americans (AAs), respectively]. These subpopulations have important differences in allele frequencies, LD decay (Shifman 2003), and cultural and socioeconomic factors that are linked to environmental exposures.
Our results show that for the four traits there is a varying extent of effect heterogeneity (the correlation of effects was highest for height and lower for lipid traits). Moreover, we show that for high-density lipoprotein (HDL), low-density lipoprotein (LDL), and serum urate there is a great deal of variability in effect heterogeneity across the genome.
Methods
Marker effects in groups 1 and 2 are defined by the sum of the main and group-specific terms, that is, and , respectively. Since the number of markers is usually large relative to sample size, we treat both main and interaction effects as random. Depending on the distribution assigned to SNP effects, the model can induce variable selection, shrinkage, or a combination of both (Ishwaran and Rao 2005; Gianola et al. 2009; de los Campos et al. 2013). To illustrate, we considered two priors for main and interaction effects: a Gaussian distribution and a prior with a point of mass at zero, and a Gaussian slab, also known as BayesC (Habier et al. 2011).
Hyper-parameters
In the Gaussian model, the hyper-parameters are the error variance and the three variances of effects, that is . In BayesC, the hyper-parameters also include the proportion of nonnull effects; therefore: . These parameters control the extent of shrinkage and variable selection, and how the architecture of effects may vary between groups. We treat these hyper-parameters as unknown and therefore assign prior distributions to them. For variance parameters, the conjugate prior is the scaled inverse χ2. However, this prior can have some influence on inference. Therefore, instead, we use a prior for variance parameters that is a transformation of the β distribution (see Appendix A in the Supplemental Material). For the proportion of nonzero effects we use independent identical β priors. This allows us to accommodate different effect distributions for different traits and sets of SNPs. Further details about this are provided in the Analyses of complex human traits section below.
The models described above can be used to estimate several parameters that are descriptive of the trait architecture. Whole-genome summaries of the trait architecture and of effect heterogeneity include the proportion of variance explained by SNPs [or genomic heritability, e.g., de los Campos et al. (2015a)] in each of the ethnic groups, the average correlation of effects, and the average proportions of nonzero effects (either main effects, interaction terms, or total effects). Samples from the posterior distribution can also be used to estimate SNP-specific parameters such as the posterior correlation of a SNP effect, .
Genomic variance and the average correlation of effects were estimated using the methods described by Lehermeier et al. (2017). Briefly, at each iteration of an MCMC algorithm, we used the samples of the main and interaction effects to form marker effects ( and where, s = 1,…,N is an index for the N MCMC samples collected) to obtain samples from the posterior distribution of the correlation of effects , here represents Pearson’s product moment correlation. Likewise, at each iteration of the sampler, genomic values can be obtained from and . Therefore, a sample for the posterior distribution of the genomic variances for each group was computed as and , where . Finally, samples from the posterior distribution of the proportion of variance of the trait explained by a SNP set were obtained using: and .
Data:
Our simulation and real data analyses were based on data from the ARIC study. ARIC is a prospective epidemiologic study sponsored by the National Heart, Lung, and Blood Institute conducted in four U.S. communities to study the causes of atherosclerosis and other cardiovascular risk factors, such as blood lipids, lipoprotein cholesterols, and apolipoproteins. It has a total sample size of 15,792 (9584 EAs and 3107 AAs) men and women aged 45–64. A total of 13,113 individuals were genotyped using an Affymetrix array with a total of 934,940 SNPs. Genotype and phenotype data from the ARIC study was acquired through the database for genotypes and phenotypes (dbGaP) (institutional review board (IRB) number 15–745; r050661 and study accession number phs000280.v1.p1).
Genotypes:
We retained SNPs that had minor allele frequencies > 1% in at least one of the two ethnic groups, had a higher than 95% calling rate, and were mapped to one of the 23 human chromosomes. After quality control, we retained 828,822 SNPs. Individuals with a missing rate > 5% in their genotypes were removed. Individuals were classified as EAs or AAs based on self-reported ethnicity (also confirmed from principal component analyses, Supplemental Material, Figure S1). We removed individuals that had within-group genomic relationships higher than 0.075; this ensured that we retained a high enough number of distantly related individuals. The final data sets comprised only distantly related individuals including 6627 EAs and 1601 AAs.
Simulations:
We simulated phenotypes using genotype data from the ARIC study from 6627 EAs and 1601 AAs. Phenotypes were simulated under an additive genetic model with a heritability of 0.5 for both groups. We further considered scenarios with the number of markers varying from 100 to 10,000 and the true correlations of effects between groups varying from 0.2 to 0.8. In a first simulation setting, we assumed that all the markers had effects on both groups. In a second setting, we assumed that 50% of the loci had effects on both groups, 20% had effects on EAs but not on AAs, 20% had effects on AAs but not on EAs, and 10% had no effects on either group (noncausal variants). These simulations were conducted for 200 Monte Carlo replicates per setting. Finally, we considered an additional scenario where heritability was lower in both groups (0.2) or lower in one of the groups (0.2 in EA and 0.5 in AA, and vice versa). Further details of the simulation are given in Appendix B in the Supplemental Material.
Analyses of complex human traits:
We considered four complex phenotypes: height (cm), HDL (mmol/liter) and LDL (mmol/liter) cholesterol, and serum urate (mg/dl). Individuals with height < 147 cm, LDL > 10 mmol/liter, and serum urate > 15 mg/dl were removed. We did not identify clear outliers for HDL. Transformation of the traits was not considered necessary (Figure S2). Phenotypes were precorrected for ethnicity, age, sex, and the first five marker-derived principal components.
Models were fitted to subsets of SNPs selected based on single-marker regression (GWAS) P-values derived from independent data that did not include ARIC. For height, GWAS P-values were derived from the full release of the UK Biobank. For HDL and LDL, P-values were from the Global Lipids Genetics Consortium (GLGC) computed after excluding data from ARIC. Finally, for serum urate, P-values were from the Global Urate Genetics Consortium (GUGC), also derived without using data from ARIC. The simple ranking of markers based on association P-values would lead to sets of highly redundant markers, i.e., markers in high LD (see Figure S3). To avoid this, we designed a windows-based selection algorithm where a window was defined as a set of consecutive SNPs that exceeded a given −log10(P-value) cutoff (this was done on a per-trait basis). Windows were made on a per-trait basis at −log10(P-value) cutoffs of 2, 2.3, 2.6, 3, 5, and 8 (Table S1). SNPs that cleared a given −log10(P-value) cutoff were termed “significant” at that cutoff (see Figure S4).
We fitted the interaction model to each of the four traits and each of the SNP sets described above. For sensitivity analyses, we also fitted the same models to randomly chosen sets of SNPs (of sizes 500, 1000, 2500, 5000, and 10,000 SNPs, respectively). Finally, for further sensitivity testing, we repeated the analysis with the EA ethnic group label randomly permuted.
Software:
Models were fitted using a modified version of the Bayesian Generalized Linear Regression (BGLR) (Pérez and de los Campos 2014) R package (available at: https://github.com/gdlc/BGLR-R and at https://cran.r-project.org/web/packages/BGLR/index.html) that implements a weakly informative prior for variance parameters based on a transformation of the β distribution (de los Campos et al. 2009) described above. We ran the MCMC algorithm for 45,000 iterations; the first 15,000 iterations were discarded as burn-in and the remaining samples were thinned at a thinning interval of 5. BGLR assigns a β prior to the proportion of nonzero effects; we choose the shape parameters of the β prior to be equal to 1, which gives a uniform prior in the 0–1 interval. For variance parameters, we devised a prior that is a modified version of the β prior (see Appendix A in the Supplemental Material) and used shape parameters equal to 1.01 to obtain an almost uniform prior for variance parameters within the interval [0,K] where K was twice the variance of the phenotype.
Data availability
File S1 contains supplemental figures, tables, and appendices. The IRB number for ARIC data set is 15–745; r050661 and the study accession number for the ARIC data set is: phs000280.v1.p1. Supplemental material available at Figshare: https://doi.org/10.25386/genetics.7754549.
Results
Simulations
In both simulation settings, the proportion of variance explained by a SNP set was estimated with almost no bias using both Gaussian and BayesC priors (see Figure 1 and Figure S5 for the first and second simulation scenarios, respectively). The SEs were higher for AAs compared with those for EAs, which was expected given that the sample size was smaller for AAs. As one would expect, the SE also increased with the number-of-loci/sample-size ratio. Using the BayesC prior, the estimates of proportion of variance explained by a SNP set were mildly biased across all values of true effect correlation when the number of QTL was > 10,000. There was a mild to moderate bias in the group with smaller sample size when the true proportion of variance explained in this group went from high (0.8) to low (0.2) (see Figure 2 and Table S2).
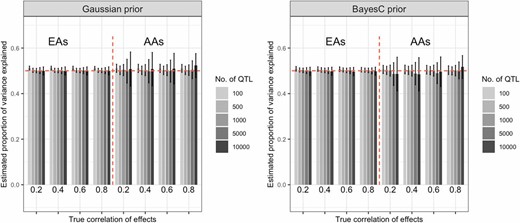
Average estimates of proportion of variance explained by a SNP set obtained in the first simulation scenario, by prior and number of SNPs used. The simulated heritability was 0.5, bars represent the average estimates over 200 Monte Carlo replicates, and the vertical lines give ± SE. Results for the second simulation scenario are presented in Figure S5. AAs, African-Americans; EAs, European-Americans.
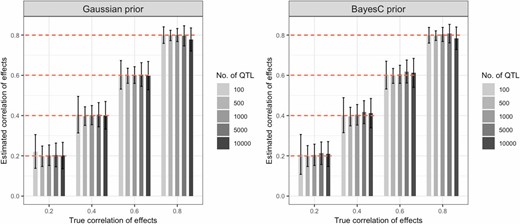
Average estimates of the correlation of effects in the first simulation scenario by prior and number of SNPs used. The simulated heritability was 0.5; bars represent the average estimates over 200 Monte Carlo replicates and the vertical lines give ± SE. Results for the second simulation scenario are presented in Figure S6. AAs, African-Americans; EAs, European-Americans; HDL, high-density lipoprotein; LDL, low-density lipoprotein.
Estimates of effect correlations were also nearly unbiased (see Figure 2 and Figure S6), especially when the true proportion of variance explained was high in groups with smaller sample sizes. However, the SEs were very large, particularly when the correlations were low. In scenarios involving < 100 or > 5000 QTL, we observed small biases (Figure 2 and Figure S6). The average SE of the estimated correlation was high with the smallest (100) and the largest (10,000) numbers of QTL, and lower for scenarios in between. With low simulated trait heritability (0.2) and small group sample size (AAs), we observed an upward (downward) bias when the simulated correlation was low (high) (see Table S3).
Analyses of complex human traits
Since our simulations revealed that an ratio of at least 1/3 results in nearly unbiased estimates of proportion of variance explained by a SNP set, we fitted our model to subsets of markers instead of using whole-genome data (see Methods for a description of how these subsets were obtained). Figure 3 shows the estimated proportion of variance explained by a SNP set obtained using the BayesC prior, by trait, ethnicity, and the set of SNPs used (the results obtained with the Gaussian prior are displayed in Figure S7). As expected, the estimated proportion of variance explained by a SNP set increased with the number of SNPs used. Interestingly, this parameter was systematically higher in EAs than in AAs for height and HDL, and the order was reversed in other traits (LDL and serum urate). However, the credibility intervals between both ethnic groups overlapped for all traits except height. The estimated proportion of variance explained by a SNP set obtained with the Gaussian prior were similar to the ones found with the BayesC prior (see Figure S7) for all traits except serum urate, which yielded larger estimates for AAs than those obtained using the BayesC prior.
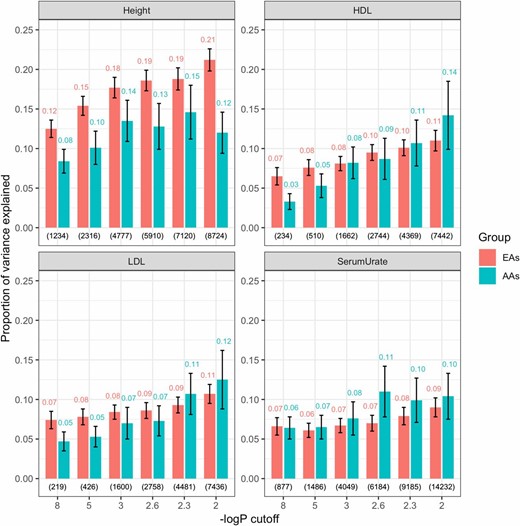
Proportion of variance explained by subsets of SNPs obtained with the BayesC-interaction model, by trait, ethnicity, and SNP set. Estimated (median) proportion of variance explained by a SNP set (y-axis) is plotted by trait, ethnicity, and log10(P-value) cutoff used to choose markers from GWAS consortia (excluding ARIC data). Numerals above the bars indicate the proportion of variance explained by either ethnic group and the corresponding number of SNPs used for model fitting (in parentheses at the bottom). Vertical lines give estimates of ± posterior SD. ARIC, multi-ethnic Atherosclerosis Risk in Communities; GWAS, genome-wide association study.
The estimated average correlation of effects (Figure 4) ranged from 0.711 [for height with the SNP set obtained with −log10(P-value) cutoff of 8] to 0.500 [for HDL with the SNP set obtained with a −log10(P-value) cutoff of 2.3]. Overall the correlation of effects was highest for height and serum urate, and lowest for LDL and HDL. In all traits except HDL, the correlation of effects tended to decrease as more SNPs were added in the model; however, the confidence regions for the different SNP sets overlapped. The estimated correlation of effects with the Gaussian prior for marker effects was similar to those obtained using the BayesC prior, with subtle differences between the two priors for height, HDL, and LDL (Figure S8).
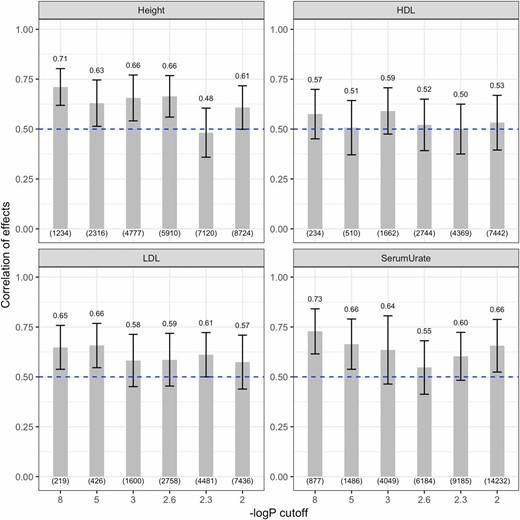
Estimated correlation of effects between AAs and EAs obtained with the BayesC-interaction model, by trait and SNP set. Estimated correlation of effects between AAs and EAs (y-axis) is plotted by trait using markers selected from GWAS consortia (excluding ARIC). In each plot, the numerals above the bars indicate the median correlation of effects and the number of SNPs used for model fitting (in parentheses at the bottom). Vertical lines give estimates of ± posterior SD. AAs, African-Americans; ARIC, multi-ethnic Atherosclerosis Risk in Communities; EAs, European-Americans; GWAS, genome-wide association study; HDL, high-density lipoprotein; LDL, low-density lipoprotein.
Figure 5 shows the estimated proportion of nonzero SNP effects obtained with the BayesC prior, by trait, ethnic group, and SNP set. For both groups, the proportions of nonzero effects were high at large −log10(P-value) cutoffs and decreased as the number of markers included in the model increased. For height, the proportions of nonzero effects were similar between EAs and AAs. However, for LDL (and serum urate to a lesser extent), the decrease in the proportion of nonzero effects was stronger in EAs. Figure S9 displays the proportion of nonzero main and interaction effects. The proportion of nonzero main effects decreased as the number of SNPs increased and the proportion of nonzero interaction effects tended to remain constant (except for the LDL interactions for EAs). Interestingly, the proportion of nonzero effects dropped very fast with the number of SNPs for HDL, LDL, and serum urate, but not for height.
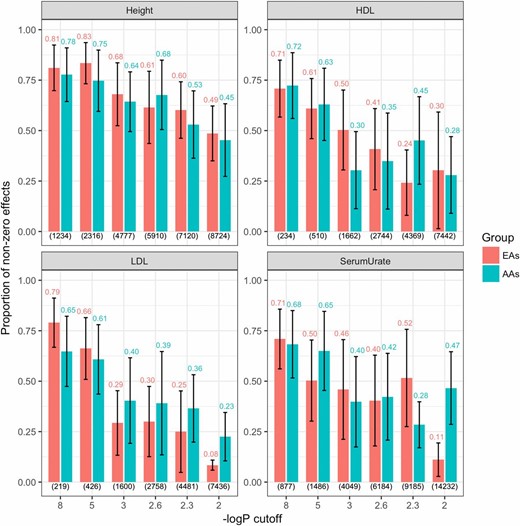
Estimated proportion of nonzero effects between AAs and EAs obtained with the BayesC-interaction model, by trait and SNP set. Estimated proportion of nonzero effects between AAs and EAs (y-axis) is plotted by trait using markers selected from GWAS consortia (excluding ARIC) at six different −log10(P-value) cutoffs. In each plot, the numerals above the bars indicate the proportion of nonzero effects obtained using either ethnic group and the corresponding number of SNPs used for model fitting (in parentheses at the bottom). Vertical lines give estimates of ± posterior SD. AAs, African-Americans; ARIC, multi-ethnic Atherosclerosis Risk in Communities; EAs, European-Americans; GWAS, genome-wide association study; HDL, high-density lipoprotein; LDL, low-density lipoprotein.
Figures 3-5 correspond to overall summaries (proportion of variance explained by a SNP set, average correlation of effects, and proportion of nonzero effects). However, the models used also render SNP-specific summaries. Figure 6 shows the posterior mean of the correlation of effects between ethnic groups for individual SNPs by trait for the SNP set obtained using a −log10(P-value) cutoff of 2. We had no SNP with a negative posterior correlation of effect. For height, the posterior correlation of individual SNP effects ranged from 0.4 to 0.8. However, for HDL, LDL, and serum urate, there was more variability among SNPs, with several SNPs having posterior correlation of effects > 0.8 and many with posterior correlation of effects smaller than 0.4.
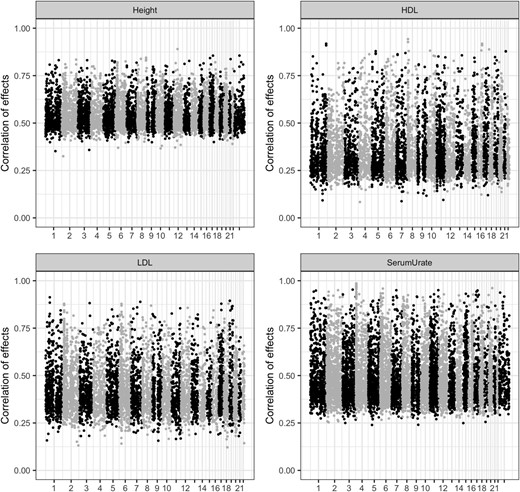
Posterior correlations of individual SNP effect between AAs and EAs, by trait for SNPs that clear a −log10(P-value) of 2. Plots are categorized by trait and, in each plot, the estimated effect correlation of individual SNP effects (y-axis) is plotted against chromosome number (x-axis). AAs, African-Americans; EAs, European-Americans; HDL, high-density lipoprotein; LDL, low-density lipoprotein.
Figures S10 and S11 correspond to the proportion of variance explained, and average correlation of effects, between EAs and AAs from randomly chosen sets of markers. The estimates of both the proportion of variance explained by a SNP set (for EAs and AAs) as well as effect correlations are far lower than those obtained using GWAS-selected markers (Figure 3 and Figure S7).
Figures S12 and S13 correspond to the estimates of proportion of variance explained and the average correlation of effects from GWAS-selected markers by randomly dividing the EAs into two groups, such that the sample size of one of two groups is same as that of the AA data set. As expected, the estimates of the proportion of variance explained are similar within EAs, and the estimates of effect correlation are much higher within EAs than between EAs and AAs across all traits (in particular, the effect correlation estimates are > 0.90 for height across all SNP sets).
Discussion
GWAS have been conducted predominantly in Caucasian populations (Haga 2010; Rosenberg et al. 2010). Although more recent works have recognized the inclusion of diverse ethnic groups, especially AAs (e.g., Taylor et al. 2016; Brant et al. 2017; Park et al. 2017), the total number of GWAS studies for AAs is still fairly low compared with populations of European ancestry (Peprah et al. 2015) and replication of signals in AA populations is much less common (Marigorta and Navarro 2013). Moreover, the associations reported to be strong in Caucasians have been weaker (or even nonsignificant) in other ethnic groups (Gudbjartsson et al. 2007; Omori et al. 2008; Yamada et al. 2009; Barnholtz-Sloan et al. 2011; Tsai et al. 2014; Prasad et al. 2017) and some studies have reported effects with opposite sign in different populations (Lewis et al. 2008; Yamada et al. 2009). More recent studies have also confirmed the presence of genetic heterogeneity between ethnic groups for various traits (Brown et al. 2016; de Vlaming et al. 2017; Zhou et al. 2018). While some of these differences could be attributed to small sample size [some well-powered studies have shown strong overlaps in GWAS-significant variants between Europeans and other ethnic groups (Franceschini et al. 2013; Okada et al. 2014)], there is substantial evidence supporting effect heterogeneity. Understanding the reasons that underlie these differences and quantifying the degree of similarity in the architecture of a trait across populations represents an important research goal.
In humans, Shi et al. (2017) estimated local correlations between traits using individual-level data while Brown et al. (2016) considered quantifying the average correlation of effects between populations using summary-based association statistics. Their approach extended LD score regression (Bulik-Sullivan et al. 2015) to multiple ethnic groups and has the advantage that it can be used with summary statistics. However, some authors have questioned the assumptions of the LD score regression method (Speed and Balding 2018) and accurate estimation requires using several thousands of SNPs. Thus, the method is not well-suited for studying effect similarity within genomic regions, something that the method proposed here can achieve without requiring access to good-quality external reference panels or being restricted to an infinitesimal model assumption.
In this study, we proposed to study ethnic differences in the architecture of traits using a random effect Bayesian interaction model. The proposed approach can be used to estimate whole-genome summaries such as (a) the proportion of variance explained by SNPs, (b) the average effect correlation, and (c) the proportion of nonzero effects, as well as finer features of the trait architecture (e.g., SNP-specific correlation of effects). Similar approaches have been considered in animal and plant breeding (e.g., Wei and van der Werf 1994; García-Cortés and Toro 2006; Christensen et al. 2014; Lehermeier et al. 2015) and in human genetics (e.g., Lee et al. 2012; de Candia et al. 2013) for the analysis of data from heterogeneous populations. However, previous studies were based on Gaussian assumptions and only offered whole-genome summaries of the trait architecture. The approach presented in this study is more flexible in that it can be used with both shrinkage and variable selection priors (Ishwaran and Rao 2005; Park and Casella 2008), and can be used to infer not only whole-genome features but also regional and SNP-specific features of the trait architecture.
We evaluated the proposed methodology under two different priors (Gaussian and BayesC) using simulations, and applied it to real human data to study the genetic architecture of four traits (height, HDL, LDL, and serum urate) in EAs and AAs. Our simulation study (based on real EA and AA genotypes from ARIC) revealed that both Gaussian and BayesC priors yield nearly unbiased estimates of proportion of variance explained by a SNP set and of effect correlations. We observed mild-to-moderate upward (downward) bias in low- (high-) effect correlations when the proportion of variance explained was low (0.2), the sample size was small (< 2000), and the number of considered SNPs was large relative to sample size. Given the small sample size available for our real data analyses and considering our simulation results, we applied the proposed methodology to subsets of SNPs preselected using GWAS results obtained from other (independent) data sets.
From our real data analyses, we observed similar proportions of variance explained with both BayesC and Gaussian priors for marker effects (Figure 3 and Figure S7). The Gaussian prior is a special case of the BayesC prior, thus BayesC is more flexible. Whether these two methods will render different estimates would critically depend on the trait architecture.
With the exception of height, the average proportions of variance explained across all marker sets were similar between EAs and AAs. For height, the average proportion of variance explained was greater among EAs than among AAs. This is likely due to the fact that the SNPs used for the analysis of height were selected using GWAS results entirely based on data from Caucasians (UK Biobank); the same trend was not observed for other traits, perhaps because there was some mixture in ethnicity in the other GWAS consortia from which markers were chosen (GLGC and GUGC). When we fitted similar models using randomly chosen markers (Figure S10), we observed that the proportion of variance explained by randomly selected markers was smaller than that explained by regression on markers selected from GWAS results for both EAs and AAs. This showed that, indeed, selection based on GWAS results leads to more informative markers in both populations.
Our analyses also revealed important differences in the correlation of effects between traits. The estimated correlation of effects ranged from 0.482 to 0.728, indicating the presence of genetic heterogeneity across all four traits, even for strongly associated markers (Figure 4). For height, the correlation of effects was highest when using SNPs that had the smallest GWAS P-value (likely SNPs with relatively large effects and not very extreme allele frequencies), suggesting that the correlation of effects may be lower for SNPs with small effects and extreme allele frequencies. Another possible explanation for effect heterogeneity could also be the tagging differences between EAs and AAs, especially in the polygenic tail for a given trait.
Height had higher correlation of effects between EAs and AAs than serum urate and lipid traits, suggesting that height may have a more similar genetic architecture between EAs and AAs than the other traits (especially than the lipid traits). Furthermore, we found differences in the estimated proportion of nonzero effects between EAs and AAs for HDL, LDL, and serum urate, but not for height, reinforcing that the genetic architecture of height may be more similar between EAs and AAs in comparison to the other three traits (Figure 5 and Figure S9).
The proportion of nonzero effects markedly decreased with the −log10(P-value); this is expected since relaxing the threshold used to preselect SNPs is likely to lead to the inclusion of SNPs with no effect. This was particularly clear for lipid traits. This trend is largely driven by the proportion of nonzero main effects for both ethnic groups (i.e., effects common to both ethnic groups; Figure S9). Finally, we also observed greater variability in posterior correlation of effects among lipid traits and serum urate in comparison with height (Figure 6).
If ethnicity correlates with lifestyle, diet, income and other environmental factors, then, genetic-by-environmental interactions may lead to effect heterogeneity between ethnically diverse groups. Interestingly, the three traits that are more affected by diet and lifestyle (LDL, HDL, and serum urate) showed stronger evidence of effect heterogeneity than height. Likewise, unaccounted epistasis, coupled with differences in allele frequencies, may also lead to effect heterogeneity in additive models. Indeed, some authors (Mackay and Moore 2014) have argued that the epistasis may be responsible for the majority of the small-effect additive effect affecting complex traits, and previous studies have attributed the nonreplication of genetic associations in different populations to epistasis (Greene et al. 2009). Thus, epistatic gene action can also have a role in explaining differences in the allelic substitution effects of SNPs and can consequently induce effect heterogeneity.
In conclusion, we have proposed a versatile methodology based on random effect interactions that can apply non-Gaussian priors to marker effects for quantifying the extent of effect heterogeneity between ethnically diverse groups using a combination of variable selection and shrinkage. This proposed approach can yield estimates of proportions of variance explained by a SNP set, average correlation of effects, and the proportion of nonzero effects, as well as SNP-specific attributes in genomic regions of interest. According to our simulations, the methodology renders nearly unbiased estimates provided that the n/p ratio is not much smaller than 1/3. Of the traits considered in our study, effect heterogeneity was lower for height than for traits influenced by lifestyle. We postulate that differences in allele frequency and in LD patterns, together with epistasis and G×E, can contribute to effect heterogeneity between AAs and EAs.
Acknowledgments
The authors acknowledge valuable comments provided by Sadeep Shrestha, Trudy Mackay, Edward Buckler, Marguerite Irvin, and Nianjun Liu; Cristen Willer and Sebanti Sengupta for providing summary statistics for high-density lipoprotein and low-density lipoprotein from the Global Lipids Genetics Consortium after excluding the ARIC (multi-ethnic Atherosclerosis Risk in Communities) cohort; and Christian Gieger and Jürgen Riegel for providing summary statistics for serum urate from the Global Urate Genetics Consortium after excluding the ARIC cohort. G.d.l.C. and Y.V. acknowledge financial support from the National Institutes of Health (grants GM R01-099992 and GM R01-101219).
Footnotes
Supplemental material available at Figshare: https://doi.org/10.25386/genetics.7754549.
Communicating editor: N. Wray
