Want to fix gun violence in America? Go local.

Seattle
Portland
Minneapolis
Boston
Milwaukee
Detroit
New York
Cleveland
Philadelphia
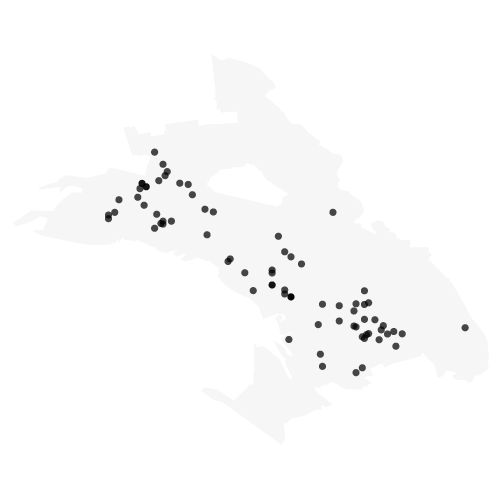
Chicago
Oakland
Salt Lake City
Baltimore
Indianapolis
San Francisco
Denver
Washington DC
St Louis
Las Vegas
Albuquerque
Los Angeles
Phoenix
Atlanta
Memphis
Dallas
New Orleans
Houston
Miami
The map of America’s gun violence epidemic can seem overwhelming. There were more than 13,000 gun homicides in the US in 2015, across nearly 3,500 cities and towns. But the toll of this gun violence was not distributed equally.
Half of America's gun homicides in 2015 were clustered in just 127 cities and towns, according to a new geographic analysis by the Guardian, even though they contain less than a quarter of the nation’s population.
In 2015, there were more than 13,000 gun homicides throughout the US …
New York
Chicago
Oakland
Baltimore
St Louis
New Orleans
… but half of those deaths were in just 127 cities, which contain almost a quarter of the population

New York
Chicago
Oakland
Baltimore
St Louis
New Orleans
Even within those cities, violence is further concentrated in the tiny neighborhood areas that saw two or more gun homicide incidents in a single year.
Four and a half million Americans live in areas of these cities with the highest numbers of gun homicide, which are marked by intense poverty, low levels of education, and racial segregation. Geographically, these neighborhood areas are small: a total of about 1,200 neighborhood census tracts, which, laid side by side, would fit into an area just 42 miles wide by 42 miles long.
The problem they face is devastating. Though these neighborhood areas contain just 1.5% of the country’s population, they saw 26% of America’s total gun homicides.
Gun control advocates say it is unacceptable that Americans overall are "25 times more likely to be murdered with a gun than people in other developed countries". People who live in these neighborhood areas face an average gun homicide rate about 400 times higher than the rate across those high-income countries.
Understanding this dramatic clustering of America’s of gun violence is crucial for the effort to save more lives.
“We can’t do much about crime prevention of homicide if we try to attack it as a broad, global problem, throwing money at it in a sort of broad, global way,” said David Weisburd, a leading researcher on the geographic distribution of crime at George Mason University.
America’s gun policy debate is usually driven by high-profile mass shootings that seem to strike at random, and it focuses on sweeping federal gun control or mental health policies. But much of America’s gun homicide problem happens in a relatively small number of predictable places, often driven by predictable groups of high-risk people, and its burden is anything but random.
The concentration of gun homicides in certain census tracts mirrors what criminologists have discovered when they look at crime patterns within individual cities: roughly 1.5% of street segments in cities see about 25% of crime incidents, a trend dubbed “the law of crime concentration”.
The Guardian’s new geographic analysis is the first time that gun homicides nationwide have been mapped down to the census tract level, researchers said. This new approach was made possible with the geocoded data collected since 2014 by the not-for-profit Gun Violence Archive, which tracks shootings and gun deaths using media reports. The FBI’s national crime data only provides gun murder statistics down to the city level, which masks the clustering of violence within neighborhoods.
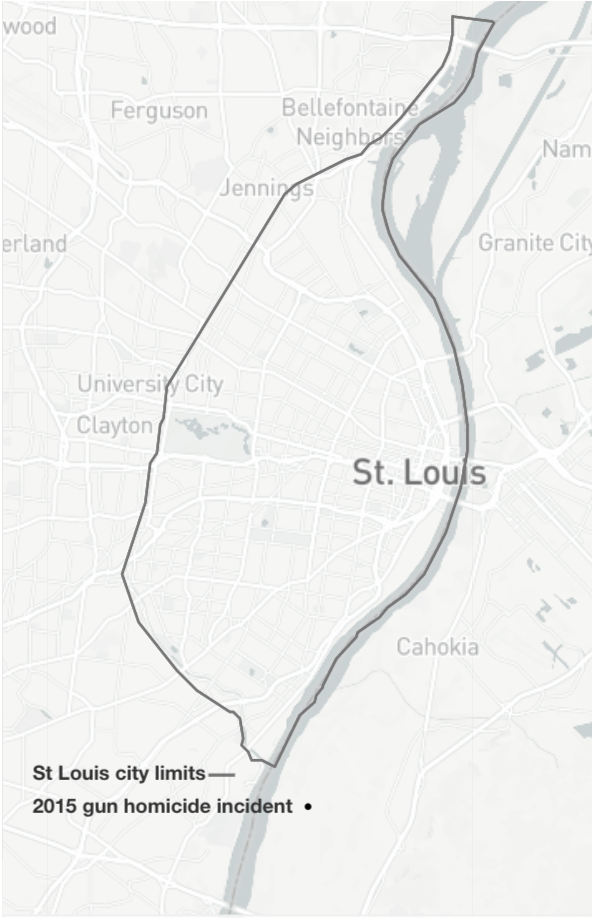
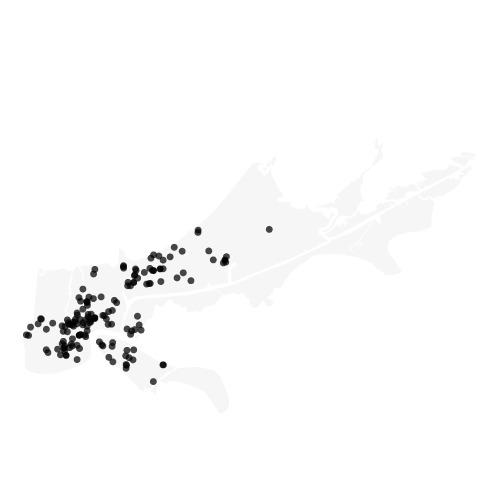
Case study: St Louis
Let's take a look at St Louis, which has the highest gun murder rate of any large city in the country.
continue scrolling
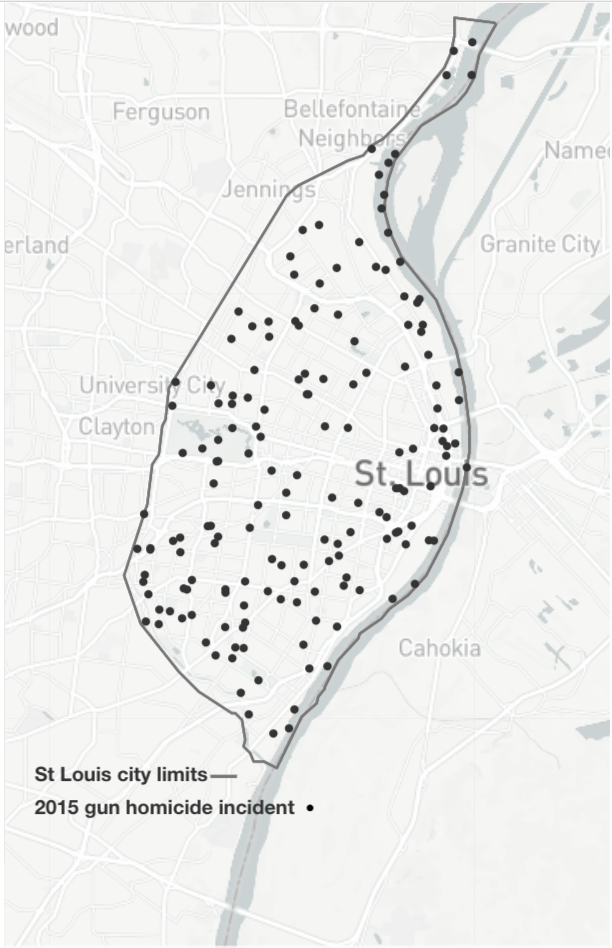
If every 2015 gun homicide in St Louis were distributed randomly, it would look something like this. But if you live in St Louis, you know that’s wrong.
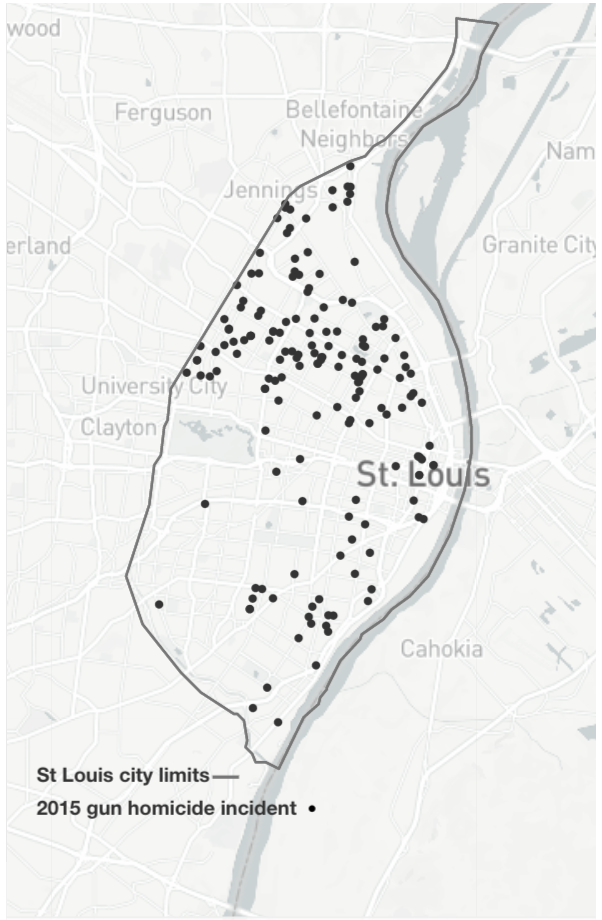
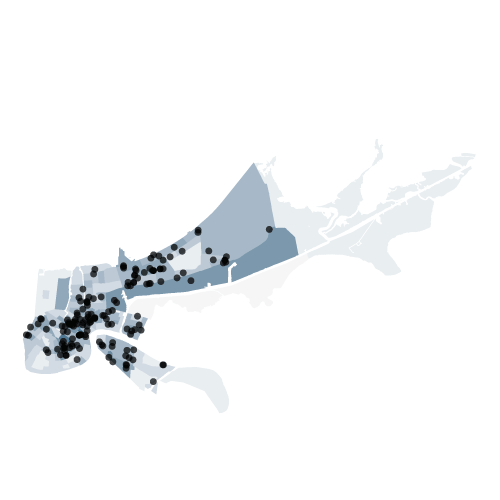
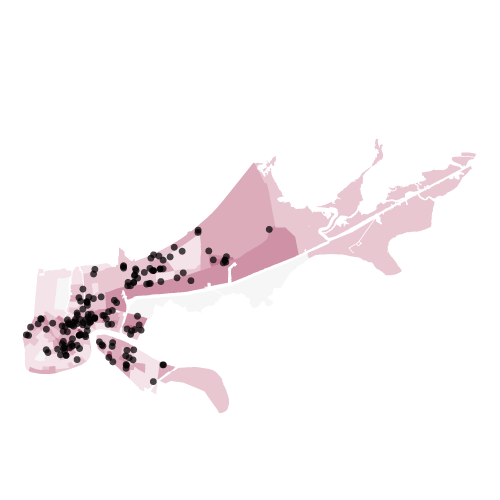
This is what the pattern of gun homicides in the city actually looks like.
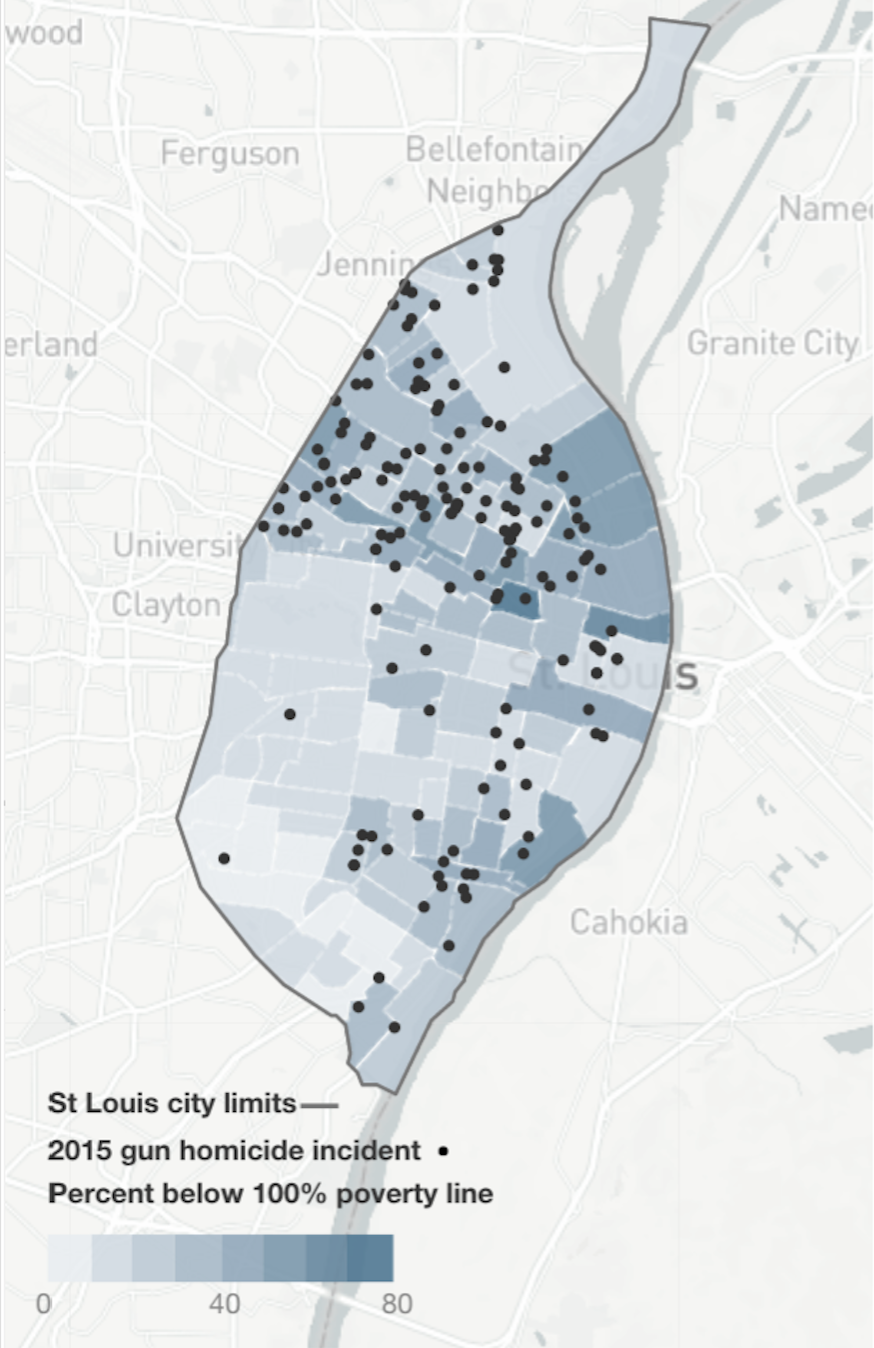
Homicides are concentrated in areas of high poverty.
And the lowest educational attainment.
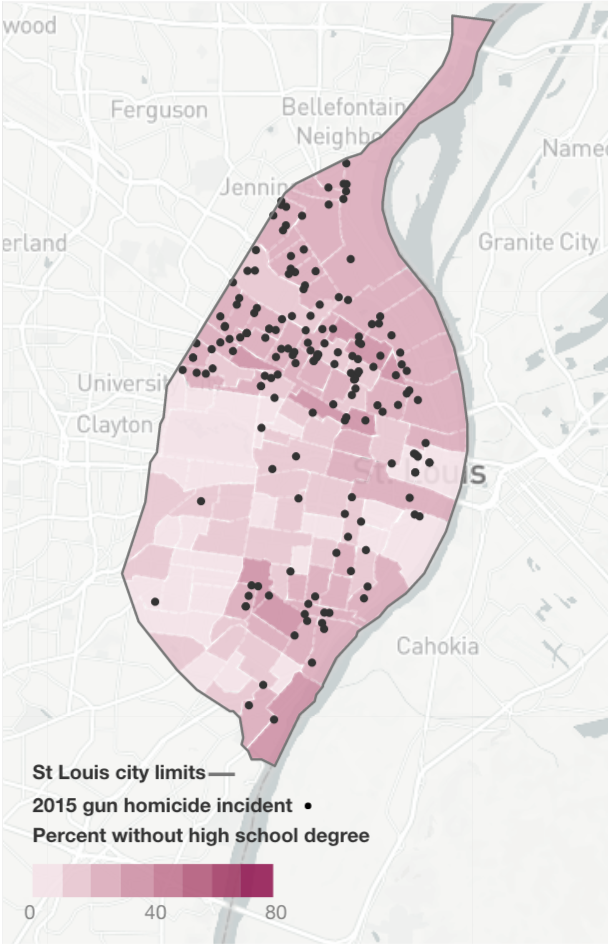
And the neighborhoods forged out of decades of racial segregation.

The clear dividing line you see between areas with many gun homicides and few gun homicides is Delmar Boulevard, which has developed over time into a rigid racial boundary that carves the city in two.
For the greater part of the 20th century, racial housing covenants, discriminatory lending practices and “white flight” imposed de facto segregation as pronounced as any ever achieved by Jim Crow on St Louis’ black residents. Even today, some residents treat Delmar Boulevard as a line they do not want to cross. In May, a group of parents canceled a kindergarten Little League game held in a park north of Delmar Boulevard, telling the opposing team that they were “uncomfortable with the location” of their home field, a decision a home team parent called “racist”.
Like income inequality, murder inequality in America is stark
Gun violence is a regressive tax that falls heaviest on neighborhoods already struggling with poverty, unemployment, and failing schools. The unequal burden of violence is also marked by intense racial disparities.
“It’s not about race, per se, it’s about how other conditions are racialized, are racially inequitable,” said Lauren Krivo, a Rutgers University sociologist who studies the geography of race and crime.
Most people don’t understand “how few predominantly white communities have conditions that are anywhere near the levels of disadvantage that are common in non-white communities, and particularly black communities,” she said.
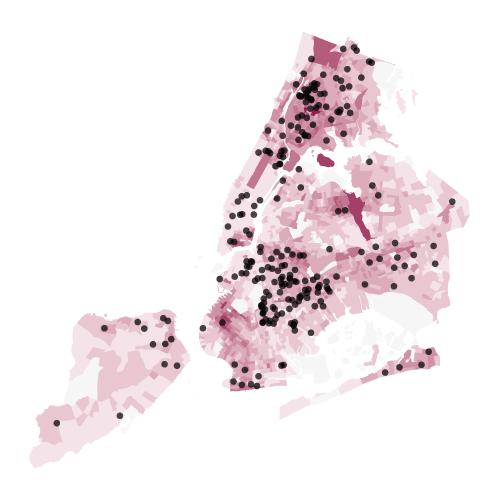
New York, New York
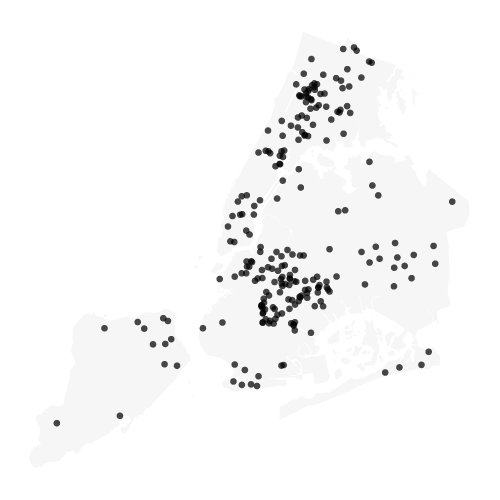
2015 gun homicide incident
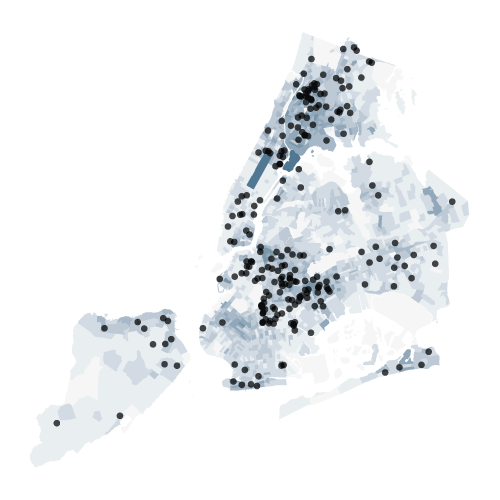
Percent below 100% poverty line
80
40
0
Percent without high school degree
80
40
0
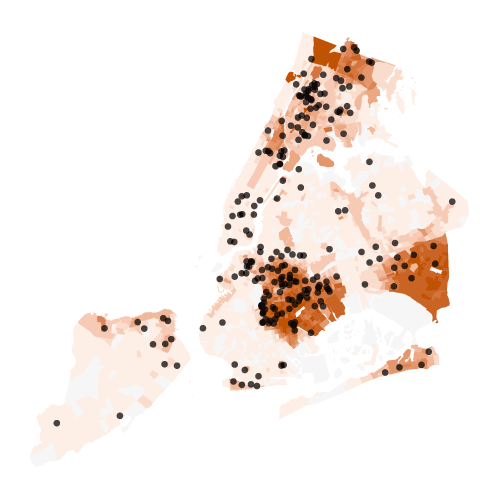
Percent black
100
50
0
In New York, a city of eight million people, only 1.5% of census tracts saw two or more gun homicide incidents in 2015. That’s a much lower percentage than St Louis, where a shocking 44% of census tracts saw multiple gun homicides in 2015.
Compared with St Louis, New York also has much broader swathes of the city that saw no gun homicides at all.
New York City’s murder rate of about four murders per 100,000 people is neatly in line with the national average.
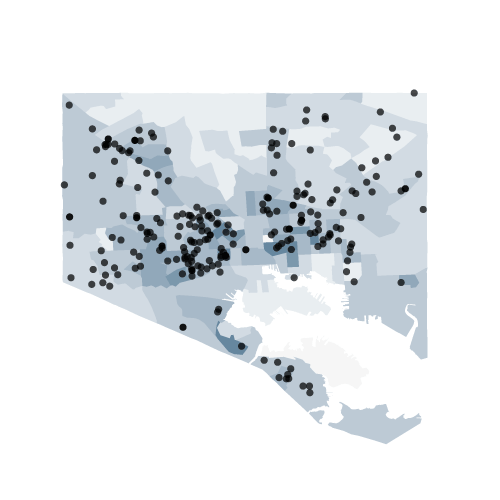
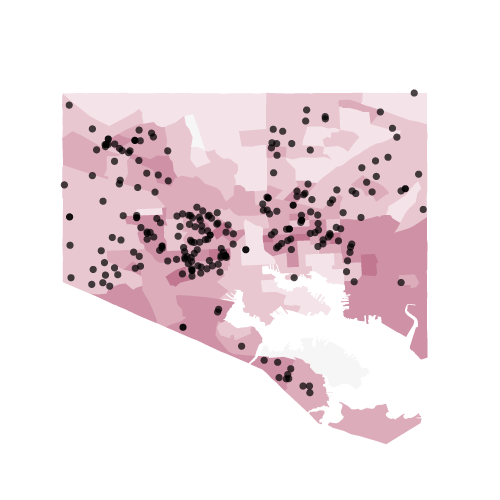
Baltimore, Maryland

2015 gun homicide incident
Percent below 100% poverty line
80
40
0
Percent without high school degree
80
40
0

Percent black
100
50
0
Gun homicides spiked in Baltimore in 2015, leaving the city with its highest-ever recorded murder rate. But the increased homicides remained concentrated, with largely white neighborhoods almost completely exempt from the rising violence. 92% of Baltimore’s gun murder victims in 2015 were black men, according to local police department statistics.
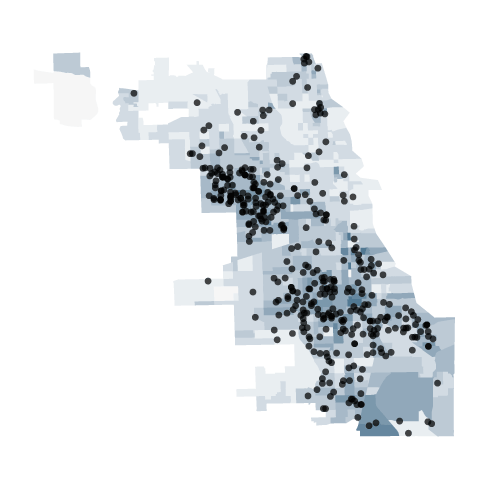
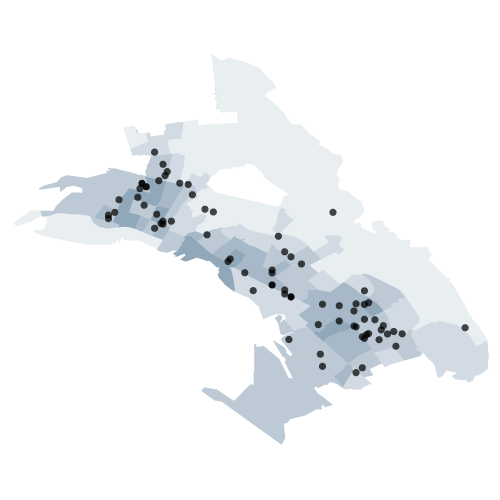
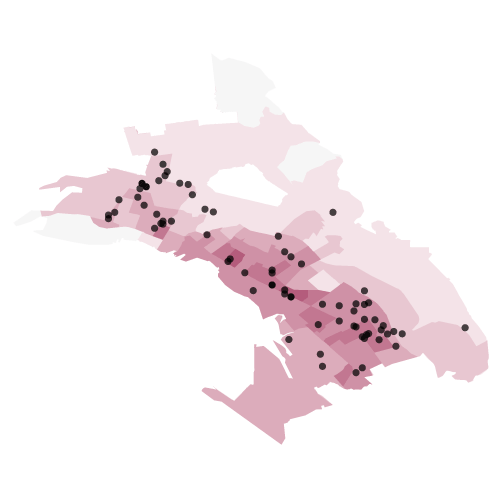
Chicago, Illinois

2015 gun homicide incident
Percent below 100% poverty line
80
40
0

Percent without high school degree
80
40
0

Percent black
100
50
0
In 2015, Chicago had the highest total number of gun homicides of any city in America. But the city's gun homicide rate per person was much lower than St Louis.
Just 13% of census tracts in Chicago saw multiple gun murders in 2015, and these tracts were responsible for 65% of the city’s gun homicides.
Oakland, California
2015 gun homicide incident
Percent below 100% poverty line
80
40
0
Percent without high school degree
80
40
0
Percent black
100
50
0
The most concentrated gun homicide areas in Oakland cluster far from the city center, in the long stretch of East Oakland known as the flatlands.
Though Chicago’s population is nearly seven times larger than Oakland’s, the two cities showed similar levels of gun homicide concentration. In both cities, nearly 70% of all census tracts saw no gun homicides, and the 13% of census tracts that saw multiple gun homicides were responsible for the majority of the city’s fatal gun violence.
New Orleans, Louisiana
2015 gun homicide incident
Percent below 100% poverty line
80
40
0
Percent without high school degree
80
40
0
Percent black
100
50
0
22% of New Orleans census tracts saw multiple gun homicides, and these areas were responsible for more than 75% of the murders. The concentration of violence in New Orleans is closest to the concentration in Baltimore.
Dramatic racial disparities in homicide have persisted for decades
Within most high-gun homicide cities, victims of gun murder are overwhelmingly black men. This dramatic disparity has persisted for decades, even as cities have seen sharp increases and decreases in murder rates, according to FBI gun murder data. These charts break down the numbers of gun murders since 1975 by race and gender for different cities.
Black men
White men
Black women
White women
Missing or unconfirmed data
St Louis, Missouri
New York, New York
Baltimore, Maryland
Chicago, Illinois
Oakland, California
New Orleans, Louisiana
Since 1993, the peak of the gun violence epidemic of the late 1980s and early 1990s, the nation’s overall gun homicide rate has fallen nearly 50%, according to national estimates from the Centers for Disease Control and Prevention (CDC). Overall, the country is much safer than in the 1990s, though polls show most Americans remain unaware of that trend. For African Americans, too, the overall gun homicide rate fell by about half between 1993 and 2010, according to national CDC estimates.
Examining gun murder trends across individual cities, and going back to 1975, shows a more complex picture. New York City has become radically safer for all residents since the early 1990s, and continues to see decreases in violence. In other cities, including St Louis and Baltimore, the number of black men murdered with guns in recent years is close to the early 1990s.
Not just neighborhoods but people
Looking at the risk of gun homicide in terms of sweeping racial demographics, or even in terms of individual neighborhood census tracts, still obscures the real concentration of violence, crime experts said – and that further concentration is crucial to understanding how to save lives.
Even within high-poverty areas that struggle with many kinds of disadvantage, the majority of residents have nothing to do with gun violence.
Within neighborhood areas, the risk of violence is further clustered within specific social networks of high-risk people. Sometimes these are people whom police identify as gang members; sometimes they are not.
In Chicago, analysts working with police department data found that, over a six-year period, 70% of nonfatal shootings and 46% of gun homicides happened within a sprawling social network that included just 6% of Chicago’s total population.
Similar analyses in Oakland and New Orleans found even smaller percentages of residents driving the majority of the violence. In Oakland, analysts found that networks of just 1,000 to 1,200 high-risk people, about .3% of Oakland’s population, were involved in about 60% of the city’s murders. In New Orleans, just 600 to 700 people, less than 1% of the city’s population, were involved in more than 50% of fatal incidents.
“In what we think of as the ‘most dangerous places’, very, very few people are actually at any meaningful risk for violent offending,” said David Kennedy, a researcher and advocate at the John Jay College of Criminal Justice who has worked on violence prevention strategies in cities nationwide. “Most of the folks in those places are in no way a part of the problem.”
Both liberals and conservatives argue that the root causes of gun violence are extremely broad social trends. For conservatives, it’s “about things like cultures of violence, toxic family dynamics in minority communities, the failure of governmental approaches”, Kennedy said. For liberals, it’s historic oppression, racism, lack of opportunity, and the broad availability of guns.
As a result, both liberals and conservatives argue that fixing violence requires interventions that are “very enormous and very often essentially out of reach”, Kennedy said. “We’re talking about making changes that, as a practical matter, we’re not very good at: changing, in a broad way, gender in society, changing, in a broad way, social patterns or racism or bias. Fixing the schools. That’s very difficult stuff.”
But neither partisan analysis really lined up with the data on America’s murder concentration, Kennedy said. If single parent families, or poverty, or easy gun availability were the main drivers of gun violence, “that should result in vastly more violence that there is”.
Instead, some researchers argue, the concentration of gun violence in America more closely resembles the spread of a contagious disease. Inequity and poverty are risk factors. But violence itself may spread from person to person like a virus, meaning that particular networks of people, not whole neighborhoods or demographic groups, are most at risk.
In different times and places, violence in America has spread like a wave through different ethnic and racial groups, said Dr Gary Slutkin, a Chicago epidemiologist who has championed a public health model for preventing violence. In the 1920s, violence was concentrated among Irish American and Italian American populations, he said. In recent decades, it’s been more concentrated among African Americans. “There is nothing innate,” he said. “All people and peoples are susceptible.”
The racial and geographic disparities in America’s gun homicide problem are clear. They are also often overstated, both by some political opponents of gun control and by white supremacists.
One false meme that spread online after Trayvon Martin’s death said: “The United States ranks 3rd in Murders throughout the World. But if you take out Chicago, Detroit, Washington DC and New Orleans, the United States is 4th from the Bottom for Murders. These 4 Cities also have the toughest Gun Control Laws in the United States. All 4 are also controlled by Democrats.”
These murder numbers are completely inaccurate – and so is the broader concept behind them.
While half of America’s gun homicides were clustered in 127 cities, the other half were spread across the country. In many of the roughly 3,300 other cities that saw a gun homicide in 2015, the violence was less intense. 58% of cities that saw a gun homicide in 2015 saw just a single one, and 95% of them saw fewer than ten.
The toll of these more scattered gun homicides adds up. Even excluding the 127 highest homicide cities, America’s gun homicide rate would still be many times higher than recent rates in Europe.
While violence in Chicago perpetually makes headlines, some of the census tracts with the greatest burden of violence are at the margins of cities that are not known for their gun homicide problem – islands of extreme deprivation in otherwise wealthy, placid towns.
Donald Trump has spent months decrying the historic spike in gun violence in Chicago, most recently suggesting on Twitter that if Chicago’s “Mayor can't do it he must ask for Federal help!”
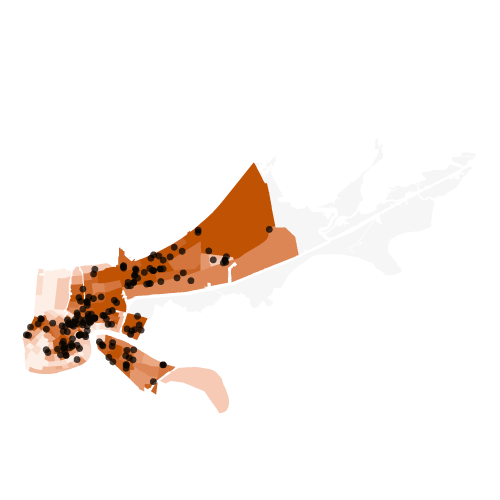
Seventeen minutes from Mar-a-Lago, Trump’s flagship Palm Beach hotel, is a neighborhood with one of the highest gun homicide rates in the country.
Kiki Paulk lives just miles from where Trump and his transition team vacationed this holiday. About every third night, the 31-year-old West Palm Beach resident said, she has to get her children down on the floor to protect them from the gunfire.
The Tamarind Avenue area’s gun murder rate in 2015 was double or triple that of some of the most violent areas in Chicago.
Asked who was working to stop the violence in her neighborhood, Paulk said, “No – no – no – there’s nobody.”
Sources: Gun Violence Archive 2015, excluding accidental gun deaths and suicides, but including justifiable homicides, by law enforcement and others; FBI Supplementary Homicide Reports 1975 - 2015; FBI Uniform Crime Report 2015; 5-Year American Community Survey 2014-2010; US Census: Cartographic Boundary Shapefiles - Census Tracts; CDC’s National Center for Injury Prevention and Control Web-based Injury Statistics Query and Reporting System (WISQARS); Gunpolicy.org. In maps, "Percent without high school degree" refers to percent of residents age 25 or older without a high school degree.